Immigrants from El Salvador 1 or more Vehicles in Household
COMPARE
Immigrants from El Salvador
Select to Compare
1 or more Vehicles in Household
Immigrants from El Salvador 1 or more Vehicles in Household
89.6%
1+ VEHICLES AVAILABLE
44.1/ 100
METRIC RATING
178th/ 347
METRIC RANK
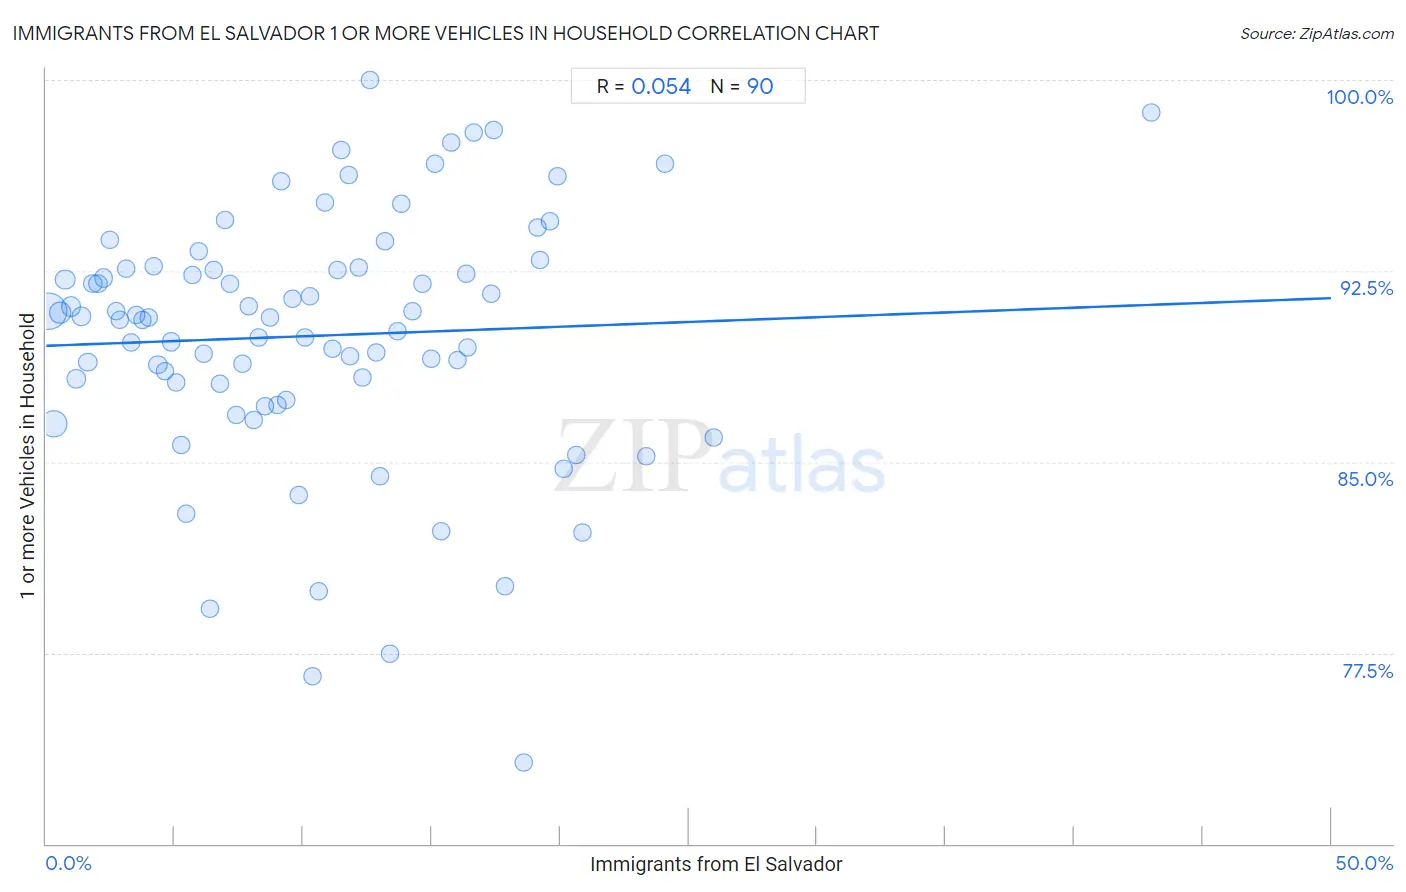
Immigrants from El Salvador 1 or more Vehicles in Household Correlation Chart
The statistical analysis conducted on geographies consisting of 357,719,438 people shows a slight positive correlation between the proportion of Immigrants from El Salvador and percentage of households with 1 or more vehicles available in the United States with a correlation coefficient (R) of 0.054 and weighted average of 89.6%. On average, for every 1% (one percent) increase in Immigrants from El Salvador within a typical geography, there is an increase of 0.037% in percentage of households with 1 or more vehicles available.
It is essential to understand that the correlation between the percentage of Immigrants from El Salvador and percentage of households with 1 or more vehicles available does not imply a direct cause-and-effect relationship. It remains uncertain whether the presence of Immigrants from El Salvador influences an upward or downward trend in the level of percentage of households with 1 or more vehicles available within an area, or if Immigrants from El Salvador simply ended up residing in those areas with higher or lower levels of percentage of households with 1 or more vehicles available due to other factors.
Demographics Similar to Immigrants from El Salvador by 1 or more Vehicles in Household
In terms of 1 or more vehicles in household, the demographic groups most similar to Immigrants from El Salvador are German Russian (89.6%, a difference of 0.0%), Arab (89.6%, a difference of 0.010%), Hmong (89.6%, a difference of 0.030%), Immigrants from Ethiopia (89.6%, a difference of 0.030%), and Ukrainian (89.6%, a difference of 0.030%).
| Demographics | Rating | Rank | 1 or more Vehicles in Household |
| French American Indians | 54.4 /100 | #171 | Average 89.8% |
| Indonesians | 53.0 /100 | #172 | Average 89.7% |
| Lumbee | 52.8 /100 | #173 | Average 89.7% |
| Filipinos | 50.0 /100 | #174 | Average 89.7% |
| Immigrants from Burma/Myanmar | 47.6 /100 | #175 | Average 89.7% |
| Immigrants from Sudan | 47.1 /100 | #176 | Average 89.7% |
| Hmong | 45.8 /100 | #177 | Average 89.6% |
| Immigrants from El Salvador | 44.1 /100 | #178 | Average 89.6% |
| German Russians | 44.0 /100 | #179 | Average 89.6% |
| Arabs | 43.3 /100 | #180 | Average 89.6% |
| Immigrants from Ethiopia | 42.5 /100 | #181 | Average 89.6% |
| Ukrainians | 42.4 /100 | #182 | Average 89.6% |
| Ethiopians | 41.2 /100 | #183 | Average 89.6% |
| Immigrants from Bulgaria | 40.7 /100 | #184 | Average 89.6% |
| Immigrants from Brazil | 40.1 /100 | #185 | Average 89.6% |
Immigrants from El Salvador 1 or more Vehicles in Household Correlation Summary
| Measurement | Immigrants from El Salvador Data | 1 or more Vehicles in Household Data |
| Minimum | 0.094% | 73.2% |
| Maximum | 43.0% | 100.0% |
| Range | 42.9% | 26.8% |
| Mean | 10.4% | 90.0% |
| Median | 9.7% | 90.7% |
| Interquartile 25% (IQ1) | 4.9% | 88.1% |
| Interquartile 75% (IQ3) | 15.0% | 92.6% |
| Interquartile Range (IQR) | 10.1% | 4.5% |
| Standard Deviation (Sample) | 7.2% | 5.0% |
| Standard Deviation (Population) | 7.2% | 5.0% |
Correlation Details
| Immigrants from El Salvador Percentile | Sample Size | 1 or more Vehicles in Household |
[ 0.0% - 0.5% ] 0.094% | 160,119,102 | 90.9% |
[ 0.0% - 0.5% ] 0.32% | 73,838,743 | 86.5% |
[ 0.5% - 1.0% ] 0.53% | 29,340,123 | 90.9% |
[ 0.5% - 1.0% ] 0.75% | 18,416,385 | 92.2% |
[ 0.5% - 1.0% ] 0.96% | 15,237,809 | 91.1% |
[ 1.0% - 1.5% ] 1.16% | 10,037,781 | 88.3% |
[ 1.0% - 1.5% ] 1.39% | 8,397,955 | 90.7% |
[ 1.5% - 2.0% ] 1.60% | 5,672,854 | 88.9% |
[ 1.5% - 2.0% ] 1.82% | 4,187,811 | 92.0% |
[ 2.0% - 2.5% ] 2.02% | 2,822,266 | 92.0% |
[ 2.0% - 2.5% ] 2.24% | 2,879,761 | 92.2% |
[ 2.0% - 2.5% ] 2.47% | 2,194,671 | 93.7% |
[ 2.5% - 3.0% ] 2.70% | 1,847,085 | 90.9% |
[ 2.5% - 3.0% ] 2.85% | 3,614,361 | 90.6% |
[ 3.0% - 3.5% ] 3.11% | 1,225,676 | 92.6% |
[ 3.0% - 3.5% ] 3.30% | 1,089,543 | 89.7% |
[ 3.5% - 4.0% ] 3.52% | 1,060,463 | 90.8% |
[ 3.5% - 4.0% ] 3.76% | 872,848 | 90.6% |
[ 3.5% - 4.0% ] 3.97% | 635,532 | 90.7% |
[ 4.0% - 4.5% ] 4.19% | 509,388 | 92.7% |
[ 4.0% - 4.5% ] 4.35% | 4,433,557 | 88.8% |
[ 4.5% - 5.0% ] 4.62% | 676,745 | 88.6% |
[ 4.5% - 5.0% ] 4.87% | 605,902 | 89.7% |
[ 5.0% - 5.5% ] 5.07% | 599,761 | 88.1% |
[ 5.0% - 5.5% ] 5.25% | 298,366 | 85.7% |
[ 5.0% - 5.5% ] 5.47% | 697,906 | 82.9% |
[ 5.5% - 6.0% ] 5.69% | 376,239 | 92.3% |
[ 5.5% - 6.0% ] 5.94% | 217,826 | 93.3% |
[ 6.0% - 6.5% ] 6.11% | 248,103 | 89.2% |
[ 6.0% - 6.5% ] 6.35% | 150,984 | 79.2% |
[ 6.5% - 7.0% ] 6.53% | 461,360 | 92.6% |
[ 6.5% - 7.0% ] 6.76% | 398,482 | 88.1% |
[ 6.5% - 7.0% ] 6.98% | 103,697 | 94.5% |
[ 7.0% - 7.5% ] 7.17% | 171,583 | 92.0% |
[ 7.0% - 7.5% ] 7.37% | 291,995 | 86.9% |
[ 7.5% - 8.0% ] 7.62% | 242,336 | 88.9% |
[ 7.5% - 8.0% ] 7.89% | 84,623 | 91.1% |
[ 8.0% - 8.5% ] 8.07% | 109,881 | 86.6% |
[ 8.0% - 8.5% ] 8.26% | 367,804 | 89.9% |
[ 8.5% - 9.0% ] 8.53% | 339,140 | 87.2% |
[ 8.5% - 9.0% ] 8.71% | 164,080 | 90.7% |
[ 8.5% - 9.0% ] 8.98% | 101,884 | 87.2% |
[ 9.0% - 9.5% ] 9.13% | 155,953 | 96.0% |
[ 9.0% - 9.5% ] 9.32% | 326,786 | 87.4% |
[ 9.5% - 10.0% ] 9.59% | 95,999 | 91.4% |
[ 9.5% - 10.0% ] 9.82% | 138,093 | 83.7% |
[ 10.0% - 10.5% ] 10.05% | 103,782 | 89.9% |
[ 10.0% - 10.5% ] 10.25% | 33,408 | 91.5% |
[ 10.0% - 10.5% ] 10.37% | 64,890 | 76.6% |
[ 10.5% - 11.0% ] 10.59% | 114,601 | 79.9% |
[ 10.5% - 11.0% ] 10.85% | 9,431 | 95.2% |
[ 11.0% - 11.5% ] 11.12% | 25,324 | 89.4% |
[ 11.0% - 11.5% ] 11.32% | 201,194 | 92.6% |
[ 11.0% - 11.5% ] 11.49% | 44,814 | 97.3% |
[ 11.5% - 12.0% ] 11.76% | 4,958 | 96.3% |
[ 11.5% - 12.0% ] 11.84% | 32,191 | 89.2% |
[ 12.0% - 12.5% ] 12.16% | 59,604 | 92.6% |
[ 12.0% - 12.5% ] 12.30% | 91,938 | 88.3% |
[ 12.5% - 13.0% ] 12.62% | 420 | 100.0% |
[ 12.5% - 13.0% ] 12.84% | 126,295 | 89.3% |
[ 13.0% - 13.5% ] 13.01% | 85,124 | 84.4% |
[ 13.0% - 13.5% ] 13.19% | 75,956 | 93.7% |
[ 13.0% - 13.5% ] 13.40% | 120,534 | 77.5% |
[ 13.5% - 14.0% ] 13.69% | 22,966 | 90.1% |
[ 13.5% - 14.0% ] 13.80% | 32,061 | 95.1% |
[ 14.0% - 14.5% ] 14.26% | 2,118 | 90.9% |
[ 14.5% - 15.0% ] 14.64% | 87,056 | 92.0% |
[ 14.5% - 15.0% ] 14.97% | 154,449 | 89.0% |
[ 15.0% - 15.5% ] 15.14% | 766 | 96.7% |
[ 15.0% - 15.5% ] 15.36% | 34,625 | 82.3% |
[ 15.5% - 16.0% ] 15.74% | 1,328 | 97.5% |
[ 15.5% - 16.0% ] 15.99% | 3,809 | 89.0% |
[ 16.0% - 16.5% ] 16.32% | 15,127 | 92.4% |
[ 16.0% - 16.5% ] 16.40% | 16,944 | 89.5% |
[ 16.5% - 17.0% ] 16.63% | 7,557 | 98.0% |
[ 17.0% - 17.5% ] 17.32% | 6,218 | 91.6% |
[ 17.0% - 17.5% ] 17.42% | 3,851 | 98.0% |
[ 17.5% - 18.0% ] 17.85% | 24,744 | 80.1% |
[ 18.5% - 19.0% ] 18.59% | 84,133 | 73.2% |
[ 19.0% - 19.5% ] 19.10% | 9,031 | 94.2% |
[ 19.0% - 19.5% ] 19.20% | 7,094 | 92.9% |
[ 19.5% - 20.0% ] 19.59% | 1,751 | 94.4% |
[ 19.5% - 20.0% ] 19.89% | 10,563 | 96.2% |
[ 20.0% - 20.5% ] 20.12% | 18,080 | 84.7% |
[ 20.5% - 21.0% ] 20.62% | 50,387 | 85.3% |
[ 20.5% - 21.0% ] 20.87% | 35,908 | 82.2% |
[ 23.0% - 23.5% ] 23.33% | 14,736 | 85.2% |
[ 24.0% - 24.5% ] 24.09% | 5,949 | 96.7% |
[ 25.5% - 26.0% ] 25.98% | 14,367 | 85.9% |
[ 42.5% - 43.0% ] 42.98% | 114 | 98.7% |