Immigrants from Dominican Republic Married-Couple Family Poverty
COMPARE
Immigrants from Dominican Republic
Select to Compare
Married-Couple Family Poverty
Immigrants from Dominican Republic Married-Couple Family Poverty
8.4%
POVERTY | MARRIED-COUPLE FAMILIES
0.0/ 100
METRIC RATING
334th/ 347
METRIC RANK
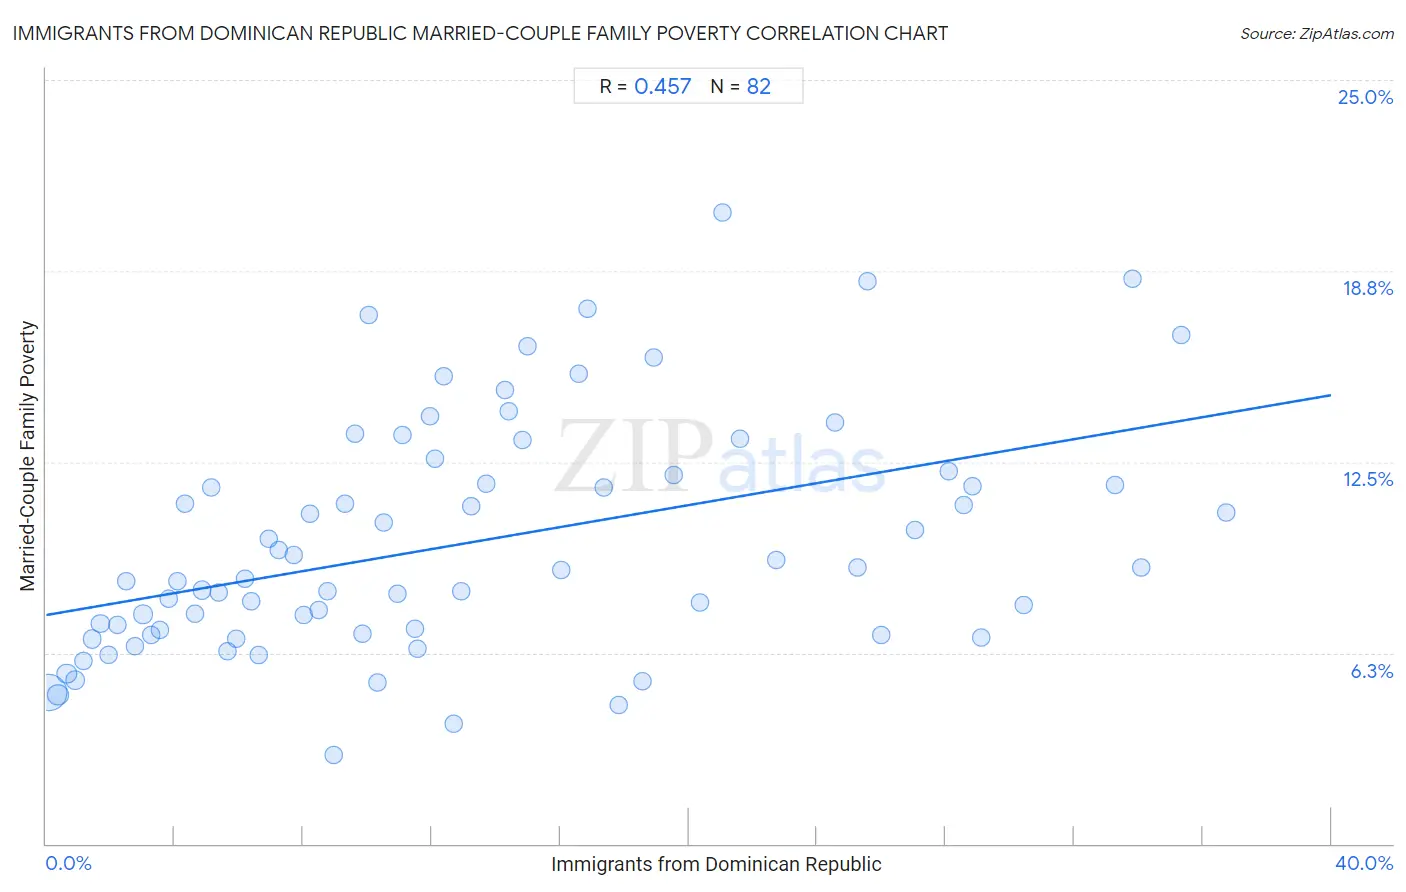
Immigrants from Dominican Republic Married-Couple Family Poverty Correlation Chart
The statistical analysis conducted on geographies consisting of 272,952,781 people shows a moderate positive correlation between the proportion of Immigrants from Dominican Republic and poverty level among married-couple families in the United States with a correlation coefficient (R) of 0.457 and weighted average of 8.4%. On average, for every 1% (one percent) increase in Immigrants from Dominican Republic within a typical geography, there is an increase of 0.18% in poverty level among married-couple families.
It is essential to understand that the correlation between the percentage of Immigrants from Dominican Republic and poverty level among married-couple families does not imply a direct cause-and-effect relationship. It remains uncertain whether the presence of Immigrants from Dominican Republic influences an upward or downward trend in the level of poverty level among married-couple families within an area, or if Immigrants from Dominican Republic simply ended up residing in those areas with higher or lower levels of poverty level among married-couple families due to other factors.
Demographics Similar to Immigrants from Dominican Republic by Married-Couple Family Poverty
In terms of married-couple family poverty, the demographic groups most similar to Immigrants from Dominican Republic are Lumbee (8.3%, a difference of 0.68%), Dominican (8.3%, a difference of 1.1%), Central American Indian (8.3%, a difference of 1.2%), Paiute (8.3%, a difference of 1.3%), and Native/Alaskan (8.2%, a difference of 2.5%).
| Demographics | Rating | Rank | Married-Couple Family Poverty |
| Hispanics or Latinos | 0.0 /100 | #327 | Tragic 7.5% |
| Immigrants from Mexico | 0.0 /100 | #328 | Tragic 7.6% |
| Natives/Alaskans | 0.0 /100 | #329 | Tragic 8.2% |
| Paiute | 0.0 /100 | #330 | Tragic 8.3% |
| Central American Indians | 0.0 /100 | #331 | Tragic 8.3% |
| Dominicans | 0.0 /100 | #332 | Tragic 8.3% |
| Lumbee | 0.0 /100 | #333 | Tragic 8.3% |
| Immigrants from Dominican Republic | 0.0 /100 | #334 | Tragic 8.4% |
| Sioux | 0.0 /100 | #335 | Tragic 8.7% |
| Apache | 0.0 /100 | #336 | Tragic 9.0% |
| Yakama | 0.0 /100 | #337 | Tragic 9.0% |
| Cheyenne | 0.0 /100 | #338 | Tragic 9.4% |
| Crow | 0.0 /100 | #339 | Tragic 9.6% |
| Yuman | 0.0 /100 | #340 | Tragic 9.7% |
| Pueblo | 0.0 /100 | #341 | Tragic 11.1% |
Immigrants from Dominican Republic Married-Couple Family Poverty Correlation Summary
| Measurement | Immigrants from Dominican Republic Data | Married-Couple Family Poverty Data |
| Minimum | 0.075% | 2.9% |
| Maximum | 36.7% | 20.7% |
| Range | 36.7% | 17.8% |
| Mean | 13.2% | 9.9% |
| Median | 11.0% | 8.8% |
| Interquartile 25% (IQ1) | 5.4% | 6.9% |
| Interquartile 75% (IQ3) | 18.9% | 12.1% |
| Interquartile Range (IQR) | 13.5% | 5.2% |
| Standard Deviation (Sample) | 9.7% | 3.8% |
| Standard Deviation (Population) | 9.7% | 3.8% |
Correlation Details
| Immigrants from Dominican Republic Percentile | Sample Size | Married-Couple Family Poverty |
[ 0.0% - 0.5% ] 0.075% | 177,918,351 | 5.0% |
[ 0.0% - 0.5% ] 0.37% | 26,675,360 | 4.9% |
[ 0.5% - 1.0% ] 0.64% | 13,593,623 | 5.6% |
[ 0.5% - 1.0% ] 0.91% | 9,197,418 | 5.4% |
[ 1.0% - 1.5% ] 1.17% | 5,754,010 | 6.0% |
[ 1.0% - 1.5% ] 1.42% | 6,111,350 | 6.7% |
[ 1.5% - 2.0% ] 1.69% | 4,000,472 | 7.2% |
[ 1.5% - 2.0% ] 1.93% | 2,771,311 | 6.2% |
[ 2.0% - 2.5% ] 2.22% | 1,833,505 | 7.2% |
[ 2.0% - 2.5% ] 2.49% | 1,030,801 | 8.6% |
[ 2.5% - 3.0% ] 2.75% | 1,394,953 | 6.5% |
[ 3.0% - 3.5% ] 3.01% | 1,021,984 | 7.5% |
[ 3.0% - 3.5% ] 3.26% | 1,101,824 | 6.8% |
[ 3.5% - 4.0% ] 3.54% | 1,554,101 | 7.0% |
[ 3.5% - 4.0% ] 3.80% | 586,928 | 8.0% |
[ 4.0% - 4.5% ] 4.09% | 1,230,743 | 8.6% |
[ 4.0% - 4.5% ] 4.32% | 754,611 | 11.1% |
[ 4.5% - 5.0% ] 4.62% | 63,345 | 7.5% |
[ 4.5% - 5.0% ] 4.85% | 8,828,376 | 8.3% |
[ 5.0% - 5.5% ] 5.12% | 492,905 | 11.7% |
[ 5.0% - 5.5% ] 5.35% | 535,794 | 8.2% |
[ 5.5% - 6.0% ] 5.64% | 336,274 | 6.3% |
[ 5.5% - 6.0% ] 5.92% | 179,877 | 6.7% |
[ 6.0% - 6.5% ] 6.17% | 208,276 | 8.7% |
[ 6.0% - 6.5% ] 6.39% | 428,632 | 7.9% |
[ 6.5% - 7.0% ] 6.60% | 101,412 | 6.2% |
[ 6.5% - 7.0% ] 6.92% | 181,401 | 10.0% |
[ 7.0% - 7.5% ] 7.24% | 210,882 | 9.6% |
[ 7.5% - 8.0% ] 7.71% | 99,242 | 9.4% |
[ 8.0% - 8.5% ] 8.00% | 87,825 | 7.5% |
[ 8.0% - 8.5% ] 8.22% | 147,671 | 10.8% |
[ 8.0% - 8.5% ] 8.50% | 77,122 | 7.7% |
[ 8.5% - 9.0% ] 8.77% | 516,513 | 8.3% |
[ 8.5% - 9.0% ] 8.96% | 67,652 | 2.9% |
[ 9.0% - 9.5% ] 9.29% | 59,235 | 11.1% |
[ 9.5% - 10.0% ] 9.60% | 105,250 | 13.4% |
[ 9.5% - 10.0% ] 9.83% | 325,139 | 6.9% |
[ 10.0% - 10.5% ] 10.04% | 62,824 | 17.3% |
[ 10.0% - 10.5% ] 10.30% | 224,927 | 5.3% |
[ 10.5% - 11.0% ] 10.50% | 55,985 | 10.5% |
[ 10.5% - 11.0% ] 10.95% | 114,608 | 8.2% |
[ 11.0% - 11.5% ] 11.07% | 218,026 | 13.4% |
[ 11.0% - 11.5% ] 11.50% | 13,309 | 7.0% |
[ 11.5% - 12.0% ] 11.54% | 4,738 | 6.4% |
[ 11.5% - 12.0% ] 11.96% | 26,615 | 14.0% |
[ 12.0% - 12.5% ] 12.12% | 197,592 | 12.6% |
[ 12.0% - 12.5% ] 12.38% | 120,102 | 15.3% |
[ 12.5% - 13.0% ] 12.67% | 10,396 | 3.9% |
[ 12.5% - 13.0% ] 12.90% | 94,560 | 8.3% |
[ 13.0% - 13.5% ] 13.23% | 320,831 | 11.1% |
[ 13.5% - 14.0% ] 13.70% | 73,556 | 11.8% |
[ 14.0% - 14.5% ] 14.27% | 88,575 | 14.8% |
[ 14.0% - 14.5% ] 14.40% | 51,640 | 14.2% |
[ 14.5% - 15.0% ] 14.83% | 61,238 | 13.2% |
[ 14.5% - 15.0% ] 14.97% | 51,964 | 16.3% |
[ 16.0% - 16.5% ] 16.03% | 140,096 | 8.9% |
[ 16.5% - 17.0% ] 16.58% | 5,490 | 15.4% |
[ 16.5% - 17.0% ] 16.86% | 59,852 | 17.5% |
[ 17.0% - 17.5% ] 17.35% | 1,798 | 11.7% |
[ 17.5% - 18.0% ] 17.83% | 24,572 | 4.6% |
[ 18.5% - 19.0% ] 18.55% | 9,309 | 5.3% |
[ 18.5% - 19.0% ] 18.90% | 61,044 | 15.9% |
[ 19.5% - 20.0% ] 19.53% | 237,681 | 12.1% |
[ 20.0% - 20.5% ] 20.35% | 25,674 | 7.9% |
[ 21.0% - 21.5% ] 21.07% | 78,624 | 20.7% |
[ 21.5% - 22.0% ] 21.61% | 93,747 | 13.3% |
[ 22.5% - 23.0% ] 22.73% | 13,781 | 9.3% |
[ 24.5% - 25.0% ] 24.54% | 20,269 | 13.8% |
[ 25.0% - 25.5% ] 25.27% | 35,492 | 9.0% |
[ 25.5% - 26.0% ] 25.55% | 100,504 | 18.4% |
[ 25.5% - 26.0% ] 25.99% | 100,281 | 6.8% |
[ 27.0% - 27.5% ] 27.05% | 31,519 | 10.3% |
[ 28.0% - 28.5% ] 28.11% | 60,480 | 12.2% |
[ 28.5% - 29.0% ] 28.56% | 29,671 | 11.1% |
[ 28.5% - 29.0% ] 28.84% | 109,749 | 11.7% |
[ 29.0% - 29.5% ] 29.09% | 58,136 | 6.7% |
[ 30.0% - 30.5% ] 30.42% | 55,226 | 7.8% |
[ 33.0% - 33.5% ] 33.25% | 43,653 | 11.7% |
[ 33.5% - 34.0% ] 33.83% | 32,697 | 18.5% |
[ 34.0% - 34.5% ] 34.08% | 88,067 | 9.1% |
[ 35.0% - 35.5% ] 35.34% | 6,977 | 16.7% |
[ 36.5% - 37.0% ] 36.74% | 52,738 | 10.8% |