Immigrants from Central America Self-Care Disability
COMPARE
Immigrants from Central America
Select to Compare
Self-Care Disability
Immigrants from Central America Self-Care Disability
2.6%
SELF-CARE DISABILITY
0.3/ 100
METRIC RATING
256th/ 347
METRIC RANK
Immigrants from Central America Self-Care Disability Correlation Chart
The statistical analysis conducted on geographies consisting of 534,996,310 people shows a mild positive correlation between the proportion of Immigrants from Central America and percentage of population with self-care disability in the United States with a correlation coefficient (R) of 0.344 and weighted average of 2.6%. On average, for every 1% (one percent) increase in Immigrants from Central America within a typical geography, there is an increase of 0.043% in percentage of population with self-care disability.
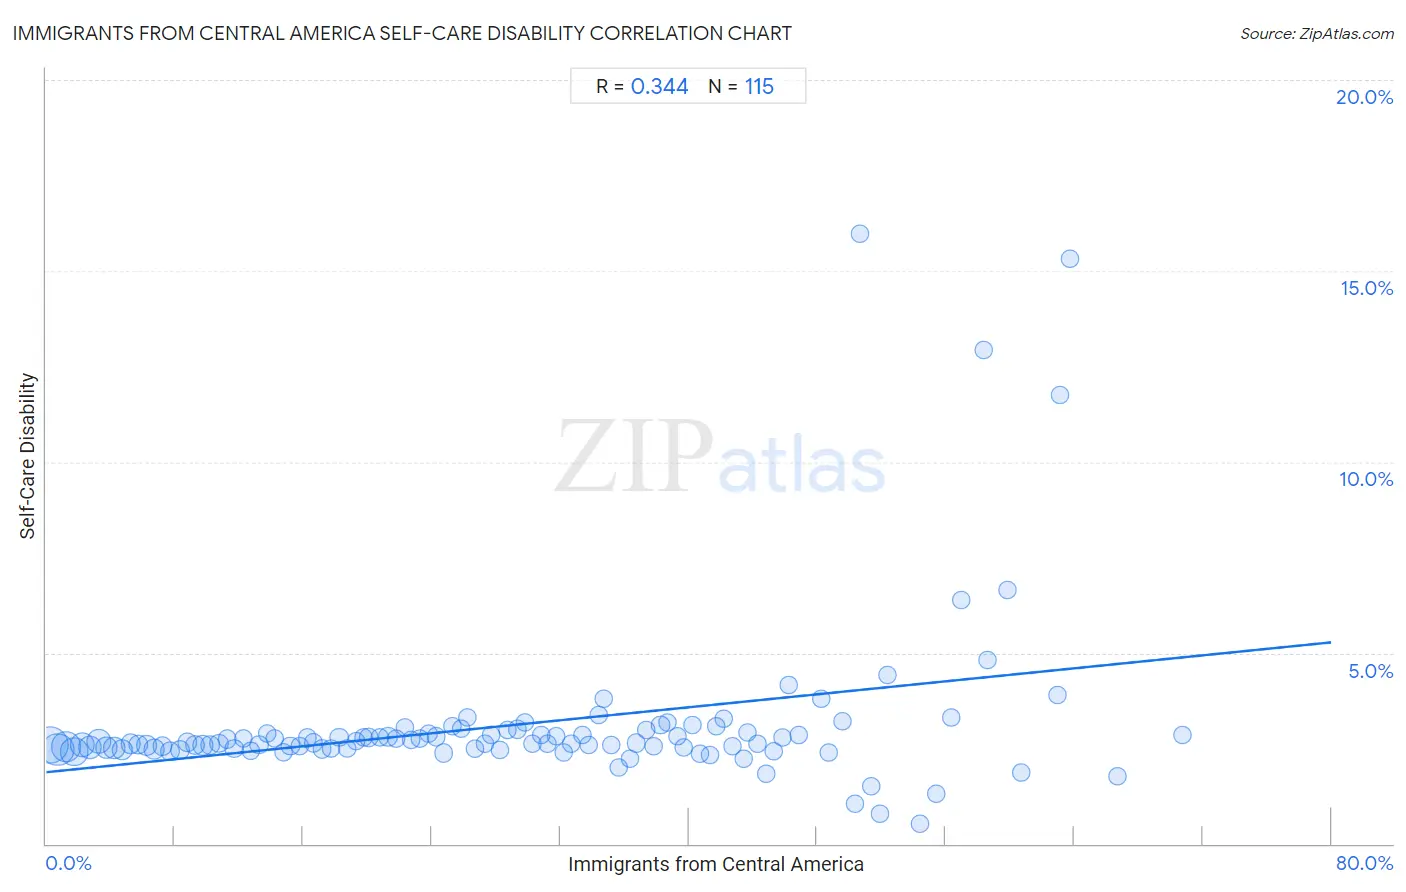
It is essential to understand that the correlation between the percentage of Immigrants from Central America and percentage of population with self-care disability does not imply a direct cause-and-effect relationship. It remains uncertain whether the presence of Immigrants from Central America influences an upward or downward trend in the level of percentage of population with self-care disability within an area, or if Immigrants from Central America simply ended up residing in those areas with higher or lower levels of percentage of population with self-care disability due to other factors.
Demographics Similar to Immigrants from Central America by Self-Care Disability
In terms of self-care disability, the demographic groups most similar to Immigrants from Central America are Tsimshian (2.6%, a difference of 0.020%), Haitian (2.6%, a difference of 0.060%), Immigrants from Haiti (2.6%, a difference of 0.080%), Immigrants from Bangladesh (2.6%, a difference of 0.16%), and Potawatomi (2.6%, a difference of 0.20%).
| Demographics | Rating | Rank | Self-Care Disability |
| Mexican American Indians | 0.5 /100 | #249 | Tragic 2.6% |
| Portuguese | 0.4 /100 | #250 | Tragic 2.6% |
| Immigrants from Liberia | 0.4 /100 | #251 | Tragic 2.6% |
| Immigrants from Bangladesh | 0.4 /100 | #252 | Tragic 2.6% |
| Immigrants from Haiti | 0.3 /100 | #253 | Tragic 2.6% |
| Haitians | 0.3 /100 | #254 | Tragic 2.6% |
| Tsimshian | 0.3 /100 | #255 | Tragic 2.6% |
| Immigrants from Central America | 0.3 /100 | #256 | Tragic 2.6% |
| Potawatomi | 0.3 /100 | #257 | Tragic 2.6% |
| Nonimmigrants | 0.3 /100 | #258 | Tragic 2.6% |
| Immigrants from Belarus | 0.2 /100 | #259 | Tragic 2.6% |
| Chippewa | 0.2 /100 | #260 | Tragic 2.6% |
| Arapaho | 0.2 /100 | #261 | Tragic 2.6% |
| Shoshone | 0.2 /100 | #262 | Tragic 2.7% |
| Immigrants from Latin America | 0.2 /100 | #263 | Tragic 2.7% |
Immigrants from Central America Self-Care Disability Correlation Summary
| Measurement | Immigrants from Central America Data | Self-Care Disability Data |
| Minimum | 0.25% | 0.52% |
| Maximum | 70.7% | 16.0% |
| Range | 70.5% | 15.5% |
| Mean | 29.6% | 3.1% |
| Median | 28.7% | 2.6% |
| Interquartile 25% (IQ1) | 14.2% | 2.5% |
| Interquartile 75% (IQ3) | 43.4% | 2.9% |
| Interquartile Range (IQR) | 29.2% | 0.43% |
| Standard Deviation (Sample) | 18.0% | 2.2% |
| Standard Deviation (Population) | 18.0% | 2.2% |
Correlation Details
| Immigrants from Central America Percentile | Sample Size | Self-Care Disability |
[ 0.0% - 0.5% ] 0.25% | 86,913,472 | 2.6% |
[ 0.5% - 1.0% ] 0.73% | 67,601,373 | 2.5% |
[ 1.0% - 1.5% ] 1.24% | 53,579,614 | 2.5% |
[ 1.5% - 2.0% ] 1.75% | 42,037,372 | 2.4% |
[ 2.0% - 2.5% ] 2.24% | 30,946,945 | 2.6% |
[ 2.5% - 3.0% ] 2.74% | 23,779,755 | 2.5% |
[ 3.0% - 3.5% ] 3.25% | 28,378,833 | 2.7% |
[ 3.5% - 4.0% ] 3.73% | 16,126,142 | 2.5% |
[ 4.0% - 4.5% ] 4.24% | 13,136,330 | 2.5% |
[ 4.5% - 5.0% ] 4.72% | 13,932,778 | 2.5% |
[ 5.0% - 5.5% ] 5.26% | 10,902,178 | 2.6% |
[ 5.5% - 6.0% ] 5.74% | 10,095,347 | 2.6% |
[ 6.0% - 6.5% ] 6.25% | 8,341,102 | 2.6% |
[ 6.5% - 7.0% ] 6.72% | 8,213,280 | 2.5% |
[ 7.0% - 7.5% ] 7.26% | 6,688,280 | 2.6% |
[ 7.5% - 8.0% ] 7.71% | 5,547,179 | 2.4% |
[ 8.0% - 8.5% ] 8.29% | 5,777,876 | 2.5% |
[ 8.5% - 9.0% ] 8.77% | 7,346,949 | 2.7% |
[ 9.0% - 9.5% ] 9.27% | 5,775,515 | 2.6% |
[ 9.5% - 10.0% ] 9.74% | 8,191,916 | 2.6% |
[ 10.0% - 10.5% ] 10.22% | 4,441,110 | 2.6% |
[ 10.5% - 11.0% ] 10.75% | 3,938,489 | 2.6% |
[ 11.0% - 11.5% ] 11.26% | 2,709,606 | 2.7% |
[ 11.5% - 12.0% ] 11.70% | 1,874,101 | 2.5% |
[ 12.0% - 12.5% ] 12.27% | 2,891,902 | 2.8% |
[ 12.5% - 13.0% ] 12.73% | 4,404,726 | 2.4% |
[ 13.0% - 13.5% ] 13.26% | 2,625,760 | 2.6% |
[ 13.5% - 14.0% ] 13.74% | 2,858,045 | 2.9% |
[ 14.0% - 14.5% ] 14.24% | 2,860,623 | 2.8% |
[ 14.5% - 15.0% ] 14.76% | 1,866,354 | 2.4% |
[ 15.0% - 15.5% ] 15.19% | 2,263,781 | 2.6% |
[ 15.5% - 16.0% ] 15.76% | 1,864,654 | 2.5% |
[ 16.0% - 16.5% ] 16.26% | 1,568,375 | 2.8% |
[ 16.5% - 17.0% ] 16.65% | 3,022,569 | 2.6% |
[ 17.0% - 17.5% ] 17.18% | 3,705,878 | 2.5% |
[ 17.5% - 18.0% ] 17.74% | 2,004,469 | 2.5% |
[ 18.0% - 18.5% ] 18.25% | 1,685,449 | 2.8% |
[ 18.5% - 19.0% ] 18.74% | 2,505,740 | 2.5% |
[ 19.0% - 19.5% ] 19.26% | 1,397,744 | 2.7% |
[ 19.5% - 20.0% ] 19.74% | 1,371,330 | 2.8% |
[ 20.0% - 20.5% ] 20.09% | 6,094,525 | 2.8% |
[ 20.5% - 21.0% ] 20.77% | 1,402,936 | 2.8% |
[ 21.0% - 21.5% ] 21.28% | 994,760 | 2.8% |
[ 21.5% - 22.0% ] 21.78% | 1,199,439 | 2.8% |
[ 22.0% - 22.5% ] 22.30% | 896,158 | 3.0% |
[ 22.5% - 23.0% ] 22.73% | 917,075 | 2.7% |
[ 23.0% - 23.5% ] 23.28% | 1,500,167 | 2.8% |
[ 23.5% - 24.0% ] 23.79% | 1,084,636 | 2.9% |
[ 24.0% - 24.5% ] 24.29% | 1,133,301 | 2.8% |
[ 24.5% - 25.0% ] 24.76% | 859,466 | 2.4% |
[ 25.0% - 25.5% ] 25.30% | 711,262 | 3.1% |
[ 25.5% - 26.0% ] 25.84% | 600,431 | 3.0% |
[ 26.0% - 26.5% ] 26.23% | 1,073,105 | 3.3% |
[ 26.5% - 27.0% ] 26.72% | 489,952 | 2.5% |
[ 27.0% - 27.5% ] 27.32% | 532,610 | 2.6% |
[ 27.5% - 28.0% ] 27.68% | 1,050,639 | 2.8% |
[ 28.0% - 28.5% ] 28.23% | 562,907 | 2.5% |
[ 28.5% - 29.0% ] 28.70% | 350,055 | 3.0% |
[ 29.0% - 29.5% ] 29.30% | 782,488 | 3.0% |
[ 29.5% - 30.0% ] 29.78% | 562,332 | 3.2% |
[ 30.0% - 30.5% ] 30.26% | 496,315 | 2.6% |
[ 30.5% - 31.0% ] 30.82% | 231,079 | 2.8% |
[ 31.0% - 31.5% ] 31.18% | 206,994 | 2.6% |
[ 31.5% - 32.0% ] 31.73% | 995,172 | 2.8% |
[ 32.0% - 32.5% ] 32.25% | 275,579 | 2.4% |
[ 32.5% - 33.0% ] 32.68% | 365,962 | 2.6% |
[ 33.0% - 33.5% ] 33.38% | 212,639 | 2.8% |
[ 33.5% - 34.0% ] 33.80% | 390,150 | 2.6% |
[ 34.0% - 34.5% ] 34.40% | 202,080 | 3.4% |
[ 34.5% - 35.0% ] 34.70% | 166,167 | 3.8% |
[ 35.0% - 35.5% ] 35.21% | 65,121 | 2.6% |
[ 35.5% - 36.0% ] 35.63% | 139,198 | 2.0% |
[ 36.0% - 36.5% ] 36.37% | 308,047 | 2.2% |
[ 36.5% - 37.0% ] 36.73% | 333,570 | 2.6% |
[ 37.0% - 37.5% ] 37.32% | 190,455 | 3.0% |
[ 37.5% - 38.0% ] 37.80% | 226,971 | 2.5% |
[ 38.0% - 38.5% ] 38.25% | 200,800 | 3.1% |
[ 38.5% - 39.0% ] 38.69% | 144,827 | 3.2% |
[ 39.0% - 39.5% ] 39.32% | 151,375 | 2.8% |
[ 39.5% - 40.0% ] 39.69% | 289,854 | 2.5% |
[ 40.0% - 40.5% ] 40.20% | 127,290 | 3.1% |
[ 40.5% - 41.0% ] 40.73% | 258,186 | 2.4% |
[ 41.0% - 41.5% ] 41.33% | 24,660 | 2.3% |
[ 41.5% - 42.0% ] 41.71% | 208,025 | 3.1% |
[ 42.0% - 42.5% ] 42.14% | 82,614 | 3.3% |
[ 42.5% - 43.0% ] 42.74% | 5,431 | 2.6% |
[ 43.0% - 43.5% ] 43.44% | 49,238 | 2.2% |
[ 43.5% - 44.0% ] 43.67% | 110,016 | 2.9% |
[ 44.0% - 44.5% ] 44.29% | 261,256 | 2.6% |
[ 44.5% - 45.0% ] 44.82% | 45,508 | 1.8% |
[ 45.0% - 45.5% ] 45.26% | 20,099 | 2.4% |
[ 45.5% - 46.0% ] 45.84% | 63,386 | 2.8% |
[ 46.0% - 46.5% ] 46.26% | 8,569 | 4.2% |
[ 46.5% - 47.0% ] 46.88% | 58,922 | 2.8% |
[ 48.0% - 48.5% ] 48.22% | 4,231 | 3.8% |
[ 48.5% - 49.0% ] 48.71% | 10,108 | 2.4% |
[ 49.5% - 50.0% ] 49.59% | 3,017 | 3.2% |
[ 50.0% - 50.5% ] 50.37% | 19,115 | 1.0% |
[ 50.5% - 51.0% ] 50.67% | 1,352 | 16.0% |
[ 51.0% - 51.5% ] 51.33% | 5,922 | 1.5% |
[ 51.5% - 52.0% ] 51.90% | 13,841 | 0.79% |
[ 52.0% - 52.5% ] 52.40% | 1,540 | 4.4% |
[ 54.0% - 54.5% ] 54.39% | 21,778 | 0.52% |
[ 55.0% - 55.5% ] 55.44% | 3,191 | 1.3% |
[ 56.0% - 56.5% ] 56.34% | 13,137 | 3.3% |
[ 56.5% - 57.0% ] 56.96% | 316 | 6.4% |
[ 58.0% - 58.5% ] 58.38% | 185 | 12.9% |
[ 58.5% - 59.0% ] 58.58% | 7,689 | 4.8% |
[ 59.5% - 60.0% ] 59.86% | 1,293 | 6.7% |
[ 60.5% - 61.0% ] 60.71% | 425 | 1.9% |
[ 62.5% - 63.0% ] 62.93% | 1,570 | 3.9% |
[ 63.0% - 63.5% ] 63.13% | 358 | 11.7% |
[ 63.5% - 64.0% ] 63.71% | 248 | 15.3% |
[ 66.5% - 67.0% ] 66.67% | 114 | 1.8% |
[ 70.5% - 71.0% ] 70.71% | 140 | 2.9% |