Immigrants from Caribbean vs Potawatomi Disability Age Under 5

COMPARE

Immigrants from Caribbean
Race
Ancestry
AfghanAfricanAlaska NativeAlaskan AthabascanAlbanianAleutAlsatianAmericanApacheArabArapahoArgentineanArmenianAssyrian/Chaldean/SyriacAustralianAustrianBahamianBangladeshiBarbadianBasqueBelgianBelizeanBermudanBhutaneseBlackfeetBolivianBrazilianBritishBritish West IndianBulgarianBurmeseCajunCambodianCanadianCape VerdeanCarpatho RusynCelticCentral AmericanCentral American IndianCherokeeCheyenneChickasawChileanChineseChippewaChoctawColombianColvilleComancheCosta RicanCreeCreekCroatianCrowCubanCypriotCzechCzechoslovakianDanishDelawareDominicanDutchDutch West IndianEastern EuropeanEcuadorianEgyptianEnglishEstonianEthiopianEuropeanFijianFilipinoFinnishFrenchFrench American IndianFrench CanadianGermanGerman RussianGhanaianGreekGuamanian/ChamorroGuatemalanGuyaneseHaitianHmongHonduranHopiHoumaHungarianIcelanderIndian (Asian)IndonesianInupiatIranianIraqiIrishIroquoisIsraeliItalianJamaicanJapaneseJordanianKenyanKiowaKoreanLaotianLatvianLebaneseLiberianLithuanianLumbeeLuxembourgerMacedonianMalaysianMalteseMarshalleseMenomineeMexicanMexican American IndianMongolianMoroccanNative HawaiianNavajoNepaleseNew ZealanderNicaraguanNigerianNorthern EuropeanNorwegianOkinawanOsageOttawaPaiutePakistaniPalestinianPanamanianParaguayanPennsylvania GermanPeruvianPimaPolishPortuguesePuebloPuerto RicanPuget Sound SalishRomanianRussianSalvadoranSamoanScandinavianScotch-IrishScottishSeminoleSenegaleseSerbianShoshoneSierra LeoneanSiouxSlavicSlovakSloveneSomaliSouth AfricanSouth AmericanSouth American IndianSoviet UnionSpaniardSpanishSpanish AmericanSpanish American IndianSri LankanSubsaharan AfricanSudaneseSwedishSwissSyrianTaiwaneseThaiTlingit-HaidaTohono O'OdhamTonganTrinidadian and TobagonianTsimshianTurkishU.S. Virgin IslanderUgandanUkrainianUruguayanUteVenezuelanVietnameseWelshWest IndianYakamaYaquiYugoslavianYumanYup'ikZimbabwean
Immigration
NonimmigrantsImmigrantsAfghanistanAfricaAlbaniaArgentinaArmeniaAsiaAustraliaAustriaBahamasBangladeshBarbadosBelarusBelgiumBelizeBoliviaBosnia and HerzegovinaBrazilBulgariaBurma/MyanmarCabo VerdeCambodiaCameroonCanadaCaribbeanCentral AmericaChileChinaColombiaCongoCosta RicaCroatiaCubaCzechoslovakiaDenmarkDominicaDominican RepublicEastern AfricaEastern AsiaEastern EuropeEcuadorEgyptEl SalvadorEnglandEritreaEthiopiaEuropeFijiFranceGermanyGhanaGreeceGrenadaGuatemalaGuyanaHaitiHondurasHong KongHungaryIndiaIndonesiaIranIraqIrelandIsraelItalyJamaicaJapanJordanKazakhstanKenyaKoreaKuwaitLaosLatin AmericaLatviaLebanonLiberiaLithuaniaMalaysiaMexicoMicronesiaMiddle AfricaMoldovaMoroccoNepalNetherlandsNicaraguaNigeriaNorth AmericaNorth MacedoniaNorthern AfricaNorthern EuropeNorwayOceaniaPakistanPanamaPeruPhilippinesPolandPortugalRomaniaRussiaSaudi ArabiaScotlandSenegalSerbiaSierra LeoneSingaporeSomaliaSouth AfricaSouth AmericaSouth Central AsiaSouth Eastern AsiaSouthern EuropeSpainSri LankaSt. Vincent and the GrenadinesSudanSwedenSwitzerlandSyriaTaiwanThailandTrinidad and TobagoTurkeyUgandaUkraineUruguayUzbekistanVenezuelaVietnamWest IndiesWestern AfricaWestern AsiaWestern EuropeYemenZaireZimbabweAzores
Potawatomi
Race
Ancestry
AfghanAfricanAlaska NativeAlaskan AthabascanAlbanianAleutAlsatianAmericanApacheArabArapahoArgentineanArmenianAssyrian/Chaldean/SyriacAustralianAustrianBahamianBangladeshiBarbadianBasqueBelgianBelizeanBermudanBhutaneseBlackfeetBolivianBrazilianBritishBritish West IndianBulgarianBurmeseCajunCambodianCanadianCape VerdeanCarpatho RusynCelticCentral AmericanCentral American IndianCherokeeCheyenneChickasawChileanChineseChippewaChoctawColombianColvilleComancheCosta RicanCreeCreekCroatianCrowCubanCypriotCzechCzechoslovakianDanishDelawareDominicanDutchDutch West IndianEastern EuropeanEcuadorianEgyptianEnglishEstonianEthiopianEuropeanFijianFilipinoFinnishFrenchFrench American IndianFrench CanadianGermanGerman RussianGhanaianGreekGuamanian/ChamorroGuatemalanGuyaneseHaitianHmongHonduranHopiHoumaHungarianIcelanderIndian (Asian)IndonesianInupiatIranianIraqiIrishIroquoisIsraeliItalianJamaicanJapaneseJordanianKenyanKiowaKoreanLaotianLatvianLebaneseLiberianLithuanianLumbeeLuxembourgerMacedonianMalaysianMalteseMarshalleseMenomineeMexicanMexican American IndianMongolianMoroccanNative HawaiianNavajoNepaleseNew ZealanderNicaraguanNigerianNorthern EuropeanNorwegianOkinawanOsageOttawaPaiutePakistaniPalestinianPanamanianParaguayanPennsylvania GermanPeruvianPimaPolishPortuguesePotawatomiPuebloPuerto RicanPuget Sound SalishRomanianRussianSalvadoranSamoanScandinavianScotch-IrishScottishSeminoleSenegaleseSerbianShoshoneSierra LeoneanSiouxSlavicSlovakSloveneSomaliSouth AfricanSouth AmericanSouth American IndianSoviet UnionSpaniardSpanishSpanish AmericanSpanish American IndianSri LankanSubsaharan AfricanSudaneseSwedishSwissSyrianTaiwaneseThaiTlingit-HaidaTohono O'OdhamTonganTrinidadian and TobagonianTsimshianTurkishU.S. Virgin IslanderUgandanUkrainianUruguayanUteVenezuelanVietnameseWelshWest IndianYakamaYaquiYugoslavianYumanYup'ikZimbabwean
Immigration
NonimmigrantsImmigrantsAfghanistanAfricaAlbaniaArgentinaArmeniaAsiaAustraliaAustriaBahamasBangladeshBarbadosBelarusBelgiumBelizeBoliviaBosnia and HerzegovinaBrazilBulgariaBurma/MyanmarCabo VerdeCambodiaCameroonCanadaCentral AmericaChileChinaColombiaCongoCosta RicaCroatiaCubaCzechoslovakiaDenmarkDominicaDominican RepublicEastern AfricaEastern AsiaEastern EuropeEcuadorEgyptEl SalvadorEnglandEritreaEthiopiaEuropeFijiFranceGermanyGhanaGreeceGrenadaGuatemalaGuyanaHaitiHondurasHong KongHungaryIndiaIndonesiaIranIraqIrelandIsraelItalyJamaicaJapanJordanKazakhstanKenyaKoreaKuwaitLaosLatin AmericaLatviaLebanonLiberiaLithuaniaMalaysiaMexicoMicronesiaMiddle AfricaMoldovaMoroccoNepalNetherlandsNicaraguaNigeriaNorth AmericaNorth MacedoniaNorthern AfricaNorthern EuropeNorwayOceaniaPakistanPanamaPeruPhilippinesPolandPortugalRomaniaRussiaSaudi ArabiaScotlandSenegalSerbiaSierra LeoneSingaporeSomaliaSouth AfricaSouth AmericaSouth Central AsiaSouth Eastern AsiaSouthern EuropeSpainSri LankaSt. Vincent and the GrenadinesSudanSwedenSwitzerlandSyriaTaiwanThailandTrinidad and TobagoTurkeyUgandaUkraineUruguayUzbekistanVenezuelaVietnamWest IndiesWestern AfricaWestern AsiaWestern EuropeYemenZaireZimbabweAzores
Disability Age Under 5
Income
Poverty
Unemployment
Labor Participation
Family Structure
Vehicle Availability
Education Level
Disability

Disability Age Under 5 Comparison

Immigrants from Caribbean

Potawatomi

Exceptional
Tragic
1.2%
DISABILITY AGE UNDER 5
93.8/ 100
METRIC RATING
115th/ 347
METRIC RANK
1.4%
DISABILITY AGE UNDER 5
1.1/ 100
METRIC RATING
245th/ 347
METRIC RANK

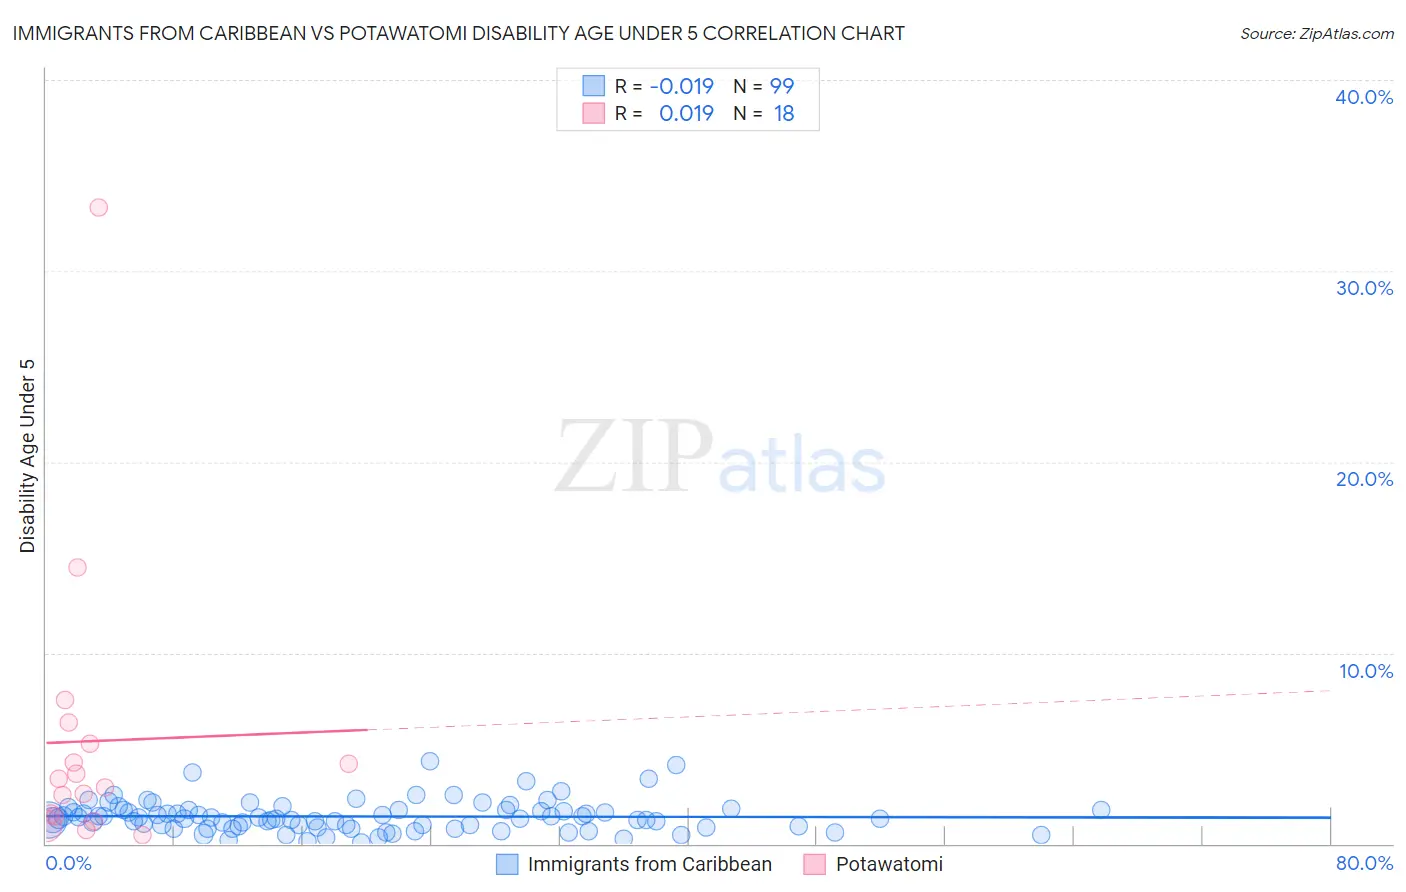
Immigrants from Caribbean vs Potawatomi Disability Age Under 5 Correlation Chart

The statistical analysis conducted on geographies consisting of 233,002,612 people shows no correlation between the proportion of Immigrants from Caribbean and percentage of population with a disability under the age of 5 in the United States with a correlation coefficient (R) of -0.019 and weighted average of 1.2%. Similarly, the statistical analysis conducted on geographies consisting of 88,888,283 people shows no correlation between the proportion of Potawatomi and percentage of population with a disability under the age of 5 in the United States with a correlation coefficient (R) of 0.019 and weighted average of 1.4%, a difference of 17.4%.
Immigrants from Caribbean vs Potawatomi Disability Age Under 5

Disability Age Under 5 Correlation Summary

MeasurementImmigrants from CaribbeanPotawatomi
Minimum0.090%0.43%
Maximum4.3%33.3%
Range4.2%32.9%
Mean1.4%5.4%
Median1.3%3.2%
Interquartile 25% (IQ1)0.88%1.5%
Interquartile 75% (IQ3)1.8%5.3%
Interquartile Range (IQR)0.88%3.8%
Standard Deviation (Sample)0.81%7.7%
Standard Deviation (Population)0.80%7.5%

Similar Demographics by Disability Age Under 5

Demographics Similar to Immigrants from Caribbean by Disability Age Under 5

In terms of disability age under 5, the demographic groups most similar to Immigrants from Caribbean are Belizean (1.2%, a difference of 0.010%), Immigrants from Northern Africa (1.2%, a difference of 0.020%), Immigrants from Philippines (1.2%, a difference of 0.15%), Immigrants from Oceania (1.2%, a difference of 0.16%), and Immigrants from Venezuela (1.2%, a difference of 0.19%).
DemographicsRating | RankDisability Age Under 5
Iraqis
95.1
/100
|
#108
Exceptional
1.2%
Immigrants | Panama
95.0
/100
|
#109
Exceptional
1.2%
Immigrants | Lebanon
95.0
/100
|
#110
Exceptional
1.2%
Senegalese
94.6
/100
|
#111
Exceptional
1.2%
Immigrants | Australia
94.4
/100
|
#112
Exceptional
1.2%
Immigrants | Oceania
94.2
/100
|
#113
Exceptional
1.2%
Belizeans
93.9
/100
|
#114
Exceptional
1.2%
Immigrants | Caribbean
93.8
/100
|
#115
Exceptional
1.2%
Immigrants | Northern Africa
93.8
/100
|
#116
Exceptional
1.2%
Immigrants | Philippines
93.5
/100
|
#117
Exceptional
1.2%
Immigrants | Venezuela
93.4
/100
|
#118
Exceptional
1.2%
Bhutanese
92.5
/100
|
#119
Exceptional
1.2%
Immigrants | Eritrea
92.3
/100
|
#120
Exceptional
1.2%
Immigrants | Senegal
91.4
/100
|
#121
Exceptional
1.2%
Aleuts
90.7
/100
|
#122
Exceptional
1.2%

Demographics Similar to Potawatomi by Disability Age Under 5

In terms of disability age under 5, the demographic groups most similar to Potawatomi are Russian (1.4%, a difference of 0.13%), Immigrants from England (1.4%, a difference of 0.14%), Eastern European (1.4%, a difference of 0.17%), Bermudan (1.4%, a difference of 0.25%), and African (1.4%, a difference of 0.26%).
DemographicsRating | RankDisability Age Under 5
Spanish American Indians
2.4
/100
|
#238
Tragic
1.3%
Immigrants | Austria
2.3
/100
|
#239
Tragic
1.3%
Native Hawaiians
2.2
/100
|
#240
Tragic
1.3%
Maltese
2.2
/100
|
#241
Tragic
1.3%
Lumbee
2.1
/100
|
#242
Tragic
1.3%
Immigrants | Cameroon
1.7
/100
|
#243
Tragic
1.4%
Spaniards
1.4
/100
|
#244
Tragic
1.4%
Potawatomi
1.1
/100
|
#245
Tragic
1.4%
Russians
1.0
/100
|
#246
Tragic
1.4%
Immigrants | England
1.0
/100
|
#247
Tragic
1.4%
Eastern Europeans
1.0
/100
|
#248
Tragic
1.4%
Bermudans
1.0
/100
|
#249
Tragic
1.4%
Africans
1.0
/100
|
#250
Tragic
1.4%
Immigrants | Hungary
1.0
/100
|
#251
Tragic
1.4%
Immigrants | Scotland
0.9
/100
|
#252
Tragic
1.4%