Honduran Married-Couple Family Poverty
COMPARE
Honduran
Select to Compare
Married-Couple Family Poverty
Honduran Married-Couple Family Poverty
7.2%
POVERTY | MARRIED-COUPLE FAMILIES
0.0/ 100
METRIC RATING
316th/ 347
METRIC RANK
Honduran Married-Couple Family Poverty Correlation Chart
The statistical analysis conducted on geographies consisting of 355,775,439 people shows a weak positive correlation between the proportion of Hondurans and poverty level among married-couple families in the United States with a correlation coefficient (R) of 0.235 and weighted average of 7.2%. On average, for every 1% (one percent) increase in Hondurans within a typical geography, there is an increase of 0.16% in poverty level among married-couple families.
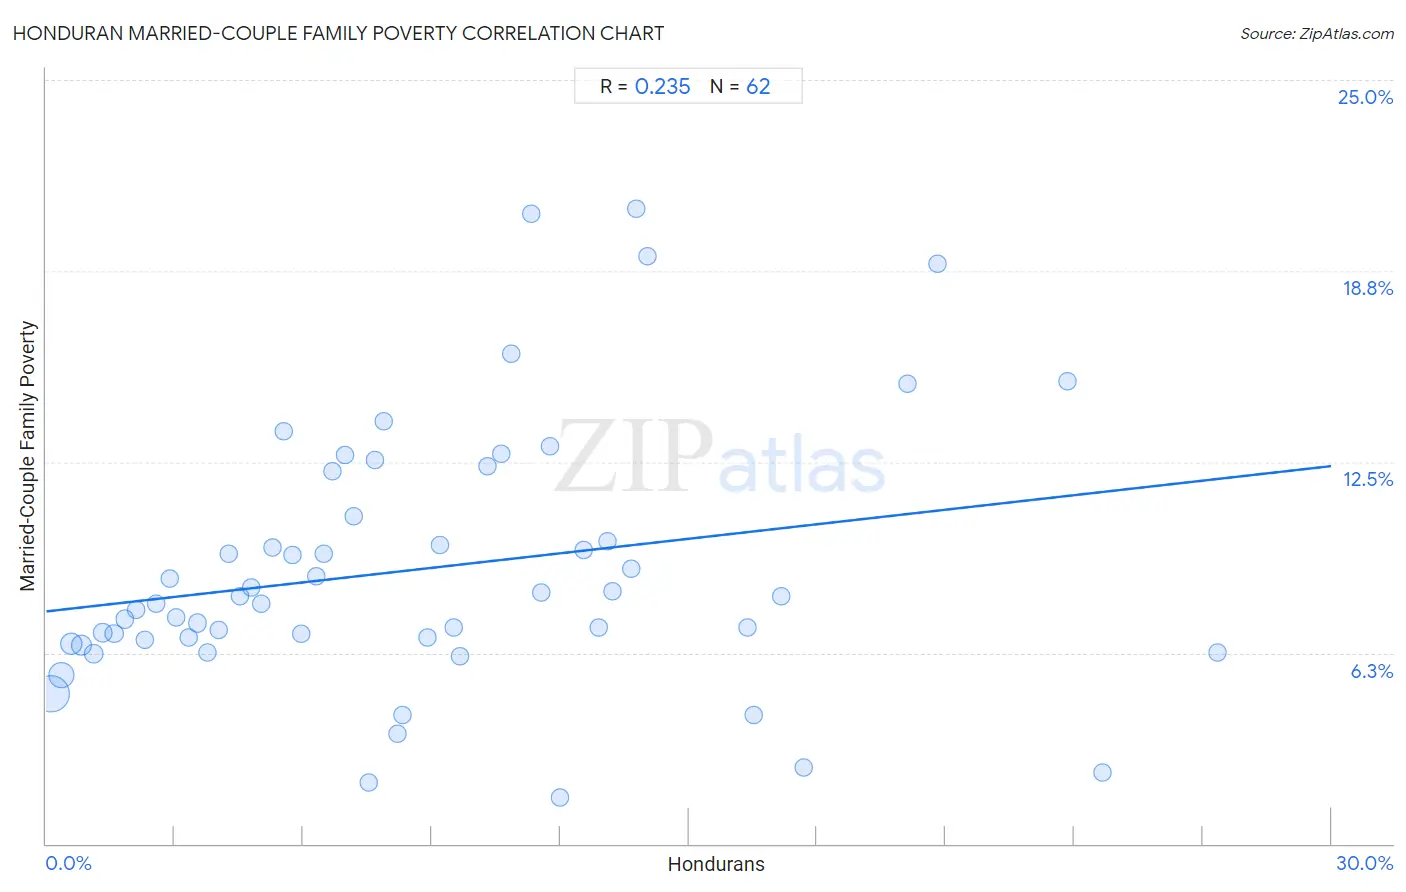
It is essential to understand that the correlation between the percentage of Hondurans and poverty level among married-couple families does not imply a direct cause-and-effect relationship. It remains uncertain whether the presence of Hondurans influences an upward or downward trend in the level of poverty level among married-couple families within an area, or if Hondurans simply ended up residing in those areas with higher or lower levels of poverty level among married-couple families due to other factors.
Demographics Similar to Hondurans by Married-Couple Family Poverty
In terms of married-couple family poverty, the demographic groups most similar to Hondurans are Inupiat (7.1%, a difference of 0.15%), Mexican (7.2%, a difference of 0.31%), British West Indian (7.1%, a difference of 0.39%), Immigrants from Guatemala (7.2%, a difference of 0.48%), and Immigrants from Latin America (7.2%, a difference of 0.65%).
| Demographics | Rating | Rank | Married-Couple Family Poverty |
| Hopi | 0.0 /100 | #309 | Tragic 7.1% |
| Immigrants from Nicaragua | 0.0 /100 | #310 | Tragic 7.1% |
| Immigrants from Dominica | 0.0 /100 | #311 | Tragic 7.1% |
| Immigrants from Armenia | 0.0 /100 | #312 | Tragic 7.1% |
| Immigrants from St. Vincent and the Grenadines | 0.0 /100 | #313 | Tragic 7.1% |
| British West Indians | 0.0 /100 | #314 | Tragic 7.1% |
| Inupiat | 0.0 /100 | #315 | Tragic 7.1% |
| Hondurans | 0.0 /100 | #316 | Tragic 7.2% |
| Mexicans | 0.0 /100 | #317 | Tragic 7.2% |
| Immigrants from Guatemala | 0.0 /100 | #318 | Tragic 7.2% |
| Immigrants from Latin America | 0.0 /100 | #319 | Tragic 7.2% |
| Immigrants from Grenada | 0.0 /100 | #320 | Tragic 7.3% |
| Immigrants from Caribbean | 0.0 /100 | #321 | Tragic 7.3% |
| Immigrants from Honduras | 0.0 /100 | #322 | Tragic 7.3% |
| Vietnamese | 0.0 /100 | #323 | Tragic 7.4% |
Honduran Married-Couple Family Poverty Correlation Summary
| Measurement | Honduran Data | Married-Couple Family Poverty Data |
| Minimum | 0.10% | 1.5% |
| Maximum | 27.3% | 20.8% |
| Range | 27.2% | 19.3% |
| Mean | 8.8% | 9.0% |
| Median | 7.6% | 8.0% |
| Interquartile 25% (IQ1) | 3.8% | 6.7% |
| Interquartile 75% (IQ3) | 12.5% | 10.7% |
| Interquartile Range (IQR) | 8.8% | 4.0% |
| Standard Deviation (Sample) | 6.4% | 4.3% |
| Standard Deviation (Population) | 6.3% | 4.3% |
Correlation Details
| Honduran Percentile | Sample Size | Married-Couple Family Poverty |
[ 0.0% - 0.5% ] 0.10% | 180,424,129 | 4.9% |
[ 0.0% - 0.5% ] 0.36% | 69,390,098 | 5.5% |
[ 0.5% - 1.0% ] 0.59% | 35,387,733 | 6.6% |
[ 0.5% - 1.0% ] 0.83% | 20,339,838 | 6.5% |
[ 1.0% - 1.5% ] 1.10% | 13,043,934 | 6.2% |
[ 1.0% - 1.5% ] 1.33% | 7,962,152 | 6.9% |
[ 1.5% - 2.0% ] 1.58% | 4,098,652 | 6.9% |
[ 1.5% - 2.0% ] 1.83% | 3,735,165 | 7.4% |
[ 2.0% - 2.5% ] 2.09% | 2,613,218 | 7.7% |
[ 2.0% - 2.5% ] 2.30% | 3,335,190 | 6.7% |
[ 2.5% - 3.0% ] 2.57% | 1,970,066 | 7.9% |
[ 2.5% - 3.0% ] 2.88% | 4,232,896 | 8.7% |
[ 3.0% - 3.5% ] 3.05% | 1,527,048 | 7.4% |
[ 3.0% - 3.5% ] 3.32% | 732,470 | 6.8% |
[ 3.5% - 4.0% ] 3.54% | 914,735 | 7.2% |
[ 3.5% - 4.0% ] 3.78% | 715,221 | 6.3% |
[ 4.0% - 4.5% ] 4.02% | 603,755 | 7.0% |
[ 4.0% - 4.5% ] 4.27% | 507,258 | 9.5% |
[ 4.5% - 5.0% ] 4.53% | 637,997 | 8.1% |
[ 4.5% - 5.0% ] 4.78% | 320,255 | 8.4% |
[ 5.0% - 5.5% ] 5.01% | 461,529 | 7.9% |
[ 5.0% - 5.5% ] 5.29% | 419,923 | 9.7% |
[ 5.5% - 6.0% ] 5.53% | 75,900 | 13.5% |
[ 5.5% - 6.0% ] 5.74% | 201,880 | 9.5% |
[ 5.5% - 6.0% ] 5.96% | 184,616 | 6.9% |
[ 6.0% - 6.5% ] 6.30% | 75,754 | 8.8% |
[ 6.0% - 6.5% ] 6.48% | 32,132 | 9.5% |
[ 6.5% - 7.0% ] 6.69% | 598,911 | 12.2% |
[ 6.5% - 7.0% ] 6.97% | 153,379 | 12.7% |
[ 7.0% - 7.5% ] 7.19% | 90,964 | 10.7% |
[ 7.5% - 8.0% ] 7.52% | 46,811 | 2.0% |
[ 7.5% - 8.0% ] 7.66% | 62,303 | 12.5% |
[ 7.5% - 8.0% ] 7.88% | 84,865 | 13.8% |
[ 8.0% - 8.5% ] 8.21% | 1,511 | 3.6% |
[ 8.0% - 8.5% ] 8.32% | 9,311 | 4.2% |
[ 8.5% - 9.0% ] 8.91% | 29,797 | 6.7% |
[ 9.0% - 9.5% ] 9.20% | 133,414 | 9.8% |
[ 9.5% - 10.0% ] 9.51% | 67,539 | 7.1% |
[ 9.5% - 10.0% ] 9.67% | 11,924 | 6.2% |
[ 10.0% - 10.5% ] 10.29% | 34,918 | 12.4% |
[ 10.5% - 11.0% ] 10.63% | 70,474 | 12.8% |
[ 10.5% - 11.0% ] 10.85% | 60,388 | 16.0% |
[ 11.0% - 11.5% ] 11.32% | 74,024 | 20.6% |
[ 11.5% - 12.0% ] 11.54% | 61,156 | 8.2% |
[ 11.5% - 12.0% ] 11.76% | 8,750 | 13.0% |
[ 11.5% - 12.0% ] 12.00% | 842 | 1.5% |
[ 12.5% - 13.0% ] 12.54% | 1,699 | 9.6% |
[ 12.5% - 13.0% ] 12.90% | 5,030 | 7.1% |
[ 13.0% - 13.5% ] 13.09% | 32,303 | 9.9% |
[ 13.0% - 13.5% ] 13.21% | 17,640 | 8.3% |
[ 13.5% - 14.0% ] 13.67% | 16,743 | 9.0% |
[ 13.5% - 14.0% ] 13.79% | 28,306 | 20.8% |
[ 14.0% - 14.5% ] 14.04% | 59,121 | 19.2% |
[ 16.0% - 16.5% ] 16.36% | 26,105 | 7.1% |
[ 16.5% - 17.0% ] 16.53% | 7,556 | 4.2% |
[ 17.0% - 17.5% ] 17.16% | 16,930 | 8.1% |
[ 17.5% - 18.0% ] 17.69% | 944 | 2.5% |
[ 20.0% - 20.5% ] 20.10% | 2,304 | 15.1% |
[ 20.5% - 21.0% ] 20.80% | 8,989 | 19.0% |
[ 23.5% - 24.0% ] 23.86% | 2,712 | 15.1% |
[ 24.5% - 25.0% ] 24.67% | 3,559 | 2.3% |
[ 27.0% - 27.5% ] 27.34% | 673 | 6.2% |