Hmong 1 or more Vehicles in Household
COMPARE
Hmong
Select to Compare
1 or more Vehicles in Household
Hmong 1 or more Vehicles in Household
89.6%
1+ VEHICLES AVAILABLE
45.8/ 100
METRIC RATING
177th/ 347
METRIC RANK
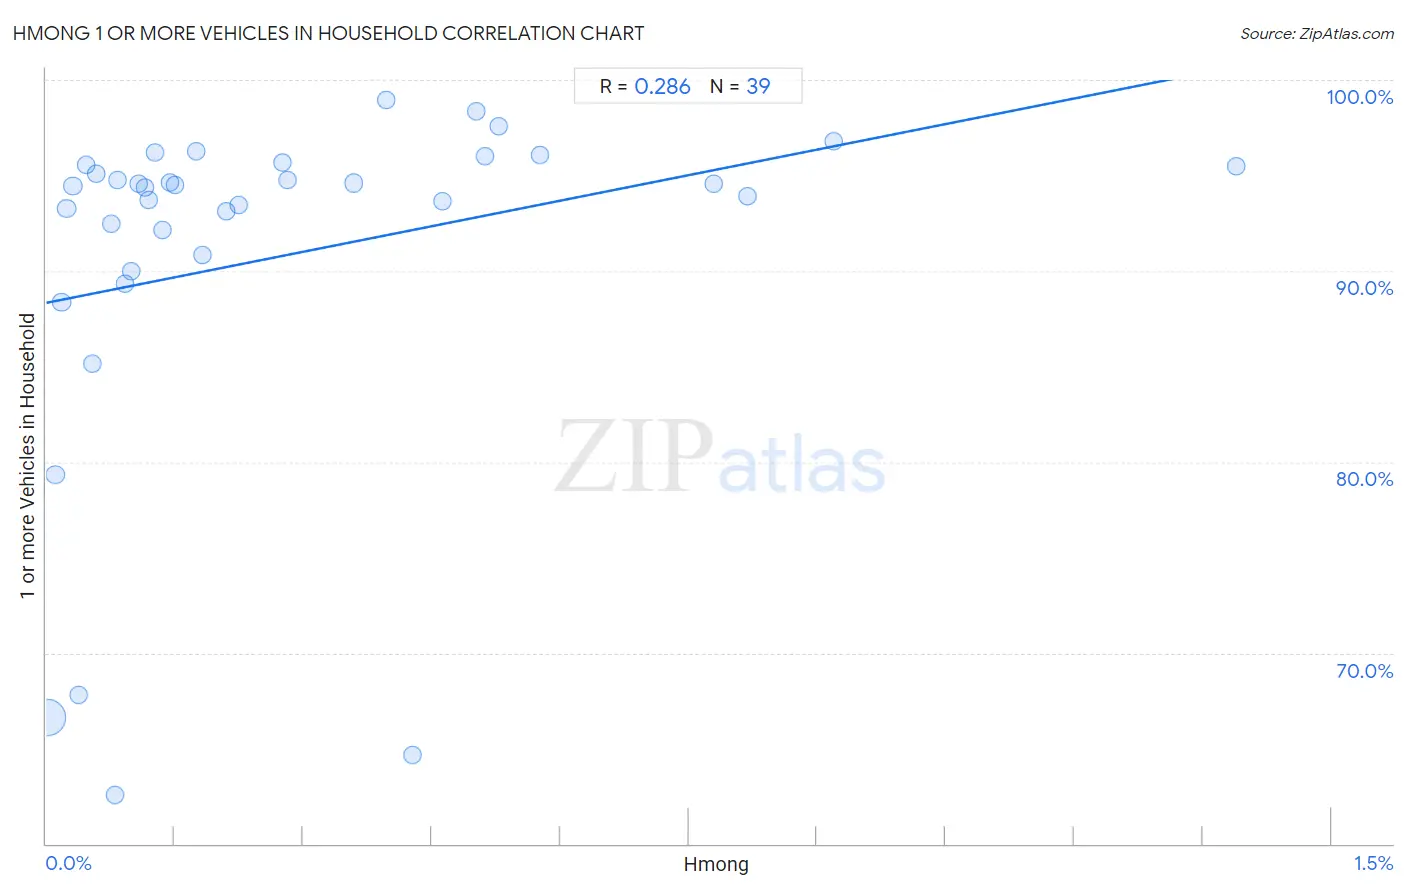
Hmong 1 or more Vehicles in Household Correlation Chart
The statistical analysis conducted on geographies consisting of 24,678,157 people shows a weak positive correlation between the proportion of Hmong and percentage of households with 1 or more vehicles available in the United States with a correlation coefficient (R) of 0.286 and weighted average of 89.6%. On average, for every 1% (one percent) increase in Hmong within a typical geography, there is an increase of 8.9% in percentage of households with 1 or more vehicles available.
It is essential to understand that the correlation between the percentage of Hmong and percentage of households with 1 or more vehicles available does not imply a direct cause-and-effect relationship. It remains uncertain whether the presence of Hmong influences an upward or downward trend in the level of percentage of households with 1 or more vehicles available within an area, or if Hmong simply ended up residing in those areas with higher or lower levels of percentage of households with 1 or more vehicles available due to other factors.
Demographics Similar to Hmong by 1 or more Vehicles in Household
In terms of 1 or more vehicles in household, the demographic groups most similar to Hmong are Immigrants from Sudan (89.7%, a difference of 0.020%), Immigrants from Burma/Myanmar (89.7%, a difference of 0.030%), Immigrants from El Salvador (89.6%, a difference of 0.030%), German Russian (89.6%, a difference of 0.030%), and Arab (89.6%, a difference of 0.040%).
| Demographics | Rating | Rank | 1 or more Vehicles in Household |
| Immigrants from Costa Rica | 57.6 /100 | #170 | Average 89.8% |
| French American Indians | 54.4 /100 | #171 | Average 89.8% |
| Indonesians | 53.0 /100 | #172 | Average 89.7% |
| Lumbee | 52.8 /100 | #173 | Average 89.7% |
| Filipinos | 50.0 /100 | #174 | Average 89.7% |
| Immigrants from Burma/Myanmar | 47.6 /100 | #175 | Average 89.7% |
| Immigrants from Sudan | 47.1 /100 | #176 | Average 89.7% |
| Hmong | 45.8 /100 | #177 | Average 89.6% |
| Immigrants from El Salvador | 44.1 /100 | #178 | Average 89.6% |
| German Russians | 44.0 /100 | #179 | Average 89.6% |
| Arabs | 43.3 /100 | #180 | Average 89.6% |
| Immigrants from Ethiopia | 42.5 /100 | #181 | Average 89.6% |
| Ukrainians | 42.4 /100 | #182 | Average 89.6% |
| Ethiopians | 41.2 /100 | #183 | Average 89.6% |
| Immigrants from Bulgaria | 40.7 /100 | #184 | Average 89.6% |
Hmong 1 or more Vehicles in Household Correlation Summary
| Measurement | Hmong Data | 1 or more Vehicles in Household Data |
| Minimum | 0.0014% | 62.6% |
| Maximum | 1.4% | 99.0% |
| Range | 1.4% | 36.4% |
| Mean | 0.27% | 90.8% |
| Median | 0.14% | 94.5% |
| Interquartile 25% (IQ1) | 0.076% | 90.8% |
| Interquartile 75% (IQ3) | 0.43% | 95.5% |
| Interquartile Range (IQR) | 0.35% | 4.7% |
| Standard Deviation (Sample) | 0.30% | 9.4% |
| Standard Deviation (Population) | 0.30% | 9.3% |
Correlation Details
| Hmong Percentile | Sample Size | 1 or more Vehicles in Household |
[ 0.0% - 0.5% ] 0.0014% | 20,776,297 | 66.6% |
[ 0.0% - 0.5% ] 0.011% | 606,587 | 79.3% |
[ 0.0% - 0.5% ] 0.018% | 619,819 | 88.4% |
[ 0.0% - 0.5% ] 0.024% | 529,135 | 93.3% |
[ 0.0% - 0.5% ] 0.031% | 540,131 | 94.5% |
[ 0.0% - 0.5% ] 0.038% | 194,445 | 67.8% |
[ 0.0% - 0.5% ] 0.047% | 199,126 | 95.5% |
[ 0.0% - 0.5% ] 0.053% | 232,793 | 85.2% |
[ 0.0% - 0.5% ] 0.058% | 35,976 | 95.1% |
[ 0.0% - 0.5% ] 0.076% | 17,117 | 92.5% |
[ 0.0% - 0.5% ] 0.080% | 73,735 | 62.6% |
[ 0.0% - 0.5% ] 0.084% | 41,849 | 94.7% |
[ 0.0% - 0.5% ] 0.092% | 60,986 | 89.3% |
[ 0.0% - 0.5% ] 0.099% | 51,765 | 90.0% |
[ 0.0% - 0.5% ] 0.11% | 103,080 | 94.5% |
[ 0.0% - 0.5% ] 0.11% | 49,747 | 94.3% |
[ 0.0% - 0.5% ] 0.12% | 72,435 | 93.7% |
[ 0.0% - 0.5% ] 0.13% | 13,425 | 96.2% |
[ 0.0% - 0.5% ] 0.14% | 38,964 | 92.1% |
[ 0.0% - 0.5% ] 0.14% | 25,625 | 94.6% |
[ 0.0% - 0.5% ] 0.15% | 39,182 | 94.5% |
[ 0.0% - 0.5% ] 0.17% | 25,176 | 96.3% |
[ 0.0% - 0.5% ] 0.18% | 51,926 | 90.8% |
[ 0.0% - 0.5% ] 0.21% | 12,892 | 93.1% |
[ 0.0% - 0.5% ] 0.22% | 50,298 | 93.5% |
[ 0.0% - 0.5% ] 0.28% | 2,534 | 95.6% |
[ 0.0% - 0.5% ] 0.28% | 15,628 | 94.7% |
[ 0.0% - 0.5% ] 0.36% | 44,073 | 94.6% |
[ 0.0% - 0.5% ] 0.40% | 503 | 99.0% |
[ 0.0% - 0.5% ] 0.43% | 8,418 | 64.7% |
[ 0.0% - 0.5% ] 0.46% | 4,965 | 93.7% |
[ 0.5% - 1.0% ] 0.50% | 796 | 98.3% |
[ 0.5% - 1.0% ] 0.51% | 64,952 | 96.0% |
[ 0.5% - 1.0% ] 0.53% | 7,567 | 97.6% |
[ 0.5% - 1.0% ] 0.58% | 9,203 | 96.1% |
[ 0.5% - 1.0% ] 0.78% | 11,544 | 94.6% |
[ 0.5% - 1.0% ] 0.82% | 10,997 | 93.9% |
[ 0.5% - 1.0% ] 0.92% | 34,178 | 96.8% |
[ 1.0% - 1.5% ] 1.39% | 288 | 95.5% |