Guatemalan 1 or more Vehicles in Household
COMPARE
Guatemalan
Select to Compare
1 or more Vehicles in Household
Guatemalan 1 or more Vehicles in Household
89.2%
1+ VEHICLES AVAILABLE
17.8/ 100
METRIC RATING
205th/ 347
METRIC RANK
Guatemalan 1 or more Vehicles in Household Correlation Chart
The statistical analysis conducted on geographies consisting of 409,296,484 people shows a mild positive correlation between the proportion of Guatemalans and percentage of households with 1 or more vehicles available in the United States with a correlation coefficient (R) of 0.319 and weighted average of 89.2%. On average, for every 1% (one percent) increase in Guatemalans within a typical geography, there is an increase of 0.13% in percentage of households with 1 or more vehicles available.
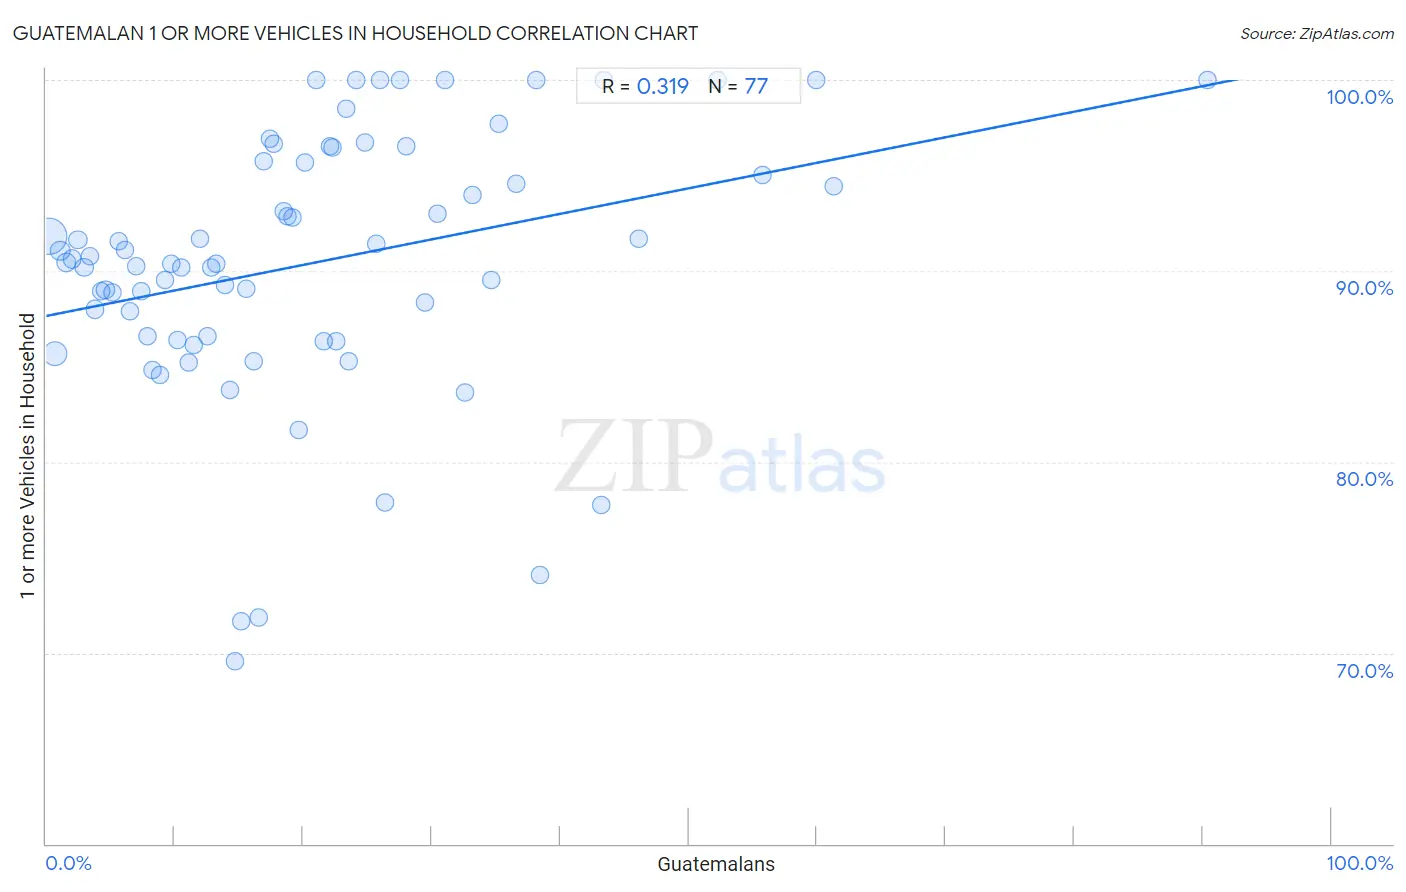
It is essential to understand that the correlation between the percentage of Guatemalans and percentage of households with 1 or more vehicles available does not imply a direct cause-and-effect relationship. It remains uncertain whether the presence of Guatemalans influences an upward or downward trend in the level of percentage of households with 1 or more vehicles available within an area, or if Guatemalans simply ended up residing in those areas with higher or lower levels of percentage of households with 1 or more vehicles available due to other factors.
Demographics Similar to Guatemalans by 1 or more Vehicles in Household
In terms of 1 or more vehicles in household, the demographic groups most similar to Guatemalans are Romanian (89.2%, a difference of 0.010%), Cambodian (89.2%, a difference of 0.030%), Iroquois (89.2%, a difference of 0.050%), Apache (89.1%, a difference of 0.050%), and Immigrants from Western Europe (89.2%, a difference of 0.070%).
| Demographics | Rating | Rank | 1 or more Vehicles in Household |
| Pennsylvania Germans | 22.9 /100 | #198 | Fair 89.3% |
| Immigrants from Asia | 22.8 /100 | #199 | Fair 89.3% |
| Central Americans | 21.4 /100 | #200 | Fair 89.2% |
| Immigrants from Western Europe | 20.5 /100 | #201 | Fair 89.2% |
| Iroquois | 19.8 /100 | #202 | Poor 89.2% |
| Cambodians | 18.9 /100 | #203 | Poor 89.2% |
| Romanians | 18.2 /100 | #204 | Poor 89.2% |
| Guatemalans | 17.8 /100 | #205 | Poor 89.2% |
| Apache | 16.2 /100 | #206 | Poor 89.1% |
| Immigrants from Denmark | 14.8 /100 | #207 | Poor 89.1% |
| Immigrants from Chile | 14.4 /100 | #208 | Poor 89.1% |
| Immigrants from Italy | 14.0 /100 | #209 | Poor 89.1% |
| Dutch West Indians | 13.5 /100 | #210 | Poor 89.0% |
| Sierra Leoneans | 13.0 /100 | #211 | Poor 89.0% |
| Somalis | 12.8 /100 | #212 | Poor 89.0% |
Guatemalan 1 or more Vehicles in Household Correlation Summary
| Measurement | Guatemalan Data | 1 or more Vehicles in Household Data |
| Minimum | 0.18% | 69.6% |
| Maximum | 90.3% | 100.0% |
| Range | 90.1% | 30.4% |
| Mean | 20.6% | 90.4% |
| Median | 17.4% | 90.4% |
| Interquartile 25% (IQ1) | 8.6% | 86.5% |
| Interquartile 75% (IQ3) | 27.7% | 95.7% |
| Interquartile Range (IQR) | 19.2% | 9.3% |
| Standard Deviation (Sample) | 16.4% | 6.9% |
| Standard Deviation (Population) | 16.3% | 6.8% |
Correlation Details
| Guatemalan Percentile | Sample Size | 1 or more Vehicles in Household |
[ 0.0% - 0.5% ] 0.18% | 243,570,336 | 91.8% |
[ 0.5% - 1.0% ] 0.63% | 82,548,991 | 85.7% |
[ 1.0% - 1.5% ] 1.12% | 27,866,890 | 91.1% |
[ 1.5% - 2.0% ] 1.57% | 17,260,976 | 90.4% |
[ 2.0% - 2.5% ] 2.01% | 9,197,337 | 90.6% |
[ 2.0% - 2.5% ] 2.46% | 5,851,590 | 91.6% |
[ 2.5% - 3.0% ] 2.95% | 4,657,098 | 90.2% |
[ 3.0% - 3.5% ] 3.36% | 2,158,803 | 90.7% |
[ 3.5% - 4.0% ] 3.81% | 1,762,425 | 88.0% |
[ 4.0% - 4.5% ] 4.26% | 1,701,034 | 88.9% |
[ 4.5% - 5.0% ] 4.61% | 4,930,404 | 89.0% |
[ 5.0% - 5.5% ] 5.17% | 1,068,926 | 88.9% |
[ 5.5% - 6.0% ] 5.67% | 605,535 | 91.5% |
[ 6.0% - 6.5% ] 6.12% | 593,126 | 91.1% |
[ 6.5% - 7.0% ] 6.52% | 487,760 | 87.9% |
[ 6.5% - 7.0% ] 6.97% | 447,690 | 90.2% |
[ 7.0% - 7.5% ] 7.38% | 642,901 | 88.9% |
[ 7.5% - 8.0% ] 7.85% | 390,261 | 86.6% |
[ 8.0% - 8.5% ] 8.30% | 440,874 | 84.8% |
[ 8.5% - 9.0% ] 8.82% | 293,822 | 84.6% |
[ 9.0% - 9.5% ] 9.22% | 309,804 | 89.5% |
[ 9.5% - 10.0% ] 9.72% | 267,864 | 90.4% |
[ 10.0% - 10.5% ] 10.22% | 345,791 | 86.4% |
[ 10.5% - 11.0% ] 10.54% | 251,119 | 90.2% |
[ 11.0% - 11.5% ] 11.07% | 355,940 | 85.2% |
[ 11.5% - 12.0% ] 11.50% | 139,507 | 86.1% |
[ 11.5% - 12.0% ] 11.94% | 89,720 | 91.7% |
[ 12.5% - 13.0% ] 12.51% | 126,968 | 86.6% |
[ 12.5% - 13.0% ] 12.83% | 24,506 | 90.2% |
[ 13.0% - 13.5% ] 13.23% | 136,897 | 90.4% |
[ 13.5% - 14.0% ] 13.87% | 102,117 | 89.3% |
[ 14.0% - 14.5% ] 14.27% | 46,773 | 83.8% |
[ 14.5% - 15.0% ] 14.69% | 31,874 | 69.6% |
[ 15.0% - 15.5% ] 15.17% | 5,670 | 71.7% |
[ 15.5% - 16.0% ] 15.56% | 81,504 | 89.1% |
[ 16.0% - 16.5% ] 16.13% | 79,754 | 85.3% |
[ 16.5% - 17.0% ] 16.59% | 39,022 | 71.8% |
[ 16.5% - 17.0% ] 16.94% | 13,633 | 95.7% |
[ 17.0% - 17.5% ] 17.38% | 3,555 | 96.9% |
[ 17.5% - 18.0% ] 17.66% | 11,000 | 96.6% |
[ 18.5% - 19.0% ] 18.51% | 1,275 | 93.1% |
[ 18.5% - 19.0% ] 18.73% | 7,495 | 92.8% |
[ 19.0% - 19.5% ] 19.19% | 12,915 | 92.8% |
[ 19.5% - 20.0% ] 19.62% | 102,397 | 81.6% |
[ 20.0% - 20.5% ] 20.13% | 5,043 | 95.7% |
[ 20.5% - 21.0% ] 20.97% | 267 | 100.0% |
[ 21.5% - 22.0% ] 21.63% | 39,358 | 86.3% |
[ 22.0% - 22.5% ] 22.04% | 20,072 | 96.5% |
[ 22.0% - 22.5% ] 22.25% | 6,624 | 96.4% |
[ 22.5% - 23.0% ] 22.60% | 36,405 | 86.3% |
[ 23.0% - 23.5% ] 23.33% | 553 | 98.5% |
[ 23.5% - 24.0% ] 23.56% | 50,387 | 85.3% |
[ 24.0% - 24.5% ] 24.10% | 83 | 100.0% |
[ 24.5% - 25.0% ] 24.76% | 7,932 | 96.7% |
[ 25.5% - 26.0% ] 25.67% | 1,796 | 91.4% |
[ 26.0% - 26.5% ] 26.00% | 50 | 100.0% |
[ 26.0% - 26.5% ] 26.37% | 5,547 | 77.9% |
[ 27.0% - 27.5% ] 27.49% | 211 | 100.0% |
[ 27.5% - 28.0% ] 27.98% | 2,205 | 96.5% |
[ 29.0% - 29.5% ] 29.43% | 10,418 | 88.3% |
[ 30.0% - 30.5% ] 30.49% | 879 | 93.0% |
[ 31.0% - 31.5% ] 31.07% | 634 | 100.0% |
[ 32.5% - 33.0% ] 32.60% | 2,506 | 83.6% |
[ 33.0% - 33.5% ] 33.22% | 5,759 | 94.0% |
[ 34.5% - 35.0% ] 34.63% | 10,371 | 89.6% |
[ 35.0% - 35.5% ] 35.17% | 981 | 97.7% |
[ 36.5% - 37.0% ] 36.61% | 631 | 94.6% |
[ 38.0% - 38.5% ] 38.10% | 42 | 100.0% |
[ 38.0% - 38.5% ] 38.46% | 182 | 74.1% |
[ 43.0% - 43.5% ] 43.14% | 21,778 | 77.7% |
[ 43.0% - 43.5% ] 43.43% | 175 | 100.0% |
[ 46.0% - 46.5% ] 46.15% | 182 | 91.7% |
[ 52.0% - 52.5% ] 52.21% | 113 | 100.0% |
[ 55.5% - 56.0% ] 55.70% | 149 | 95.0% |
[ 59.5% - 60.0% ] 59.89% | 1,112 | 100.0% |
[ 61.0% - 61.5% ] 61.24% | 129 | 94.4% |
[ 90.0% - 90.5% ] 90.32% | 31 | 100.0% |