German Russian Married-Couple Family Poverty

COMPARE

German Russian
Race
Ancestry
AfghanAfricanAlaska NativeAlaskan AthabascanAlbanianAleutAlsatianAmericanApacheArabArapahoArgentineanArmenianAssyrian/Chaldean/SyriacAustralianAustrianBahamianBangladeshiBarbadianBasqueBelgianBelizeanBermudanBhutaneseBlackfeetBolivianBrazilianBritishBritish West IndianBulgarianBurmeseCajunCambodianCanadianCape VerdeanCarpatho RusynCelticCentral AmericanCentral American IndianCherokeeCheyenneChickasawChileanChineseChippewaChoctawColombianColvilleComancheCosta RicanCreeCreekCroatianCrowCubanCypriotCzechCzechoslovakianDanishDelawareDominicanDutchDutch West IndianEastern EuropeanEcuadorianEgyptianEnglishEstonianEthiopianEuropeanFijianFilipinoFinnishFrenchFrench American IndianFrench CanadianGermanGerman RussianGhanaianGreekGuamanian/ChamorroGuatemalanGuyaneseHaitianHmongHonduranHopiHoumaHungarianIcelanderIndian (Asian)IndonesianInupiatIranianIraqiIrishIroquoisIsraeliItalianJamaicanJapaneseJordanianKenyanKiowaKoreanLaotianLatvianLebaneseLiberianLithuanianLumbeeLuxembourgerMacedonianMalaysianMalteseMarshalleseMenomineeMexicanMexican American IndianMongolianMoroccanNative HawaiianNavajoNepaleseNew ZealanderNicaraguanNigerianNorthern EuropeanNorwegianOkinawanOsageOttawaPaiutePakistaniPalestinianPanamanianParaguayanPennsylvania GermanPeruvianPimaPolishPortuguesePotawatomiPuebloPuerto RicanPuget Sound SalishRomanianRussianSalvadoranSamoanScandinavianScotch-IrishScottishSeminoleSenegaleseSerbianShoshoneSierra LeoneanSiouxSlavicSlovakSloveneSomaliSouth AfricanSouth AmericanSouth American IndianSoviet UnionSpaniardSpanishSpanish AmericanSpanish American IndianSri LankanSubsaharan AfricanSudaneseSwedishSwissSyrianTaiwaneseThaiTlingit-HaidaTohono O'OdhamTonganTrinidadian and TobagonianTsimshianTurkishU.S. Virgin IslanderUgandanUkrainianUruguayanUteVenezuelanVietnameseWelshWest IndianYakamaYaquiYugoslavianYumanYup'ikZimbabwean
Immigration
NonimmigrantsImmigrantsAfghanistanAfricaAlbaniaArgentinaArmeniaAsiaAustraliaAustriaBahamasBangladeshBarbadosBelarusBelgiumBelizeBoliviaBosnia and HerzegovinaBrazilBulgariaBurma/MyanmarCabo VerdeCambodiaCameroonCanadaCaribbeanCentral AmericaChileChinaColombiaCongoCosta RicaCroatiaCubaCzechoslovakiaDenmarkDominicaDominican RepublicEastern AfricaEastern AsiaEastern EuropeEcuadorEgyptEl SalvadorEnglandEritreaEthiopiaEuropeFijiFranceGermanyGhanaGreeceGrenadaGuatemalaGuyanaHaitiHondurasHong KongHungaryIndiaIndonesiaIranIraqIrelandIsraelItalyJamaicaJapanJordanKazakhstanKenyaKoreaKuwaitLaosLatin AmericaLatviaLebanonLiberiaLithuaniaMalaysiaMexicoMicronesiaMiddle AfricaMoldovaMoroccoNepalNetherlandsNicaraguaNigeriaNorth AmericaNorth MacedoniaNorthern AfricaNorthern EuropeNorwayOceaniaPakistanPanamaPeruPhilippinesPolandPortugalRomaniaRussiaSaudi ArabiaScotlandSenegalSerbiaSierra LeoneSingaporeSomaliaSouth AfricaSouth AmericaSouth Central AsiaSouth Eastern AsiaSouthern EuropeSpainSri LankaSt. Vincent and the GrenadinesSudanSwedenSwitzerlandSyriaTaiwanThailandTrinidad and TobagoTurkeyUgandaUkraineUruguayUzbekistanVenezuelaVietnamWest IndiesWestern AfricaWestern AsiaWestern EuropeYemenZaireZimbabweAzores
Select to Compare
Race
Ancestry
AfghanAfricanAlaska NativeAlaskan AthabascanAlbanianAleutAlsatianAmericanApacheArabArapahoArgentineanArmenianAssyrian/Chaldean/SyriacAustralianAustrianBahamianBangladeshiBarbadianBasqueBelgianBelizeanBermudanBhutaneseBlackfeetBolivianBrazilianBritishBritish West IndianBulgarianBurmeseCajunCambodianCanadianCape VerdeanCarpatho RusynCelticCentral AmericanCentral American IndianCherokeeCheyenneChickasawChileanChineseChippewaChoctawColombianColvilleComancheCosta RicanCreeCreekCroatianCrowCubanCypriotCzechCzechoslovakianDanishDelawareDominicanDutchDutch West IndianEastern EuropeanEcuadorianEgyptianEnglishEstonianEthiopianEuropeanFijianFilipinoFinnishFrenchFrench American IndianFrench CanadianGermanGhanaianGreekGuamanian/ChamorroGuatemalanGuyaneseHaitianHmongHonduranHopiHoumaHungarianIcelanderIndian (Asian)IndonesianInupiatIranianIraqiIrishIroquoisIsraeliItalianJamaicanJapaneseJordanianKenyanKiowaKoreanLaotianLatvianLebaneseLiberianLithuanianLumbeeLuxembourgerMacedonianMalaysianMalteseMarshalleseMenomineeMexicanMexican American IndianMongolianMoroccanNative HawaiianNavajoNepaleseNew ZealanderNicaraguanNigerianNorthern EuropeanNorwegianOkinawanOsageOttawaPaiutePakistaniPalestinianPanamanianParaguayanPennsylvania GermanPeruvianPimaPolishPortuguesePotawatomiPuebloPuerto RicanPuget Sound SalishRomanianRussianSalvadoranSamoanScandinavianScotch-IrishScottishSeminoleSenegaleseSerbianShoshoneSierra LeoneanSiouxSlavicSlovakSloveneSomaliSouth AfricanSouth AmericanSouth American IndianSoviet UnionSpaniardSpanishSpanish AmericanSpanish American IndianSri LankanSubsaharan AfricanSudaneseSwedishSwissSyrianTaiwaneseThaiTlingit-HaidaTohono O'OdhamTonganTrinidadian and TobagonianTsimshianTurkishU.S. Virgin IslanderUgandanUkrainianUruguayanUteVenezuelanVietnameseWelshWest IndianYakamaYaquiYugoslavianYumanYup'ikZimbabwean
Immigration
NonimmigrantsImmigrantsAfghanistanAfricaAlbaniaArgentinaArmeniaAsiaAustraliaAustriaBahamasBangladeshBarbadosBelarusBelgiumBelizeBoliviaBosnia and HerzegovinaBrazilBulgariaBurma/MyanmarCabo VerdeCambodiaCameroonCanadaCaribbeanCentral AmericaChileChinaColombiaCongoCosta RicaCroatiaCubaCzechoslovakiaDenmarkDominicaDominican RepublicEastern AfricaEastern AsiaEastern EuropeEcuadorEgyptEl SalvadorEnglandEritreaEthiopiaEuropeFijiFranceGermanyGhanaGreeceGrenadaGuatemalaGuyanaHaitiHondurasHong KongHungaryIndiaIndonesiaIranIraqIrelandIsraelItalyJamaicaJapanJordanKazakhstanKenyaKoreaKuwaitLaosLatin AmericaLatviaLebanonLiberiaLithuaniaMalaysiaMexicoMicronesiaMiddle AfricaMoldovaMoroccoNepalNetherlandsNicaraguaNigeriaNorth AmericaNorth MacedoniaNorthern AfricaNorthern EuropeNorwayOceaniaPakistanPanamaPeruPhilippinesPolandPortugalRomaniaRussiaSaudi ArabiaScotlandSenegalSerbiaSierra LeoneSingaporeSomaliaSouth AfricaSouth AmericaSouth Central AsiaSouth Eastern AsiaSouthern EuropeSpainSri LankaSt. Vincent and the GrenadinesSudanSwedenSwitzerlandSyriaTaiwanThailandTrinidad and TobagoTurkeyUgandaUkraineUruguayUzbekistanVenezuelaVietnamWest IndiesWestern AfricaWestern AsiaWestern EuropeYemenZaireZimbabweAzores
Married-Couple Family Poverty
Income
Poverty
Unemployment
Labor Participation
Family Structure
Vehicle Availability
Education Level
Disability

German Russian Married-Couple Family Poverty
Excellent

5.0%
POVERTY | MARRIED-COUPLE FAMILIES
85.1/ 100
METRIC RATING
139th/ 347
METRIC RANK

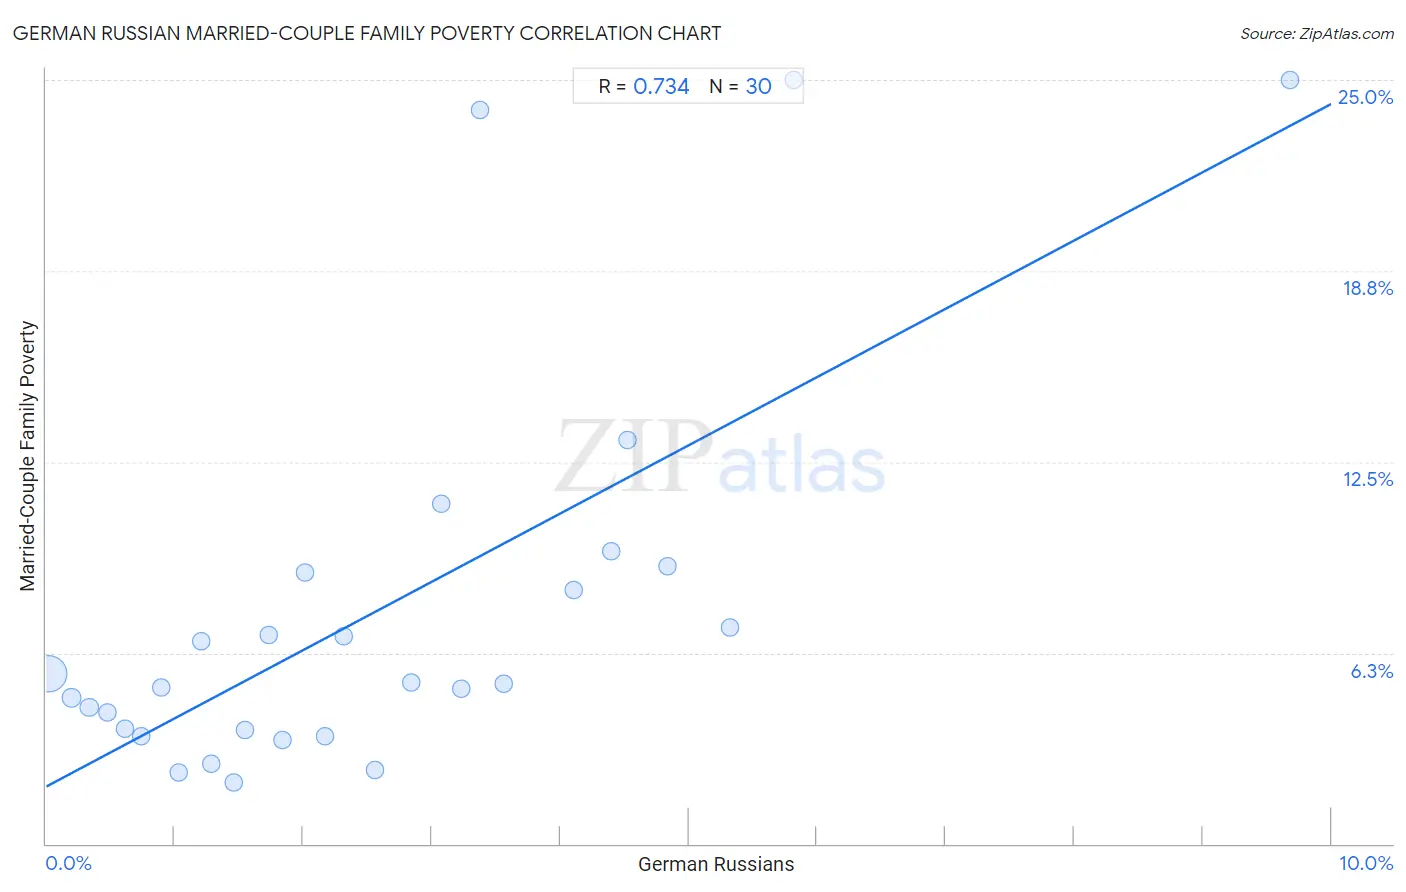
German Russian Married-Couple Family Poverty Correlation Chart

The statistical analysis conducted on geographies consisting of 96,237,761 people shows a strong positive correlation between the proportion of German Russians and poverty level among married-couple families in the United States with a correlation coefficient (R) of 0.734 and weighted average of 5.0%. On average, for every 1% (one percent) increase in German Russians within a typical geography, there is an increase of 2.2% in poverty level among married-couple families.
German Russian Married-Couple Family Poverty
It is essential to understand that the correlation between the percentage of German Russians and poverty level among married-couple families does not imply a direct cause-and-effect relationship. It remains uncertain whether the presence of German Russians influences an upward or downward trend in the level of poverty level among married-couple families within an area, or if German Russians simply ended up residing in those areas with higher or lower levels of poverty level among married-couple families due to other factors.

Demographics Similar to German Russians by Married-Couple Family Poverty

In terms of married-couple family poverty, the demographic groups most similar to German Russians are Immigrants from Portugal (5.0%, a difference of 0.060%), Immigrants from Brazil (5.0%, a difference of 0.11%), Immigrants from China (5.0%, a difference of 0.11%), Chilean (4.9%, a difference of 0.23%), and Guamanian/Chamorro (4.9%, a difference of 0.36%).
DemographicsRating | RankMarried-Couple Family Poverty
Puget Sound Salish
90.4
/100
|
#132
Exceptional
4.9%
Immigrants from Kenya
90.2
/100
|
#133
Exceptional
4.9%
Samoans
90.2
/100
|
#134
Exceptional
4.9%
Assyrians/Chaldeans/Syriacs
89.4
/100
|
#135
Excellent
4.9%
Immigrants from Hungary
88.7
/100
|
#136
Excellent
4.9%
Guamanians/Chamorros
86.5
/100
|
#137
Excellent
4.9%
Chileans
86.0
/100
|
#138
Excellent
4.9%
German Russians
85.1
/100
|
#139
Excellent
5.0%
Immigrants from Portugal
84.8
/100
|
#140
Excellent
5.0%
Immigrants from Brazil
84.6
/100
|
#141
Excellent
5.0%
Immigrants from China
84.6
/100
|
#142
Excellent
5.0%
Immigrants from Egypt
83.4
/100
|
#143
Excellent
5.0%
Hmong
83.2
/100
|
#144
Excellent
5.0%
Immigrants from Spain
79.9
/100
|
#145
Good
5.0%
Mongolians
79.8
/100
|
#146
Good
5.0%

German Russian Married-Couple Family Poverty Correlation Summary

MeasurementGerman Russian DataMarried-Couple Family Poverty Data
Minimum0.022%2.0%
Maximum9.7%25.0%
Range9.7%23.0%
Mean2.6%7.6%
Median2.1%5.3%
Interquartile 25% (IQ1)1.0%3.7%
Interquartile 75% (IQ3)3.6%8.9%
Interquartile Range (IQR)2.5%5.1%
Standard Deviation (Sample)2.1%6.4%
Standard Deviation (Population)2.1%6.3%

Correlation Details

German Russian PercentileSample SizeMarried-Couple Family Poverty
[
0.0%
-
0.5%
]
0.022%
90,532,6565.6%
[
0.0%
-
0.5%
]
0.20%
3,213,7894.8%
[
0.0%
-
0.5%
]
0.33%
1,017,8514.5%
[
0.0%
-
0.5%
]
0.48%
515,2804.3%
[
0.5%
-
1.0%
]
0.62%
277,0913.8%
[
0.5%
-
1.0%
]
0.74%
213,2363.5%
[
0.5%
-
1.0%
]
0.90%
52,0175.1%
[
1.0%
-
1.5%
]
1.03%
146,8712.3%
[
1.0%
-
1.5%
]
1.20%
95,0306.6%
[
1.0%
-
1.5%
]
1.29%
64,2992.6%
[
1.0%
-
1.5%
]
1.46%
3,9002.0%
[
1.5%
-
2.0%
]
1.55%
37,2603.7%
[
1.5%
-
2.0%
]
1.73%
1,5046.8%
[
1.5%
-
2.0%
]
1.84%
29,2313.4%
[
2.0%
-
2.5%
]
2.01%
2,1378.9%
[
2.0%
-
2.5%
]
2.17%
4,0623.5%
[
2.0%
-
2.5%
]
2.32%
7,3346.8%
[
2.5%
-
3.0%
]
2.55%
1,8402.4%
[
2.5%
-
3.0%
]
2.84%
2,2575.3%
[
3.0%
-
3.5%
]
3.08%
6511.1%
[
3.0%
-
3.5%
]
3.23%
2,1385.1%
[
3.0%
-
3.5%
]
3.37%
8924.0%
[
3.5%
-
4.0%
]
3.56%
12,5935.2%
[
4.0%
-
4.5%
]
4.10%
2,2438.3%
[
4.0%
-
4.5%
]
4.40%
4559.6%
[
4.5%
-
5.0%
]
4.52%
95113.2%
[
4.5%
-
5.0%
]
4.84%
629.1%
[
5.0%
-
5.5%
]
5.32%
8087.1%
[
5.5%
-
6.0%
]
5.82%
46425.0%
[
9.5%
-
10.0%
]
9.68%
24825.0%