French Unemployment Among Women with Children Ages 6 to 17 years
COMPARE
French
Select to Compare
Unemployment Among Women with Children Ages 6 to 17 years
French Unemployment Among Women with Children Ages 6 to 17 years
9.7%
UNEMPLOYMENT | WOMEN W/ CHILDREN 6 TO 17
0.1/ 100
METRIC RATING
278th/ 347
METRIC RANK
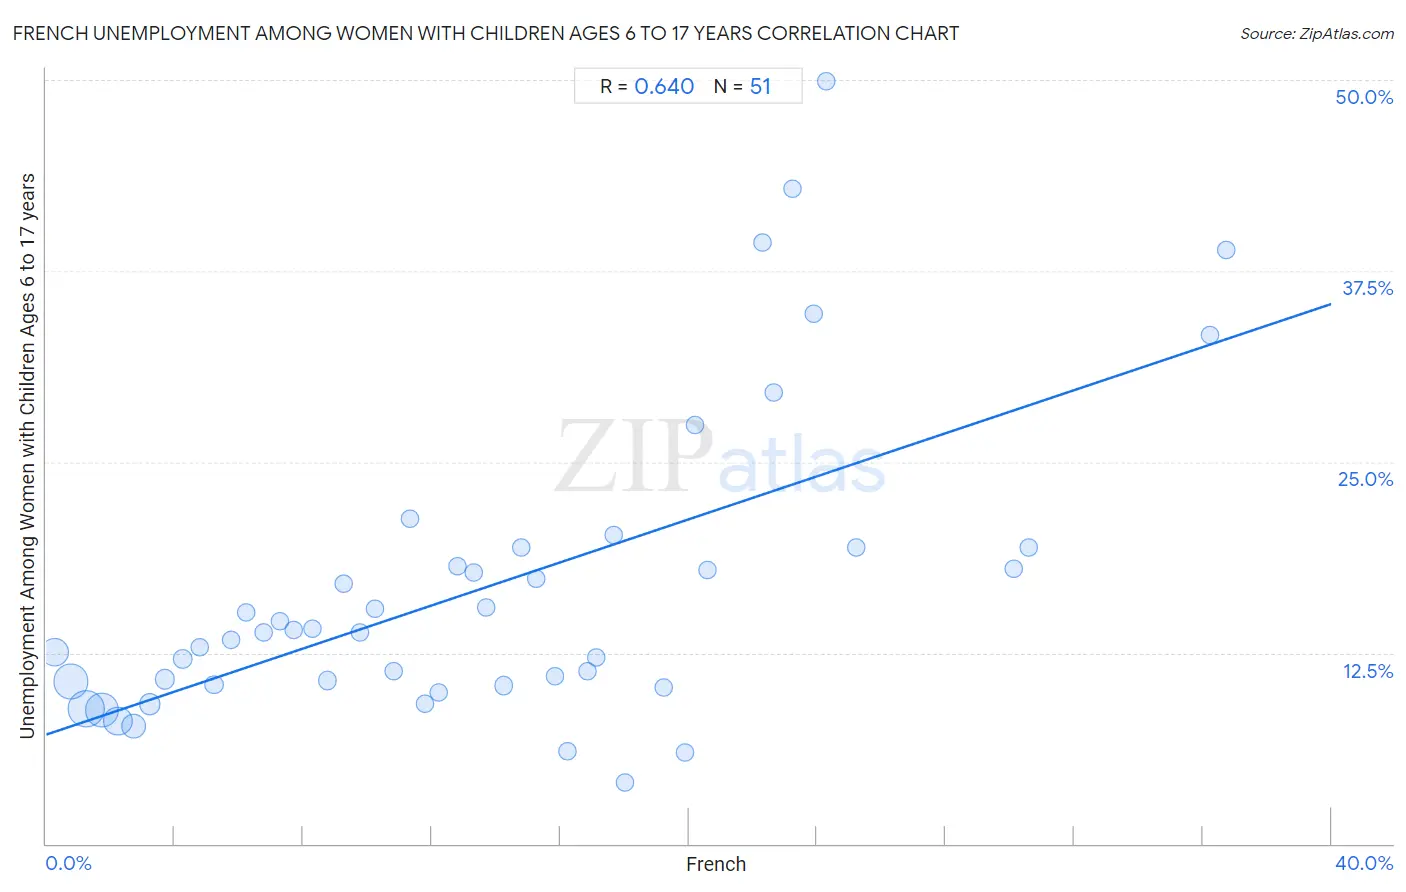
French Unemployment Among Women with Children Ages 6 to 17 years Correlation Chart
The statistical analysis conducted on geographies consisting of 357,857,640 people shows a significant positive correlation between the proportion of French and unemployment rate among women with children between the ages 6 and 17 in the United States with a correlation coefficient (R) of 0.640 and weighted average of 9.7%. On average, for every 1% (one percent) increase in French within a typical geography, there is an increase of 0.70% in unemployment rate among women with children between the ages 6 and 17.
It is essential to understand that the correlation between the percentage of French and unemployment rate among women with children between the ages 6 and 17 does not imply a direct cause-and-effect relationship. It remains uncertain whether the presence of French influences an upward or downward trend in the level of unemployment rate among women with children between the ages 6 and 17 within an area, or if French simply ended up residing in those areas with higher or lower levels of unemployment rate among women with children between the ages 6 and 17 due to other factors.
Demographics Similar to French by Unemployment Among Women with Children Ages 6 to 17 years
In terms of unemployment among women with children ages 6 to 17 years, the demographic groups most similar to French are Scotch-Irish (9.7%, a difference of 0.030%), British West Indian (9.7%, a difference of 0.070%), Immigrants from Portugal (9.7%, a difference of 0.12%), U.S. Virgin Islander (9.7%, a difference of 0.13%), and Seminole (9.7%, a difference of 0.22%).
| Demographics | Rating | Rank | Unemployment Among Women with Children Ages 6 to 17 years |
| Immigrants from Latin America | 0.1 /100 | #271 | Tragic 9.6% |
| Kiowa | 0.1 /100 | #272 | Tragic 9.6% |
| Whites/Caucasians | 0.1 /100 | #273 | Tragic 9.6% |
| Aleuts | 0.1 /100 | #274 | Tragic 9.6% |
| U.S. Virgin Islanders | 0.1 /100 | #275 | Tragic 9.7% |
| Immigrants from Portugal | 0.1 /100 | #276 | Tragic 9.7% |
| British West Indians | 0.1 /100 | #277 | Tragic 9.7% |
| French | 0.1 /100 | #278 | Tragic 9.7% |
| Scotch-Irish | 0.1 /100 | #279 | Tragic 9.7% |
| Seminole | 0.1 /100 | #280 | Tragic 9.7% |
| Jamaicans | 0.0 /100 | #281 | Tragic 9.8% |
| Slovaks | 0.0 /100 | #282 | Tragic 9.8% |
| Central American Indians | 0.0 /100 | #283 | Tragic 9.9% |
| Yakama | 0.0 /100 | #284 | Tragic 9.9% |
| Hispanics or Latinos | 0.0 /100 | #285 | Tragic 9.9% |
French Unemployment Among Women with Children Ages 6 to 17 years Correlation Summary
| Measurement | French Data | Unemployment Among Women with Children Ages 6 to 17 years Data |
| Minimum | 0.25% | 4.0% |
| Maximum | 36.7% | 49.9% |
| Range | 36.5% | 45.9% |
| Mean | 13.7% | 16.8% |
| Median | 12.8% | 13.8% |
| Interquartile 25% (IQ1) | 6.2% | 10.4% |
| Interquartile 75% (IQ3) | 19.9% | 19.4% |
| Interquartile Range (IQR) | 13.7% | 9.0% |
| Standard Deviation (Sample) | 9.1% | 10.0% |
| Standard Deviation (Population) | 9.0% | 9.9% |
Correlation Details
| French Percentile | Sample Size | Unemployment Among Women with Children Ages 6 to 17 years |
[ 0.0% - 0.5% ] 0.25% | 43,332,078 | 12.5% |
[ 0.5% - 1.0% ] 0.77% | 69,466,369 | 10.6% |
[ 1.0% - 1.5% ] 1.25% | 76,594,636 | 8.9% |
[ 1.5% - 2.0% ] 1.73% | 65,775,359 | 8.8% |
[ 2.0% - 2.5% ] 2.24% | 42,351,532 | 8.0% |
[ 2.5% - 3.0% ] 2.72% | 26,288,407 | 7.7% |
[ 3.0% - 3.5% ] 3.22% | 11,755,448 | 9.1% |
[ 3.5% - 4.0% ] 3.71% | 6,169,689 | 10.8% |
[ 4.0% - 4.5% ] 4.25% | 3,462,146 | 12.1% |
[ 4.5% - 5.0% ] 4.77% | 2,219,439 | 12.9% |
[ 5.0% - 5.5% ] 5.22% | 2,243,491 | 10.4% |
[ 5.5% - 6.0% ] 5.75% | 1,047,514 | 13.4% |
[ 6.0% - 6.5% ] 6.22% | 563,297 | 15.1% |
[ 6.5% - 7.0% ] 6.76% | 670,916 | 13.8% |
[ 7.0% - 7.5% ] 7.26% | 410,353 | 14.5% |
[ 7.5% - 8.0% ] 7.69% | 412,120 | 14.0% |
[ 8.0% - 8.5% ] 8.28% | 423,564 | 14.1% |
[ 8.5% - 9.0% ] 8.77% | 582,730 | 10.7% |
[ 9.0% - 9.5% ] 9.25% | 359,992 | 17.1% |
[ 9.5% - 10.0% ] 9.77% | 374,669 | 13.8% |
[ 10.0% - 10.5% ] 10.24% | 198,571 | 15.4% |
[ 10.5% - 11.0% ] 10.82% | 663,373 | 11.3% |
[ 11.0% - 11.5% ] 11.33% | 94,267 | 21.3% |
[ 11.5% - 12.0% ] 11.78% | 123,208 | 9.2% |
[ 12.0% - 12.5% ] 12.22% | 294,589 | 9.9% |
[ 12.5% - 13.0% ] 12.80% | 222,598 | 18.1% |
[ 13.0% - 13.5% ] 13.30% | 181,165 | 17.8% |
[ 13.5% - 14.0% ] 13.68% | 269,414 | 15.5% |
[ 14.0% - 14.5% ] 14.23% | 261,957 | 10.4% |
[ 14.5% - 15.0% ] 14.79% | 152,539 | 19.4% |
[ 15.0% - 15.5% ] 15.25% | 127,325 | 17.4% |
[ 15.5% - 16.0% ] 15.82% | 88,962 | 11.0% |
[ 16.0% - 16.5% ] 16.22% | 205,403 | 6.1% |
[ 16.5% - 17.0% ] 16.85% | 103,670 | 11.3% |
[ 17.0% - 17.5% ] 17.14% | 27,690 | 12.2% |
[ 17.5% - 18.0% ] 17.68% | 50,244 | 20.2% |
[ 18.0% - 18.5% ] 18.01% | 51,753 | 4.0% |
[ 19.0% - 19.5% ] 19.21% | 29,406 | 10.2% |
[ 19.5% - 20.0% ] 19.87% | 93,502 | 6.0% |
[ 20.0% - 20.5% ] 20.19% | 16,725 | 27.4% |
[ 20.5% - 21.0% ] 20.59% | 34,743 | 18.0% |
[ 22.0% - 22.5% ] 22.28% | 20,079 | 39.3% |
[ 22.5% - 23.0% ] 22.64% | 21,669 | 29.5% |
[ 23.0% - 23.5% ] 23.24% | 413 | 42.9% |
[ 23.5% - 24.0% ] 23.90% | 4,221 | 34.7% |
[ 24.0% - 24.5% ] 24.27% | 7,557 | 49.9% |
[ 25.0% - 25.5% ] 25.21% | 1,682 | 19.4% |
[ 30.0% - 30.5% ] 30.13% | 916 | 18.0% |
[ 30.5% - 31.0% ] 30.57% | 2,169 | 19.4% |
[ 36.0% - 36.5% ] 36.21% | 1,414 | 33.3% |
[ 36.5% - 37.0% ] 36.75% | 2,667 | 38.9% |