French Canadian vs Immigrants from Burma/Myanmar Disability Age Under 5

COMPARE

French Canadian
Race
Ancestry
AfghanAfricanAlaska NativeAlaskan AthabascanAlbanianAleutAlsatianAmericanApacheArabArapahoArgentineanArmenianAssyrian/Chaldean/SyriacAustralianAustrianBahamianBangladeshiBarbadianBasqueBelgianBelizeanBermudanBhutaneseBlackfeetBolivianBrazilianBritishBritish West IndianBulgarianBurmeseCajunCambodianCanadianCape VerdeanCarpatho RusynCelticCentral AmericanCentral American IndianCherokeeCheyenneChickasawChileanChineseChippewaChoctawColombianColvilleComancheCosta RicanCreeCreekCroatianCrowCubanCypriotCzechCzechoslovakianDanishDelawareDominicanDutchDutch West IndianEastern EuropeanEcuadorianEgyptianEnglishEstonianEthiopianEuropeanFijianFilipinoFinnishFrenchFrench American IndianFrench CanadianGermanGerman RussianGhanaianGreekGuamanian/ChamorroGuatemalanGuyaneseHaitianHmongHonduranHopiHoumaHungarianIcelanderIndian (Asian)IndonesianInupiatIranianIraqiIrishIroquoisIsraeliItalianJamaicanJapaneseJordanianKenyanKiowaKoreanLaotianLatvianLebaneseLiberianLithuanianLumbeeLuxembourgerMacedonianMalaysianMalteseMarshalleseMenomineeMexicanMexican American IndianMongolianMoroccanNative HawaiianNavajoNepaleseNew ZealanderNicaraguanNigerianNorthern EuropeanNorwegianOkinawanOsageOttawaPaiutePakistaniPalestinianPanamanianParaguayanPennsylvania GermanPeruvianPimaPolishPortuguesePotawatomiPuebloPuerto RicanPuget Sound SalishRomanianRussianSalvadoranSamoanScandinavianScotch-IrishScottishSeminoleSenegaleseSerbianShoshoneSierra LeoneanSiouxSlavicSlovakSloveneSomaliSouth AfricanSouth AmericanSouth American IndianSoviet UnionSpaniardSpanishSpanish AmericanSpanish American IndianSri LankanSubsaharan AfricanSudaneseSwedishSwissSyrianTaiwaneseThaiTlingit-HaidaTohono O'OdhamTonganTrinidadian and TobagonianTsimshianTurkishU.S. Virgin IslanderUgandanUkrainianUruguayanUteVenezuelanVietnameseWelshWest IndianYakamaYaquiYugoslavianYumanYup'ikZimbabwean
Immigration
NonimmigrantsImmigrantsAfghanistanAfricaAlbaniaArgentinaArmeniaAsiaAustraliaAustriaBahamasBangladeshBarbadosBelarusBelgiumBelizeBoliviaBosnia and HerzegovinaBrazilBulgariaCabo VerdeCambodiaCameroonCanadaCaribbeanCentral AmericaChileChinaColombiaCongoCosta RicaCroatiaCubaCzechoslovakiaDenmarkDominicaDominican RepublicEastern AfricaEastern AsiaEastern EuropeEcuadorEgyptEl SalvadorEnglandEritreaEthiopiaEuropeFijiFranceGermanyGhanaGreeceGrenadaGuatemalaGuyanaHaitiHondurasHong KongHungaryIndiaIndonesiaIranIraqIrelandIsraelItalyJamaicaJapanJordanKazakhstanKenyaKoreaKuwaitLaosLatin AmericaLatviaLebanonLiberiaLithuaniaMalaysiaMexicoMicronesiaMiddle AfricaMoldovaMoroccoNepalNetherlandsNicaraguaNigeriaNorth AmericaNorth MacedoniaNorthern AfricaNorthern EuropeNorwayOceaniaPakistanPanamaPeruPhilippinesPolandPortugalRomaniaRussiaSaudi ArabiaScotlandSenegalSerbiaSierra LeoneSingaporeSomaliaSouth AfricaSouth AmericaSouth Central AsiaSouth Eastern AsiaSouthern EuropeSpainSri LankaSt. Vincent and the GrenadinesSudanSwedenSwitzerlandSyriaTaiwanThailandTrinidad and TobagoTurkeyUgandaUkraineUruguayUzbekistanVenezuelaVietnamWest IndiesWestern AfricaWestern AsiaWestern EuropeYemenZaireZimbabweAzores
Immigrants from Burma/Myanmar
Race
Ancestry
AfghanAfricanAlaska NativeAlaskan AthabascanAlbanianAleutAlsatianAmericanApacheArabArapahoArgentineanArmenianAssyrian/Chaldean/SyriacAustralianAustrianBahamianBangladeshiBarbadianBasqueBelgianBelizeanBermudanBhutaneseBlackfeetBolivianBrazilianBritishBritish West IndianBulgarianBurmeseCajunCambodianCanadianCape VerdeanCarpatho RusynCelticCentral AmericanCentral American IndianCherokeeCheyenneChickasawChileanChineseChippewaChoctawColombianColvilleComancheCosta RicanCreeCreekCroatianCrowCubanCypriotCzechCzechoslovakianDanishDelawareDominicanDutchDutch West IndianEastern EuropeanEcuadorianEgyptianEnglishEstonianEthiopianEuropeanFijianFilipinoFinnishFrenchFrench American IndianGermanGerman RussianGhanaianGreekGuamanian/ChamorroGuatemalanGuyaneseHaitianHmongHonduranHopiHoumaHungarianIcelanderIndian (Asian)IndonesianInupiatIranianIraqiIrishIroquoisIsraeliItalianJamaicanJapaneseJordanianKenyanKiowaKoreanLaotianLatvianLebaneseLiberianLithuanianLumbeeLuxembourgerMacedonianMalaysianMalteseMarshalleseMenomineeMexicanMexican American IndianMongolianMoroccanNative HawaiianNavajoNepaleseNew ZealanderNicaraguanNigerianNorthern EuropeanNorwegianOkinawanOsageOttawaPaiutePakistaniPalestinianPanamanianParaguayanPennsylvania GermanPeruvianPimaPolishPortuguesePotawatomiPuebloPuerto RicanPuget Sound SalishRomanianRussianSalvadoranSamoanScandinavianScotch-IrishScottishSeminoleSenegaleseSerbianShoshoneSierra LeoneanSiouxSlavicSlovakSloveneSomaliSouth AfricanSouth AmericanSouth American IndianSoviet UnionSpaniardSpanishSpanish AmericanSpanish American IndianSri LankanSubsaharan AfricanSudaneseSwedishSwissSyrianTaiwaneseThaiTlingit-HaidaTohono O'OdhamTonganTrinidadian and TobagonianTsimshianTurkishU.S. Virgin IslanderUgandanUkrainianUruguayanUteVenezuelanVietnameseWelshWest IndianYakamaYaquiYugoslavianYumanYup'ikZimbabwean
Immigration
NonimmigrantsImmigrantsAfghanistanAfricaAlbaniaArgentinaArmeniaAsiaAustraliaAustriaBahamasBangladeshBarbadosBelarusBelgiumBelizeBoliviaBosnia and HerzegovinaBrazilBulgariaBurma/MyanmarCabo VerdeCambodiaCameroonCanadaCaribbeanCentral AmericaChileChinaColombiaCongoCosta RicaCroatiaCubaCzechoslovakiaDenmarkDominicaDominican RepublicEastern AfricaEastern AsiaEastern EuropeEcuadorEgyptEl SalvadorEnglandEritreaEthiopiaEuropeFijiFranceGermanyGhanaGreeceGrenadaGuatemalaGuyanaHaitiHondurasHong KongHungaryIndiaIndonesiaIranIraqIrelandIsraelItalyJamaicaJapanJordanKazakhstanKenyaKoreaKuwaitLaosLatin AmericaLatviaLebanonLiberiaLithuaniaMalaysiaMexicoMicronesiaMiddle AfricaMoldovaMoroccoNepalNetherlandsNicaraguaNigeriaNorth AmericaNorth MacedoniaNorthern AfricaNorthern EuropeNorwayOceaniaPakistanPanamaPeruPhilippinesPolandPortugalRomaniaRussiaSaudi ArabiaScotlandSenegalSerbiaSierra LeoneSingaporeSomaliaSouth AfricaSouth AmericaSouth Central AsiaSouth Eastern AsiaSouthern EuropeSpainSri LankaSt. Vincent and the GrenadinesSudanSwedenSwitzerlandSyriaTaiwanThailandTrinidad and TobagoTurkeyUgandaUkraineUruguayUzbekistanVenezuelaVietnamWest IndiesWestern AfricaWestern AsiaWestern EuropeYemenZaireZimbabweAzores
Disability Age Under 5
Income
Poverty
Unemployment
Labor Participation
Family Structure
Vehicle Availability
Education Level
Disability

Disability Age Under 5 Comparison

French Canadians

Immigrants from Burma/Myanmar

Tragic
Exceptional
1.9%
DISABILITY AGE UNDER 5
0.0/ 100
METRIC RATING
331st/ 347
METRIC RANK
1.1%
DISABILITY AGE UNDER 5
98.2/ 100
METRIC RATING
76th/ 347
METRIC RANK

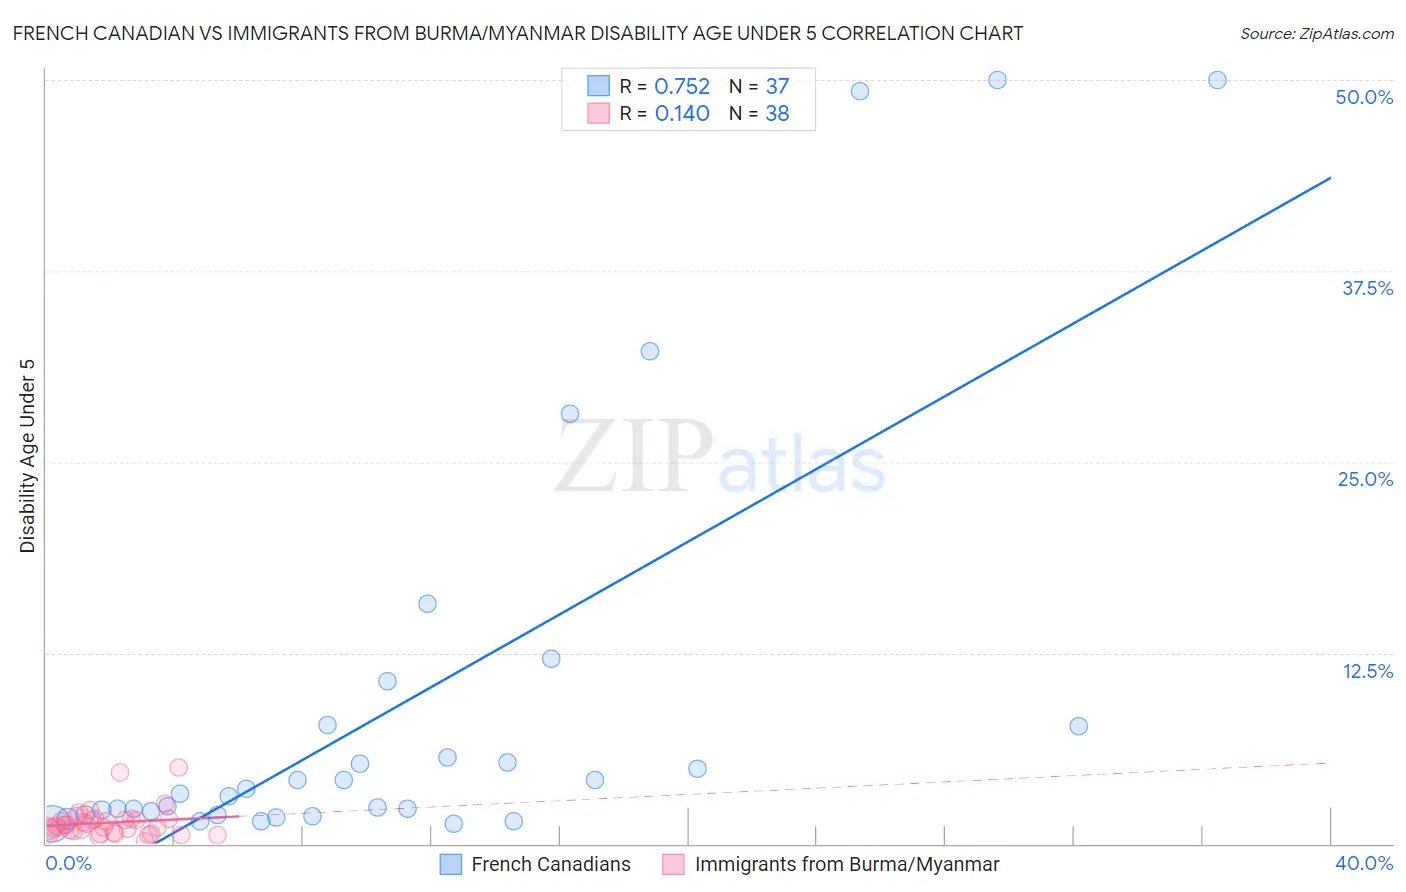
French Canadian vs Immigrants from Burma/Myanmar Disability Age Under 5 Correlation Chart

The statistical analysis conducted on geographies consisting of 244,253,201 people shows a strong positive correlation between the proportion of French Canadians and percentage of population with a disability under the age of 5 in the United States with a correlation coefficient (R) of 0.752 and weighted average of 1.9%. Similarly, the statistical analysis conducted on geographies consisting of 121,763,943 people shows a poor positive correlation between the proportion of Immigrants from Burma/Myanmar and percentage of population with a disability under the age of 5 in the United States with a correlation coefficient (R) of 0.140 and weighted average of 1.1%, a difference of 66.6%.
French Canadian vs Immigrants from Burma/Myanmar Disability Age Under 5

Disability Age Under 5 Correlation Summary

MeasurementFrench CanadianImmigrants from Burma/Myanmar
Minimum1.3%0.18%
Maximum50.0%5.0%
Range48.7%4.8%
Mean9.2%1.4%
Median3.3%1.1%
Interquartile 25% (IQ1)1.9%0.85%
Interquartile 75% (IQ3)7.7%1.6%
Interquartile Range (IQR)5.8%0.72%
Standard Deviation (Sample)14.0%0.98%
Standard Deviation (Population)13.8%0.96%

Similar Demographics by Disability Age Under 5

Demographics Similar to French Canadians by Disability Age Under 5

In terms of disability age under 5, the demographic groups most similar to French Canadians are Chippewa (1.9%, a difference of 0.060%), Choctaw (1.9%, a difference of 0.30%), Houma (1.9%, a difference of 0.62%), American (1.9%, a difference of 1.1%), and Osage (1.8%, a difference of 2.8%).
DemographicsRating | RankDisability Age Under 5
Cherokee
0.0
/100
|
#324
Tragic
1.8%
Immigrants | Portugal
0.0
/100
|
#325
Tragic
1.8%
Sioux
0.0
/100
|
#326
Tragic
1.8%
Osage
0.0
/100
|
#327
Tragic
1.8%
Americans
0.0
/100
|
#328
Tragic
1.9%
Houma
0.0
/100
|
#329
Tragic
1.9%
Choctaw
0.0
/100
|
#330
Tragic
1.9%
French Canadians
0.0
/100
|
#331
Tragic
1.9%
Chippewa
0.0
/100
|
#332
Tragic
1.9%
Dutch West Indians
0.0
/100
|
#333
Tragic
1.9%
Natives/Alaskans
0.0
/100
|
#334
Tragic
1.9%
Pennsylvania Germans
0.0
/100
|
#335
Tragic
1.9%
Paraguayans
0.0
/100
|
#336
Tragic
2.0%
Apache
0.0
/100
|
#337
Tragic
2.0%
Tohono O'odham
0.0
/100
|
#338
Tragic
2.2%

Demographics Similar to Immigrants from Burma/Myanmar by Disability Age Under 5

In terms of disability age under 5, the demographic groups most similar to Immigrants from Burma/Myanmar are Immigrants from Denmark (1.1%, a difference of 0.14%), Immigrants from Pakistan (1.1%, a difference of 0.26%), West Indian (1.1%, a difference of 0.26%), Hmong (1.1%, a difference of 0.28%), and Immigrants from Trinidad and Tobago (1.1%, a difference of 0.31%).
DemographicsRating | RankDisability Age Under 5
Israelis
98.7
/100
|
#69
Exceptional
1.1%
Immigrants | Ecuador
98.6
/100
|
#70
Exceptional
1.1%
Trinidadians and Tobagonians
98.6
/100
|
#71
Exceptional
1.1%
Burmese
98.5
/100
|
#72
Exceptional
1.1%
Immigrants | Sri Lanka
98.5
/100
|
#73
Exceptional
1.1%
Jordanians
98.5
/100
|
#74
Exceptional
1.1%
Immigrants | Pakistan
98.4
/100
|
#75
Exceptional
1.1%
Immigrants | Burma/Myanmar
98.2
/100
|
#76
Exceptional
1.1%
Immigrants | Denmark
98.1
/100
|
#77
Exceptional
1.1%
West Indians
98.0
/100
|
#78
Exceptional
1.1%
Hmong
98.0
/100
|
#79
Exceptional
1.1%
Immigrants | Trinidad and Tobago
98.0
/100
|
#80
Exceptional
1.1%
Turks
98.0
/100
|
#81
Exceptional
1.1%
Immigrants | Jordan
97.9
/100
|
#82
Exceptional
1.1%
Immigrants | Syria
97.9
/100
|
#83
Exceptional
1.1%