English Married-Couple Family Poverty
COMPARE
English
Select to Compare
Married-Couple Family Poverty
English Married-Couple Family Poverty
4.2%
POVERTY | MARRIED-COUPLE FAMILIES
99.9/ 100
METRIC RATING
36th/ 347
METRIC RANK
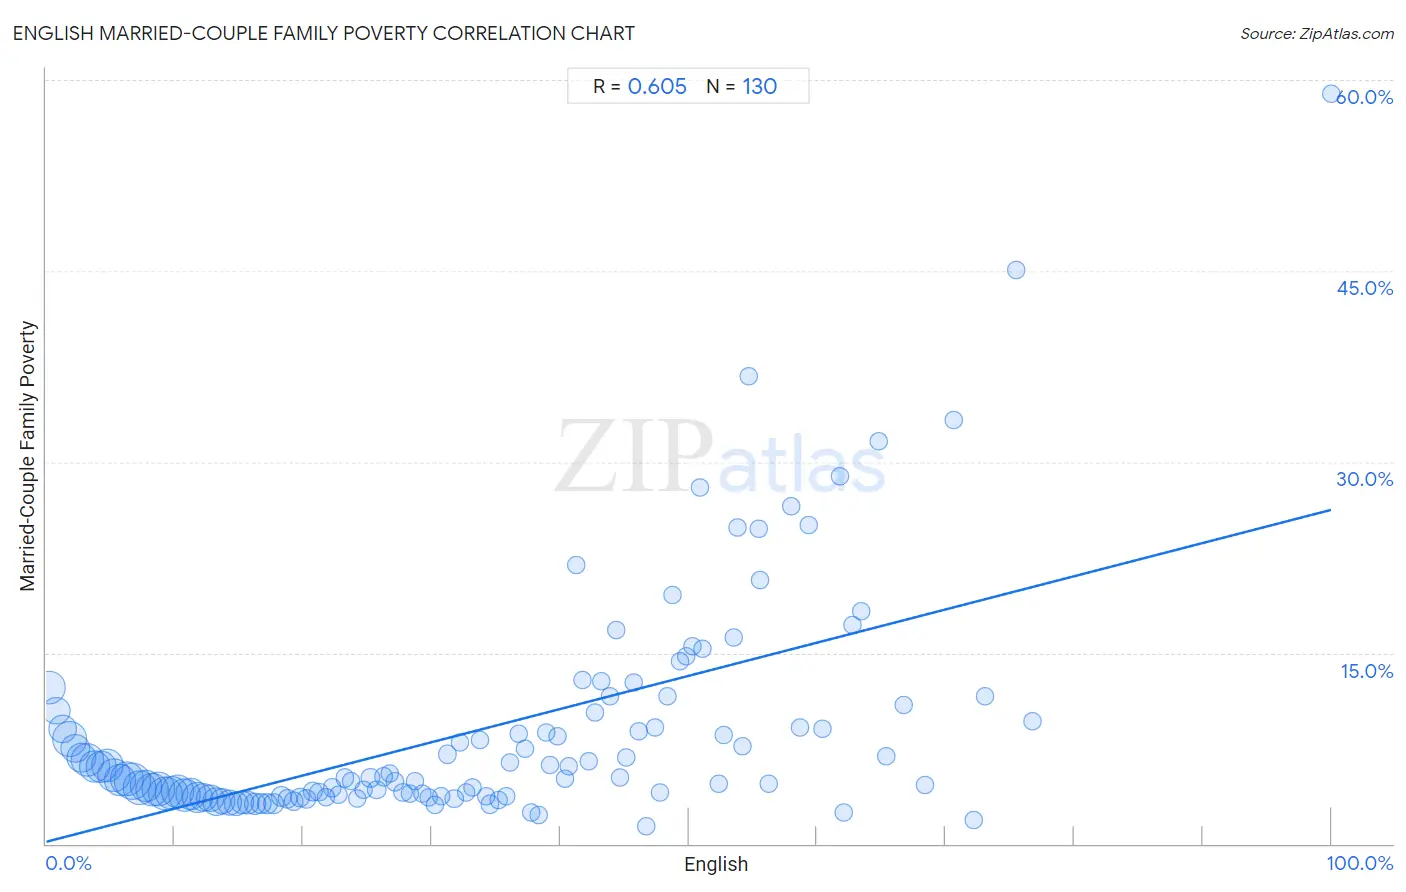
English Married-Couple Family Poverty Correlation Chart
The statistical analysis conducted on geographies consisting of 562,851,245 people shows a significant positive correlation between the proportion of English and poverty level among married-couple families in the United States with a correlation coefficient (R) of 0.605 and weighted average of 4.2%. On average, for every 1% (one percent) increase in English within a typical geography, there is an increase of 0.26% in poverty level among married-couple families.
It is essential to understand that the correlation between the percentage of English and poverty level among married-couple families does not imply a direct cause-and-effect relationship. It remains uncertain whether the presence of English influences an upward or downward trend in the level of poverty level among married-couple families within an area, or if English simply ended up residing in those areas with higher or lower levels of poverty level among married-couple families due to other factors.
Demographics Similar to English by Married-Couple Family Poverty
In terms of married-couple family poverty, the demographic groups most similar to English are European (4.2%, a difference of 0.030%), Iranian (4.2%, a difference of 0.070%), Belgian (4.2%, a difference of 0.19%), Immigrants from Northern Europe (4.2%, a difference of 0.32%), and Dutch (4.2%, a difference of 0.60%).
| Demographics | Rating | Rank | Married-Couple Family Poverty |
| Immigrants from Scotland | 99.9 /100 | #29 | Exceptional 4.2% |
| Finns | 99.9 /100 | #30 | Exceptional 4.2% |
| Estonians | 99.9 /100 | #31 | Exceptional 4.2% |
| Greeks | 99.9 /100 | #32 | Exceptional 4.2% |
| Irish | 99.9 /100 | #33 | Exceptional 4.2% |
| Dutch | 99.9 /100 | #34 | Exceptional 4.2% |
| Europeans | 99.9 /100 | #35 | Exceptional 4.2% |
| English | 99.9 /100 | #36 | Exceptional 4.2% |
| Iranians | 99.9 /100 | #37 | Exceptional 4.2% |
| Belgians | 99.9 /100 | #38 | Exceptional 4.2% |
| Immigrants from Northern Europe | 99.8 /100 | #39 | Exceptional 4.2% |
| French Canadians | 99.8 /100 | #40 | Exceptional 4.2% |
| Northern Europeans | 99.8 /100 | #41 | Exceptional 4.3% |
| Scottish | 99.8 /100 | #42 | Exceptional 4.3% |
| Swiss | 99.8 /100 | #43 | Exceptional 4.3% |
English Married-Couple Family Poverty Correlation Summary
| Measurement | English Data | Married-Couple Family Poverty Data |
| Minimum | 0.25% | 1.4% |
| Maximum | 100.0% | 58.9% |
| Range | 99.8% | 57.6% |
| Mean | 33.5% | 8.9% |
| Median | 32.4% | 5.2% |
| Interquartile 25% (IQ1) | 16.3% | 3.7% |
| Interquartile 75% (IQ3) | 48.8% | 9.6% |
| Interquartile Range (IQR) | 32.5% | 5.9% |
| Standard Deviation (Sample) | 20.8% | 9.0% |
| Standard Deviation (Population) | 20.7% | 8.9% |
Correlation Details
| English Percentile | Sample Size | Married-Couple Family Poverty |
[ 0.0% - 0.5% ] 0.25% | 19,536,489 | 12.2% |
[ 0.5% - 1.0% ] 0.76% | 12,803,823 | 10.4% |
[ 1.0% - 1.5% ] 1.24% | 12,817,461 | 9.0% |
[ 1.5% - 2.0% ] 1.81% | 22,412,430 | 8.2% |
[ 2.0% - 2.5% ] 2.25% | 14,107,889 | 7.5% |
[ 2.5% - 3.0% ] 2.77% | 14,328,241 | 6.7% |
[ 3.0% - 3.5% ] 3.23% | 20,165,125 | 6.6% |
[ 3.5% - 4.0% ] 3.75% | 17,589,628 | 6.1% |
[ 4.0% - 4.5% ] 4.25% | 16,589,661 | 6.0% |
[ 4.5% - 5.0% ] 4.72% | 18,615,573 | 6.1% |
[ 5.0% - 5.5% ] 5.25% | 19,189,707 | 5.4% |
[ 5.5% - 6.0% ] 5.75% | 18,038,401 | 5.0% |
[ 6.0% - 6.5% ] 6.28% | 21,346,650 | 5.1% |
[ 6.5% - 7.0% ] 6.75% | 24,731,082 | 4.9% |
[ 7.0% - 7.5% ] 7.26% | 21,008,870 | 4.4% |
[ 7.5% - 8.0% ] 7.74% | 18,853,681 | 4.6% |
[ 8.0% - 8.5% ] 8.25% | 20,784,162 | 4.3% |
[ 8.5% - 9.0% ] 8.74% | 20,863,380 | 4.3% |
[ 9.0% - 9.5% ] 9.26% | 20,631,068 | 3.9% |
[ 9.5% - 10.0% ] 9.75% | 18,988,723 | 4.0% |
[ 10.0% - 10.5% ] 10.24% | 19,629,276 | 4.1% |
[ 10.5% - 11.0% ] 10.75% | 19,626,547 | 3.8% |
[ 11.0% - 11.5% ] 11.24% | 17,430,731 | 3.9% |
[ 11.5% - 12.0% ] 11.74% | 16,525,236 | 3.6% |
[ 12.0% - 12.5% ] 12.25% | 13,478,068 | 3.6% |
[ 12.5% - 13.0% ] 12.75% | 12,909,799 | 3.6% |
[ 13.0% - 13.5% ] 13.25% | 12,123,702 | 3.3% |
[ 13.5% - 14.0% ] 13.74% | 9,986,603 | 3.4% |
[ 14.0% - 14.5% ] 14.26% | 9,647,121 | 3.2% |
[ 14.5% - 15.0% ] 14.74% | 8,302,544 | 3.2% |
[ 15.0% - 15.5% ] 15.23% | 6,837,178 | 3.2% |
[ 15.5% - 16.0% ] 15.74% | 6,094,282 | 3.3% |
[ 16.0% - 16.5% ] 16.26% | 4,811,797 | 3.2% |
[ 16.5% - 17.0% ] 16.74% | 3,733,598 | 3.1% |
[ 17.0% - 17.5% ] 17.25% | 3,488,988 | 3.2% |
[ 17.5% - 18.0% ] 17.74% | 3,403,102 | 3.2% |
[ 18.0% - 18.5% ] 18.28% | 2,833,959 | 3.7% |
[ 18.5% - 19.0% ] 18.74% | 1,551,363 | 3.6% |
[ 19.0% - 19.5% ] 19.24% | 1,903,000 | 3.3% |
[ 19.5% - 20.0% ] 19.75% | 1,500,717 | 3.6% |
[ 20.0% - 20.5% ] 20.24% | 1,335,554 | 3.5% |
[ 20.5% - 21.0% ] 20.74% | 910,955 | 4.1% |
[ 21.0% - 21.5% ] 21.23% | 979,073 | 4.1% |
[ 21.5% - 22.0% ] 21.75% | 695,716 | 3.6% |
[ 22.0% - 22.5% ] 22.25% | 921,331 | 4.4% |
[ 22.5% - 23.0% ] 22.76% | 708,500 | 3.8% |
[ 23.0% - 23.5% ] 23.22% | 453,399 | 5.2% |
[ 23.5% - 24.0% ] 23.74% | 476,336 | 4.9% |
[ 24.0% - 24.5% ] 24.22% | 598,233 | 3.5% |
[ 24.5% - 25.0% ] 24.70% | 468,006 | 4.2% |
[ 25.0% - 25.5% ] 25.22% | 534,517 | 5.2% |
[ 25.5% - 26.0% ] 25.73% | 474,599 | 4.3% |
[ 26.0% - 26.5% ] 26.23% | 407,853 | 5.3% |
[ 26.5% - 27.0% ] 26.74% | 626,332 | 5.5% |
[ 27.0% - 27.5% ] 27.17% | 269,092 | 4.9% |
[ 27.5% - 28.0% ] 27.77% | 332,178 | 4.0% |
[ 28.0% - 28.5% ] 28.31% | 284,097 | 3.9% |
[ 28.5% - 29.0% ] 28.71% | 186,921 | 4.9% |
[ 29.0% - 29.5% ] 29.25% | 352,204 | 3.9% |
[ 29.5% - 30.0% ] 29.75% | 228,319 | 3.7% |
[ 30.0% - 30.5% ] 30.26% | 121,245 | 3.1% |
[ 30.5% - 31.0% ] 30.72% | 250,515 | 3.7% |
[ 31.0% - 31.5% ] 31.21% | 247,803 | 7.0% |
[ 31.5% - 32.0% ] 31.75% | 314,094 | 3.5% |
[ 32.0% - 32.5% ] 32.18% | 161,122 | 8.0% |
[ 32.5% - 33.0% ] 32.71% | 106,590 | 4.0% |
[ 33.0% - 33.5% ] 33.17% | 77,498 | 4.4% |
[ 33.5% - 34.0% ] 33.80% | 33,708 | 8.1% |
[ 34.0% - 34.5% ] 34.21% | 70,788 | 3.7% |
[ 34.5% - 35.0% ] 34.56% | 248,578 | 3.1% |
[ 35.0% - 35.5% ] 35.19% | 111,934 | 3.4% |
[ 35.5% - 36.0% ] 35.83% | 140,396 | 3.7% |
[ 36.0% - 36.5% ] 36.13% | 42,478 | 6.4% |
[ 36.5% - 37.0% ] 36.74% | 17,911 | 8.6% |
[ 37.0% - 37.5% ] 37.27% | 10,566 | 7.5% |
[ 37.5% - 38.0% ] 37.74% | 106,175 | 2.4% |
[ 38.0% - 38.5% ] 38.35% | 102,704 | 2.3% |
[ 38.5% - 39.0% ] 38.87% | 10,895 | 8.7% |
[ 39.0% - 39.5% ] 39.19% | 17,026 | 6.2% |
[ 39.5% - 40.0% ] 39.78% | 12,209 | 8.4% |
[ 40.0% - 40.5% ] 40.38% | 16,212 | 5.1% |
[ 40.5% - 41.0% ] 40.68% | 17,186 | 6.0% |
[ 41.0% - 41.5% ] 41.24% | 3,817 | 21.9% |
[ 41.5% - 42.0% ] 41.77% | 7,618 | 12.9% |
[ 42.0% - 42.5% ] 42.24% | 18,736 | 6.5% |
[ 42.5% - 43.0% ] 42.73% | 5,174 | 10.3% |
[ 43.0% - 43.5% ] 43.22% | 5,542 | 12.8% |
[ 43.5% - 44.0% ] 43.84% | 2,842 | 11.6% |
[ 44.0% - 44.5% ] 44.33% | 652 | 16.8% |
[ 44.5% - 45.0% ] 44.65% | 14,630 | 5.2% |
[ 45.0% - 45.5% ] 45.12% | 26,015 | 6.7% |
[ 45.5% - 46.0% ] 45.75% | 8,618 | 12.7% |
[ 46.0% - 46.5% ] 46.13% | 8,589 | 8.8% |
[ 46.5% - 47.0% ] 46.65% | 4,041 | 1.4% |
[ 47.0% - 47.5% ] 47.34% | 5,608 | 9.1% |
[ 47.5% - 48.0% ] 47.72% | 2,171 | 4.0% |
[ 48.0% - 48.5% ] 48.35% | 2,033 | 11.6% |
[ 48.5% - 49.0% ] 48.77% | 775 | 19.6% |
[ 49.0% - 49.5% ] 49.30% | 1,637 | 14.4% |
[ 49.5% - 50.0% ] 49.85% | 2,692 | 14.7% |
[ 50.0% - 50.5% ] 50.29% | 3,126 | 15.5% |
[ 50.5% - 51.0% ] 50.90% | 4,788 | 28.0% |
[ 51.0% - 51.5% ] 51.07% | 327 | 15.3% |
[ 52.0% - 52.5% ] 52.34% | 107 | 4.8% |
[ 52.5% - 53.0% ] 52.69% | 780 | 8.5% |
[ 53.0% - 53.5% ] 53.48% | 417 | 16.2% |
[ 53.5% - 54.0% ] 53.76% | 2,937 | 24.9% |
[ 54.0% - 54.5% ] 54.15% | 1,132 | 7.7% |
[ 54.5% - 55.0% ] 54.63% | 1,578 | 36.7% |
[ 55.0% - 55.5% ] 55.42% | 664 | 24.7% |
[ 55.5% - 56.0% ] 55.58% | 932 | 20.7% |
[ 56.0% - 56.5% ] 56.25% | 240 | 4.8% |
[ 57.5% - 58.0% ] 57.93% | 271 | 26.5% |
[ 58.5% - 59.0% ] 58.64% | 411 | 9.1% |
[ 59.0% - 59.5% ] 59.30% | 86 | 25.0% |
[ 60.0% - 60.5% ] 60.41% | 1,114 | 9.0% |
[ 61.5% - 62.0% ] 61.80% | 356 | 28.9% |
[ 62.0% - 62.5% ] 62.09% | 1,274 | 2.4% |
[ 62.5% - 63.0% ] 62.71% | 724 | 17.2% |
[ 63.0% - 63.5% ] 63.45% | 632 | 18.2% |
[ 64.5% - 65.0% ] 64.75% | 488 | 31.7% |
[ 65.0% - 65.5% ] 65.40% | 1,133 | 6.9% |
[ 66.5% - 67.0% ] 66.77% | 641 | 10.9% |
[ 68.0% - 68.5% ] 68.39% | 791 | 4.7% |
[ 70.5% - 71.0% ] 70.61% | 330 | 33.3% |
[ 72.0% - 72.5% ] 72.21% | 2,033 | 1.9% |
[ 73.0% - 73.5% ] 73.06% | 438 | 11.6% |
[ 75.0% - 75.5% ] 75.50% | 951 | 45.1% |
[ 76.5% - 77.0% ] 76.72% | 640 | 9.6% |
[ 99.5% - 100.0% ] 100.00% | 211 | 58.9% |