Bulgarian Married-Couple Family Poverty
COMPARE
Bulgarian
Select to Compare
Married-Couple Family Poverty
Bulgarian Married-Couple Family Poverty
4.0%
POVERTY | MARRIED-COUPLE FAMILIES
100.0/ 100
METRIC RATING
12th/ 347
METRIC RANK
Bulgarian Married-Couple Family Poverty Correlation Chart
The statistical analysis conducted on geographies consisting of 204,671,341 people shows a near-perfect positive correlation between the proportion of Bulgarians and poverty level among married-couple families in the United States with a correlation coefficient (R) of 0.912 and weighted average of 4.0%. On average, for every 1% (one percent) increase in Bulgarians within a typical geography, there is an increase of 0.71% in poverty level among married-couple families.
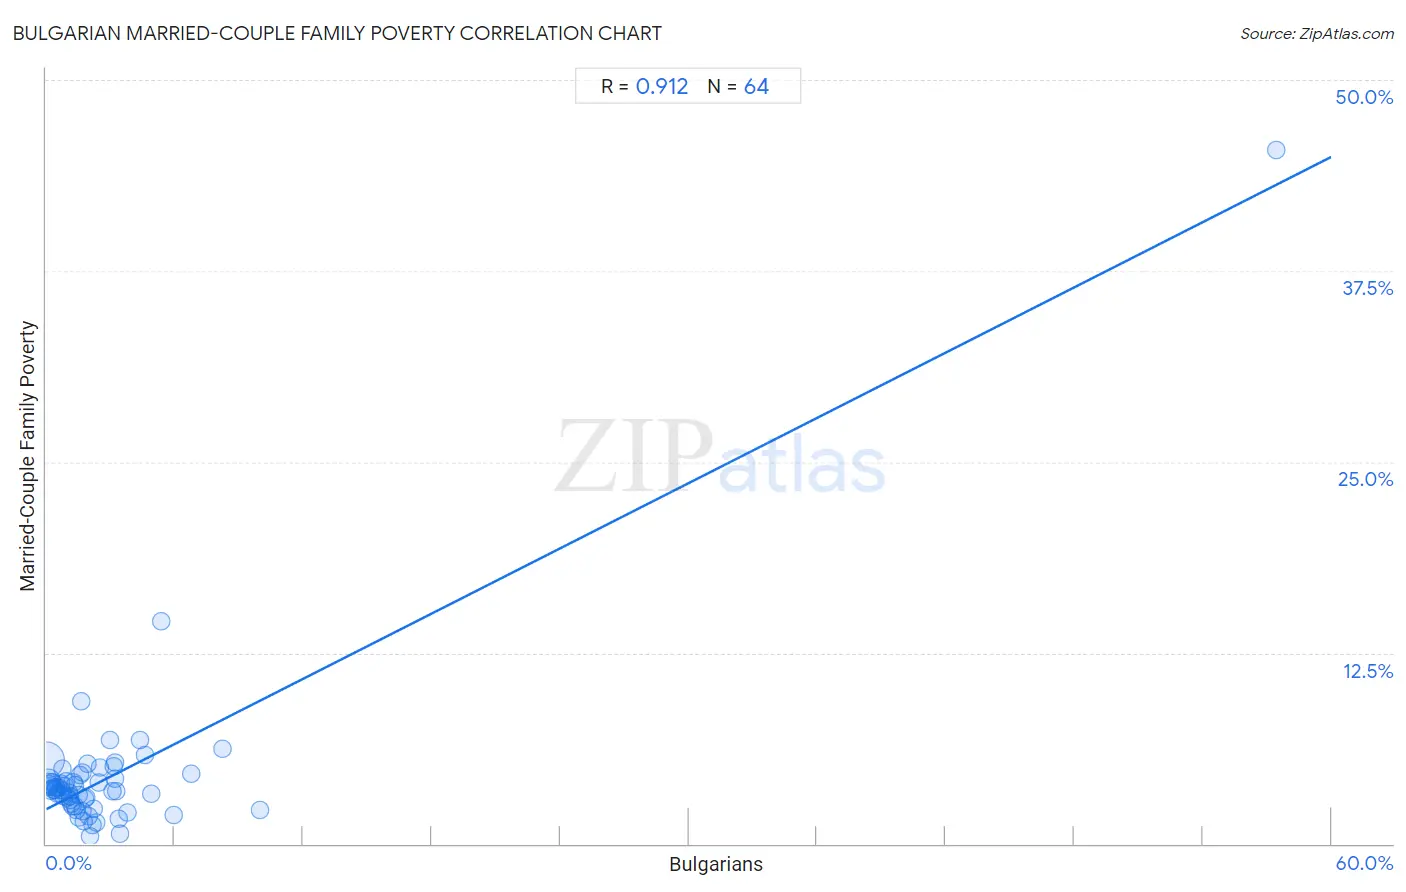
It is essential to understand that the correlation between the percentage of Bulgarians and poverty level among married-couple families does not imply a direct cause-and-effect relationship. It remains uncertain whether the presence of Bulgarians influences an upward or downward trend in the level of poverty level among married-couple families within an area, or if Bulgarians simply ended up residing in those areas with higher or lower levels of poverty level among married-couple families due to other factors.
Demographics Similar to Bulgarians by Married-Couple Family Poverty
In terms of married-couple family poverty, the demographic groups most similar to Bulgarians are Lithuanian (4.0%, a difference of 0.70%), Czech (4.0%, a difference of 0.88%), Slovak (4.0%, a difference of 0.92%), Polish (4.0%, a difference of 0.95%), and Carpatho Rusyn (3.9%, a difference of 1.2%).
| Demographics | Rating | Rank | Married-Couple Family Poverty |
| Swedes | 100.0 /100 | #5 | Exceptional 3.9% |
| Luxembourgers | 100.0 /100 | #6 | Exceptional 3.9% |
| Latvians | 100.0 /100 | #7 | Exceptional 3.9% |
| Thais | 100.0 /100 | #8 | Exceptional 3.9% |
| Croatians | 100.0 /100 | #9 | Exceptional 3.9% |
| Carpatho Rusyns | 100.0 /100 | #10 | Exceptional 3.9% |
| Lithuanians | 100.0 /100 | #11 | Exceptional 4.0% |
| Bulgarians | 100.0 /100 | #12 | Exceptional 4.0% |
| Czechs | 100.0 /100 | #13 | Exceptional 4.0% |
| Slovaks | 100.0 /100 | #14 | Exceptional 4.0% |
| Poles | 100.0 /100 | #15 | Exceptional 4.0% |
| Germans | 100.0 /100 | #16 | Exceptional 4.0% |
| Filipinos | 100.0 /100 | #17 | Exceptional 4.0% |
| Italians | 100.0 /100 | #18 | Exceptional 4.0% |
| Immigrants from Ireland | 99.9 /100 | #19 | Exceptional 4.1% |
Bulgarian Married-Couple Family Poverty Correlation Summary
| Measurement | Bulgarian Data | Married-Couple Family Poverty Data |
| Minimum | 0.025% | 0.47% |
| Maximum | 57.4% | 45.5% |
| Range | 57.4% | 45.0% |
| Mean | 3.0% | 4.4% |
| Median | 1.6% | 3.5% |
| Interquartile 25% (IQ1) | 0.80% | 2.6% |
| Interquartile 75% (IQ3) | 3.1% | 4.4% |
| Interquartile Range (IQR) | 2.3% | 1.8% |
| Standard Deviation (Sample) | 7.2% | 5.6% |
| Standard Deviation (Population) | 7.1% | 5.6% |
Correlation Details
| Bulgarian Percentile | Sample Size | Married-Couple Family Poverty |
[ 0.0% - 0.5% ] 0.025% | 113,911,412 | 5.5% |
[ 0.0% - 0.5% ] 0.072% | 40,811,701 | 4.1% |
[ 0.0% - 0.5% ] 0.12% | 19,044,846 | 4.0% |
[ 0.0% - 0.5% ] 0.17% | 9,408,446 | 3.8% |
[ 0.0% - 0.5% ] 0.22% | 5,805,723 | 3.5% |
[ 0.0% - 0.5% ] 0.27% | 3,433,973 | 4.0% |
[ 0.0% - 0.5% ] 0.32% | 3,372,824 | 3.6% |
[ 0.0% - 0.5% ] 0.38% | 1,701,595 | 3.7% |
[ 0.0% - 0.5% ] 0.42% | 1,024,010 | 3.5% |
[ 0.0% - 0.5% ] 0.47% | 840,870 | 3.7% |
[ 0.5% - 1.0% ] 0.52% | 901,852 | 3.3% |
[ 0.5% - 1.0% ] 0.57% | 649,167 | 3.7% |
[ 0.5% - 1.0% ] 0.62% | 474,487 | 3.3% |
[ 0.5% - 1.0% ] 0.68% | 430,304 | 3.9% |
[ 0.5% - 1.0% ] 0.72% | 292,142 | 3.5% |
[ 0.5% - 1.0% ] 0.78% | 384,211 | 4.9% |
[ 0.5% - 1.0% ] 0.83% | 134,133 | 3.1% |
[ 0.5% - 1.0% ] 0.88% | 309,329 | 3.7% |
[ 0.5% - 1.0% ] 0.92% | 107,386 | 4.1% |
[ 0.5% - 1.0% ] 0.97% | 118,469 | 3.0% |
[ 1.0% - 1.5% ] 1.03% | 232,339 | 3.4% |
[ 1.0% - 1.5% ] 1.08% | 95,336 | 3.1% |
[ 1.0% - 1.5% ] 1.13% | 77,302 | 2.9% |
[ 1.0% - 1.5% ] 1.17% | 54,073 | 2.6% |
[ 1.0% - 1.5% ] 1.22% | 72,676 | 2.5% |
[ 1.0% - 1.5% ] 1.25% | 121,289 | 4.0% |
[ 1.0% - 1.5% ] 1.31% | 91,689 | 2.4% |
[ 1.0% - 1.5% ] 1.36% | 13,439 | 3.8% |
[ 1.0% - 1.5% ] 1.42% | 16,645 | 2.2% |
[ 1.0% - 1.5% ] 1.49% | 24,054 | 1.7% |
[ 1.5% - 2.0% ] 1.52% | 159,031 | 3.2% |
[ 1.5% - 2.0% ] 1.57% | 39,359 | 4.5% |
[ 1.5% - 2.0% ] 1.61% | 11,397 | 9.3% |
[ 1.5% - 2.0% ] 1.66% | 7,088 | 2.1% |
[ 1.5% - 2.0% ] 1.71% | 31,967 | 4.7% |
[ 1.5% - 2.0% ] 1.78% | 21,303 | 1.5% |
[ 1.5% - 2.0% ] 1.83% | 100,974 | 3.0% |
[ 1.5% - 2.0% ] 1.86% | 63,880 | 3.0% |
[ 1.5% - 2.0% ] 1.91% | 14,936 | 5.2% |
[ 1.5% - 2.0% ] 1.99% | 66,426 | 1.8% |
[ 2.0% - 2.5% ] 2.06% | 27,871 | 0.47% |
[ 2.0% - 2.5% ] 2.14% | 2,430 | 1.2% |
[ 2.0% - 2.5% ] 2.22% | 29,800 | 2.3% |
[ 2.0% - 2.5% ] 2.33% | 40,140 | 1.4% |
[ 2.0% - 2.5% ] 2.42% | 29,216 | 4.0% |
[ 2.5% - 3.0% ] 2.52% | 3,689 | 5.0% |
[ 2.5% - 3.0% ] 2.96% | 3,613 | 6.8% |
[ 3.0% - 3.5% ] 3.07% | 10,390 | 3.4% |
[ 3.0% - 3.5% ] 3.14% | 14,191 | 5.0% |
[ 3.0% - 3.5% ] 3.19% | 1,379 | 5.3% |
[ 3.0% - 3.5% ] 3.21% | 2,833 | 4.2% |
[ 3.0% - 3.5% ] 3.25% | 9,929 | 3.4% |
[ 3.0% - 3.5% ] 3.41% | 4,514 | 1.6% |
[ 3.0% - 3.5% ] 3.45% | 5,213 | 0.63% |
[ 3.5% - 4.0% ] 3.77% | 4,080 | 2.1% |
[ 4.0% - 4.5% ] 4.41% | 227 | 6.8% |
[ 4.5% - 5.0% ] 4.61% | 1,171 | 5.8% |
[ 4.5% - 5.0% ] 4.93% | 3,306 | 3.2% |
[ 5.0% - 5.5% ] 5.40% | 593 | 14.5% |
[ 5.5% - 6.0% ] 5.95% | 3,042 | 1.9% |
[ 6.5% - 7.0% ] 6.77% | 133 | 4.5% |
[ 8.0% - 8.5% ] 8.23% | 328 | 6.2% |
[ 9.5% - 10.0% ] 9.97% | 1,123 | 2.2% |
[ 57.0% - 57.5% ] 57.45% | 47 | 45.5% |