British West Indian 1 or more Vehicles in Household
COMPARE
British West Indian
Select to Compare
1 or more Vehicles in Household
British West Indian 1 or more Vehicles in Household
70.4%
1+ VEHICLES AVAILABLE
0.0/ 100
METRIC RATING
343rd/ 347
METRIC RANK
British West Indian 1 or more Vehicles in Household Correlation Chart
The statistical analysis conducted on geographies consisting of 152,639,821 people shows a poor negative correlation between the proportion of British West Indians and percentage of households with 1 or more vehicles available in the United States with a correlation coefficient (R) of -0.176 and weighted average of 70.4%. On average, for every 1% (one percent) increase in British West Indians within a typical geography, there is a decrease of 2.3% in percentage of households with 1 or more vehicles available.
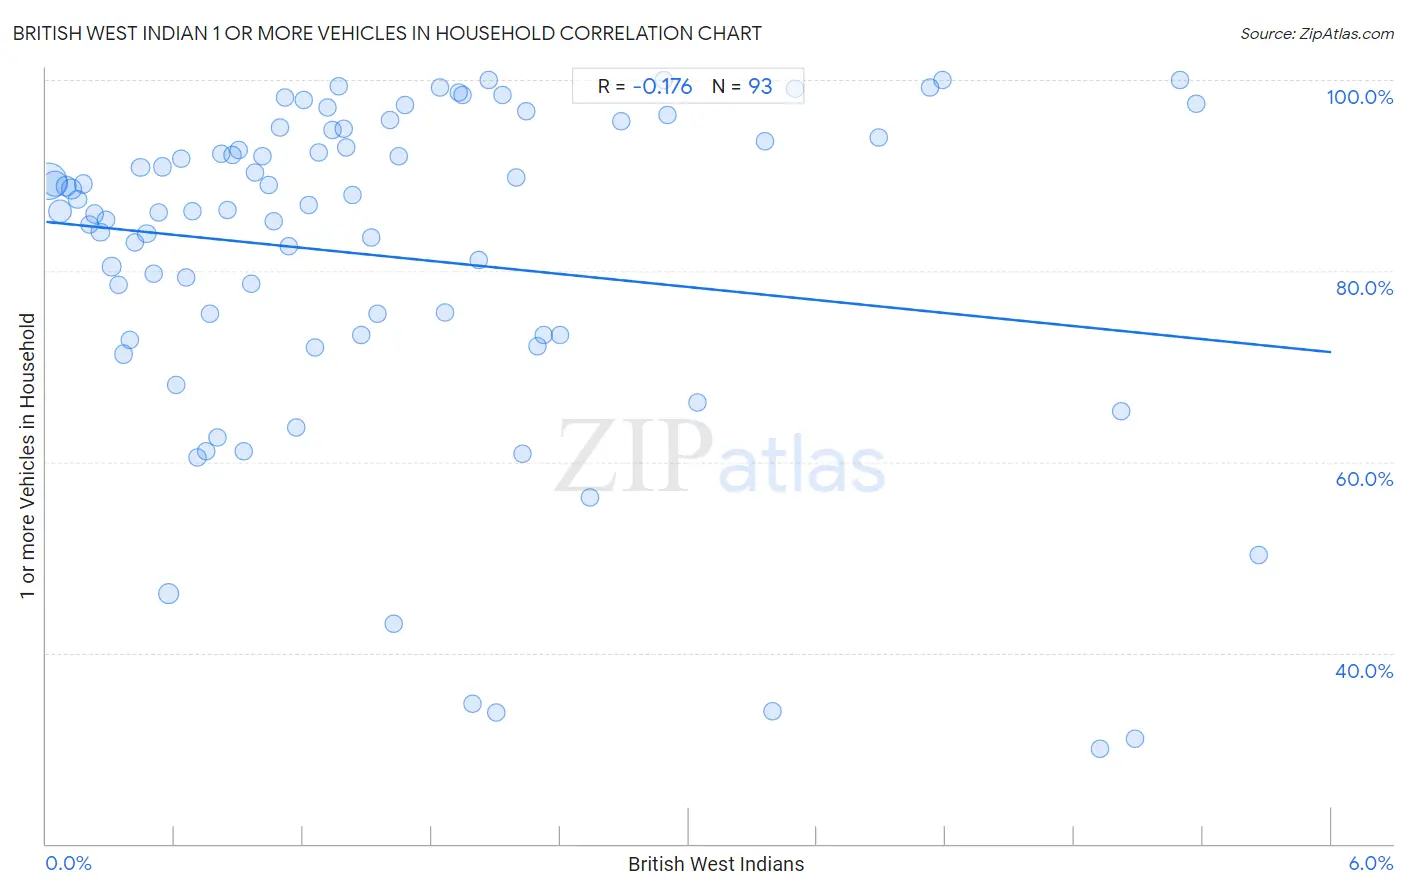
It is essential to understand that the correlation between the percentage of British West Indians and percentage of households with 1 or more vehicles available does not imply a direct cause-and-effect relationship. It remains uncertain whether the presence of British West Indians influences an upward or downward trend in the level of percentage of households with 1 or more vehicles available within an area, or if British West Indians simply ended up residing in those areas with higher or lower levels of percentage of households with 1 or more vehicles available due to other factors.
Demographics Similar to British West Indians by 1 or more Vehicles in Household
In terms of 1 or more vehicles in household, the demographic groups most similar to British West Indians are Immigrants from Guyana (70.6%, a difference of 0.31%), Immigrants from Barbados (70.6%, a difference of 0.32%), Dominican (70.7%, a difference of 0.46%), Guyanese (70.8%, a difference of 0.64%), and Inupiat (71.5%, a difference of 1.7%).
| Demographics | Rating | Rank | 1 or more Vehicles in Household |
| Immigrants from Ecuador | 0.0 /100 | #333 | Tragic 76.2% |
| Immigrants from Bangladesh | 0.0 /100 | #334 | Tragic 74.3% |
| Barbadians | 0.0 /100 | #335 | Tragic 74.0% |
| Vietnamese | 0.0 /100 | #336 | Tragic 73.8% |
| Immigrants from Uzbekistan | 0.0 /100 | #337 | Tragic 73.4% |
| Inupiat | 0.0 /100 | #338 | Tragic 71.5% |
| Guyanese | 0.0 /100 | #339 | Tragic 70.8% |
| Dominicans | 0.0 /100 | #340 | Tragic 70.7% |
| Immigrants from Barbados | 0.0 /100 | #341 | Tragic 70.6% |
| Immigrants from Guyana | 0.0 /100 | #342 | Tragic 70.6% |
| British West Indians | 0.0 /100 | #343 | Tragic 70.4% |
| Immigrants from Dominican Republic | 0.0 /100 | #344 | Tragic 68.6% |
| Immigrants from St. Vincent and the Grenadines | 0.0 /100 | #345 | Tragic 64.7% |
| Immigrants from Grenada | 0.0 /100 | #346 | Tragic 62.7% |
| Yup'ik | 0.0 /100 | #347 | Tragic 58.4% |
British West Indian 1 or more Vehicles in Household Correlation Summary
| Measurement | British West Indian Data | 1 or more Vehicles in Household Data |
| Minimum | 0.011% | 30.0% |
| Maximum | 5.7% | 100.0% |
| Range | 5.6% | 70.0% |
| Mean | 1.6% | 81.5% |
| Median | 1.3% | 86.4% |
| Interquartile 25% (IQ1) | 0.62% | 73.2% |
| Interquartile 75% (IQ3) | 2.2% | 94.3% |
| Interquartile Range (IQR) | 1.5% | 21.1% |
| Standard Deviation (Sample) | 1.4% | 17.6% |
| Standard Deviation (Population) | 1.4% | 17.5% |
Correlation Details
| British West Indian Percentile | Sample Size | 1 or more Vehicles in Household |
[ 0.0% - 0.5% ] 0.011% | 60,141,745 | 89.4% |
[ 0.0% - 0.5% ] 0.039% | 24,574,670 | 89.2% |
[ 0.0% - 0.5% ] 0.065% | 15,842,505 | 86.3% |
[ 0.0% - 0.5% ] 0.093% | 8,699,139 | 88.9% |
[ 0.0% - 0.5% ] 0.12% | 6,253,677 | 88.6% |
[ 0.0% - 0.5% ] 0.15% | 3,657,920 | 87.5% |
[ 0.0% - 0.5% ] 0.17% | 2,730,115 | 89.1% |
[ 0.0% - 0.5% ] 0.20% | 3,229,227 | 84.9% |
[ 0.0% - 0.5% ] 0.23% | 2,447,371 | 85.9% |
[ 0.0% - 0.5% ] 0.25% | 1,713,966 | 84.1% |
[ 0.0% - 0.5% ] 0.28% | 1,158,447 | 85.3% |
[ 0.0% - 0.5% ] 0.31% | 1,554,590 | 80.4% |
[ 0.0% - 0.5% ] 0.34% | 1,150,053 | 78.5% |
[ 0.0% - 0.5% ] 0.36% | 1,409,129 | 71.3% |
[ 0.0% - 0.5% ] 0.39% | 806,967 | 72.7% |
[ 0.0% - 0.5% ] 0.42% | 739,081 | 83.0% |
[ 0.0% - 0.5% ] 0.44% | 421,684 | 90.8% |
[ 0.0% - 0.5% ] 0.47% | 591,448 | 83.9% |
[ 0.5% - 1.0% ] 0.50% | 476,700 | 79.7% |
[ 0.5% - 1.0% ] 0.52% | 341,465 | 86.1% |
[ 0.5% - 1.0% ] 0.54% | 345,878 | 90.9% |
[ 0.5% - 1.0% ] 0.57% | 8,845,087 | 46.2% |
[ 0.5% - 1.0% ] 0.61% | 455,332 | 68.0% |
[ 0.5% - 1.0% ] 0.63% | 258,100 | 91.7% |
[ 0.5% - 1.0% ] 0.65% | 256,807 | 79.4% |
[ 0.5% - 1.0% ] 0.69% | 242,475 | 86.2% |
[ 0.5% - 1.0% ] 0.71% | 171,871 | 60.5% |
[ 0.5% - 1.0% ] 0.74% | 388,738 | 61.1% |
[ 0.5% - 1.0% ] 0.77% | 240,223 | 75.5% |
[ 0.5% - 1.0% ] 0.80% | 168,947 | 62.6% |
[ 0.5% - 1.0% ] 0.82% | 149,233 | 92.3% |
[ 0.5% - 1.0% ] 0.85% | 49,702 | 86.4% |
[ 0.5% - 1.0% ] 0.87% | 137,333 | 92.2% |
[ 0.5% - 1.0% ] 0.90% | 72,026 | 92.7% |
[ 0.5% - 1.0% ] 0.92% | 60,034 | 61.2% |
[ 0.5% - 1.0% ] 0.96% | 157,080 | 78.7% |
[ 0.5% - 1.0% ] 0.98% | 86,863 | 90.3% |
[ 1.0% - 1.5% ] 1.01% | 156,967 | 92.0% |
[ 1.0% - 1.5% ] 1.04% | 151,206 | 89.0% |
[ 1.0% - 1.5% ] 1.06% | 184,841 | 85.2% |
[ 1.0% - 1.5% ] 1.09% | 47,653 | 95.0% |
[ 1.0% - 1.5% ] 1.11% | 13,186 | 98.2% |
[ 1.0% - 1.5% ] 1.13% | 13,586 | 82.6% |
[ 1.0% - 1.5% ] 1.17% | 81,369 | 63.6% |
[ 1.0% - 1.5% ] 1.20% | 49,688 | 97.9% |
[ 1.0% - 1.5% ] 1.23% | 93,952 | 86.9% |
[ 1.0% - 1.5% ] 1.26% | 153,623 | 72.0% |
[ 1.0% - 1.5% ] 1.27% | 37,866 | 92.3% |
[ 1.0% - 1.5% ] 1.31% | 21,595 | 97.1% |
[ 1.0% - 1.5% ] 1.34% | 11,452 | 94.7% |
[ 1.0% - 1.5% ] 1.37% | 12,234 | 99.3% |
[ 1.0% - 1.5% ] 1.39% | 36,471 | 94.9% |
[ 1.0% - 1.5% ] 1.40% | 84,111 | 93.0% |
[ 1.0% - 1.5% ] 1.43% | 73,987 | 88.0% |
[ 1.0% - 1.5% ] 1.47% | 83,165 | 73.3% |
[ 1.5% - 2.0% ] 1.52% | 44,267 | 83.5% |
[ 1.5% - 2.0% ] 1.55% | 43,148 | 75.5% |
[ 1.5% - 2.0% ] 1.60% | 11,165 | 95.8% |
[ 1.5% - 2.0% ] 1.62% | 96,164 | 43.0% |
[ 1.5% - 2.0% ] 1.65% | 20,442 | 92.1% |
[ 1.5% - 2.0% ] 1.67% | 14,640 | 97.3% |
[ 1.5% - 2.0% ] 1.84% | 272 | 99.2% |
[ 1.5% - 2.0% ] 1.86% | 101,222 | 75.7% |
[ 1.5% - 2.0% ] 1.93% | 9,285 | 98.7% |
[ 1.5% - 2.0% ] 1.94% | 4,734 | 98.4% |
[ 1.5% - 2.0% ] 1.99% | 62,373 | 34.6% |
[ 2.0% - 2.5% ] 2.02% | 8,725 | 81.2% |
[ 2.0% - 2.5% ] 2.07% | 8,277 | 100.0% |
[ 2.0% - 2.5% ] 2.10% | 58,476 | 33.8% |
[ 2.0% - 2.5% ] 2.13% | 1,594 | 98.4% |
[ 2.0% - 2.5% ] 2.20% | 7,424 | 89.8% |
[ 2.0% - 2.5% ] 2.22% | 15,390 | 60.8% |
[ 2.0% - 2.5% ] 2.24% | 1,025 | 96.7% |
[ 2.0% - 2.5% ] 2.29% | 2,703 | 72.1% |
[ 2.0% - 2.5% ] 2.32% | 55,336 | 73.2% |
[ 2.0% - 2.5% ] 2.40% | 24,994 | 73.3% |
[ 2.5% - 3.0% ] 2.54% | 203,405 | 56.2% |
[ 2.5% - 3.0% ] 2.68% | 410 | 95.7% |
[ 2.5% - 3.0% ] 2.89% | 797 | 100.0% |
[ 2.5% - 3.0% ] 2.90% | 4,139 | 96.4% |
[ 3.0% - 3.5% ] 3.04% | 50,744 | 66.2% |
[ 3.0% - 3.5% ] 3.36% | 1,459 | 93.6% |
[ 3.0% - 3.5% ] 3.39% | 101,053 | 33.9% |
[ 3.0% - 3.5% ] 3.50% | 6,408 | 99.0% |
[ 3.5% - 4.0% ] 3.89% | 1,879 | 94.0% |
[ 4.0% - 4.5% ] 4.13% | 4,336 | 99.2% |
[ 4.0% - 4.5% ] 4.18% | 526 | 100.0% |
[ 4.5% - 5.0% ] 4.92% | 84,006 | 30.0% |
[ 5.0% - 5.5% ] 5.02% | 100,082 | 65.3% |
[ 5.0% - 5.5% ] 5.08% | 69,131 | 31.0% |
[ 5.0% - 5.5% ] 5.29% | 378 | 100.0% |
[ 5.0% - 5.5% ] 5.37% | 8,326 | 97.5% |
[ 5.5% - 6.0% ] 5.66% | 78,506 | 50.3% |