Blackfeet Male Disability
COMPARE
Blackfeet
Select to Compare
Male Disability
Blackfeet Male Disability
13.4%
DISABILITY | MALES
0.0/ 100
METRIC RATING
309th/ 347
METRIC RANK
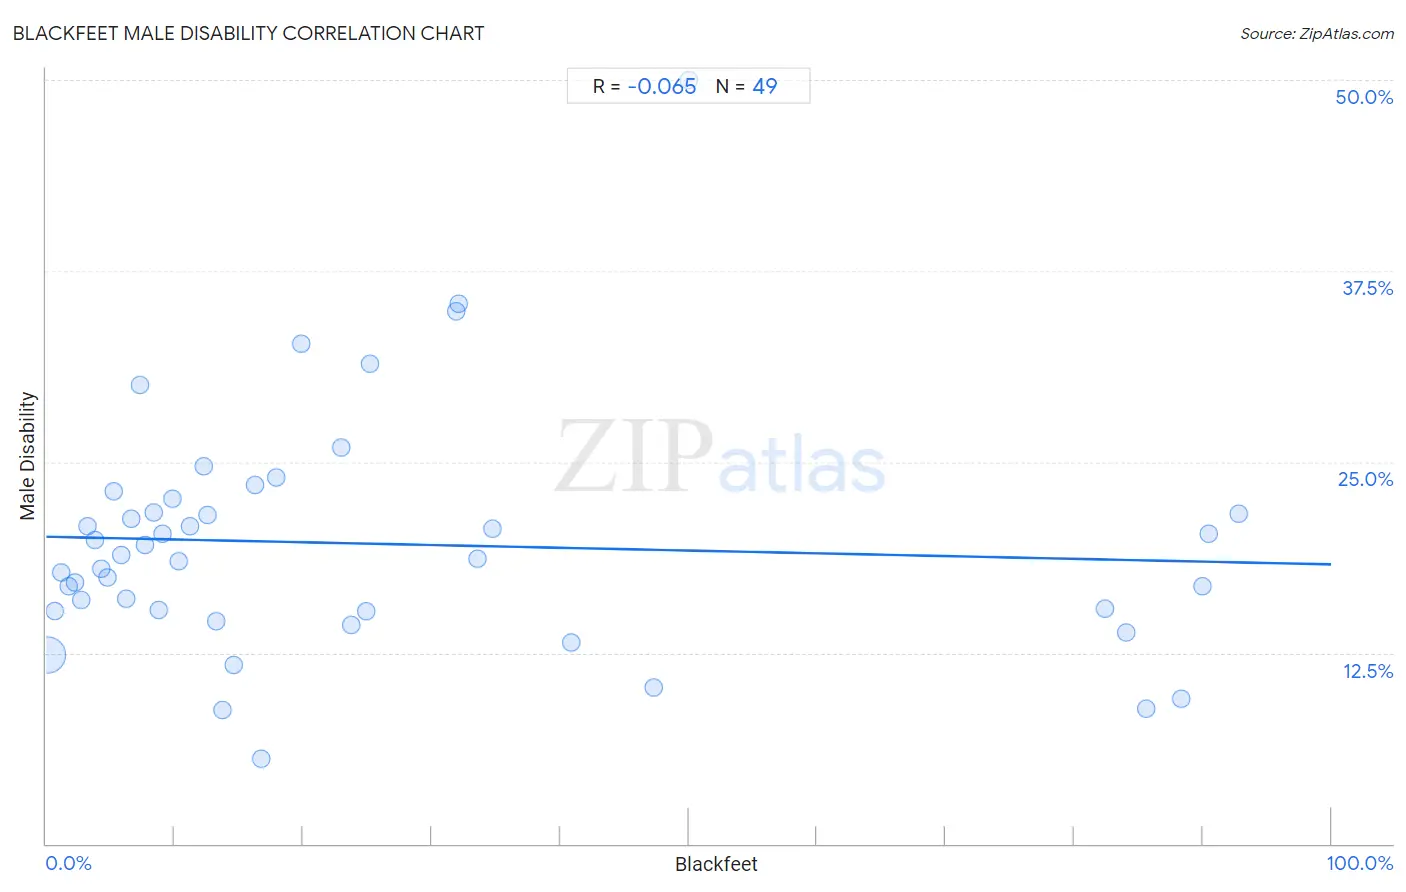
Blackfeet Male Disability Correlation Chart
The statistical analysis conducted on geographies consisting of 309,505,092 people shows a slight negative correlation between the proportion of Blackfeet and percentage of males with a disability in the United States with a correlation coefficient (R) of -0.065 and weighted average of 13.4%. On average, for every 1% (one percent) increase in Blackfeet within a typical geography, there is a decrease of 0.018% in percentage of males with a disability.
It is essential to understand that the correlation between the percentage of Blackfeet and percentage of males with a disability does not imply a direct cause-and-effect relationship. It remains uncertain whether the presence of Blackfeet influences an upward or downward trend in the level of percentage of males with a disability within an area, or if Blackfeet simply ended up residing in those areas with higher or lower levels of percentage of males with a disability due to other factors.
Demographics Similar to Blackfeet by Male Disability
In terms of male disability, the demographic groups most similar to Blackfeet are Immigrants from the Azores (13.4%, a difference of 0.14%), Delaware (13.5%, a difference of 0.33%), French American Indian (13.4%, a difference of 0.42%), Arapaho (13.3%, a difference of 0.58%), and Spanish American (13.3%, a difference of 0.80%).
| Demographics | Rating | Rank | Male Disability |
| Crow | 0.0 /100 | #302 | Tragic 13.1% |
| Scotch-Irish | 0.0 /100 | #303 | Tragic 13.2% |
| Blacks/African Americans | 0.0 /100 | #304 | Tragic 13.2% |
| French Canadians | 0.0 /100 | #305 | Tragic 13.3% |
| Spanish Americans | 0.0 /100 | #306 | Tragic 13.3% |
| Arapaho | 0.0 /100 | #307 | Tragic 13.3% |
| French American Indians | 0.0 /100 | #308 | Tragic 13.4% |
| Blackfeet | 0.0 /100 | #309 | Tragic 13.4% |
| Immigrants from the Azores | 0.0 /100 | #310 | Tragic 13.4% |
| Delaware | 0.0 /100 | #311 | Tragic 13.5% |
| Yakama | 0.0 /100 | #312 | Tragic 13.5% |
| Puget Sound Salish | 0.0 /100 | #313 | Tragic 13.5% |
| Aleuts | 0.0 /100 | #314 | Tragic 13.5% |
| Iroquois | 0.0 /100 | #315 | Tragic 13.6% |
| Alaska Natives | 0.0 /100 | #316 | Tragic 13.6% |
Blackfeet Male Disability Correlation Summary
| Measurement | Blackfeet Data | Male Disability Data |
| Minimum | 0.088% | 5.6% |
| Maximum | 92.8% | 50.0% |
| Range | 92.7% | 44.4% |
| Mean | 25.3% | 19.6% |
| Median | 13.2% | 18.6% |
| Interquartile 25% (IQ1) | 6.0% | 15.2% |
| Interquartile 75% (IQ3) | 32.8% | 22.2% |
| Interquartile Range (IQR) | 26.8% | 6.9% |
| Standard Deviation (Sample) | 28.4% | 7.9% |
| Standard Deviation (Population) | 28.1% | 7.8% |
Correlation Details
| Blackfeet Percentile | Sample Size | Male Disability |
[ 0.0% - 0.5% ] 0.088% | 300,787,379 | 12.4% |
[ 0.5% - 1.0% ] 0.68% | 6,546,447 | 15.2% |
[ 1.0% - 1.5% ] 1.21% | 990,638 | 17.7% |
[ 1.5% - 2.0% ] 1.73% | 682,769 | 16.9% |
[ 2.0% - 2.5% ] 2.20% | 216,637 | 17.1% |
[ 2.5% - 3.0% ] 2.69% | 76,209 | 16.0% |
[ 3.0% - 3.5% ] 3.23% | 47,117 | 20.7% |
[ 3.5% - 4.0% ] 3.76% | 28,981 | 19.9% |
[ 4.0% - 4.5% ] 4.26% | 32,829 | 18.0% |
[ 4.5% - 5.0% ] 4.72% | 8,304 | 17.4% |
[ 5.0% - 5.5% ] 5.29% | 8,429 | 23.0% |
[ 5.5% - 6.0% ] 5.82% | 14,933 | 18.9% |
[ 6.0% - 6.5% ] 6.26% | 9,647 | 16.0% |
[ 6.5% - 7.0% ] 6.64% | 5,107 | 21.3% |
[ 7.0% - 7.5% ] 7.26% | 4,213 | 30.0% |
[ 7.5% - 8.0% ] 7.67% | 3,965 | 19.6% |
[ 8.0% - 8.5% ] 8.39% | 3,136 | 21.7% |
[ 8.5% - 9.0% ] 8.80% | 2,148 | 15.3% |
[ 9.0% - 9.5% ] 9.07% | 375 | 20.3% |
[ 9.5% - 10.0% ] 9.80% | 1,326 | 22.6% |
[ 10.0% - 10.5% ] 10.32% | 853 | 18.5% |
[ 11.0% - 11.5% ] 11.19% | 2,538 | 20.8% |
[ 12.0% - 12.5% ] 12.24% | 147 | 24.7% |
[ 12.5% - 13.0% ] 12.58% | 1,240 | 21.5% |
[ 13.0% - 13.5% ] 13.20% | 197 | 14.6% |
[ 13.5% - 14.0% ] 13.70% | 752 | 8.8% |
[ 14.5% - 15.0% ] 14.58% | 240 | 11.7% |
[ 16.0% - 16.5% ] 16.28% | 1,253 | 23.5% |
[ 16.5% - 17.0% ] 16.74% | 227 | 5.6% |
[ 17.5% - 18.0% ] 17.94% | 3,061 | 24.0% |
[ 19.5% - 20.0% ] 19.83% | 116 | 32.7% |
[ 22.5% - 23.0% ] 22.98% | 5,008 | 25.9% |
[ 23.5% - 24.0% ] 23.75% | 480 | 14.3% |
[ 24.5% - 25.0% ] 24.88% | 414 | 15.2% |
[ 25.0% - 25.5% ] 25.15% | 163 | 31.4% |
[ 31.5% - 32.0% ] 31.95% | 241 | 34.9% |
[ 32.0% - 32.5% ] 32.07% | 343 | 35.4% |
[ 33.5% - 34.0% ] 33.61% | 244 | 18.6% |
[ 34.5% - 35.0% ] 34.78% | 1,317 | 20.6% |
[ 40.5% - 41.0% ] 40.90% | 863 | 13.1% |
[ 47.0% - 47.5% ] 47.23% | 271 | 10.2% |
[ 50.0% - 50.5% ] 50.00% | 4 | 50.0% |
[ 82.0% - 82.5% ] 82.35% | 1,654 | 15.4% |
[ 84.0% - 84.5% ] 84.09% | 7,532 | 13.9% |
[ 85.5% - 86.0% ] 85.65% | 871 | 8.8% |
[ 88.0% - 88.5% ] 88.34% | 3,001 | 9.5% |
[ 89.5% - 90.0% ] 89.96% | 229 | 16.8% |
[ 90.0% - 90.5% ] 90.43% | 690 | 20.3% |
[ 92.5% - 93.0% ] 92.78% | 554 | 21.6% |