Bahamian 1 or more Vehicles in Household
COMPARE
Bahamian
Select to Compare
1 or more Vehicles in Household
Bahamian 1 or more Vehicles in Household
90.2%
1+ VEHICLES AVAILABLE
80.5/ 100
METRIC RATING
146th/ 347
METRIC RANK
Bahamian 1 or more Vehicles in Household Correlation Chart
The statistical analysis conducted on geographies consisting of 112,631,692 people shows a poor negative correlation between the proportion of Bahamians and percentage of households with 1 or more vehicles available in the United States with a correlation coefficient (R) of -0.148 and weighted average of 90.2%. On average, for every 1% (one percent) increase in Bahamians within a typical geography, there is a decrease of 0.33% in percentage of households with 1 or more vehicles available.
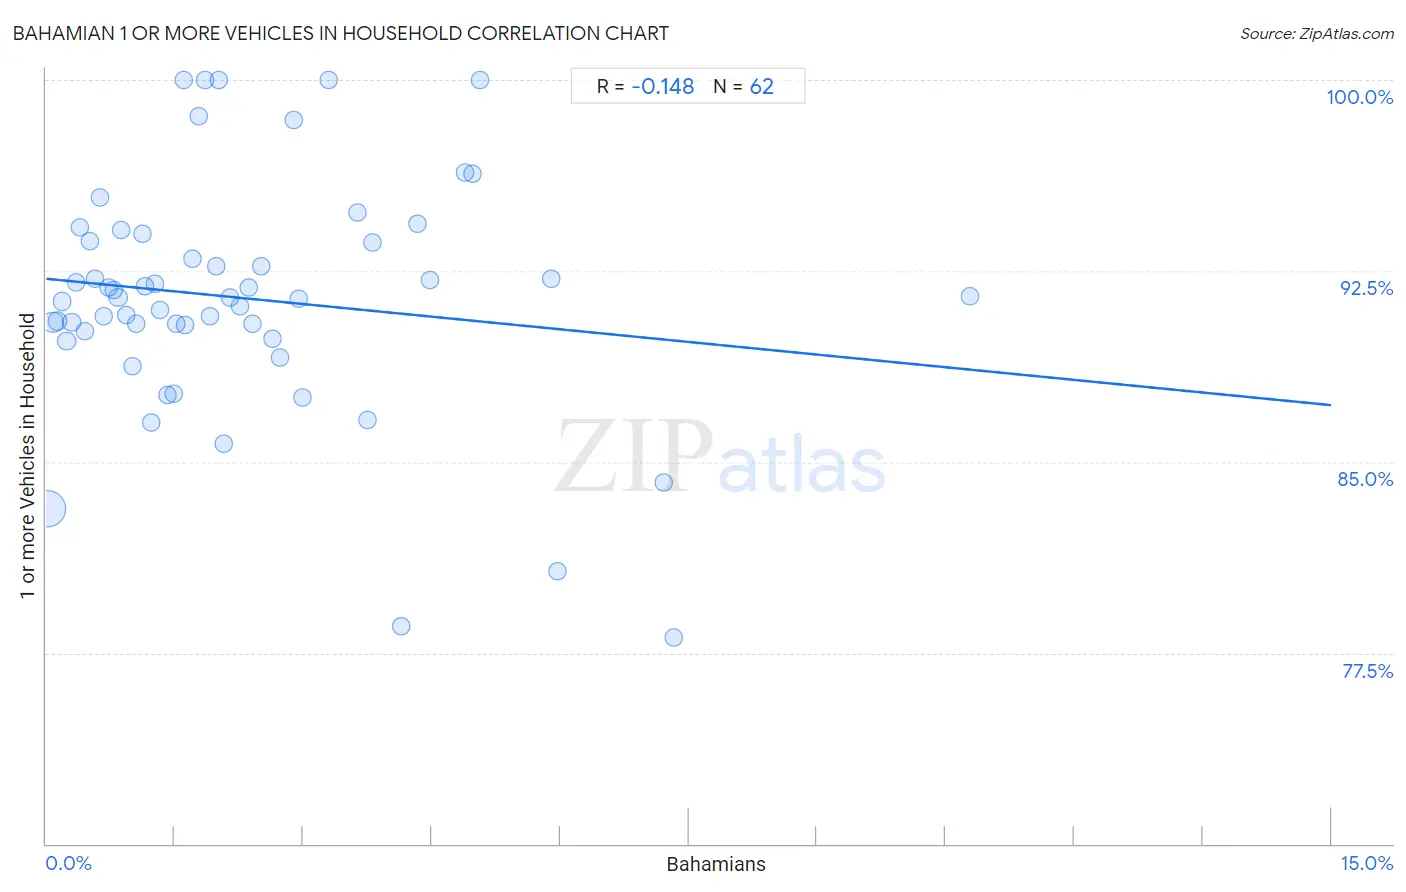
It is essential to understand that the correlation between the percentage of Bahamians and percentage of households with 1 or more vehicles available does not imply a direct cause-and-effect relationship. It remains uncertain whether the presence of Bahamians influences an upward or downward trend in the level of percentage of households with 1 or more vehicles available within an area, or if Bahamians simply ended up residing in those areas with higher or lower levels of percentage of households with 1 or more vehicles available due to other factors.
Demographics Similar to Bahamians by 1 or more Vehicles in Household
In terms of 1 or more vehicles in household, the demographic groups most similar to Bahamians are Immigrants from Zimbabwe (90.2%, a difference of 0.020%), Sioux (90.2%, a difference of 0.020%), Chilean (90.2%, a difference of 0.020%), Immigrants from Bahamas (90.2%, a difference of 0.030%), and Immigrants from Eastern Africa (90.1%, a difference of 0.050%).
| Demographics | Rating | Rank | 1 or more Vehicles in Household |
| Estonians | 85.6 /100 | #139 | Excellent 90.3% |
| Sudanese | 85.2 /100 | #140 | Excellent 90.3% |
| Immigrants from Moldova | 83.1 /100 | #141 | Excellent 90.2% |
| Immigrants from Lithuania | 83.0 /100 | #142 | Excellent 90.2% |
| Immigrants from Bahamas | 81.5 /100 | #143 | Excellent 90.2% |
| Immigrants from Zimbabwe | 81.5 /100 | #144 | Excellent 90.2% |
| Sioux | 81.3 /100 | #145 | Excellent 90.2% |
| Bahamians | 80.5 /100 | #146 | Excellent 90.2% |
| Chileans | 79.8 /100 | #147 | Good 90.2% |
| Immigrants from Eastern Africa | 78.2 /100 | #148 | Good 90.1% |
| Immigrants from Nicaragua | 76.7 /100 | #149 | Good 90.1% |
| Immigrants from Micronesia | 75.9 /100 | #150 | Good 90.1% |
| Immigrants from Bosnia and Herzegovina | 75.4 /100 | #151 | Good 90.1% |
| Tlingit-Haida | 74.3 /100 | #152 | Good 90.1% |
| New Zealanders | 73.8 /100 | #153 | Good 90.1% |
Bahamian 1 or more Vehicles in Household Correlation Summary
| Measurement | Bahamian Data | 1 or more Vehicles in Household Data |
| Minimum | 0.017% | 78.1% |
| Maximum | 10.8% | 100.0% |
| Range | 10.8% | 21.9% |
| Mean | 2.3% | 91.4% |
| Median | 1.7% | 91.5% |
| Interquartile 25% (IQ1) | 0.84% | 90.1% |
| Interquartile 75% (IQ3) | 3.0% | 93.7% |
| Interquartile Range (IQR) | 2.1% | 3.6% |
| Standard Deviation (Sample) | 2.1% | 4.7% |
| Standard Deviation (Population) | 2.1% | 4.6% |
Correlation Details
| Bahamian Percentile | Sample Size | 1 or more Vehicles in Household |
[ 0.0% - 0.5% ] 0.017% | 79,568,564 | 83.2% |
[ 0.0% - 0.5% ] 0.077% | 12,666,020 | 90.5% |
[ 0.0% - 0.5% ] 0.13% | 6,207,123 | 90.5% |
[ 0.0% - 0.5% ] 0.19% | 3,576,318 | 91.3% |
[ 0.0% - 0.5% ] 0.24% | 1,427,342 | 89.7% |
[ 0.0% - 0.5% ] 0.29% | 1,862,752 | 90.5% |
[ 0.0% - 0.5% ] 0.35% | 892,171 | 92.1% |
[ 0.0% - 0.5% ] 0.40% | 749,143 | 94.2% |
[ 0.0% - 0.5% ] 0.46% | 706,201 | 90.1% |
[ 0.5% - 1.0% ] 0.51% | 750,096 | 93.7% |
[ 0.5% - 1.0% ] 0.57% | 565,412 | 92.2% |
[ 0.5% - 1.0% ] 0.62% | 509,767 | 95.4% |
[ 0.5% - 1.0% ] 0.67% | 574,611 | 90.7% |
[ 0.5% - 1.0% ] 0.73% | 283,431 | 91.8% |
[ 0.5% - 1.0% ] 0.79% | 221,731 | 91.8% |
[ 0.5% - 1.0% ] 0.84% | 264,243 | 91.5% |
[ 0.5% - 1.0% ] 0.88% | 132,873 | 94.1% |
[ 0.5% - 1.0% ] 0.94% | 189,649 | 90.8% |
[ 0.5% - 1.0% ] 1.00% | 296,445 | 88.7% |
[ 1.0% - 1.5% ] 1.05% | 70,662 | 90.4% |
[ 1.0% - 1.5% ] 1.12% | 46,612 | 94.0% |
[ 1.0% - 1.5% ] 1.15% | 60,436 | 91.9% |
[ 1.0% - 1.5% ] 1.23% | 31,590 | 86.6% |
[ 1.0% - 1.5% ] 1.27% | 109,405 | 92.0% |
[ 1.0% - 1.5% ] 1.33% | 74,297 | 91.0% |
[ 1.0% - 1.5% ] 1.42% | 19,010 | 87.6% |
[ 1.0% - 1.5% ] 1.48% | 145,059 | 87.7% |
[ 1.5% - 2.0% ] 1.52% | 179,180 | 90.4% |
[ 1.5% - 2.0% ] 1.60% | 3,247 | 100.0% |
[ 1.5% - 2.0% ] 1.62% | 48,077 | 90.4% |
[ 1.5% - 2.0% ] 1.70% | 86,097 | 93.0% |
[ 1.5% - 2.0% ] 1.78% | 338 | 98.6% |
[ 1.5% - 2.0% ] 1.86% | 1,506 | 100.0% |
[ 1.5% - 2.0% ] 1.91% | 47,981 | 90.7% |
[ 1.5% - 2.0% ] 1.98% | 14,126 | 92.7% |
[ 2.0% - 2.5% ] 2.01% | 947 | 100.0% |
[ 2.0% - 2.5% ] 2.07% | 8,340 | 85.7% |
[ 2.0% - 2.5% ] 2.15% | 37,274 | 91.5% |
[ 2.0% - 2.5% ] 2.26% | 2,349 | 91.1% |
[ 2.0% - 2.5% ] 2.37% | 7,689 | 91.8% |
[ 2.0% - 2.5% ] 2.40% | 16,449 | 90.4% |
[ 2.5% - 3.0% ] 2.51% | 3,192 | 92.7% |
[ 2.5% - 3.0% ] 2.64% | 2,576 | 89.8% |
[ 2.5% - 3.0% ] 2.73% | 48,792 | 89.1% |
[ 2.5% - 3.0% ] 2.88% | 27,583 | 98.4% |
[ 2.5% - 3.0% ] 2.95% | 847 | 91.4% |
[ 2.5% - 3.0% ] 2.98% | 6,266 | 87.5% |
[ 3.0% - 3.5% ] 3.30% | 7,385 | 100.0% |
[ 3.5% - 4.0% ] 3.64% | 9,677 | 94.8% |
[ 3.5% - 4.0% ] 3.74% | 1,950 | 86.7% |
[ 3.5% - 4.0% ] 3.81% | 18,487 | 93.6% |
[ 4.0% - 4.5% ] 4.14% | 1,714 | 78.5% |
[ 4.0% - 4.5% ] 4.34% | 8,118 | 94.3% |
[ 4.0% - 4.5% ] 4.48% | 15,735 | 92.1% |
[ 4.5% - 5.0% ] 4.89% | 2,190 | 96.4% |
[ 4.5% - 5.0% ] 4.97% | 2,151 | 96.3% |
[ 5.0% - 5.5% ] 5.07% | 2,426 | 100.0% |
[ 5.5% - 6.0% ] 5.90% | 305 | 92.2% |
[ 5.5% - 6.0% ] 5.97% | 486 | 80.7% |
[ 7.0% - 7.5% ] 7.21% | 14,698 | 84.2% |
[ 7.0% - 7.5% ] 7.32% | 1,011 | 78.1% |
[ 10.5% - 11.0% ] 10.78% | 1,540 | 91.5% |