Paden City, WV Map & Demographics
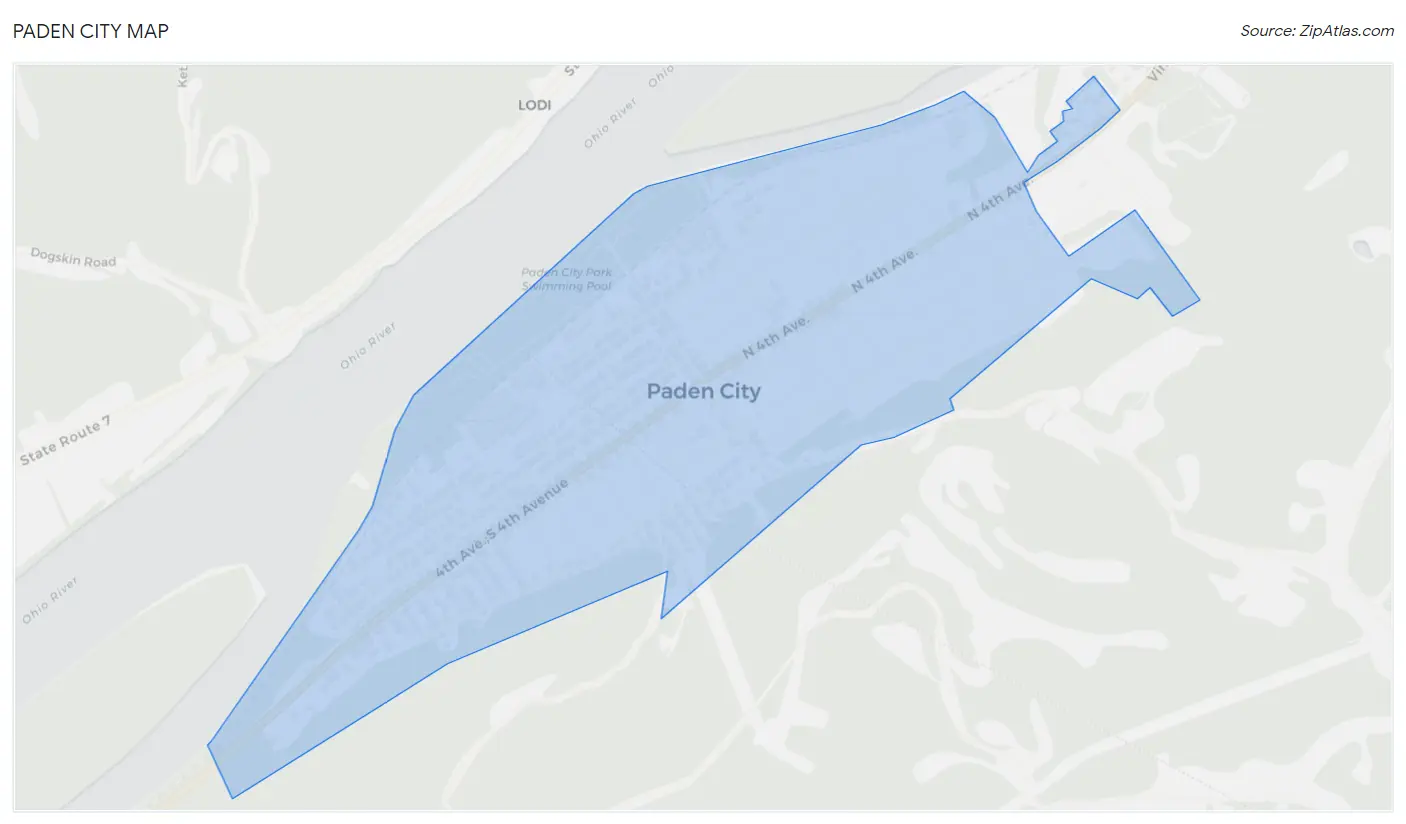
Paden City Map
Paden City Overview
$28,090
PER CAPITA INCOME
$66,389
AVG FAMILY INCOME
$53,833
AVG HOUSEHOLD INCOME
41.9%
WAGE / INCOME GAP [ % ]
58.1¢/ $1
WAGE / INCOME GAP [ $ ]
0.39
INEQUALITY / GINI INDEX
2,740
TOTAL POPULATION
1,465
MALE POPULATION
1,275
FEMALE POPULATION
114.90
MALES / 100 FEMALES
87.03
FEMALES / 100 MALES
41.2
MEDIAN AGE
3.3
AVG FAMILY SIZE
2.6
AVG HOUSEHOLD SIZE
1,176
LABOR FORCE [ PEOPLE ]
51.2%
PERCENT IN LABOR FORCE
5.1%
UNEMPLOYMENT RATE
Paden City Zip Codes
Paden City Area Codes
Income in Paden City
Income Overview in Paden City
Per Capita Income in Paden City is $28,090, while median incomes of families and households are $66,389 and $53,833 respectively.
| Characteristic | Number | Measure |
| Per Capita Income | 2,740 | $28,090 |
| Median Family Income | 698 | $66,389 |
| Mean Family Income | 698 | $76,718 |
| Median Household Income | 1,050 | $53,833 |
| Mean Household Income | 1,050 | $68,033 |
| Income Deficit | 698 | $0 |
| Wage / Income Gap (%) | 2,740 | 41.87% |
| Wage / Income Gap ($) | 2,740 | 58.13¢ per $1 |
| Gini / Inequality Index | 2,740 | 0.39 |
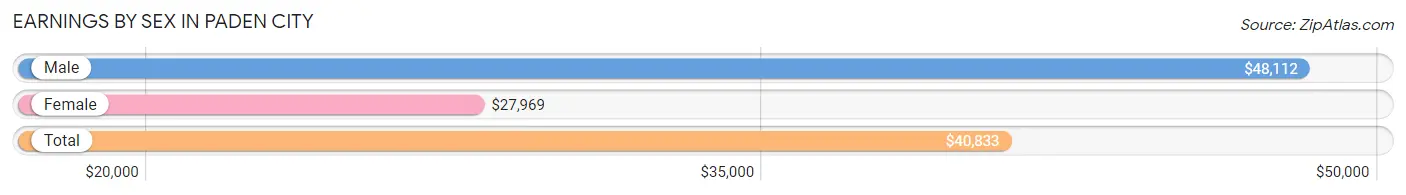
Earnings by Sex in Paden City
Average Earnings in Paden City are $40,833, $48,112 for men and $27,969 for women, a difference of 41.9%.
| Sex | Number | Average Earnings |
| Male | 683 (58.3%) | $48,112 |
| Female | 489 (41.7%) | $27,969 |
| Total | 1,172 (100.0%) | $40,833 |
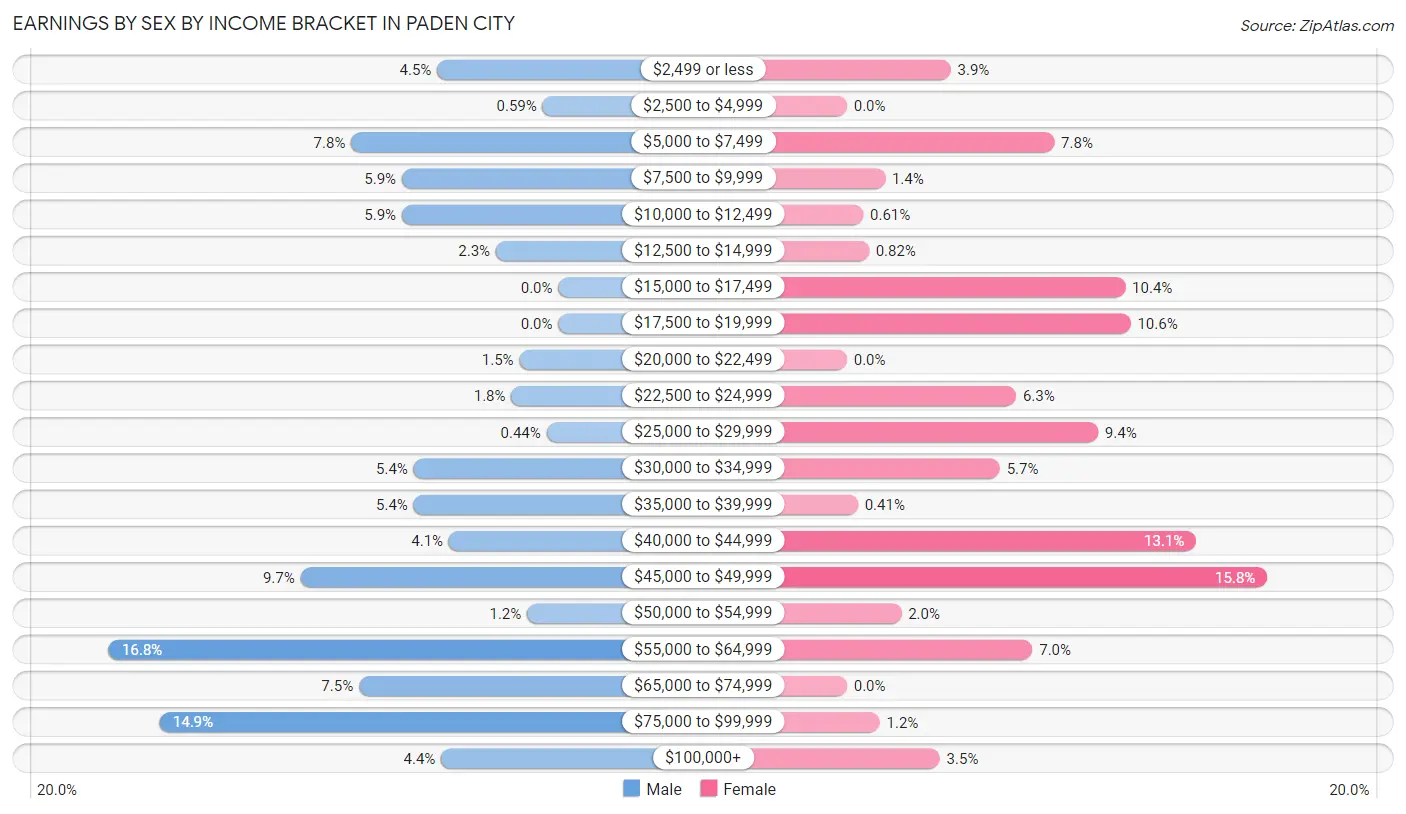
Earnings by Sex by Income Bracket in Paden City
The most common earnings brackets in Paden City are $55,000 to $64,999 for men (115 | 16.8%) and $45,000 to $49,999 for women (77 | 15.8%).
| Income | Male | Female |
| $2,499 or less | 31 (4.5%) | 19 (3.9%) |
| $2,500 to $4,999 | 4 (0.6%) | 0 (0.0%) |
| $5,000 to $7,499 | 53 (7.8%) | 38 (7.8%) |
| $7,500 to $9,999 | 40 (5.9%) | 7 (1.4%) |
| $10,000 to $12,499 | 40 (5.9%) | 3 (0.6%) |
| $12,500 to $14,999 | 16 (2.3%) | 4 (0.8%) |
| $15,000 to $17,499 | 0 (0.0%) | 51 (10.4%) |
| $17,500 to $19,999 | 0 (0.0%) | 52 (10.6%) |
| $20,000 to $22,499 | 10 (1.5%) | 0 (0.0%) |
| $22,500 to $24,999 | 12 (1.8%) | 31 (6.3%) |
| $25,000 to $29,999 | 3 (0.4%) | 46 (9.4%) |
| $30,000 to $34,999 | 37 (5.4%) | 28 (5.7%) |
| $35,000 to $39,999 | 37 (5.4%) | 2 (0.4%) |
| $40,000 to $44,999 | 28 (4.1%) | 64 (13.1%) |
| $45,000 to $49,999 | 66 (9.7%) | 77 (15.8%) |
| $50,000 to $54,999 | 8 (1.2%) | 10 (2.0%) |
| $55,000 to $64,999 | 115 (16.8%) | 34 (7.0%) |
| $65,000 to $74,999 | 51 (7.5%) | 0 (0.0%) |
| $75,000 to $99,999 | 102 (14.9%) | 6 (1.2%) |
| $100,000+ | 30 (4.4%) | 17 (3.5%) |
| Total | 683 (100.0%) | 489 (100.0%) |
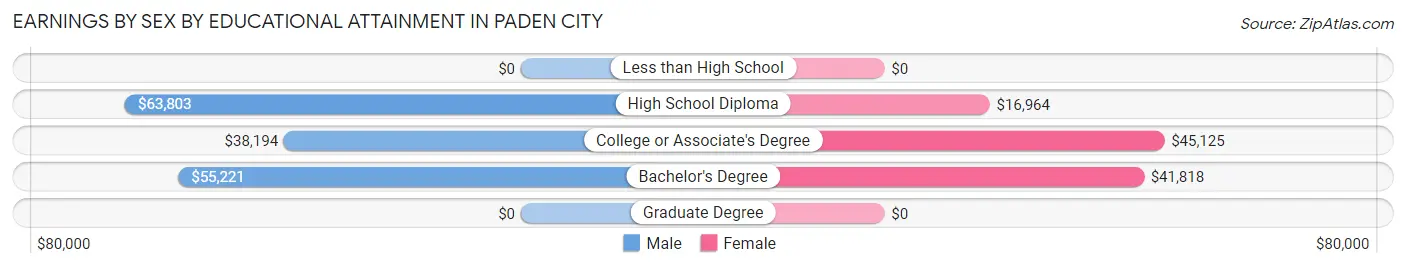
Earnings by Sex by Educational Attainment in Paden City
Average earnings in Paden City are $49,867 for men and $32,500 for women, a difference of 34.8%. Men with an educational attainment of high school diploma enjoy the highest average annual earnings of $63,803, while those with college or associate's degree education earn the least with $38,194. Women with an educational attainment of college or associate's degree earn the most with the average annual earnings of $45,125, while those with high school diploma education have the smallest earnings of $16,964.
| Educational Attainment | Male Income | Female Income |
| Less than High School | - | - |
| High School Diploma | $63,803 | $16,964 |
| College or Associate's Degree | $38,194 | $45,125 |
| Bachelor's Degree | $55,221 | $41,818 |
| Graduate Degree | - | - |
| Total | $49,867 | $32,500 |
Family Income in Paden City
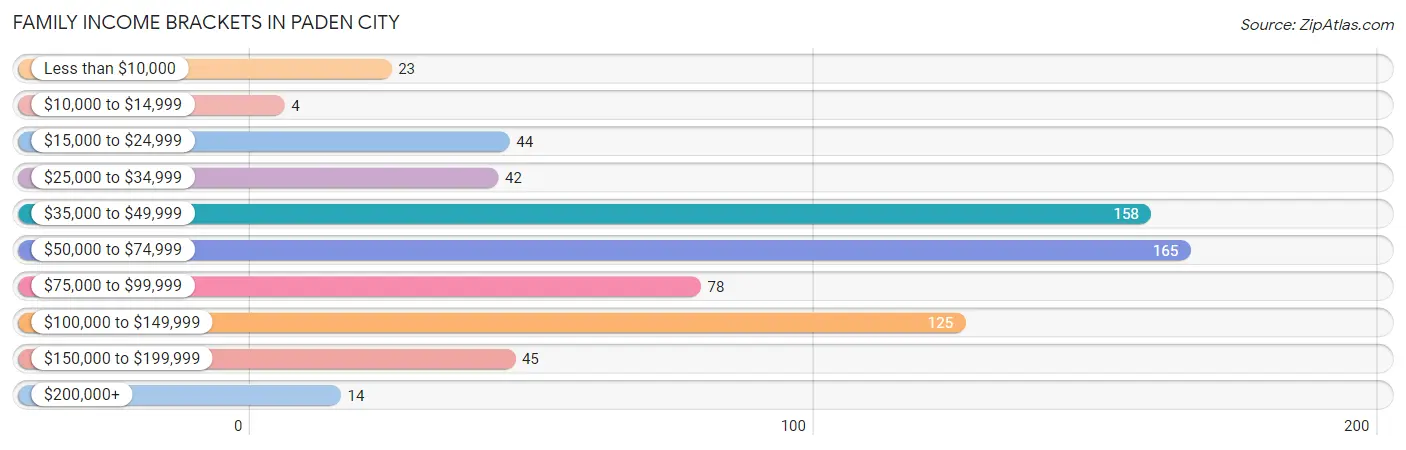
Family Income Brackets in Paden City
According to the Paden City family income data, there are 165 families falling into the $50,000 to $74,999 income range, which is the most common income bracket and makes up 23.6% of all families. Conversely, the $10,000 to $14,999 income bracket is the least frequent group with only 4 families (0.6%) belonging to this category.
| Income Bracket | # Families | % Families |
| Less than $10,000 | 23 | 3.3% |
| $10,000 to $14,999 | 4 | 0.6% |
| $15,000 to $24,999 | 44 | 6.3% |
| $25,000 to $34,999 | 42 | 6.0% |
| $35,000 to $49,999 | 158 | 22.6% |
| $50,000 to $74,999 | 165 | 23.6% |
| $75,000 to $99,999 | 78 | 11.2% |
| $100,000 to $149,999 | 125 | 17.9% |
| $150,000 to $199,999 | 45 | 6.4% |
| $200,000+ | 14 | 2.0% |
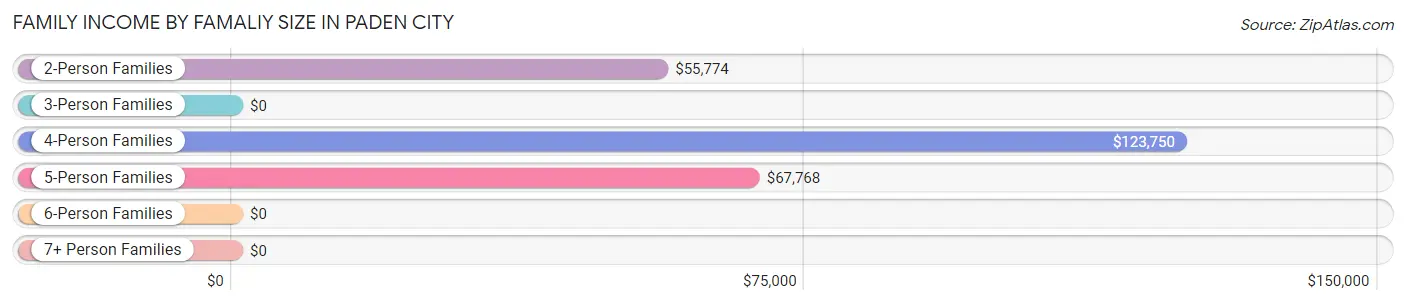
Family Income by Famaliy Size in Paden City
4-person families (102 | 14.6%) account for the highest median family income in Paden City with $123,750 per family, while 4-person families (102 | 14.6%) have the highest median income of $30,938 per family member.
| Income Bracket | # Families | Median Income |
| 2-Person Families | 425 (60.9%) | $55,774 |
| 3-Person Families | 81 (11.6%) | $0 |
| 4-Person Families | 102 (14.6%) | $123,750 |
| 5-Person Families | 50 (7.2%) | $67,768 |
| 6-Person Families | 37 (5.3%) | $0 |
| 7+ Person Families | 3 (0.4%) | $0 |
| Total | 698 (100.0%) | $66,389 |
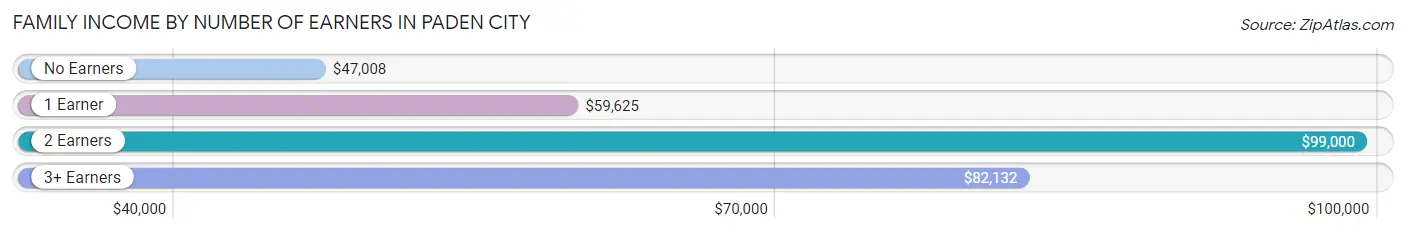
Family Income by Number of Earners in Paden City
The median family income in Paden City is $66,389, with families comprising 2 earners (148) having the highest median family income of $99,000, while families with no earners (207) have the lowest median family income of $47,008, accounting for 21.2% and 29.7% of families, respectively.
| Number of Earners | # Families | Median Income |
| No Earners | 207 (29.7%) | $47,008 |
| 1 Earner | 265 (38.0%) | $59,625 |
| 2 Earners | 148 (21.2%) | $99,000 |
| 3+ Earners | 78 (11.2%) | $82,132 |
| Total | 698 (100.0%) | $66,389 |
Household Income in Paden City
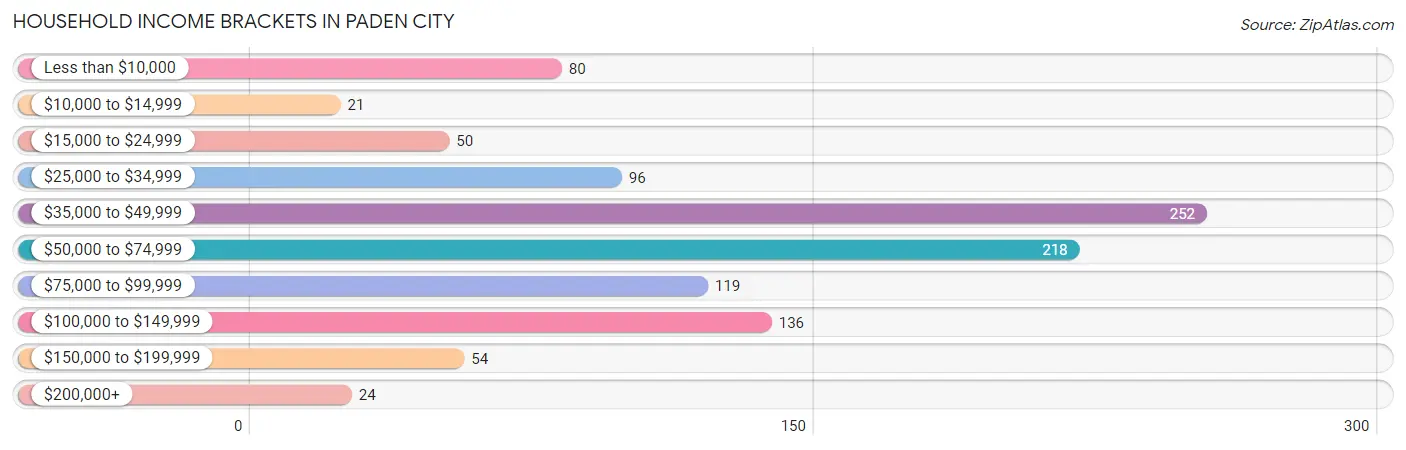
Household Income Brackets in Paden City
With 252 households falling in the category, the $35,000 to $49,999 income range is the most frequent in Paden City, accounting for 24.0% of all households. In contrast, only 21 households (2.0%) fall into the $10,000 to $14,999 income bracket, making it the least populous group.
| Income Bracket | # Households | % Households |
| Less than $10,000 | 80 | 7.6% |
| $10,000 to $14,999 | 21 | 2.0% |
| $15,000 to $24,999 | 50 | 4.8% |
| $25,000 to $34,999 | 96 | 9.1% |
| $35,000 to $49,999 | 252 | 24.0% |
| $50,000 to $74,999 | 218 | 20.8% |
| $75,000 to $99,999 | 119 | 11.3% |
| $100,000 to $149,999 | 136 | 13.0% |
| $150,000 to $199,999 | 54 | 5.1% |
| $200,000+ | 24 | 2.3% |
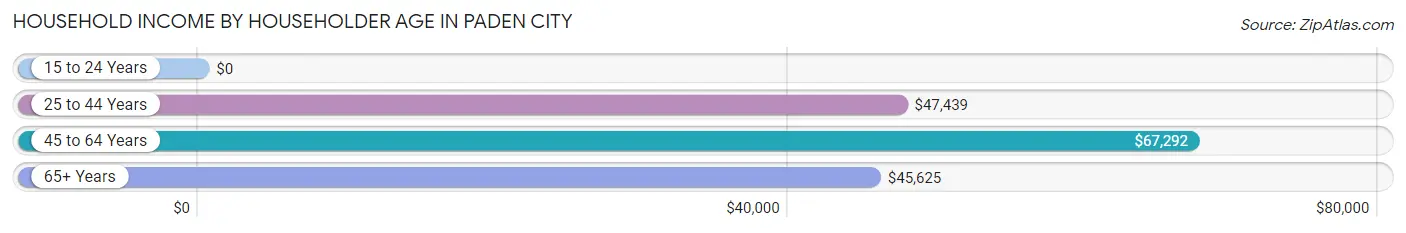
Household Income by Householder Age in Paden City
The median household income in Paden City is $53,833, with the highest median household income of $67,292 found in the 45 to 64 years age bracket for the primary householder. A total of 387 households (36.9%) fall into this category.
| Income Bracket | # Households | Median Income |
| 15 to 24 Years | 0 (0.0%) | $0 |
| 25 to 44 Years | 288 (27.4%) | $47,439 |
| 45 to 64 Years | 387 (36.9%) | $67,292 |
| 65+ Years | 375 (35.7%) | $45,625 |
| Total | 1,050 (100.0%) | $53,833 |
Poverty in Paden City
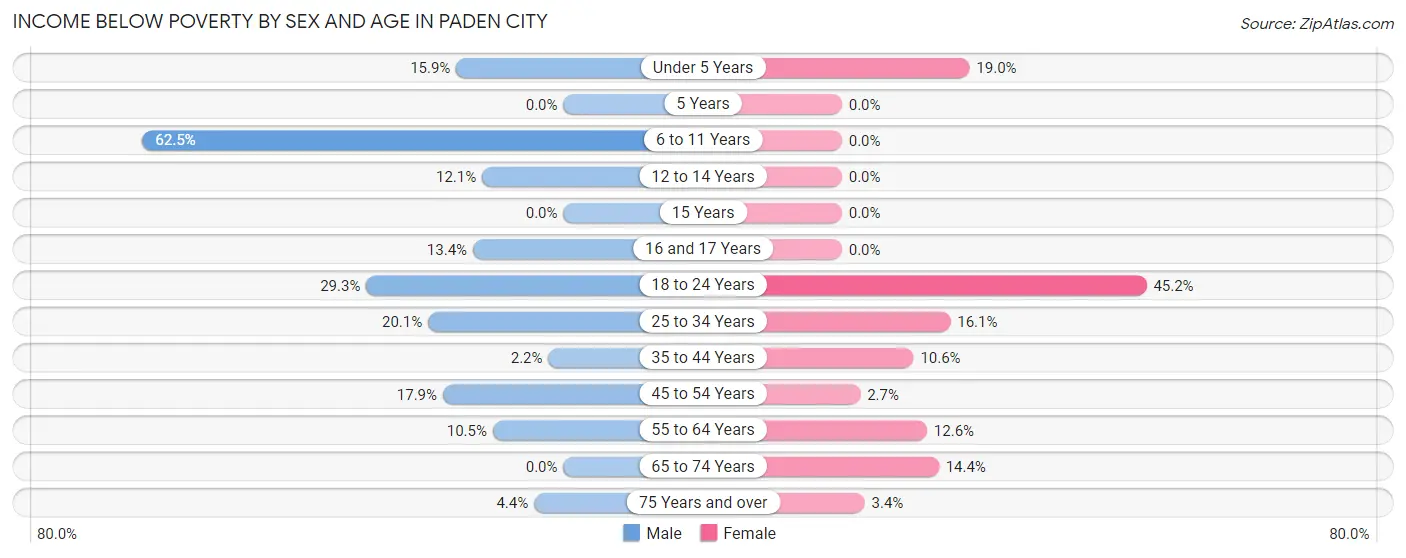
Income Below Poverty by Sex and Age in Paden City
With 13.2% poverty level for males and 11.8% for females among the residents of Paden City, 6 to 11 year old males and 18 to 24 year old females are the most vulnerable to poverty, with 15 males (62.5%) and 19 females (45.2%) in their respective age groups living below the poverty level.
| Age Bracket | Male | Female |
| Under 5 Years | 14 (15.9%) | 29 (19.0%) |
| 5 Years | 0 (0.0%) | 0 (0.0%) |
| 6 to 11 Years | 15 (62.5%) | 0 (0.0%) |
| 12 to 14 Years | 14 (12.1%) | 0 (0.0%) |
| 15 Years | 0 (0.0%) | 0 (0.0%) |
| 16 and 17 Years | 9 (13.4%) | 0 (0.0%) |
| 18 to 24 Years | 48 (29.3%) | 19 (45.2%) |
| 25 to 34 Years | 43 (20.1%) | 34 (16.1%) |
| 35 to 44 Years | 4 (2.2%) | 15 (10.6%) |
| 45 to 54 Years | 22 (17.9%) | 4 (2.7%) |
| 55 to 64 Years | 18 (10.5%) | 23 (12.6%) |
| 65 to 74 Years | 0 (0.0%) | 20 (14.4%) |
| 75 Years and over | 6 (4.3%) | 6 (3.4%) |
| Total | 193 (13.2%) | 150 (11.8%) |
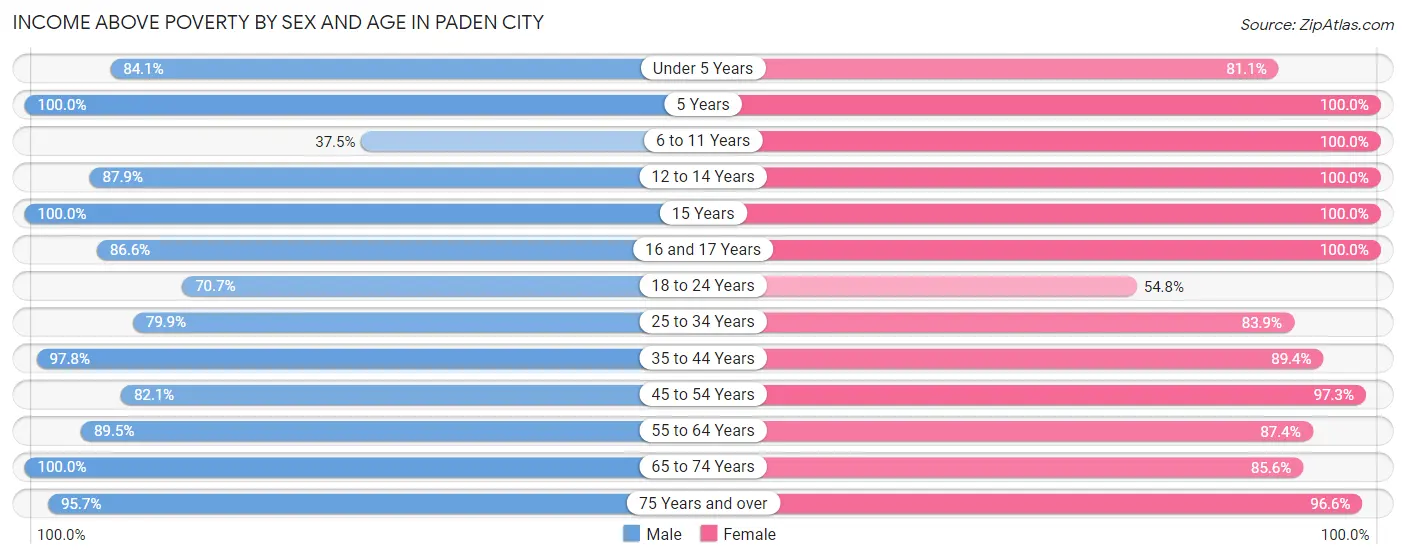
Income Above Poverty by Sex and Age in Paden City
According to the poverty statistics in Paden City, males aged 5 years and females aged 5 years are the age groups that are most secure financially, with 100.0% of males and 100.0% of females in these age groups living above the poverty line.
| Age Bracket | Male | Female |
| Under 5 Years | 74 (84.1%) | 124 (81.0%) |
| 5 Years | 18 (100.0%) | 8 (100.0%) |
| 6 to 11 Years | 9 (37.5%) | 3 (100.0%) |
| 12 to 14 Years | 102 (87.9%) | 22 (100.0%) |
| 15 Years | 5 (100.0%) | 6 (100.0%) |
| 16 and 17 Years | 58 (86.6%) | 45 (100.0%) |
| 18 to 24 Years | 116 (70.7%) | 23 (54.8%) |
| 25 to 34 Years | 171 (79.9%) | 177 (83.9%) |
| 35 to 44 Years | 175 (97.8%) | 126 (89.4%) |
| 45 to 54 Years | 101 (82.1%) | 142 (97.3%) |
| 55 to 64 Years | 154 (89.5%) | 159 (87.4%) |
| 65 to 74 Years | 157 (100.0%) | 119 (85.6%) |
| 75 Years and over | 132 (95.7%) | 171 (96.6%) |
| Total | 1,272 (86.8%) | 1,125 (88.2%) |
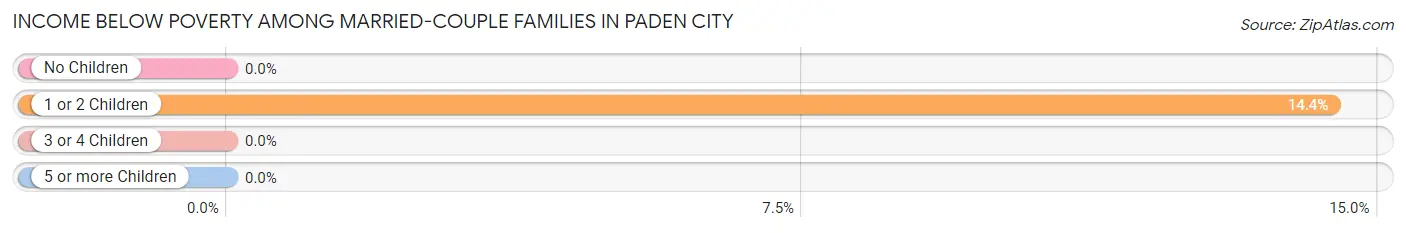
Income Below Poverty Among Married-Couple Families in Paden City
The poverty statistics for married-couple families in Paden City show that 3.5% or 20 of the total 563 families live below the poverty line. Families with 1 or 2 children have the highest poverty rate of 14.4%, comprising of 20 families. On the other hand, families with no children have the lowest poverty rate of 0.0%, which includes 0 families.
| Children | Above Poverty | Below Poverty |
| No Children | 386 (100.0%) | 0 (0.0%) |
| 1 or 2 Children | 119 (85.6%) | 20 (14.4%) |
| 3 or 4 Children | 35 (100.0%) | 0 (0.0%) |
| 5 or more Children | 3 (100.0%) | 0 (0.0%) |
| Total | 543 (96.5%) | 20 (3.5%) |
Income Below Poverty Among Single-Parent Households in Paden City
According to the poverty data in Paden City, 4.8% or 3 single-father households and 37.5% or 27 single-mother households are living below the poverty line. Among single-father households, those with no children have the highest poverty rate, with 3 households (5.8%) experiencing poverty. Likewise, among single-mother households, those with 1 or 2 children have the highest poverty rate, with 18 households (46.2%) falling below the poverty line.
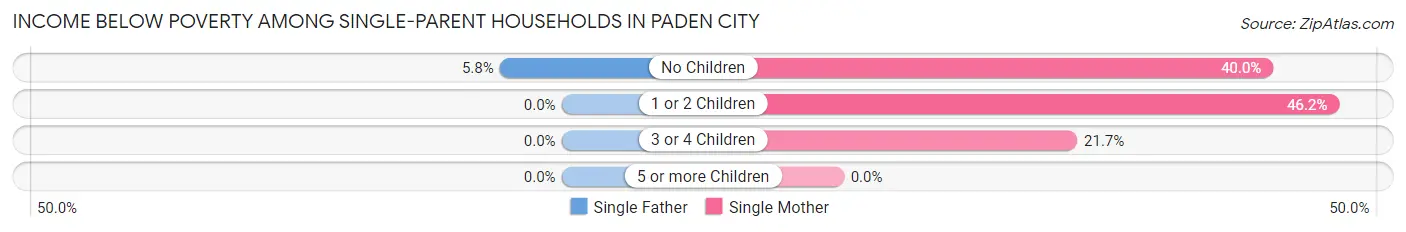
| Children | Single Father | Single Mother |
| No Children | 3 (5.8%) | 4 (40.0%) |
| 1 or 2 Children | 0 (0.0%) | 18 (46.2%) |
| 3 or 4 Children | 0 (0.0%) | 5 (21.7%) |
| 5 or more Children | 0 (0.0%) | 0 (0.0%) |
| Total | 3 (4.8%) | 27 (37.5%) |
Income Below Poverty Among Married-Couple vs Single-Parent Households in Paden City
The poverty data for Paden City shows that 20 of the married-couple family households (3.5%) and 30 of the single-parent households (22.2%) are living below the poverty level. Within the married-couple family households, those with 1 or 2 children have the highest poverty rate, with 20 households (14.4%) falling below the poverty line. Among the single-parent households, those with 1 or 2 children have the highest poverty rate, with 18 household (40.9%) living below poverty.
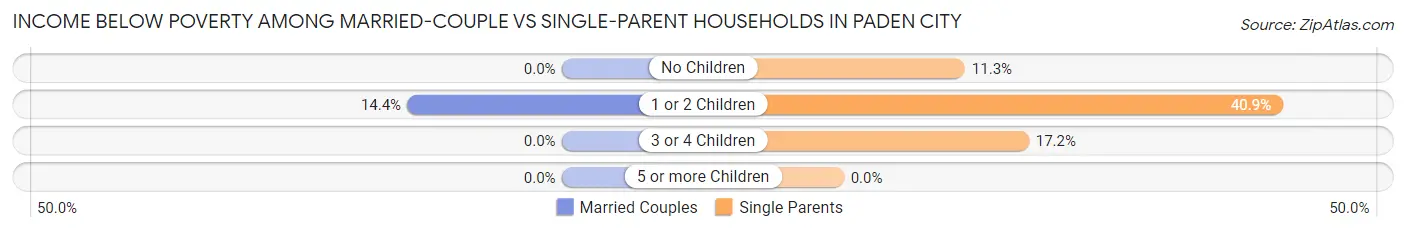
| Children | Married-Couple Families | Single-Parent Households |
| No Children | 0 (0.0%) | 7 (11.3%) |
| 1 or 2 Children | 20 (14.4%) | 18 (40.9%) |
| 3 or 4 Children | 0 (0.0%) | 5 (17.2%) |
| 5 or more Children | 0 (0.0%) | 0 (0.0%) |
| Total | 20 (3.5%) | 30 (22.2%) |
Race in Paden City
The most populous races in Paden City are White / Caucasian (2,680 | 97.8%), Two or more Races (46 | 1.7%), and Some other Race (14 | 0.5%).
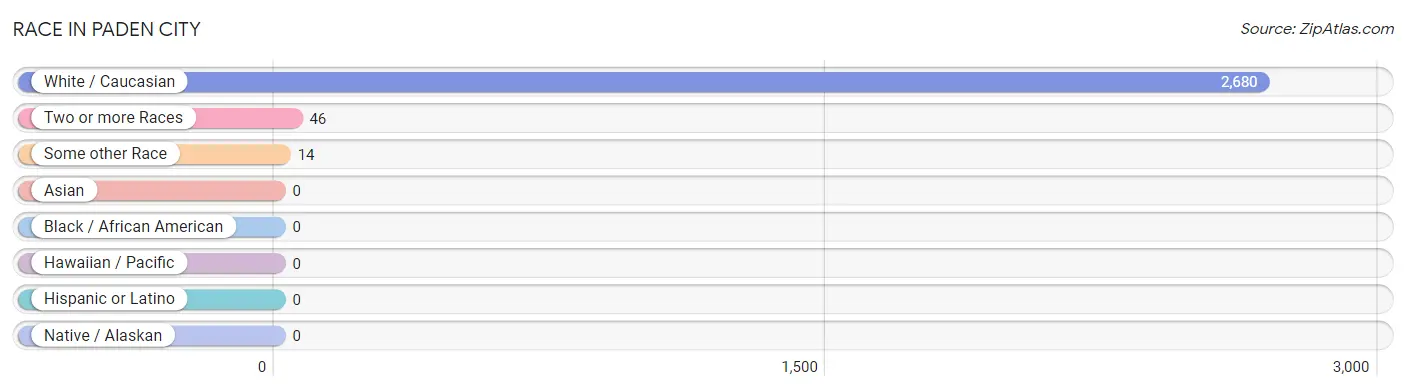
| Race | # Population | % Population |
| Asian | 0 | 0.0% |
| Black / African American | 0 | 0.0% |
| Hawaiian / Pacific | 0 | 0.0% |
| Hispanic or Latino | 0 | 0.0% |
| Native / Alaskan | 0 | 0.0% |
| White / Caucasian | 2,680 | 97.8% |
| Two or more Races | 46 | 1.7% |
| Some other Race | 14 | 0.5% |
| Total | 2,740 | 100.0% |
Ancestry in Paden City
The most populous ancestries reported in Paden City are German (256 | 9.3%), Irish (197 | 7.2%), English (193 | 7.0%), American (185 | 6.8%), and French (51 | 1.9%), together accounting for 32.2% of all Paden City residents.
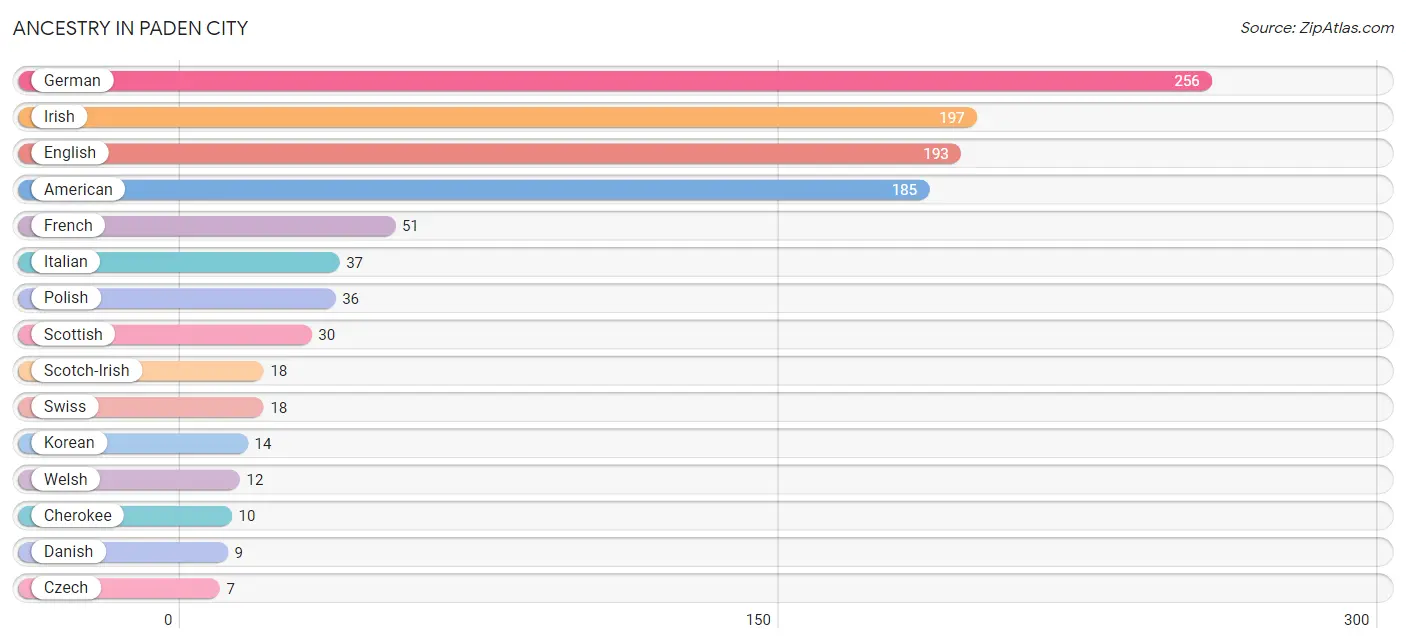
| Ancestry | # Population | % Population |
| American | 185 | 6.8% |
| British | 5 | 0.2% |
| Cherokee | 10 | 0.4% |
| Czech | 7 | 0.3% |
| Danish | 9 | 0.3% |
| Dutch | 4 | 0.2% |
| Eastern European | 4 | 0.2% |
| English | 193 | 7.0% |
| European | 6 | 0.2% |
| French | 51 | 1.9% |
| German | 256 | 9.3% |
| Irish | 197 | 7.2% |
| Italian | 37 | 1.3% |
| Korean | 14 | 0.5% |
| Norwegian | 6 | 0.2% |
| Polish | 36 | 1.3% |
| Romanian | 1 | 0.0% |
| Scotch-Irish | 18 | 0.7% |
| Scottish | 30 | 1.1% |
| Swiss | 18 | 0.7% |
| Welsh | 12 | 0.4% | View All 21 Rows |
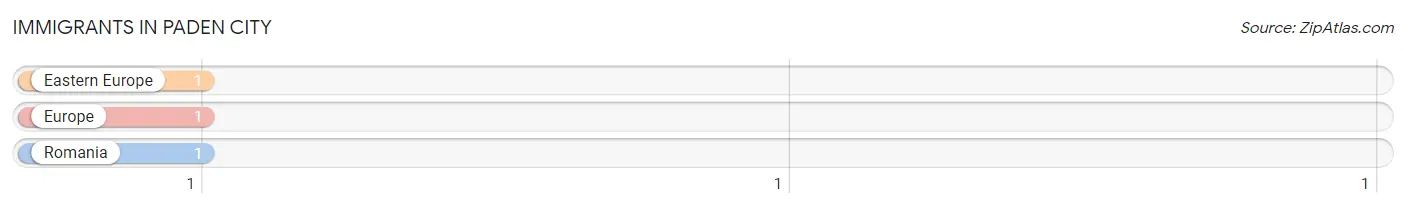
Immigrants in Paden City
The most numerous immigrant groups reported in Paden City came from Eastern Europe (1 | 0.0%), Europe (1 | 0.0%), and Romania (1 | 0.0%), together accounting for 0.1% of all Paden City residents.
| Immigration Origin | # Population | % Population |
| Eastern Europe | 1 | 0.0% |
| Europe | 1 | 0.0% |
| Romania | 1 | 0.0% | View All 3 Rows |
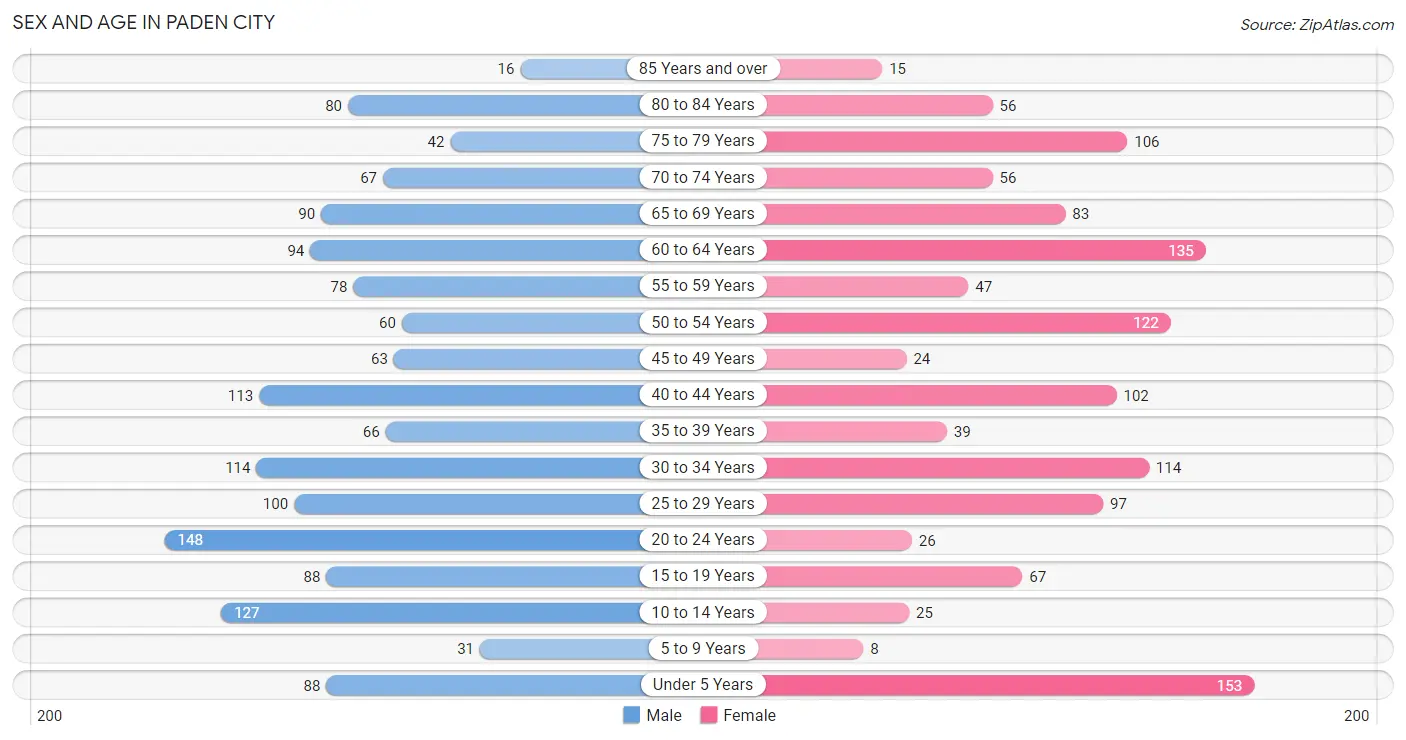
Sex and Age in Paden City
Sex and Age in Paden City
The most populous age groups in Paden City are 20 to 24 Years (148 | 10.1%) for men and Under 5 Years (153 | 12.0%) for women.
| Age Bracket | Male | Female |
| Under 5 Years | 88 (6.0%) | 153 (12.0%) |
| 5 to 9 Years | 31 (2.1%) | 8 (0.6%) |
| 10 to 14 Years | 127 (8.7%) | 25 (2.0%) |
| 15 to 19 Years | 88 (6.0%) | 67 (5.2%) |
| 20 to 24 Years | 148 (10.1%) | 26 (2.0%) |
| 25 to 29 Years | 100 (6.8%) | 97 (7.6%) |
| 30 to 34 Years | 114 (7.8%) | 114 (8.9%) |
| 35 to 39 Years | 66 (4.5%) | 39 (3.1%) |
| 40 to 44 Years | 113 (7.7%) | 102 (8.0%) |
| 45 to 49 Years | 63 (4.3%) | 24 (1.9%) |
| 50 to 54 Years | 60 (4.1%) | 122 (9.6%) |
| 55 to 59 Years | 78 (5.3%) | 47 (3.7%) |
| 60 to 64 Years | 94 (6.4%) | 135 (10.6%) |
| 65 to 69 Years | 90 (6.1%) | 83 (6.5%) |
| 70 to 74 Years | 67 (4.6%) | 56 (4.4%) |
| 75 to 79 Years | 42 (2.9%) | 106 (8.3%) |
| 80 to 84 Years | 80 (5.5%) | 56 (4.4%) |
| 85 Years and over | 16 (1.1%) | 15 (1.2%) |
| Total | 1,465 (100.0%) | 1,275 (100.0%) |
Families and Households in Paden City
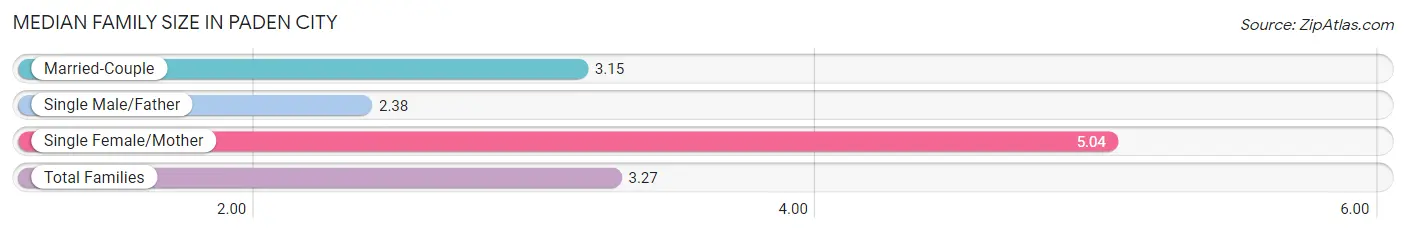
Median Family Size in Paden City
The median family size in Paden City is 3.27 persons per family, with single female/mother families (72 | 10.3%) accounting for the largest median family size of 5.04 persons per family. On the other hand, single male/father families (63 | 9.0%) represent the smallest median family size with 2.38 persons per family.
| Family Type | # Families | Family Size |
| Married-Couple | 563 (80.7%) | 3.15 |
| Single Male/Father | 63 (9.0%) | 2.38 |
| Single Female/Mother | 72 (10.3%) | 5.04 |
| Total Families | 698 (100.0%) | 3.27 |
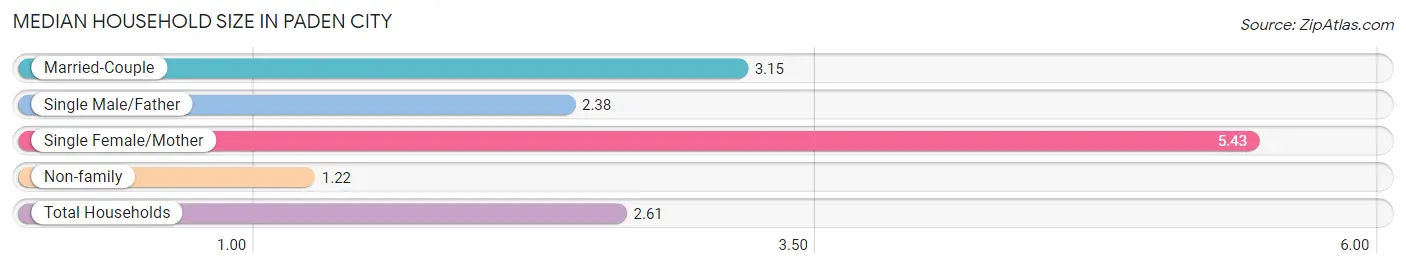
Median Household Size in Paden City
The median household size in Paden City is 2.61 persons per household, with single female/mother households (72 | 6.9%) accounting for the largest median household size of 5.43 persons per household. non-family households (352 | 33.5%) represent the smallest median household size with 1.22 persons per household.
| Household Type | # Households | Household Size |
| Married-Couple | 563 (53.6%) | 3.15 |
| Single Male/Father | 63 (6.0%) | 2.38 |
| Single Female/Mother | 72 (6.9%) | 5.43 |
| Non-family | 352 (33.5%) | 1.22 |
| Total Households | 1,050 (100.0%) | 2.61 |
Household Size by Marriage Status in Paden City
Out of a total of 1,050 households in Paden City, 698 (66.5%) are family households, while 352 (33.5%) are nonfamily households. The most numerous type of family households are 2-person households, comprising 404, and the most common type of nonfamily households are 1-person households, comprising 313.
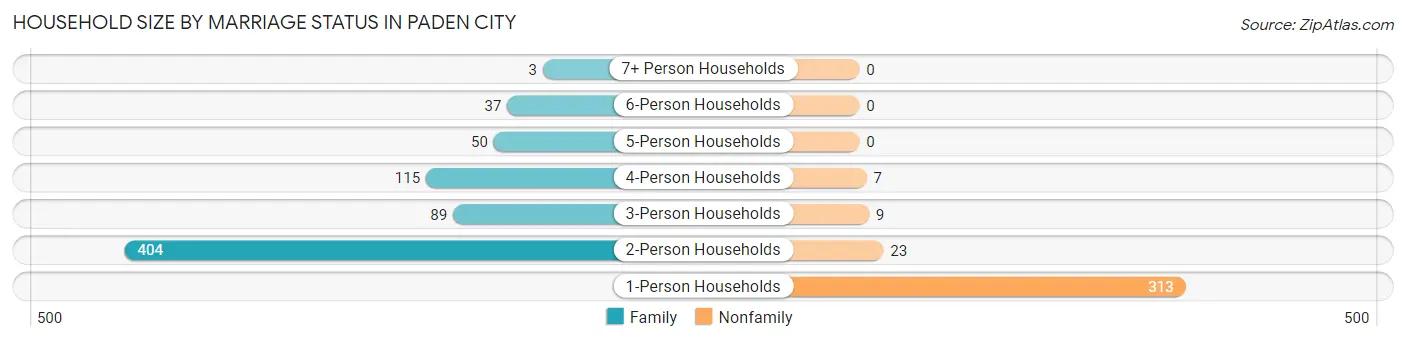
| Household Size | Family Households | Nonfamily Households |
| 1-Person Households | - | 313 (29.8%) |
| 2-Person Households | 404 (38.5%) | 23 (2.2%) |
| 3-Person Households | 89 (8.5%) | 9 (0.9%) |
| 4-Person Households | 115 (11.0%) | 7 (0.7%) |
| 5-Person Households | 50 (4.8%) | 0 (0.0%) |
| 6-Person Households | 37 (3.5%) | 0 (0.0%) |
| 7+ Person Households | 3 (0.3%) | 0 (0.0%) |
| Total | 698 (66.5%) | 352 (33.5%) |
Female Fertility in Paden City
Fertility by Age in Paden City
Average fertility rate in Paden City is 43.0 births per 1,000 women. Women in the age bracket of 20 to 34 years have the highest fertility rate with 93.0 births per 1,000 women. Women in the age bracket of 20 to 34 years acount for 100.0% of all women with births.
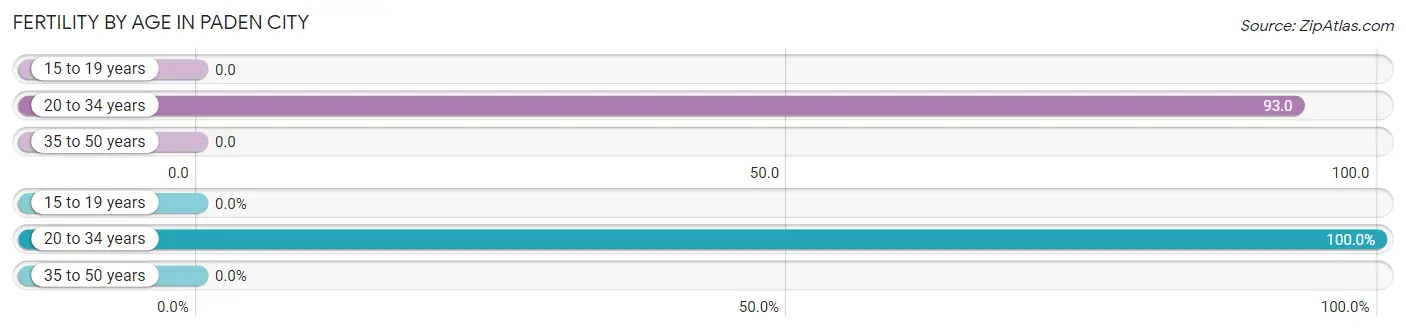
| Age Bracket | Women with Births | Births / 1,000 Women |
| 15 to 19 years | 0 (0.0%) | 0.0 |
| 20 to 34 years | 22 (100.0%) | 93.0 |
| 35 to 50 years | 0 (0.0%) | 0.0 |
| Total | 22 (100.0%) | 43.0 |
Fertility by Age by Marriage Status in Paden City
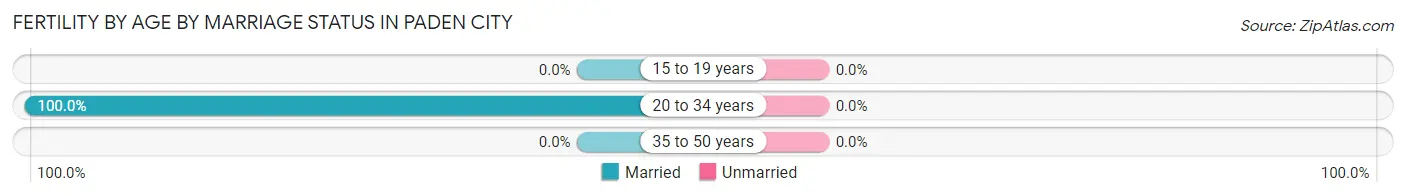
| Age Bracket | Married | Unmarried |
| 15 to 19 years | 0 (0.0%) | 0 (0.0%) |
| 20 to 34 years | 22 (100.0%) | 0 (0.0%) |
| 35 to 50 years | 0 (0.0%) | 0 (0.0%) |
| Total | 22 (100.0%) | 0 (0.0%) |
Fertility by Education in Paden City
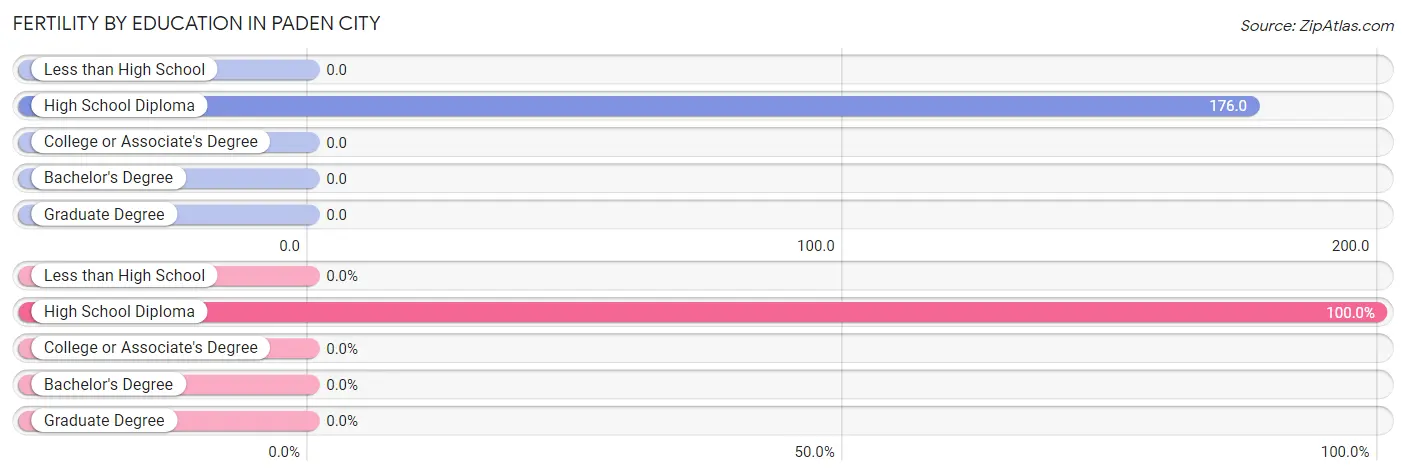
| Educational Attainment | Women with Births | Births / 1,000 Women |
| Less than High School | 0 (0.0%) | 0.0 |
| High School Diploma | 22 (100.0%) | 176.0 |
| College or Associate's Degree | 0 (0.0%) | 0.0 |
| Bachelor's Degree | 0 (0.0%) | 0.0 |
| Graduate Degree | 0 (0.0%) | 0.0 |
| Total | 22 (100.0%) | 43.0 |
Fertility by Education by Marriage Status in Paden City
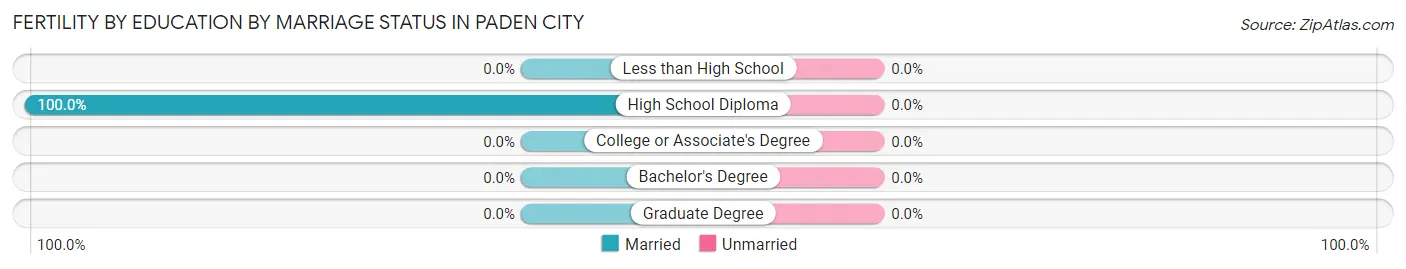
| Educational Attainment | Married | Unmarried |
| Less than High School | 0 (0.0%) | 0 (0.0%) |
| High School Diploma | 22 (100.0%) | 0 (0.0%) |
| College or Associate's Degree | 0 (0.0%) | 0 (0.0%) |
| Bachelor's Degree | 0 (0.0%) | 0 (0.0%) |
| Graduate Degree | 0 (0.0%) | 0 (0.0%) |
| Total | 22 (100.0%) | 0 (0.0%) |
Employment Characteristics in Paden City
Employment by Class of Employer in Paden City
Among the 1,109 employed individuals in Paden City, private company employees (736 | 66.4%), local government employees (162 | 14.6%), and state government employees (96 | 8.7%) make up the most common classes of employment.
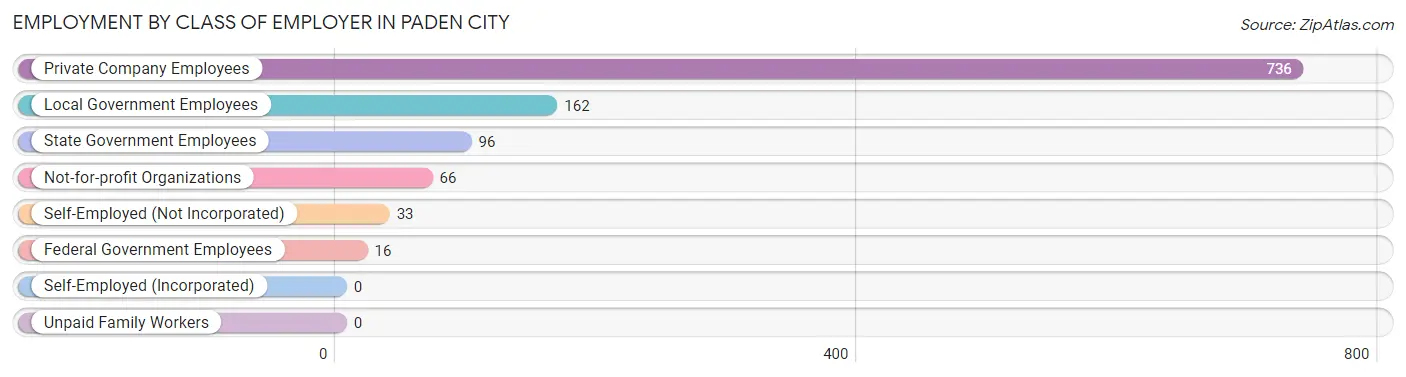
| Employer Class | # Employees | % Employees |
| Private Company Employees | 736 | 66.4% |
| Self-Employed (Incorporated) | 0 | 0.0% |
| Self-Employed (Not Incorporated) | 33 | 3.0% |
| Not-for-profit Organizations | 66 | 5.9% |
| Local Government Employees | 162 | 14.6% |
| State Government Employees | 96 | 8.7% |
| Federal Government Employees | 16 | 1.4% |
| Unpaid Family Workers | 0 | 0.0% |
| Total | 1,109 | 100.0% |
Employment Status by Age in Paden City
According to the labor force statistics for Paden City, out of the total population over 16 years of age (2,297), 51.2% or 1,176 individuals are in the labor force, with 5.1% or 60 of them unemployed. The age group with the highest labor force participation rate is 35 to 44 years, with 89.1% or 285 individuals in the labor force. Within the labor force, the 16 to 19 years age range has the highest percentage of unemployed individuals, with 41.5% or 17 of them being unemployed.
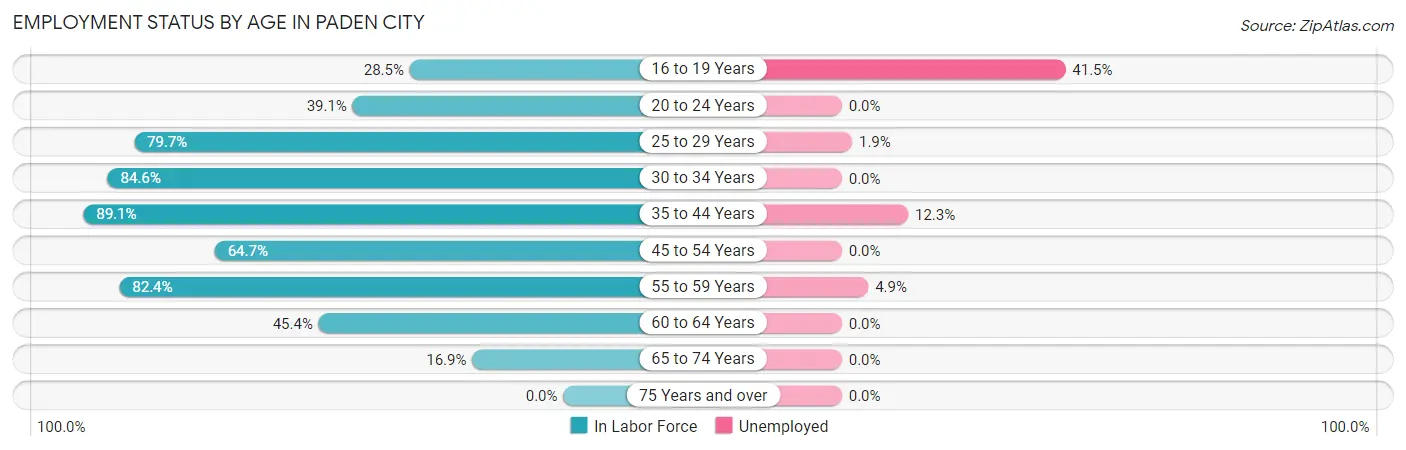
| Age Bracket | In Labor Force | Unemployed |
| 16 to 19 Years | 41 (28.5%) | 17 (41.5%) |
| 20 to 24 Years | 68 (39.1%) | 0 (0.0%) |
| 25 to 29 Years | 157 (79.7%) | 3 (1.9%) |
| 30 to 34 Years | 193 (84.6%) | 0 (0.0%) |
| 35 to 44 Years | 285 (89.1%) | 35 (12.3%) |
| 45 to 54 Years | 174 (64.7%) | 0 (0.0%) |
| 55 to 59 Years | 103 (82.4%) | 5 (4.9%) |
| 60 to 64 Years | 104 (45.4%) | 0 (0.0%) |
| 65 to 74 Years | 50 (16.9%) | 0 (0.0%) |
| 75 Years and over | 0 (0.0%) | 0 (0.0%) |
| Total | 1,176 (51.2%) | 60 (5.1%) |
Employment Status by Educational Attainment in Paden City
According to labor force statistics for Paden City, 74.3% of individuals (1,016) out of the total population between 25 and 64 years of age (1,368) are in the labor force, with 4.2% or 43 of them being unemployed. The group with the highest labor force participation rate are those with the educational attainment of bachelor's degree or higher, with 89.9% or 213 individuals in the labor force. Within the labor force, individuals with less than high school education have the highest percentage of unemployment, with 36.6% or 15 of them being unemployed.
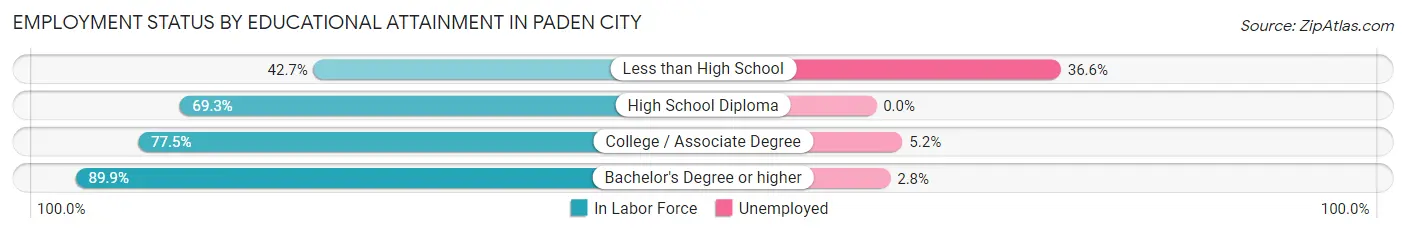
| Educational Attainment | In Labor Force | Unemployed |
| Less than High School | 41 (42.7%) | 35 (36.6%) |
| High School Diploma | 336 (69.3%) | 0 (0.0%) |
| College / Associate Degree | 426 (77.5%) | 29 (5.2%) |
| Bachelor's Degree or higher | 213 (89.9%) | 7 (2.8%) |
| Total | 1,016 (74.3%) | 57 (4.2%) |
Employment Occupations by Sex in Paden City
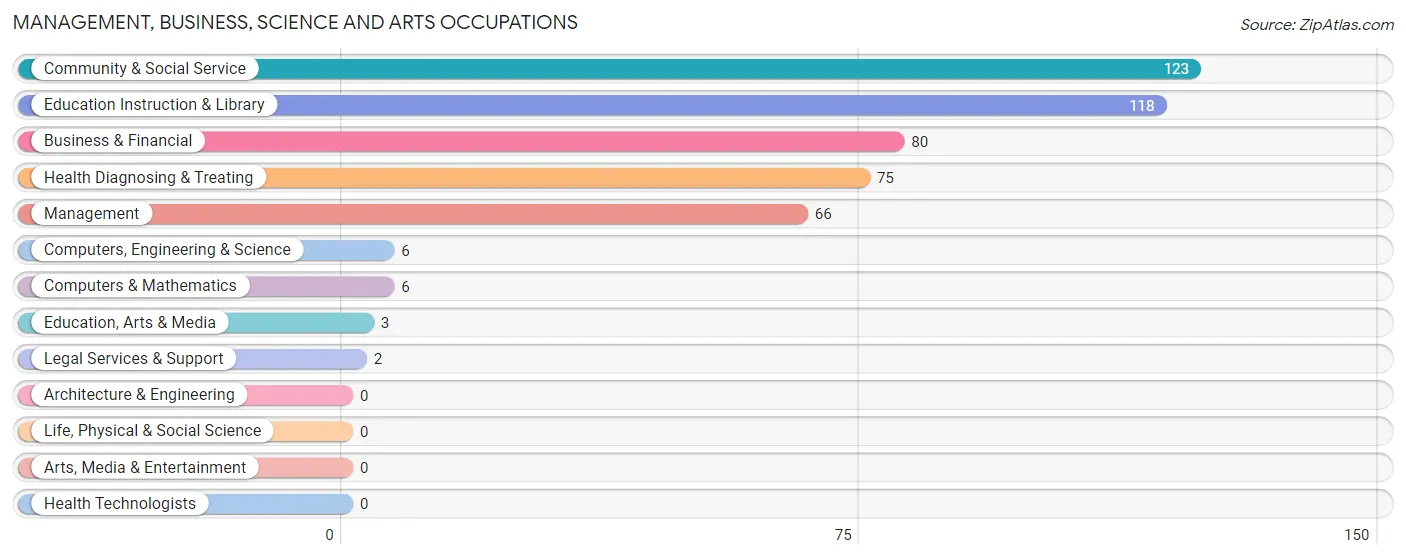
Management, Business, Science and Arts Occupations
The most common Management, Business, Science and Arts occupations in Paden City are Community & Social Service (123 | 11.0%), Education Instruction & Library (118 | 10.6%), Business & Financial (80 | 7.2%), Health Diagnosing & Treating (75 | 6.7%), and Management (66 | 5.9%).
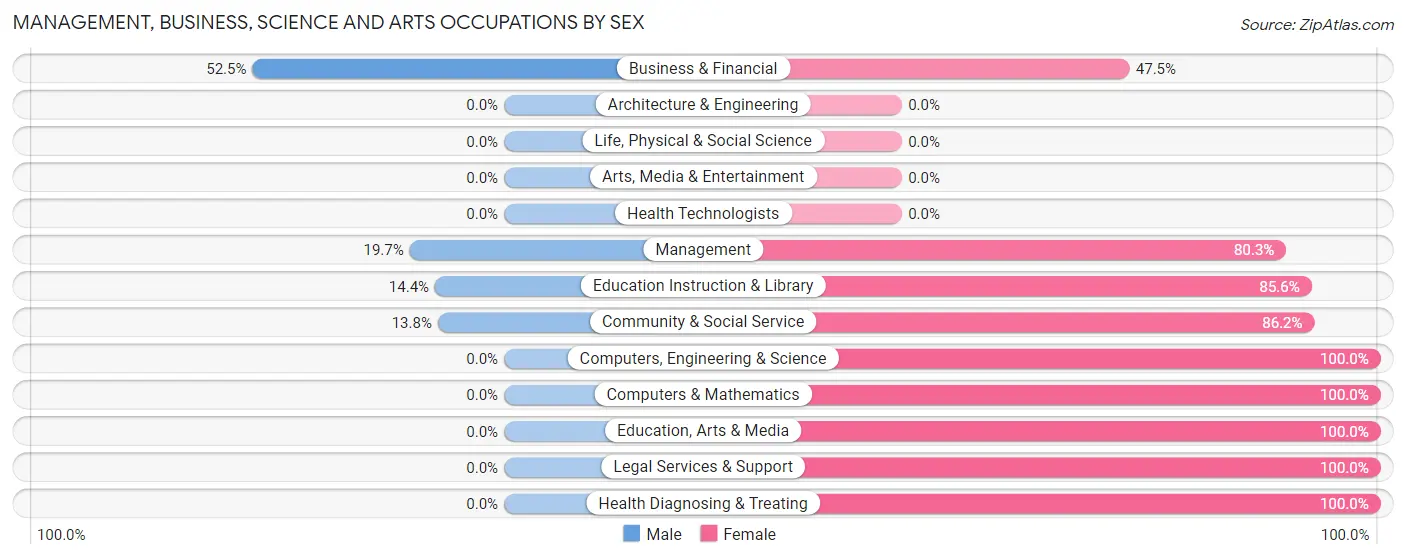
Management, Business, Science and Arts Occupations by Sex
Within the Management, Business, Science and Arts occupations in Paden City, the most male-oriented occupations are Business & Financial (52.5%), Management (19.7%), and Education Instruction & Library (14.4%), while the most female-oriented occupations are Computers, Engineering & Science (100.0%), Computers & Mathematics (100.0%), and Education, Arts & Media (100.0%).
| Occupation | Male | Female |
| Management | 13 (19.7%) | 53 (80.3%) |
| Business & Financial | 42 (52.5%) | 38 (47.5%) |
| Computers, Engineering & Science | 0 (0.0%) | 6 (100.0%) |
| Computers & Mathematics | 0 (0.0%) | 6 (100.0%) |
| Architecture & Engineering | 0 (0.0%) | 0 (0.0%) |
| Life, Physical & Social Science | 0 (0.0%) | 0 (0.0%) |
| Community & Social Service | 17 (13.8%) | 106 (86.2%) |
| Education, Arts & Media | 0 (0.0%) | 3 (100.0%) |
| Legal Services & Support | 0 (0.0%) | 2 (100.0%) |
| Education Instruction & Library | 17 (14.4%) | 101 (85.6%) |
| Arts, Media & Entertainment | 0 (0.0%) | 0 (0.0%) |
| Health Diagnosing & Treating | 0 (0.0%) | 75 (100.0%) |
| Health Technologists | 0 (0.0%) | 0 (0.0%) |
| Total (Category) | 72 (20.6%) | 278 (79.4%) |
| Total (Overall) | 649 (58.2%) | 466 (41.8%) |
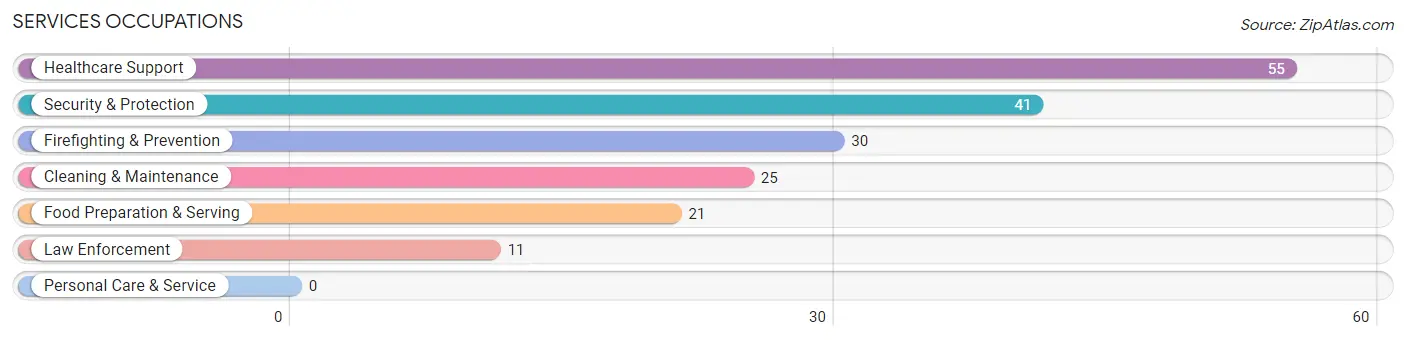
Services Occupations
The most common Services occupations in Paden City are Healthcare Support (55 | 4.9%), Security & Protection (41 | 3.7%), Firefighting & Prevention (30 | 2.7%), Cleaning & Maintenance (25 | 2.2%), and Food Preparation & Serving (21 | 1.9%).
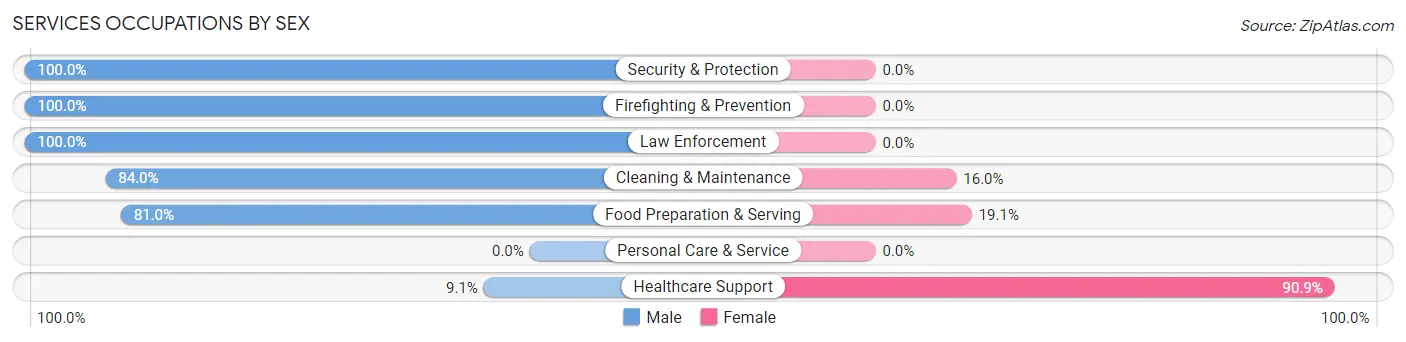
Services Occupations by Sex
Within the Services occupations in Paden City, the most male-oriented occupations are Security & Protection (100.0%), Firefighting & Prevention (100.0%), and Law Enforcement (100.0%), while the most female-oriented occupations are Healthcare Support (90.9%), Food Preparation & Serving (19.1%), and Cleaning & Maintenance (16.0%).
| Occupation | Male | Female |
| Healthcare Support | 5 (9.1%) | 50 (90.9%) |
| Security & Protection | 41 (100.0%) | 0 (0.0%) |
| Firefighting & Prevention | 30 (100.0%) | 0 (0.0%) |
| Law Enforcement | 11 (100.0%) | 0 (0.0%) |
| Food Preparation & Serving | 17 (80.9%) | 4 (19.1%) |
| Cleaning & Maintenance | 21 (84.0%) | 4 (16.0%) |
| Personal Care & Service | 0 (0.0%) | 0 (0.0%) |
| Total (Category) | 84 (59.2%) | 58 (40.8%) |
| Total (Overall) | 649 (58.2%) | 466 (41.8%) |
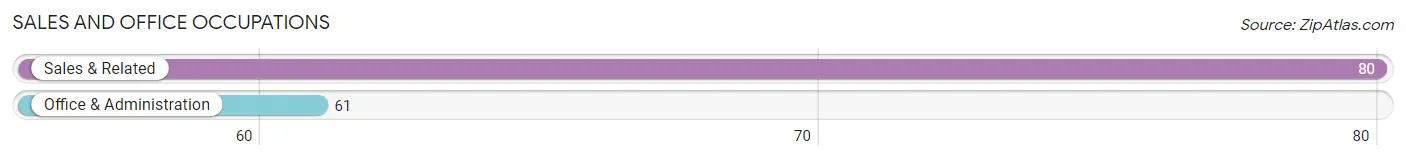
Sales and Office Occupations
The most common Sales and Office occupations in Paden City are Sales & Related (80 | 7.2%), and Office & Administration (61 | 5.5%).
Sales and Office Occupations by Sex

| Occupation | Male | Female |
| Sales & Related | 47 (58.8%) | 33 (41.2%) |
| Office & Administration | 26 (42.6%) | 35 (57.4%) |
| Total (Category) | 73 (51.8%) | 68 (48.2%) |
| Total (Overall) | 649 (58.2%) | 466 (41.8%) |
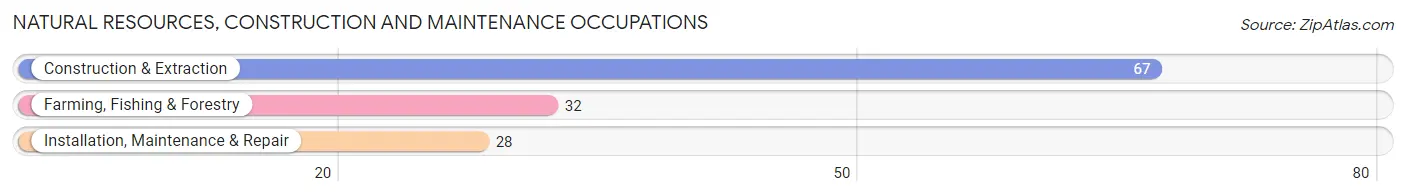
Natural Resources, Construction and Maintenance Occupations
The most common Natural Resources, Construction and Maintenance occupations in Paden City are Construction & Extraction (67 | 6.0%), Farming, Fishing & Forestry (32 | 2.9%), and Installation, Maintenance & Repair (28 | 2.5%).
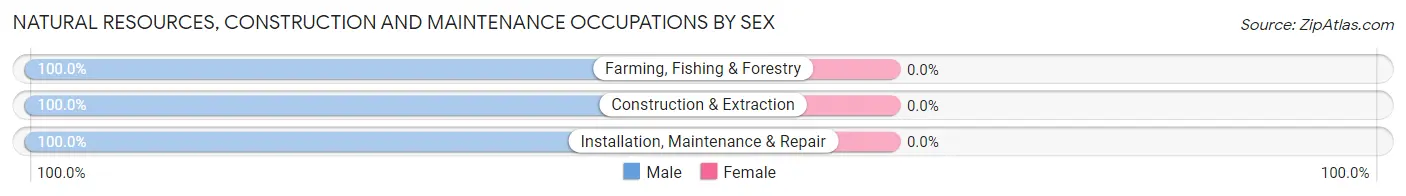
Natural Resources, Construction and Maintenance Occupations by Sex
| Occupation | Male | Female |
| Farming, Fishing & Forestry | 32 (100.0%) | 0 (0.0%) |
| Construction & Extraction | 67 (100.0%) | 0 (0.0%) |
| Installation, Maintenance & Repair | 28 (100.0%) | 0 (0.0%) |
| Total (Category) | 127 (100.0%) | 0 (0.0%) |
| Total (Overall) | 649 (58.2%) | 466 (41.8%) |
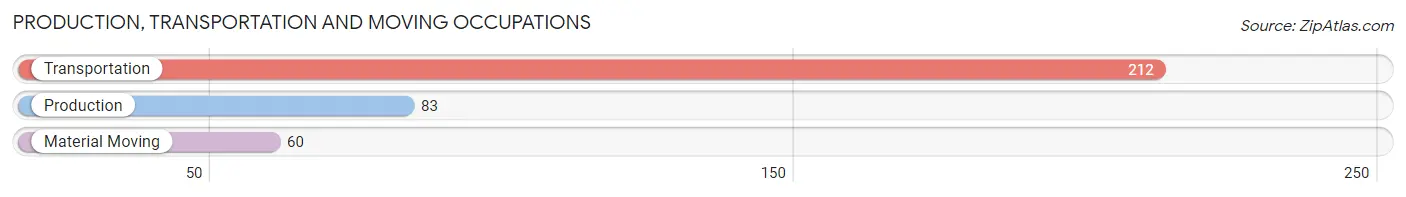
Production, Transportation and Moving Occupations
The most common Production, Transportation and Moving occupations in Paden City are Transportation (212 | 19.0%), Production (83 | 7.4%), and Material Moving (60 | 5.4%).
Production, Transportation and Moving Occupations by Sex
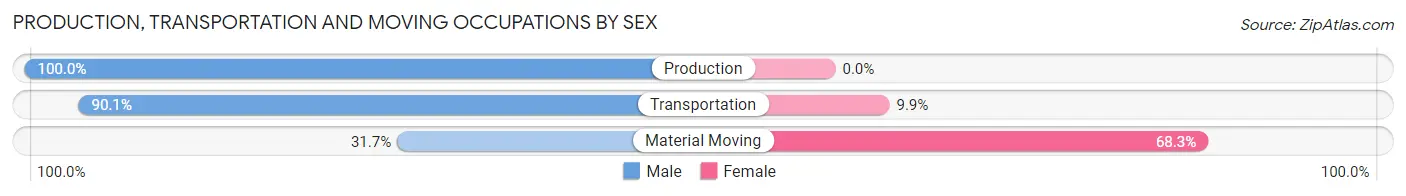
| Occupation | Male | Female |
| Production | 83 (100.0%) | 0 (0.0%) |
| Transportation | 191 (90.1%) | 21 (9.9%) |
| Material Moving | 19 (31.7%) | 41 (68.3%) |
| Total (Category) | 293 (82.5%) | 62 (17.5%) |
| Total (Overall) | 649 (58.2%) | 466 (41.8%) |
Employment Industries by Sex in Paden City
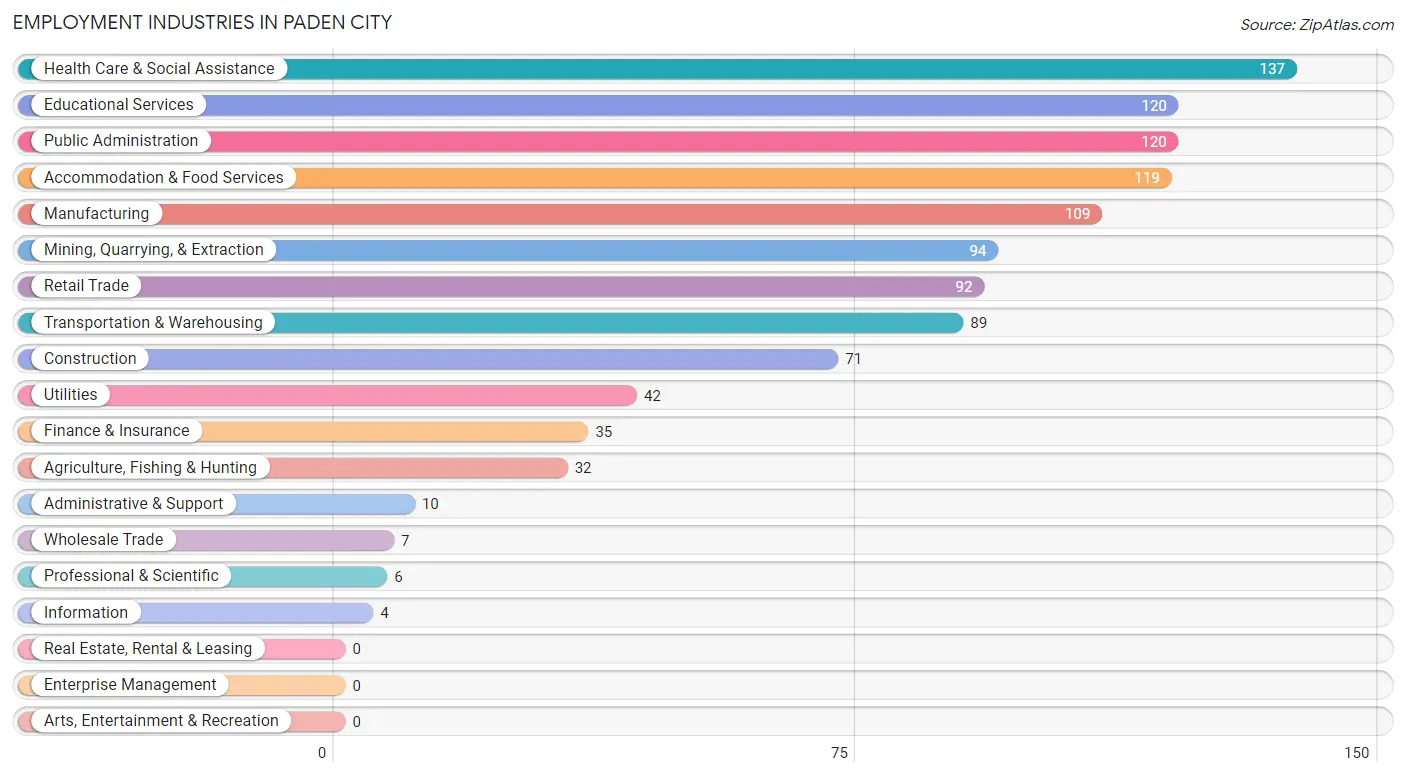
Employment Industries in Paden City
The major employment industries in Paden City include Health Care & Social Assistance (137 | 12.3%), Educational Services (120 | 10.8%), Public Administration (120 | 10.8%), Accommodation & Food Services (119 | 10.7%), and Manufacturing (109 | 9.8%).
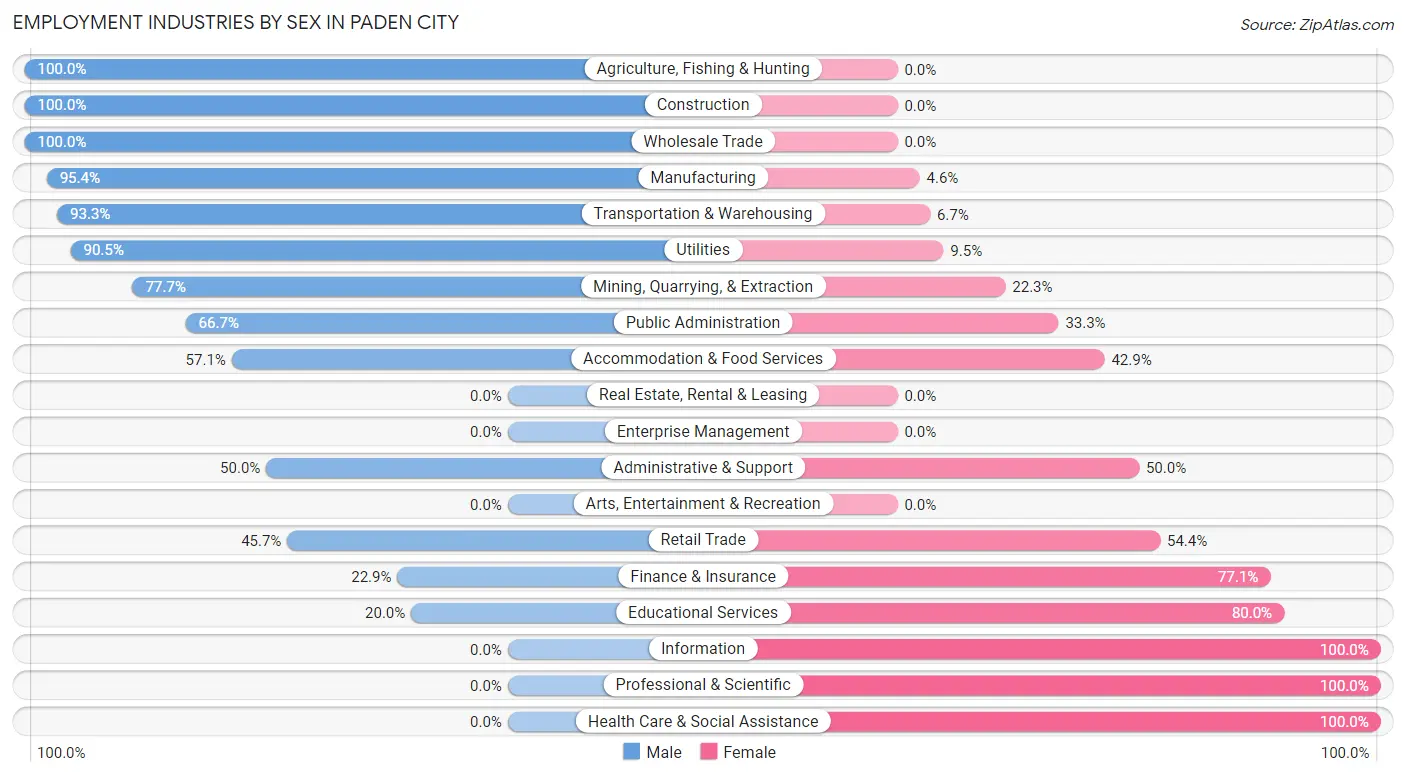
Employment Industries by Sex in Paden City
The Paden City industries that see more men than women are Agriculture, Fishing & Hunting (100.0%), Construction (100.0%), and Wholesale Trade (100.0%), whereas the industries that tend to have a higher number of women are Information (100.0%), Professional & Scientific (100.0%), and Health Care & Social Assistance (100.0%).
| Industry | Male | Female |
| Agriculture, Fishing & Hunting | 32 (100.0%) | 0 (0.0%) |
| Mining, Quarrying, & Extraction | 73 (77.7%) | 21 (22.3%) |
| Construction | 71 (100.0%) | 0 (0.0%) |
| Manufacturing | 104 (95.4%) | 5 (4.6%) |
| Wholesale Trade | 7 (100.0%) | 0 (0.0%) |
| Retail Trade | 42 (45.7%) | 50 (54.3%) |
| Transportation & Warehousing | 83 (93.3%) | 6 (6.7%) |
| Utilities | 38 (90.5%) | 4 (9.5%) |
| Information | 0 (0.0%) | 4 (100.0%) |
| Finance & Insurance | 8 (22.9%) | 27 (77.1%) |
| Real Estate, Rental & Leasing | 0 (0.0%) | 0 (0.0%) |
| Professional & Scientific | 0 (0.0%) | 6 (100.0%) |
| Enterprise Management | 0 (0.0%) | 0 (0.0%) |
| Administrative & Support | 5 (50.0%) | 5 (50.0%) |
| Educational Services | 24 (20.0%) | 96 (80.0%) |
| Health Care & Social Assistance | 0 (0.0%) | 137 (100.0%) |
| Arts, Entertainment & Recreation | 0 (0.0%) | 0 (0.0%) |
| Accommodation & Food Services | 68 (57.1%) | 51 (42.9%) |
| Public Administration | 80 (66.7%) | 40 (33.3%) |
| Total | 649 (58.2%) | 466 (41.8%) |
Education in Paden City
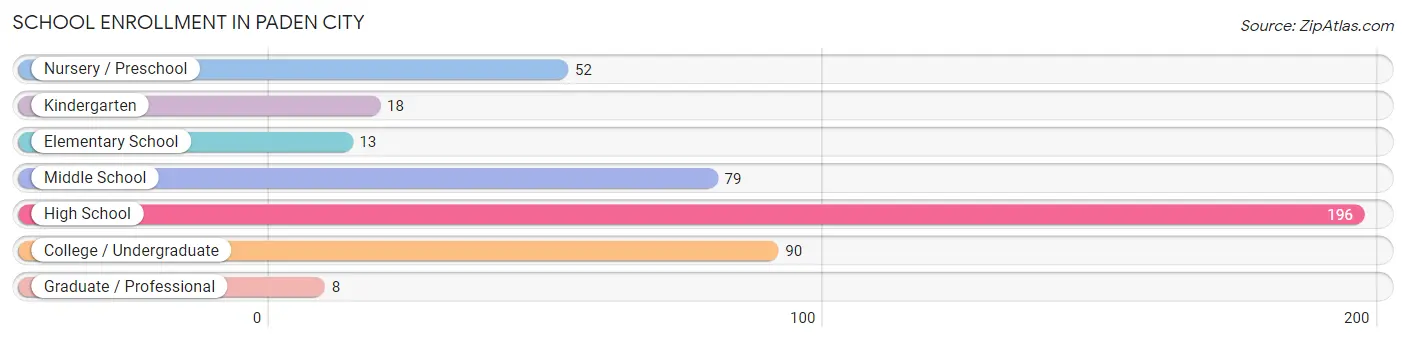
School Enrollment in Paden City
The most common levels of schooling among the 456 students in Paden City are high school (196 | 43.0%), college / undergraduate (90 | 19.7%), and middle school (79 | 17.3%).
| School Level | # Students | % Students |
| Nursery / Preschool | 52 | 11.4% |
| Kindergarten | 18 | 4.0% |
| Elementary School | 13 | 2.9% |
| Middle School | 79 | 17.3% |
| High School | 196 | 43.0% |
| College / Undergraduate | 90 | 19.7% |
| Graduate / Professional | 8 | 1.8% |
| Total | 456 | 100.0% |
School Enrollment by Age by Funding Source in Paden City
Out of a total of 456 students who are enrolled in schools in Paden City, 31 (6.8%) attend a private institution, while the remaining 425 (93.2%) are enrolled in public schools. The age group of 35 years and over has the highest likelihood of being enrolled in private schools, with 8 (100.0% in the age bracket) enrolled. Conversely, the age group of 5 to 9 year old has the lowest likelihood of being enrolled in a private school, with 31 (100.0% in the age bracket) attending a public institution.
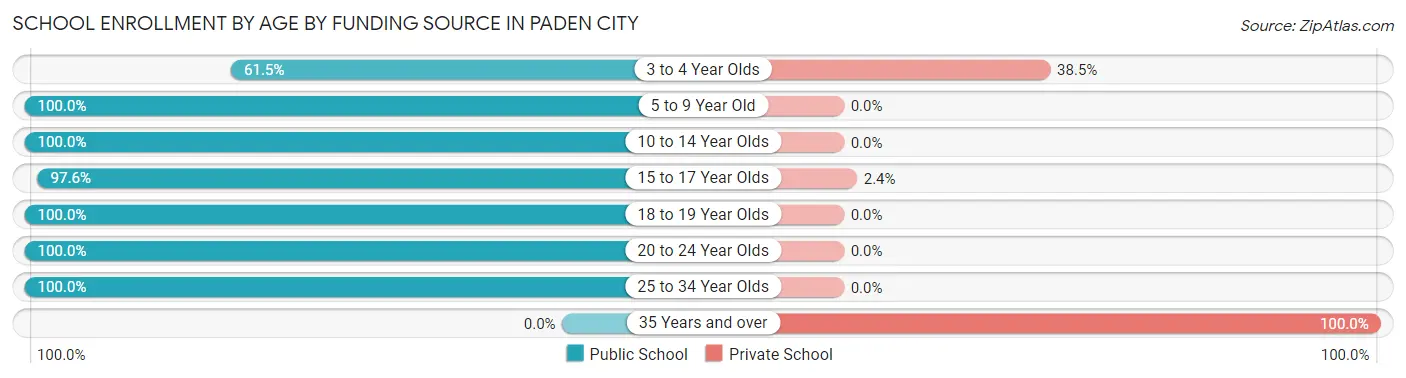
| Age Bracket | Public School | Private School |
| 3 to 4 Year Olds | 32 (61.5%) | 20 (38.5%) |
| 5 to 9 Year Old | 31 (100.0%) | 0 (0.0%) |
| 10 to 14 Year Olds | 152 (100.0%) | 0 (0.0%) |
| 15 to 17 Year Olds | 120 (97.6%) | 3 (2.4%) |
| 18 to 19 Year Olds | 32 (100.0%) | 0 (0.0%) |
| 20 to 24 Year Olds | 8 (100.0%) | 0 (0.0%) |
| 25 to 34 Year Olds | 50 (100.0%) | 0 (0.0%) |
| 35 Years and over | 0 (0.0%) | 8 (100.0%) |
| Total | 425 (93.2%) | 31 (6.8%) |
Educational Attainment by Field of Study in Paden City
Education (118 | 37.3%), business (78 | 24.7%), engineering (50 | 15.8%), visual & performing arts (19 | 6.0%), and physical & health sciences (13 | 4.1%) are the most common fields of study among 316 individuals in Paden City who have obtained a bachelor's degree or higher.
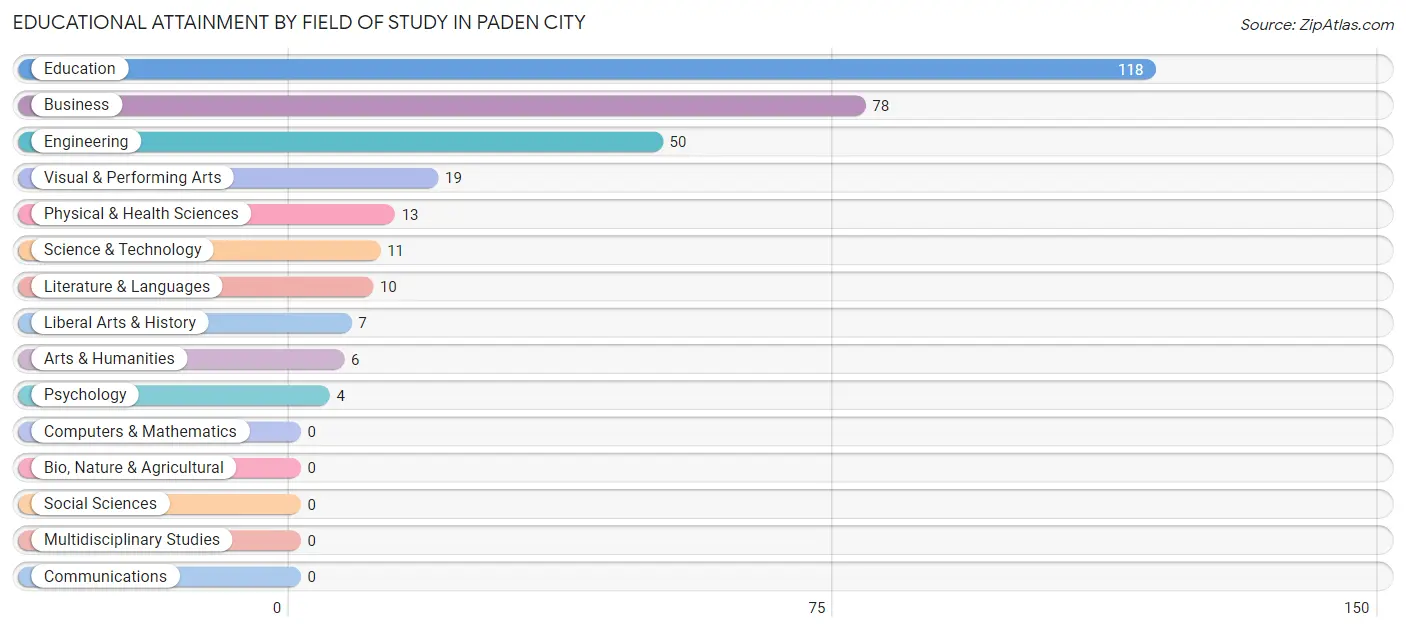
| Field of Study | # Graduates | % Graduates |
| Computers & Mathematics | 0 | 0.0% |
| Bio, Nature & Agricultural | 0 | 0.0% |
| Physical & Health Sciences | 13 | 4.1% |
| Psychology | 4 | 1.3% |
| Social Sciences | 0 | 0.0% |
| Engineering | 50 | 15.8% |
| Multidisciplinary Studies | 0 | 0.0% |
| Science & Technology | 11 | 3.5% |
| Business | 78 | 24.7% |
| Education | 118 | 37.3% |
| Literature & Languages | 10 | 3.2% |
| Liberal Arts & History | 7 | 2.2% |
| Visual & Performing Arts | 19 | 6.0% |
| Communications | 0 | 0.0% |
| Arts & Humanities | 6 | 1.9% |
| Total | 316 | 100.0% |
Transportation & Commute in Paden City
Vehicle Availability by Sex in Paden City
The most prevalent vehicle ownership categories in Paden City are males with 3 vehicles (209, accounting for 32.5%) and females with 3 vehicles (122, making up 44.9%).
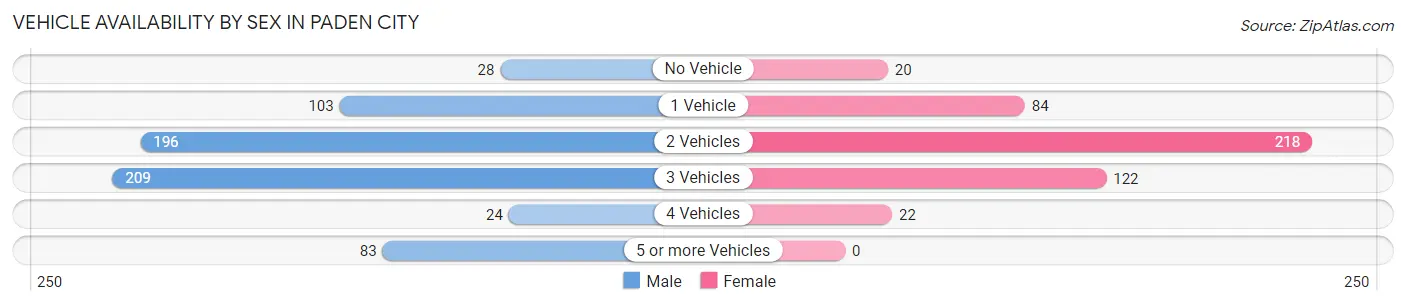
| Vehicles Available | Male | Female |
| No Vehicle | 28 (4.3%) | 20 (4.3%) |
| 1 Vehicle | 103 (16.0%) | 84 (18.0%) |
| 2 Vehicles | 196 (30.5%) | 218 (46.8%) |
| 3 Vehicles | 209 (32.5%) | 122 (26.2%) |
| 4 Vehicles | 24 (3.7%) | 22 (4.7%) |
| 5 or more Vehicles | 83 (12.9%) | 0 (0.0%) |
| Total | 643 (100.0%) | 466 (100.0%) |
Commute Time in Paden City
The most frequently occuring commute durations in Paden City are 15 to 19 minutes (165 commuters, 15.2%), 20 to 24 minutes (159 commuters, 14.7%), and 45 to 59 minutes (130 commuters, 12.0%).
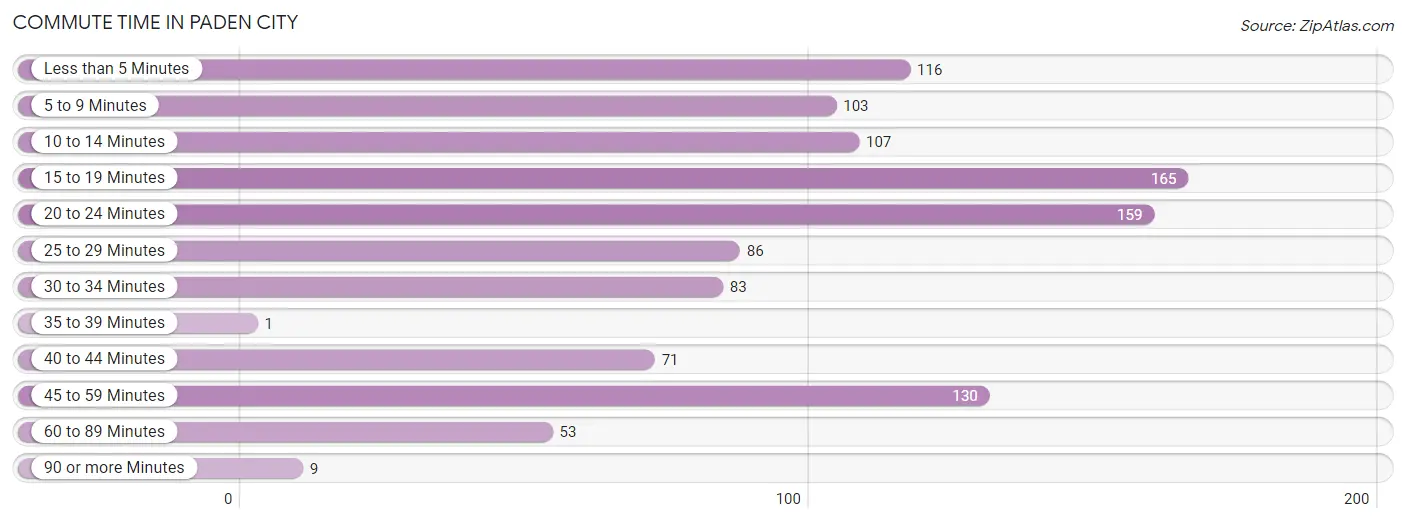
| Commute Time | # Commuters | % Commuters |
| Less than 5 Minutes | 116 | 10.7% |
| 5 to 9 Minutes | 103 | 9.5% |
| 10 to 14 Minutes | 107 | 9.9% |
| 15 to 19 Minutes | 165 | 15.2% |
| 20 to 24 Minutes | 159 | 14.7% |
| 25 to 29 Minutes | 86 | 7.9% |
| 30 to 34 Minutes | 83 | 7.7% |
| 35 to 39 Minutes | 1 | 0.1% |
| 40 to 44 Minutes | 71 | 6.6% |
| 45 to 59 Minutes | 130 | 12.0% |
| 60 to 89 Minutes | 53 | 4.9% |
| 90 or more Minutes | 9 | 0.8% |
Commute Time by Sex in Paden City
The most common commute times in Paden City are 45 to 59 minutes (118 commuters, 18.4%) for males and 15 to 19 minutes (128 commuters, 28.9%) for females.
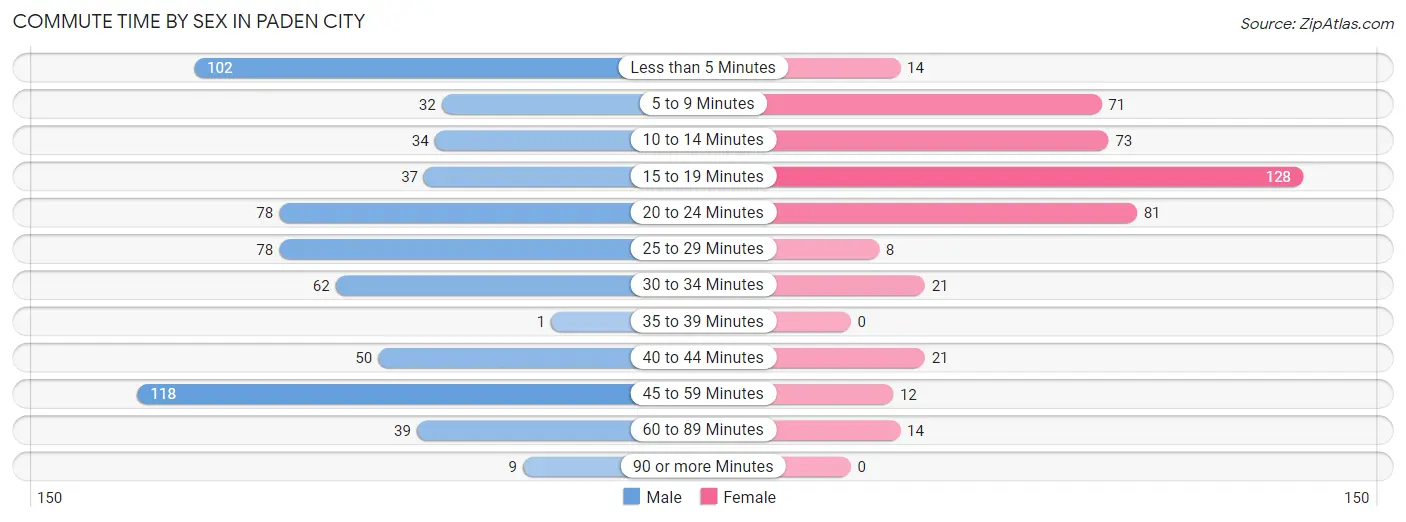
| Commute Time | Male | Female |
| Less than 5 Minutes | 102 (15.9%) | 14 (3.2%) |
| 5 to 9 Minutes | 32 (5.0%) | 71 (16.0%) |
| 10 to 14 Minutes | 34 (5.3%) | 73 (16.5%) |
| 15 to 19 Minutes | 37 (5.8%) | 128 (28.9%) |
| 20 to 24 Minutes | 78 (12.2%) | 81 (18.3%) |
| 25 to 29 Minutes | 78 (12.2%) | 8 (1.8%) |
| 30 to 34 Minutes | 62 (9.7%) | 21 (4.7%) |
| 35 to 39 Minutes | 1 (0.2%) | 0 (0.0%) |
| 40 to 44 Minutes | 50 (7.8%) | 21 (4.7%) |
| 45 to 59 Minutes | 118 (18.4%) | 12 (2.7%) |
| 60 to 89 Minutes | 39 (6.1%) | 14 (3.2%) |
| 90 or more Minutes | 9 (1.4%) | 0 (0.0%) |
Time of Departure to Work by Sex in Paden City
The most frequent times of departure to work in Paden City are 5:30 AM to 5:59 AM (106, 16.6%) for males and 7:30 AM to 7:59 AM (185, 41.8%) for females.
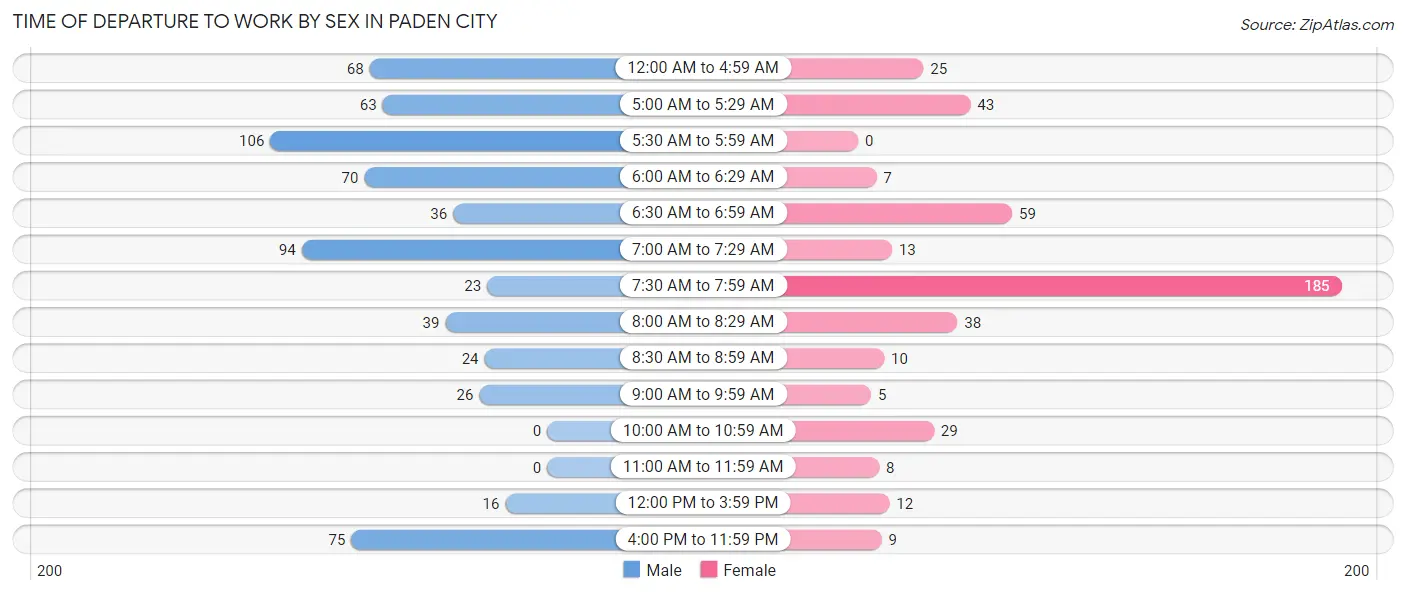
| Time of Departure | Male | Female |
| 12:00 AM to 4:59 AM | 68 (10.6%) | 25 (5.6%) |
| 5:00 AM to 5:29 AM | 63 (9.8%) | 43 (9.7%) |
| 5:30 AM to 5:59 AM | 106 (16.6%) | 0 (0.0%) |
| 6:00 AM to 6:29 AM | 70 (10.9%) | 7 (1.6%) |
| 6:30 AM to 6:59 AM | 36 (5.6%) | 59 (13.3%) |
| 7:00 AM to 7:29 AM | 94 (14.7%) | 13 (2.9%) |
| 7:30 AM to 7:59 AM | 23 (3.6%) | 185 (41.8%) |
| 8:00 AM to 8:29 AM | 39 (6.1%) | 38 (8.6%) |
| 8:30 AM to 8:59 AM | 24 (3.7%) | 10 (2.3%) |
| 9:00 AM to 9:59 AM | 26 (4.1%) | 5 (1.1%) |
| 10:00 AM to 10:59 AM | 0 (0.0%) | 29 (6.6%) |
| 11:00 AM to 11:59 AM | 0 (0.0%) | 8 (1.8%) |
| 12:00 PM to 3:59 PM | 16 (2.5%) | 12 (2.7%) |
| 4:00 PM to 11:59 PM | 75 (11.7%) | 9 (2.0%) |
| Total | 640 (100.0%) | 443 (100.0%) |
Housing Occupancy in Paden City
Occupancy by Ownership in Paden City
Of the total 1,050 dwellings in Paden City, owner-occupied units account for 816 (77.7%), while renter-occupied units make up 234 (22.3%).
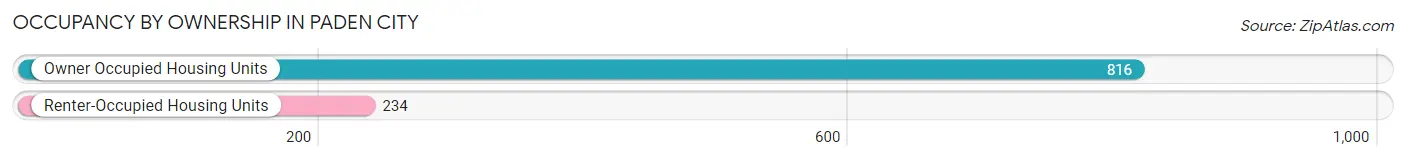
| Occupancy | # Housing Units | % Housing Units |
| Owner Occupied Housing Units | 816 | 77.7% |
| Renter-Occupied Housing Units | 234 | 22.3% |
| Total Occupied Housing Units | 1,050 | 100.0% |
Occupancy by Household Size in Paden City
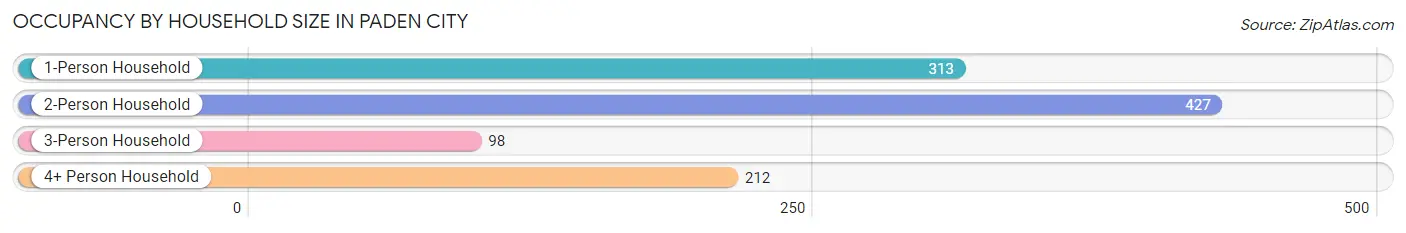
| Household Size | # Housing Units | % Housing Units |
| 1-Person Household | 313 | 29.8% |
| 2-Person Household | 427 | 40.7% |
| 3-Person Household | 98 | 9.3% |
| 4+ Person Household | 212 | 20.2% |
| Total Housing Units | 1,050 | 100.0% |
Occupancy by Ownership by Household Size in Paden City
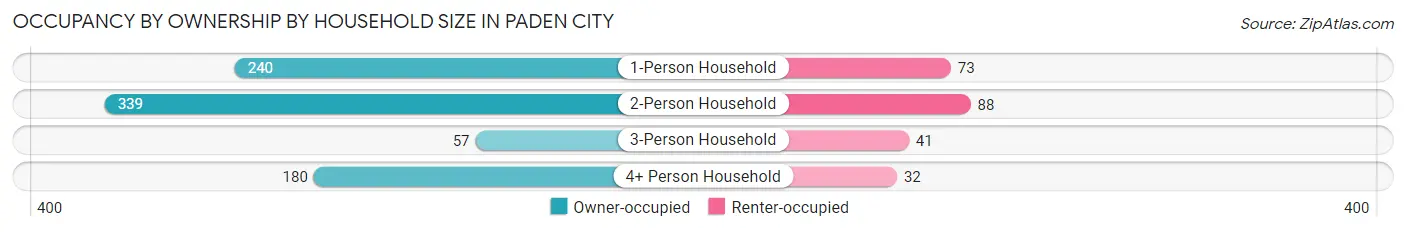
| Household Size | Owner-occupied | Renter-occupied |
| 1-Person Household | 240 (76.7%) | 73 (23.3%) |
| 2-Person Household | 339 (79.4%) | 88 (20.6%) |
| 3-Person Household | 57 (58.2%) | 41 (41.8%) |
| 4+ Person Household | 180 (84.9%) | 32 (15.1%) |
| Total Housing Units | 816 (77.7%) | 234 (22.3%) |
Occupancy by Educational Attainment in Paden City
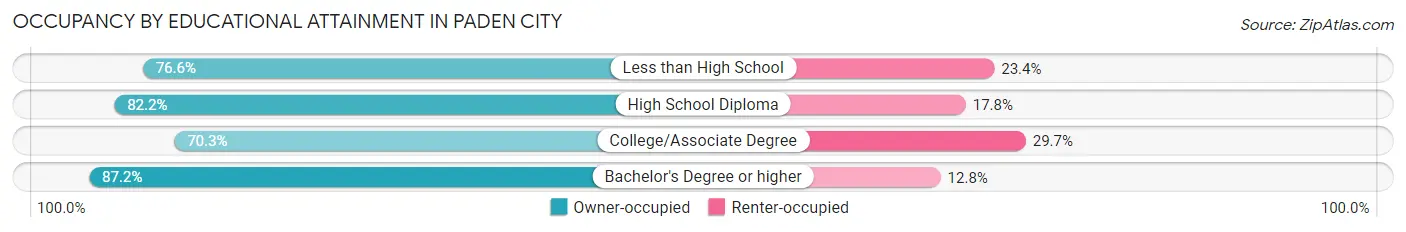
| Household Size | Owner-occupied | Renter-occupied |
| Less than High School | 85 (76.6%) | 26 (23.4%) |
| High School Diploma | 287 (82.2%) | 62 (17.8%) |
| College/Associate Degree | 294 (70.3%) | 124 (29.7%) |
| Bachelor's Degree or higher | 150 (87.2%) | 22 (12.8%) |
Occupancy by Age of Householder in Paden City
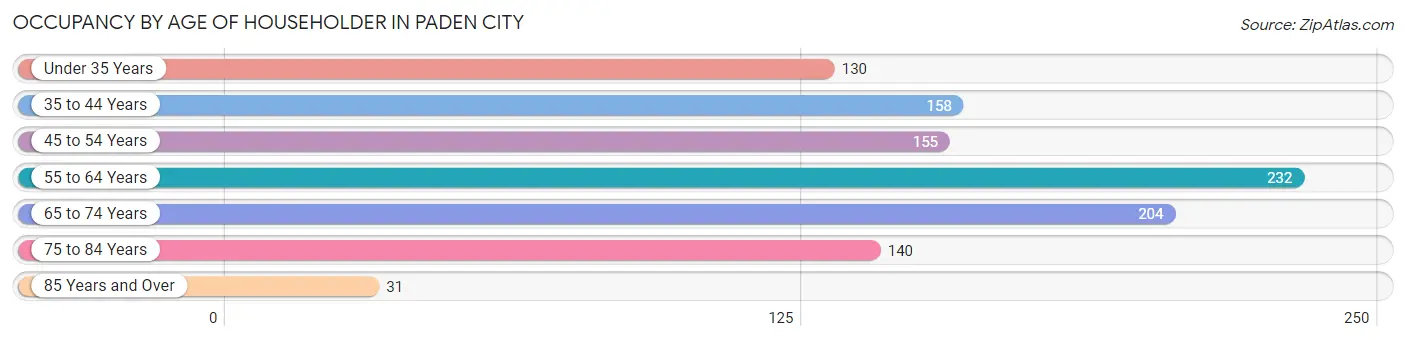
| Age Bracket | # Households | % Households |
| Under 35 Years | 130 | 12.4% |
| 35 to 44 Years | 158 | 15.0% |
| 45 to 54 Years | 155 | 14.8% |
| 55 to 64 Years | 232 | 22.1% |
| 65 to 74 Years | 204 | 19.4% |
| 75 to 84 Years | 140 | 13.3% |
| 85 Years and Over | 31 | 2.9% |
| Total | 1,050 | 100.0% |
Housing Finances in Paden City
Median Income by Occupancy in Paden City
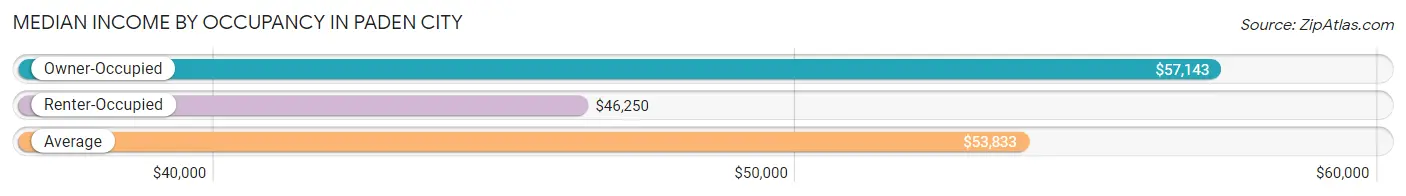
| Occupancy Type | # Households | Median Income |
| Owner-Occupied | 816 (77.7%) | $57,143 |
| Renter-Occupied | 234 (22.3%) | $46,250 |
| Average | 1,050 (100.0%) | $53,833 |
Occupancy by Householder Income Bracket in Paden City
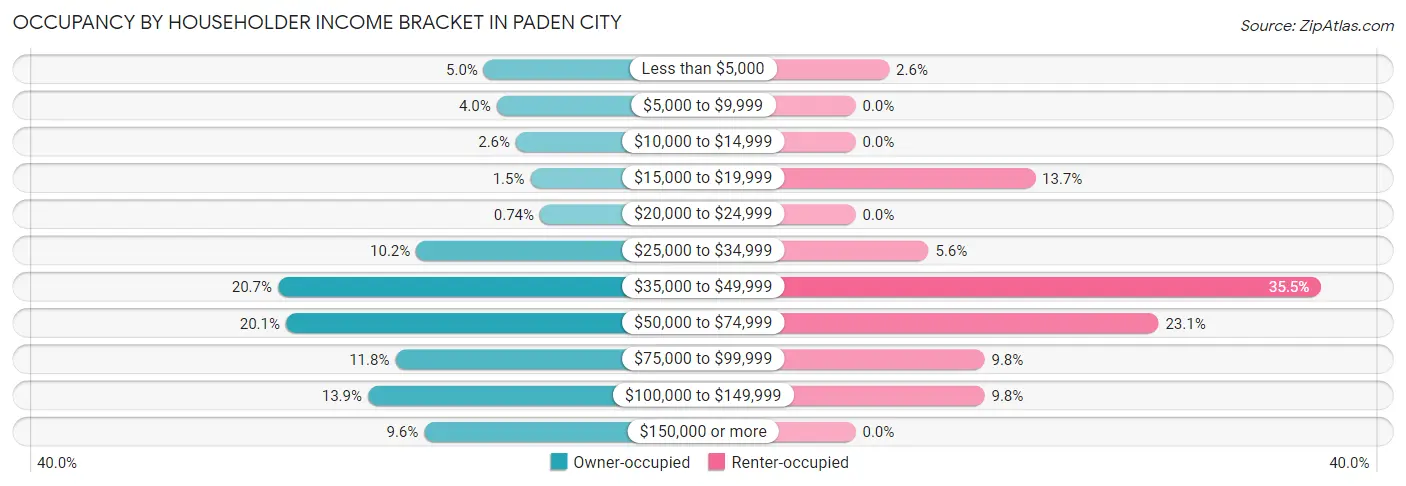
| Income Bracket | Owner-occupied | Renter-occupied |
| Less than $5,000 | 41 (5.0%) | 6 (2.6%) |
| $5,000 to $9,999 | 33 (4.0%) | 0 (0.0%) |
| $10,000 to $14,999 | 21 (2.6%) | 0 (0.0%) |
| $15,000 to $19,999 | 12 (1.5%) | 32 (13.7%) |
| $20,000 to $24,999 | 6 (0.7%) | 0 (0.0%) |
| $25,000 to $34,999 | 83 (10.2%) | 13 (5.6%) |
| $35,000 to $49,999 | 169 (20.7%) | 83 (35.5%) |
| $50,000 to $74,999 | 164 (20.1%) | 54 (23.1%) |
| $75,000 to $99,999 | 96 (11.8%) | 23 (9.8%) |
| $100,000 to $149,999 | 113 (13.9%) | 23 (9.8%) |
| $150,000 or more | 78 (9.6%) | 0 (0.0%) |
| Total | 816 (100.0%) | 234 (100.0%) |
Monthly Housing Cost Tiers in Paden City
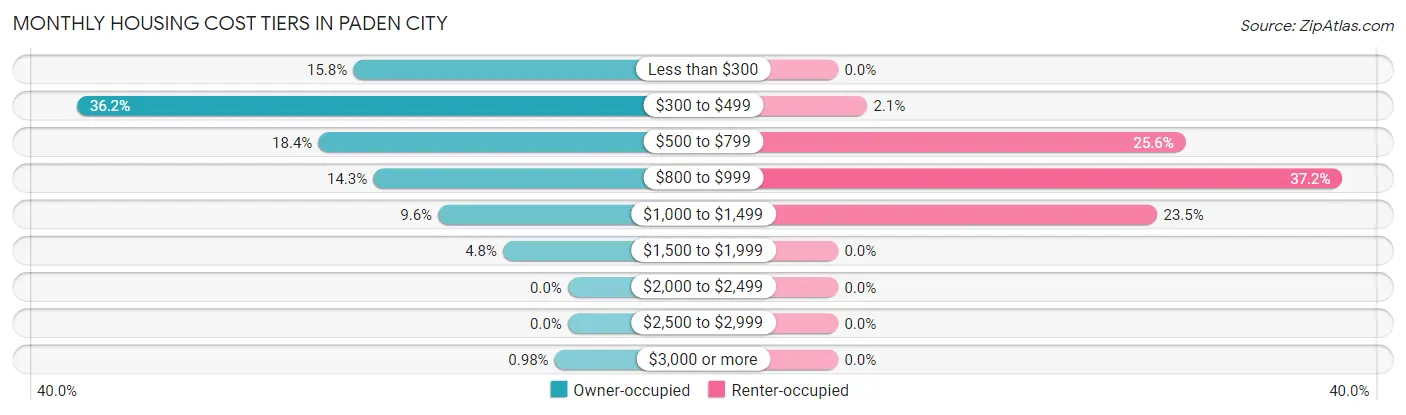
| Monthly Cost | Owner-occupied | Renter-occupied |
| Less than $300 | 129 (15.8%) | 0 (0.0%) |
| $300 to $499 | 295 (36.1%) | 5 (2.1%) |
| $500 to $799 | 150 (18.4%) | 60 (25.6%) |
| $800 to $999 | 117 (14.3%) | 87 (37.2%) |
| $1,000 to $1,499 | 78 (9.6%) | 55 (23.5%) |
| $1,500 to $1,999 | 39 (4.8%) | 0 (0.0%) |
| $2,000 to $2,499 | 0 (0.0%) | 0 (0.0%) |
| $2,500 to $2,999 | 0 (0.0%) | 0 (0.0%) |
| $3,000 or more | 8 (1.0%) | 0 (0.0%) |
| Total | 816 (100.0%) | 234 (100.0%) |
Physical Housing Characteristics in Paden City
Housing Structures in Paden City
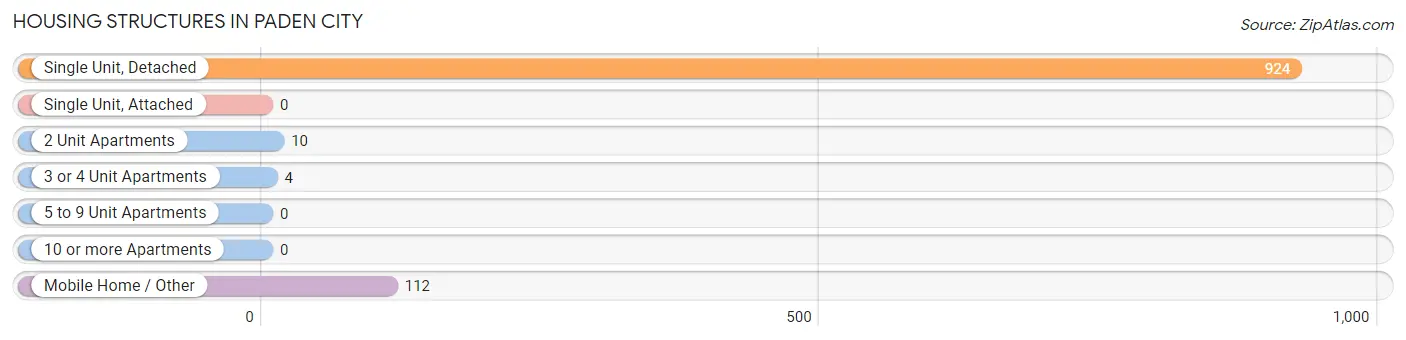
| Structure Type | # Housing Units | % Housing Units |
| Single Unit, Detached | 924 | 88.0% |
| Single Unit, Attached | 0 | 0.0% |
| 2 Unit Apartments | 10 | 0.9% |
| 3 or 4 Unit Apartments | 4 | 0.4% |
| 5 to 9 Unit Apartments | 0 | 0.0% |
| 10 or more Apartments | 0 | 0.0% |
| Mobile Home / Other | 112 | 10.7% |
| Total | 1,050 | 100.0% |
Housing Structures by Occupancy in Paden City
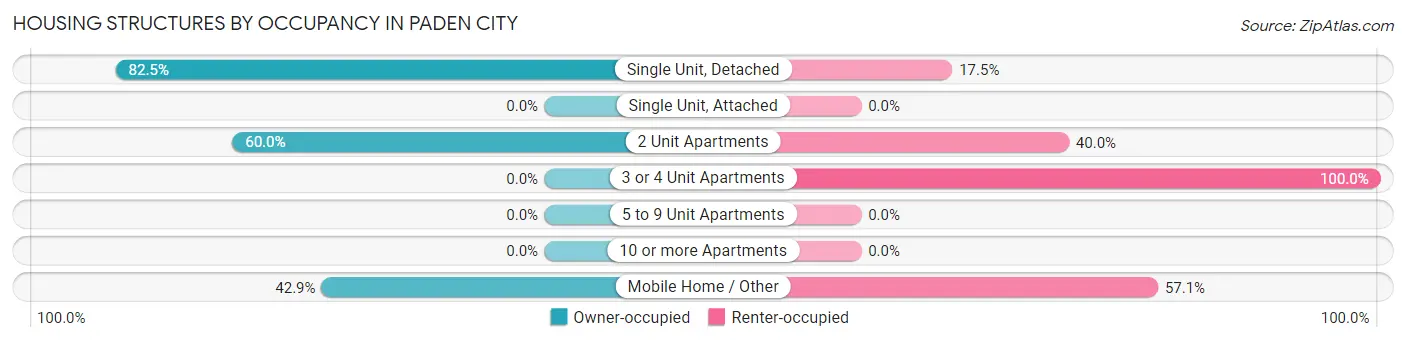
| Structure Type | Owner-occupied | Renter-occupied |
| Single Unit, Detached | 762 (82.5%) | 162 (17.5%) |
| Single Unit, Attached | 0 (0.0%) | 0 (0.0%) |
| 2 Unit Apartments | 6 (60.0%) | 4 (40.0%) |
| 3 or 4 Unit Apartments | 0 (0.0%) | 4 (100.0%) |
| 5 to 9 Unit Apartments | 0 (0.0%) | 0 (0.0%) |
| 10 or more Apartments | 0 (0.0%) | 0 (0.0%) |
| Mobile Home / Other | 48 (42.9%) | 64 (57.1%) |
| Total | 816 (77.7%) | 234 (22.3%) |
Housing Structures by Number of Rooms in Paden City
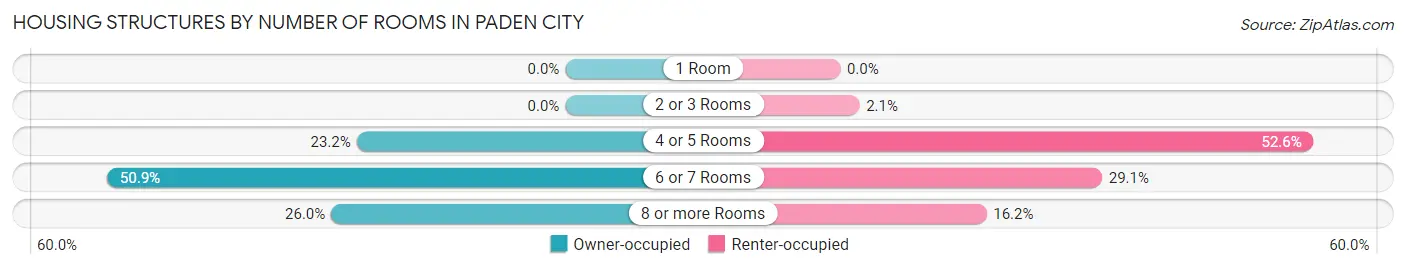
| Number of Rooms | Owner-occupied | Renter-occupied |
| 1 Room | 0 (0.0%) | 0 (0.0%) |
| 2 or 3 Rooms | 0 (0.0%) | 5 (2.1%) |
| 4 or 5 Rooms | 189 (23.2%) | 123 (52.6%) |
| 6 or 7 Rooms | 415 (50.9%) | 68 (29.1%) |
| 8 or more Rooms | 212 (26.0%) | 38 (16.2%) |
| Total | 816 (100.0%) | 234 (100.0%) |
Housing Structure by Heating Type in Paden City
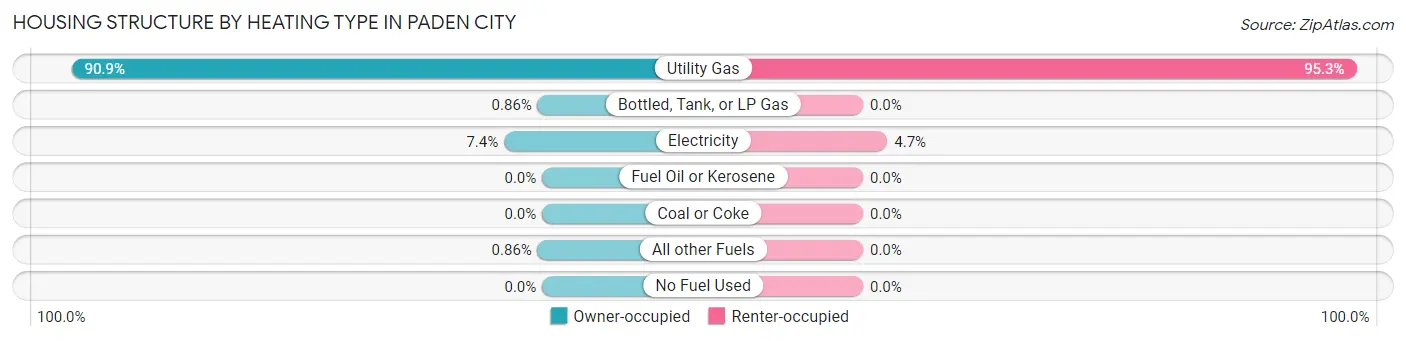
| Heating Type | Owner-occupied | Renter-occupied |
| Utility Gas | 742 (90.9%) | 223 (95.3%) |
| Bottled, Tank, or LP Gas | 7 (0.9%) | 0 (0.0%) |
| Electricity | 60 (7.3%) | 11 (4.7%) |
| Fuel Oil or Kerosene | 0 (0.0%) | 0 (0.0%) |
| Coal or Coke | 0 (0.0%) | 0 (0.0%) |
| All other Fuels | 7 (0.9%) | 0 (0.0%) |
| No Fuel Used | 0 (0.0%) | 0 (0.0%) |
| Total | 816 (100.0%) | 234 (100.0%) |
Household Vehicle Usage in Paden City
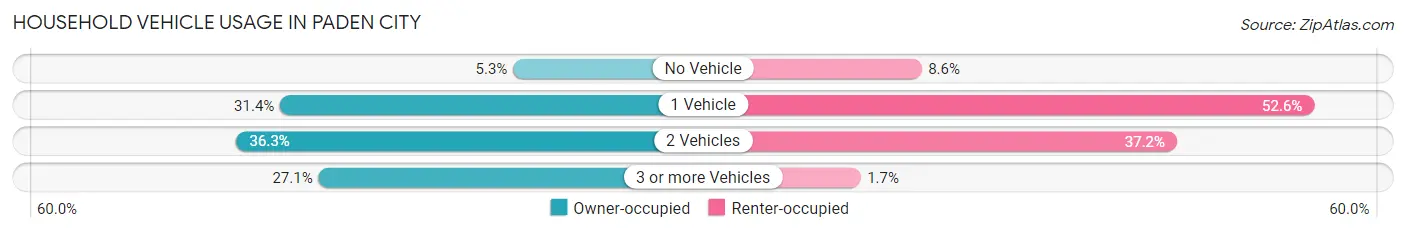
| Vehicles per Household | Owner-occupied | Renter-occupied |
| No Vehicle | 43 (5.3%) | 20 (8.6%) |
| 1 Vehicle | 256 (31.4%) | 123 (52.6%) |
| 2 Vehicles | 296 (36.3%) | 87 (37.2%) |
| 3 or more Vehicles | 221 (27.1%) | 4 (1.7%) |
| Total | 816 (100.0%) | 234 (100.0%) |
Real Estate & Mortgages in Paden City
Real Estate and Mortgage Overview in Paden City
| Characteristic | Without Mortgage | With Mortgage |
| Housing Units | 475 | 341 |
| Median Property Value | $91,700 | $91,800 |
| Median Household Income | $50,625 | $45 |
| Monthly Housing Costs | $380 | $0 |
| Real Estate Taxes | $621 | $0 |
Property Value by Mortgage Status in Paden City
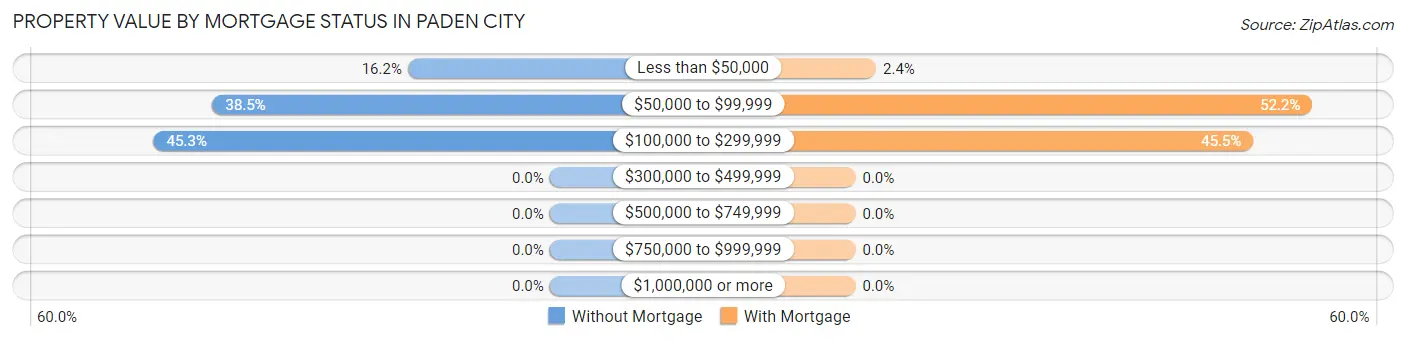
| Property Value | Without Mortgage | With Mortgage |
| Less than $50,000 | 77 (16.2%) | 8 (2.4%) |
| $50,000 to $99,999 | 183 (38.5%) | 178 (52.2%) |
| $100,000 to $299,999 | 215 (45.3%) | 155 (45.5%) |
| $300,000 to $499,999 | 0 (0.0%) | 0 (0.0%) |
| $500,000 to $749,999 | 0 (0.0%) | 0 (0.0%) |
| $750,000 to $999,999 | 0 (0.0%) | 0 (0.0%) |
| $1,000,000 or more | 0 (0.0%) | 0 (0.0%) |
| Total | 475 (100.0%) | 341 (100.0%) |
Household Income by Mortgage Status in Paden City
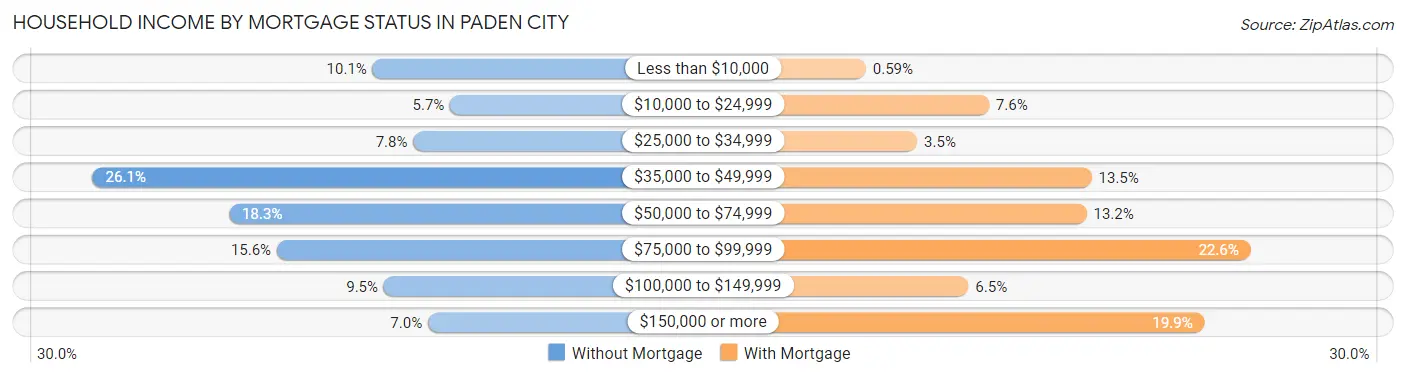
| Household Income | Without Mortgage | With Mortgage |
| Less than $10,000 | 48 (10.1%) | 2 (0.6%) |
| $10,000 to $24,999 | 27 (5.7%) | 26 (7.6%) |
| $25,000 to $34,999 | 37 (7.8%) | 12 (3.5%) |
| $35,000 to $49,999 | 124 (26.1%) | 46 (13.5%) |
| $50,000 to $74,999 | 87 (18.3%) | 45 (13.2%) |
| $75,000 to $99,999 | 74 (15.6%) | 77 (22.6%) |
| $100,000 to $149,999 | 45 (9.5%) | 22 (6.5%) |
| $150,000 or more | 33 (7.0%) | 68 (19.9%) |
| Total | 475 (100.0%) | 341 (100.0%) |
Property Value to Household Income Ratio in Paden City
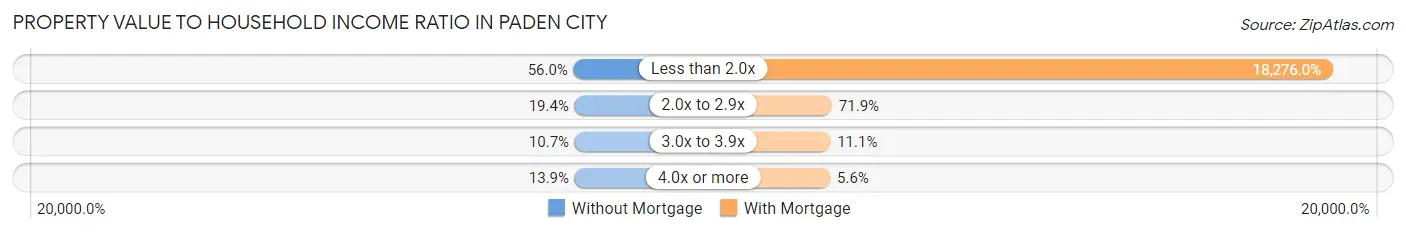
| Value-to-Income Ratio | Without Mortgage | With Mortgage |
| Less than 2.0x | 266 (56.0%) | 62,321 (18,276.0%) |
| 2.0x to 2.9x | 92 (19.4%) | 245 (71.9%) |
| 3.0x to 3.9x | 51 (10.7%) | 38 (11.1%) |
| 4.0x or more | 66 (13.9%) | 19 (5.6%) |
| Total | 475 (100.0%) | 341 (100.0%) |
Real Estate Taxes by Mortgage Status in Paden City
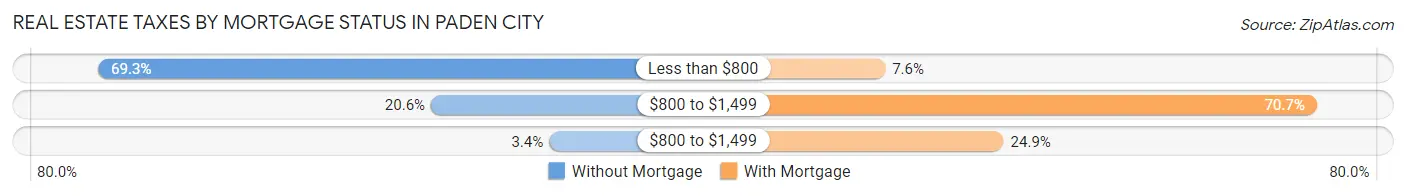
| Property Taxes | Without Mortgage | With Mortgage |
| Less than $800 | 329 (69.3%) | 26 (7.6%) |
| $800 to $1,499 | 98 (20.6%) | 241 (70.7%) |
| $800 to $1,499 | 16 (3.4%) | 85 (24.9%) |
| Total | 475 (100.0%) | 341 (100.0%) |
Health & Disability in Paden City
Health Insurance Coverage by Age in Paden City
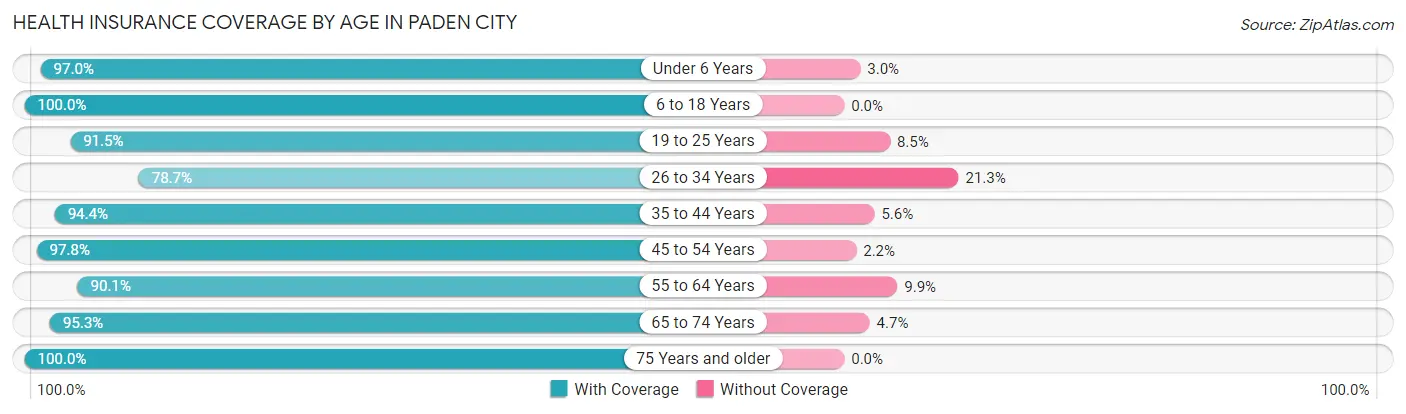
| Age Bracket | With Coverage | Without Coverage |
| Under 6 Years | 259 (97.0%) | 8 (3.0%) |
| 6 to 18 Years | 299 (100.0%) | 0 (0.0%) |
| 19 to 25 Years | 215 (91.5%) | 20 (8.5%) |
| 26 to 34 Years | 303 (78.7%) | 82 (21.3%) |
| 35 to 44 Years | 302 (94.4%) | 18 (5.6%) |
| 45 to 54 Years | 263 (97.8%) | 6 (2.2%) |
| 55 to 64 Years | 319 (90.1%) | 35 (9.9%) |
| 65 to 74 Years | 282 (95.3%) | 14 (4.7%) |
| 75 Years and older | 315 (100.0%) | 0 (0.0%) |
| Total | 2,557 (93.3%) | 183 (6.7%) |
Health Insurance Coverage by Citizenship Status in Paden City
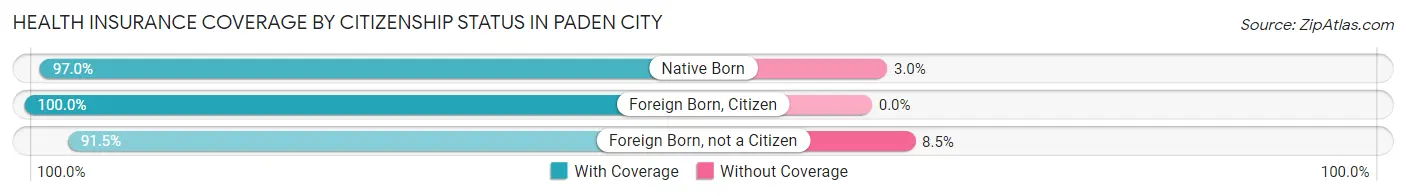
| Citizenship Status | With Coverage | Without Coverage |
| Native Born | 259 (97.0%) | 8 (3.0%) |
| Foreign Born, Citizen | 299 (100.0%) | 0 (0.0%) |
| Foreign Born, not a Citizen | 215 (91.5%) | 20 (8.5%) |
Health Insurance Coverage by Household Income in Paden City
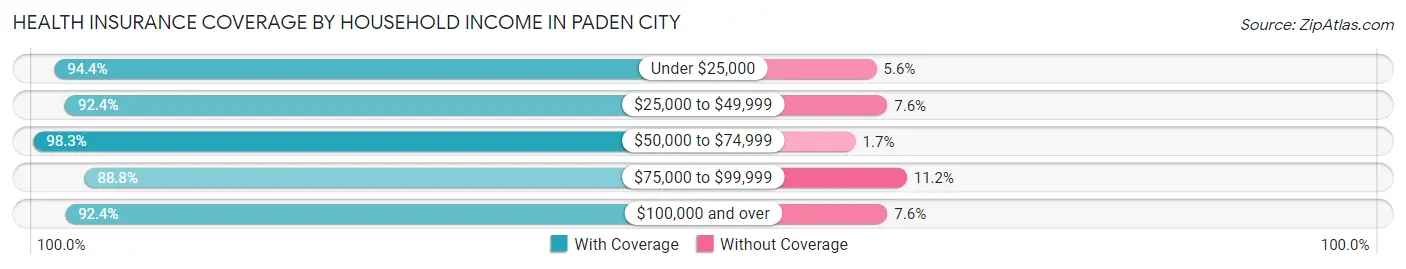
| Household Income | With Coverage | Without Coverage |
| Under $25,000 | 237 (94.4%) | 14 (5.6%) |
| $25,000 to $49,999 | 681 (92.4%) | 56 (7.6%) |
| $50,000 to $74,999 | 592 (98.3%) | 10 (1.7%) |
| $75,000 to $99,999 | 379 (88.8%) | 48 (11.2%) |
| $100,000 and over | 668 (92.4%) | 55 (7.6%) |
Public vs Private Health Insurance Coverage by Age in Paden City
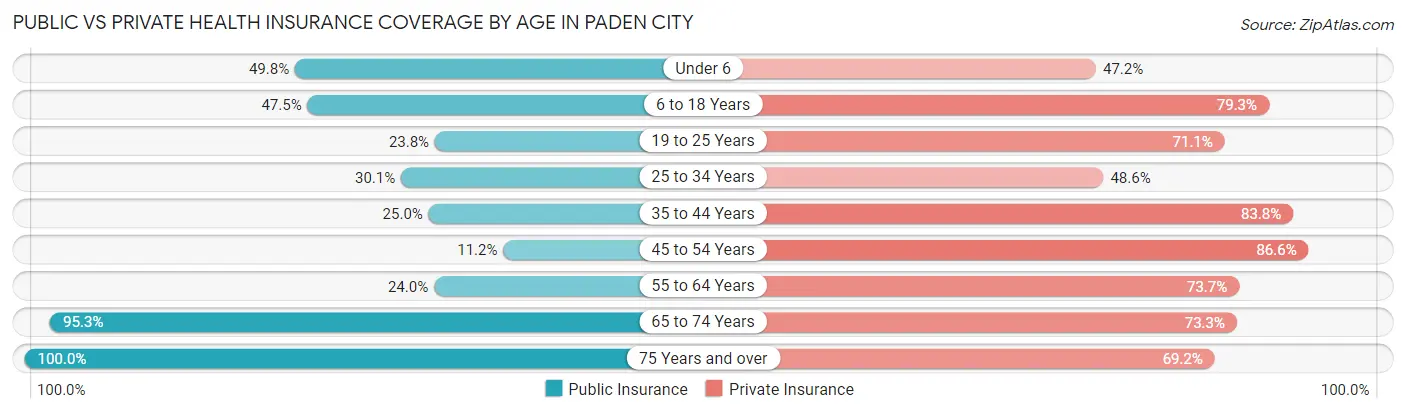
| Age Bracket | Public Insurance | Private Insurance |
| Under 6 | 133 (49.8%) | 126 (47.2%) |
| 6 to 18 Years | 142 (47.5%) | 237 (79.3%) |
| 19 to 25 Years | 56 (23.8%) | 167 (71.1%) |
| 25 to 34 Years | 116 (30.1%) | 187 (48.6%) |
| 35 to 44 Years | 80 (25.0%) | 268 (83.8%) |
| 45 to 54 Years | 30 (11.2%) | 233 (86.6%) |
| 55 to 64 Years | 85 (24.0%) | 261 (73.7%) |
| 65 to 74 Years | 282 (95.3%) | 217 (73.3%) |
| 75 Years and over | 315 (100.0%) | 218 (69.2%) |
| Total | 1,239 (45.2%) | 1,914 (69.9%) |
Disability Status by Sex by Age in Paden City
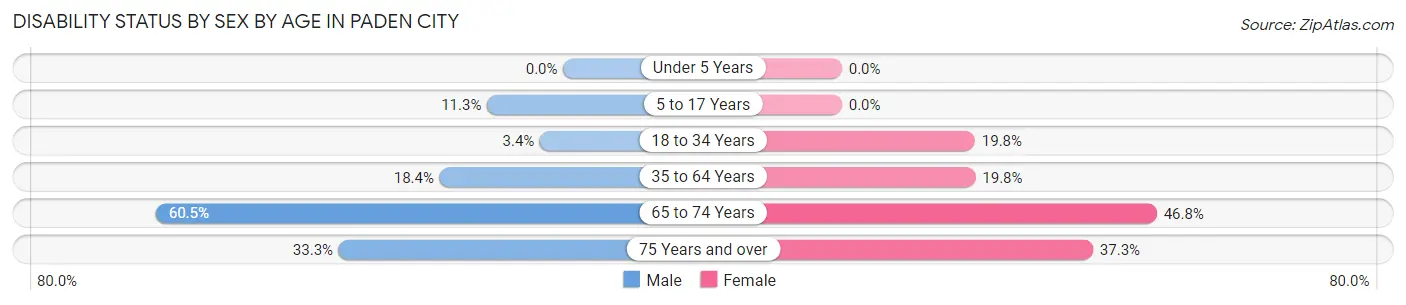
| Age Bracket | Male | Female |
| Under 5 Years | 0 (0.0%) | 0 (0.0%) |
| 5 to 17 Years | 26 (11.3%) | 0 (0.0%) |
| 18 to 34 Years | 13 (3.4%) | 50 (19.8%) |
| 35 to 64 Years | 87 (18.3%) | 93 (19.8%) |
| 65 to 74 Years | 95 (60.5%) | 65 (46.8%) |
| 75 Years and over | 46 (33.3%) | 66 (37.3%) |
Disability Class by Sex by Age in Paden City
Disability Class: Hearing Difficulty
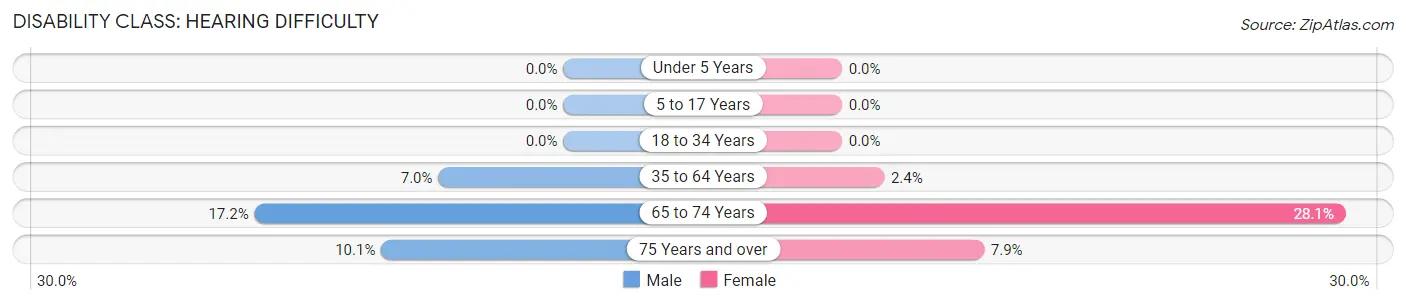
| Age Bracket | Male | Female |
| Under 5 Years | 0 (0.0%) | 0 (0.0%) |
| 5 to 17 Years | 0 (0.0%) | 0 (0.0%) |
| 18 to 34 Years | 0 (0.0%) | 0 (0.0%) |
| 35 to 64 Years | 33 (7.0%) | 11 (2.4%) |
| 65 to 74 Years | 27 (17.2%) | 39 (28.1%) |
| 75 Years and over | 14 (10.1%) | 14 (7.9%) |
Disability Class: Vision Difficulty
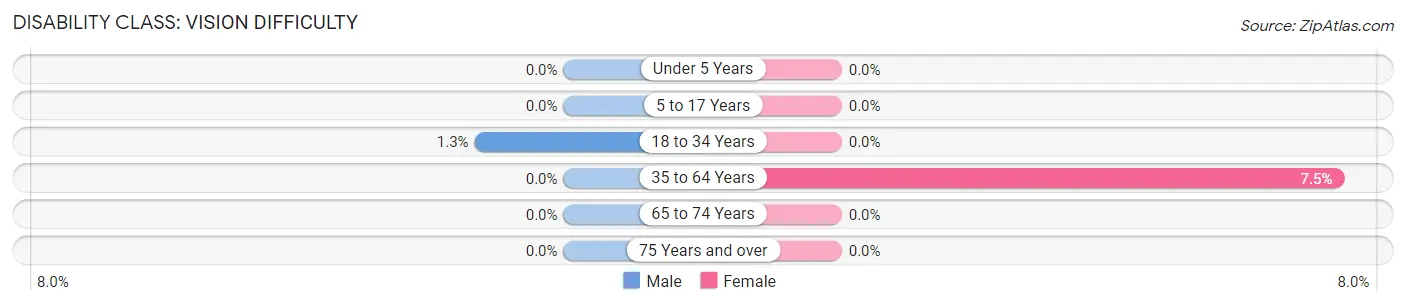
| Age Bracket | Male | Female |
| Under 5 Years | 0 (0.0%) | 0 (0.0%) |
| 5 to 17 Years | 0 (0.0%) | 0 (0.0%) |
| 18 to 34 Years | 5 (1.3%) | 0 (0.0%) |
| 35 to 64 Years | 0 (0.0%) | 35 (7.5%) |
| 65 to 74 Years | 0 (0.0%) | 0 (0.0%) |
| 75 Years and over | 0 (0.0%) | 0 (0.0%) |
Disability Class: Cognitive Difficulty
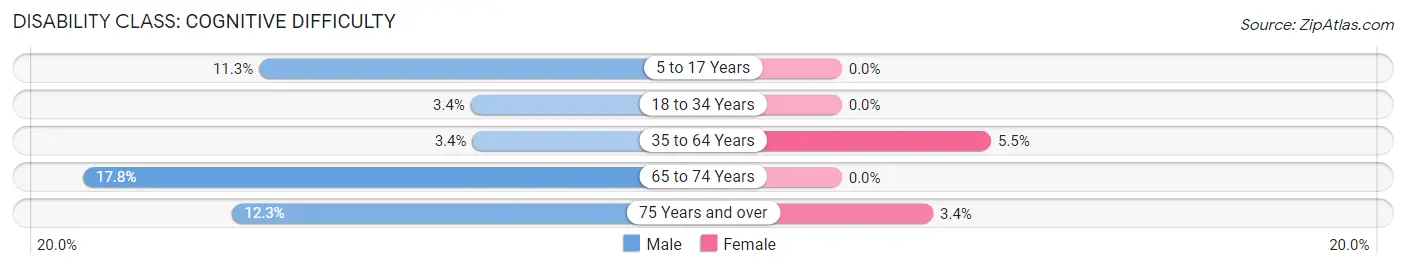
| Age Bracket | Male | Female |
| 5 to 17 Years | 26 (11.3%) | 0 (0.0%) |
| 18 to 34 Years | 13 (3.4%) | 0 (0.0%) |
| 35 to 64 Years | 16 (3.4%) | 26 (5.5%) |
| 65 to 74 Years | 28 (17.8%) | 0 (0.0%) |
| 75 Years and over | 17 (12.3%) | 6 (3.4%) |
Disability Class: Ambulatory Difficulty
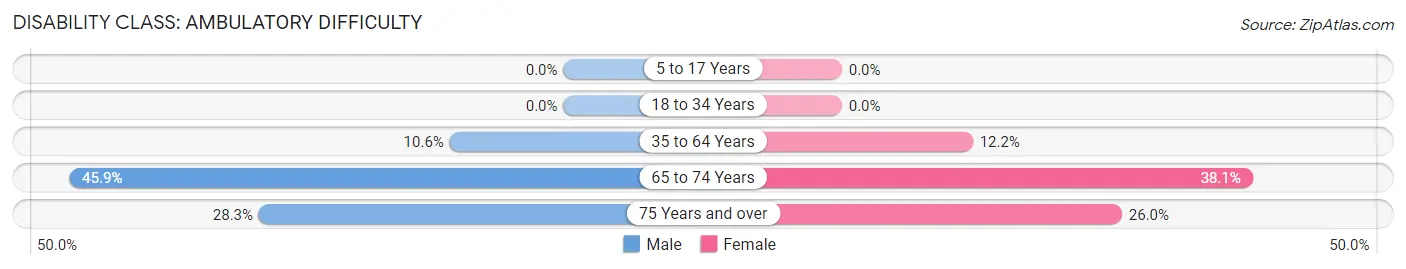
| Age Bracket | Male | Female |
| 5 to 17 Years | 0 (0.0%) | 0 (0.0%) |
| 18 to 34 Years | 0 (0.0%) | 0 (0.0%) |
| 35 to 64 Years | 50 (10.5%) | 57 (12.1%) |
| 65 to 74 Years | 72 (45.9%) | 53 (38.1%) |
| 75 Years and over | 39 (28.3%) | 46 (26.0%) |
Disability Class: Self-Care Difficulty
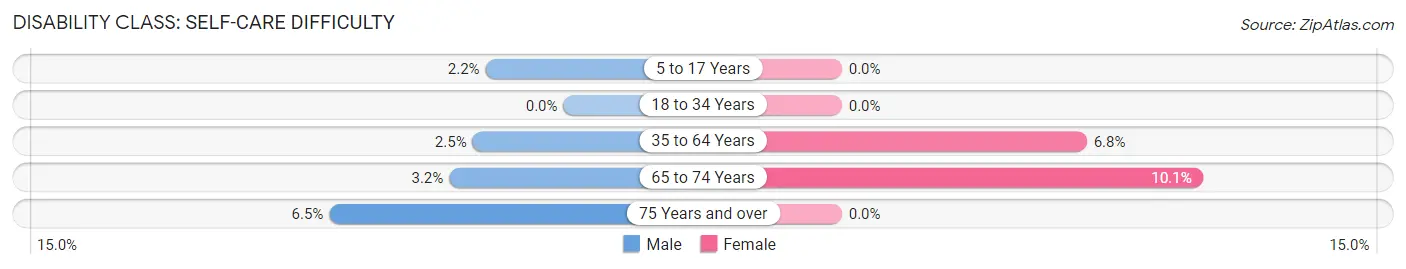
| Age Bracket | Male | Female |
| 5 to 17 Years | 5 (2.2%) | 0 (0.0%) |
| 18 to 34 Years | 0 (0.0%) | 0 (0.0%) |
| 35 to 64 Years | 12 (2.5%) | 32 (6.8%) |
| 65 to 74 Years | 5 (3.2%) | 14 (10.1%) |
| 75 Years and over | 9 (6.5%) | 0 (0.0%) |
Technology Access in Paden City
Computing Device Access in Paden City
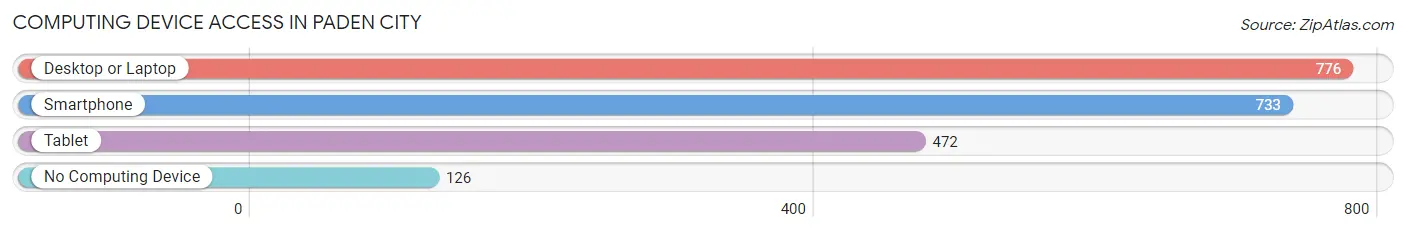
| Device Type | # Households | % Households |
| Desktop or Laptop | 776 | 73.9% |
| Smartphone | 733 | 69.8% |
| Tablet | 472 | 45.0% |
| No Computing Device | 126 | 12.0% |
| Total | 1,050 | 100.0% |
Internet Access in Paden City
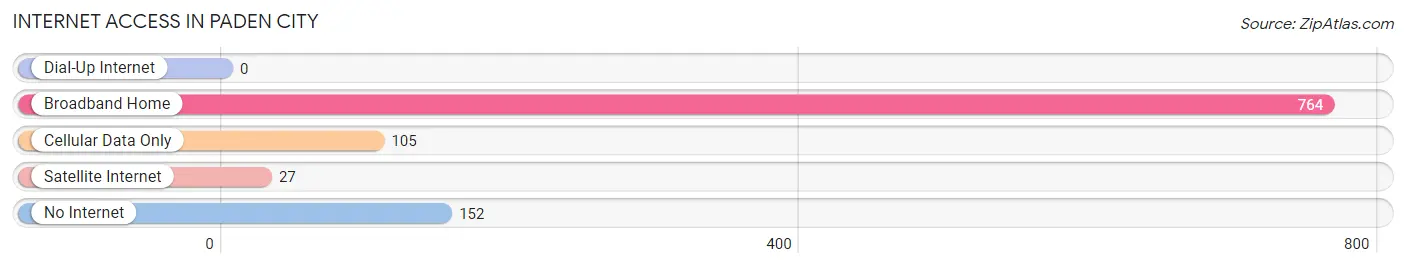
| Internet Type | # Households | % Households |
| Dial-Up Internet | 0 | 0.0% |
| Broadband Home | 764 | 72.8% |
| Cellular Data Only | 105 | 10.0% |
| Satellite Internet | 27 | 2.6% |
| No Internet | 152 | 14.5% |
| Total | 1,050 | 100.0% |
Paden City Summary
Paden City is a small city located in Wetzel County, West Virginia. It is situated along the Ohio River, approximately 30 miles south of Wheeling. The city was founded in 1891 by the Paden City Land Company, and was named after the company’s president, John Paden. The city has a population of approximately 2,000 people, and is the county seat of Wetzel County.
Geography
Paden City is located in the northern panhandle of West Virginia, along the Ohio River. It is situated in the Appalachian Plateau region of the state, and is surrounded by rolling hills and forests. The city is located approximately 30 miles south of Wheeling, and is accessible by US Route 2 and State Route 7. The city is also located near the border of Ohio and Pennsylvania.
Climate
Paden City has a humid continental climate, with hot summers and cold winters. The average annual temperature is around 50 degrees Fahrenheit, with temperatures ranging from the low 30s in the winter to the mid-80s in the summer. The city receives an average of 40 inches of precipitation per year, with most of it falling in the form of snow in the winter months.
Demographics
As of the 2010 census, Paden City had a population of 2,017 people. The racial makeup of the city was 97.2% White, 0.7% African American, 0.3% Native American, 0.2% Asian, 0.1% Pacific Islander, and 1.5% from two or more races. Hispanic or Latino of any race were 0.7% of the population.
Economy
Paden City’s economy is largely based on manufacturing and retail. The city is home to several factories, including a glass factory, a furniture factory, and a plastics factory. The city also has several retail stores, including a grocery store, a hardware store, and a clothing store.
History
Paden City was founded in 1891 by the Paden City Land Company. The company was led by John Paden, who named the city after himself. The city was incorporated in 1895, and the first mayor was elected in 1896.
In the early 1900s, Paden City experienced a period of growth and prosperity. The city was home to several factories, including a glass factory, a furniture factory, and a plastics factory. The city also had several retail stores, including a grocery store, a hardware store, and a clothing store.
In the mid-1900s, the city began to decline. The factories closed, and the retail stores moved away. The population of the city decreased, and the economy suffered.
In the late 1900s, the city began to experience a resurgence. The factories reopened, and new businesses moved into the city. The population of the city began to increase, and the economy began to improve.
Today, Paden City is a small city with a population of approximately 2,000 people. The city is home to several factories, and has several retail stores. The city is also home to several parks and recreational areas, including a golf course and a swimming pool. The city is also home to several churches, and is a popular destination for tourists.
Common Questions
What is Per Capita Income in Paden City?
Per Capita income in Paden City is $28,090.
What is the Median Family Income in Paden City?
Median Family Income in Paden City is $66,389.
What is the Median Household income in Paden City?
Median Household Income in Paden City is $53,833.
What is Income or Wage Gap in Paden City?
Income or Wage Gap in Paden City is 41.9%.
Women in Paden City earn 58.1 cents for every dollar earned by a man.
What is Inequality or Gini Index in Paden City?
Inequality or Gini Index in Paden City is 0.39.
What is the Total Population of Paden City?
Total Population of Paden City is 2,740.
What is the Total Male Population of Paden City?
Total Male Population of Paden City is 1,465.
What is the Total Female Population of Paden City?
Total Female Population of Paden City is 1,275.
What is the Ratio of Males per 100 Females in Paden City?
There are 114.90 Males per 100 Females in Paden City.
What is the Ratio of Females per 100 Males in Paden City?
There are 87.03 Females per 100 Males in Paden City.
What is the Median Population Age in Paden City?
Median Population Age in Paden City is 41.2 Years.
What is the Average Family Size in Paden City
Average Family Size in Paden City is 3.3 People.
What is the Average Household Size in Paden City
Average Household Size in Paden City is 2.6 People.
How Large is the Labor Force in Paden City?
There are 1,176 People in the Labor Forcein in Paden City.
What is the Percentage of People in the Labor Force in Paden City?
51.2% of People are in the Labor Force in Paden City.
What is the Unemployment Rate in Paden City?
Unemployment Rate in Paden City is 5.1%.