Springfield, WV Map & Demographics
Springfield Map
Springfield Overview
$15,992
PER CAPITA INCOME
0.39
INEQUALITY / GINI INDEX
411
TOTAL POPULATION
155
MALE POPULATION
256
FEMALE POPULATION
60.55
MALES / 100 FEMALES
165.16
FEMALES / 100 MALES
33.8
MEDIAN AGE
5.4
AVG FAMILY SIZE
4.2
AVG HOUSEHOLD SIZE
162
LABOR FORCE [ PEOPLE ]
75.0%
PERCENT IN LABOR FORCE
Springfield Zip Codes
Springfield Area Codes
Income in Springfield
Income Overview in Springfield
| Characteristic | Number | Measure |
| Per Capita Income | 411 | $15,992 |
| Median Family Income | 71 | $0 |
| Mean Family Income | 71 | $75,900 |
| Median Household Income | 99 | $0 |
| Mean Household Income | 99 | $60,825 |
| Income Deficit | 71 | $0 |
| Wage / Income Gap (%) | 411 | 0.00% |
| Wage / Income Gap ($) | 411 | 100.00¢ per $1 |
| Gini / Inequality Index | 411 | 0.39 |
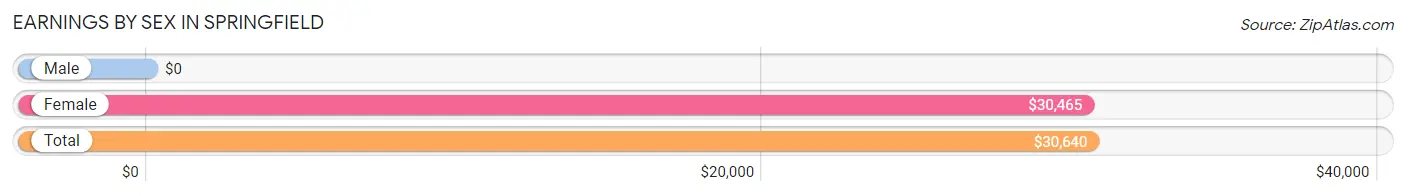
Earnings by Sex in Springfield
| Sex | Number | Average Earnings |
| Male | 38 (23.5%) | $0 |
| Female | 124 (76.5%) | $30,465 |
| Total | 162 (100.0%) | $30,640 |
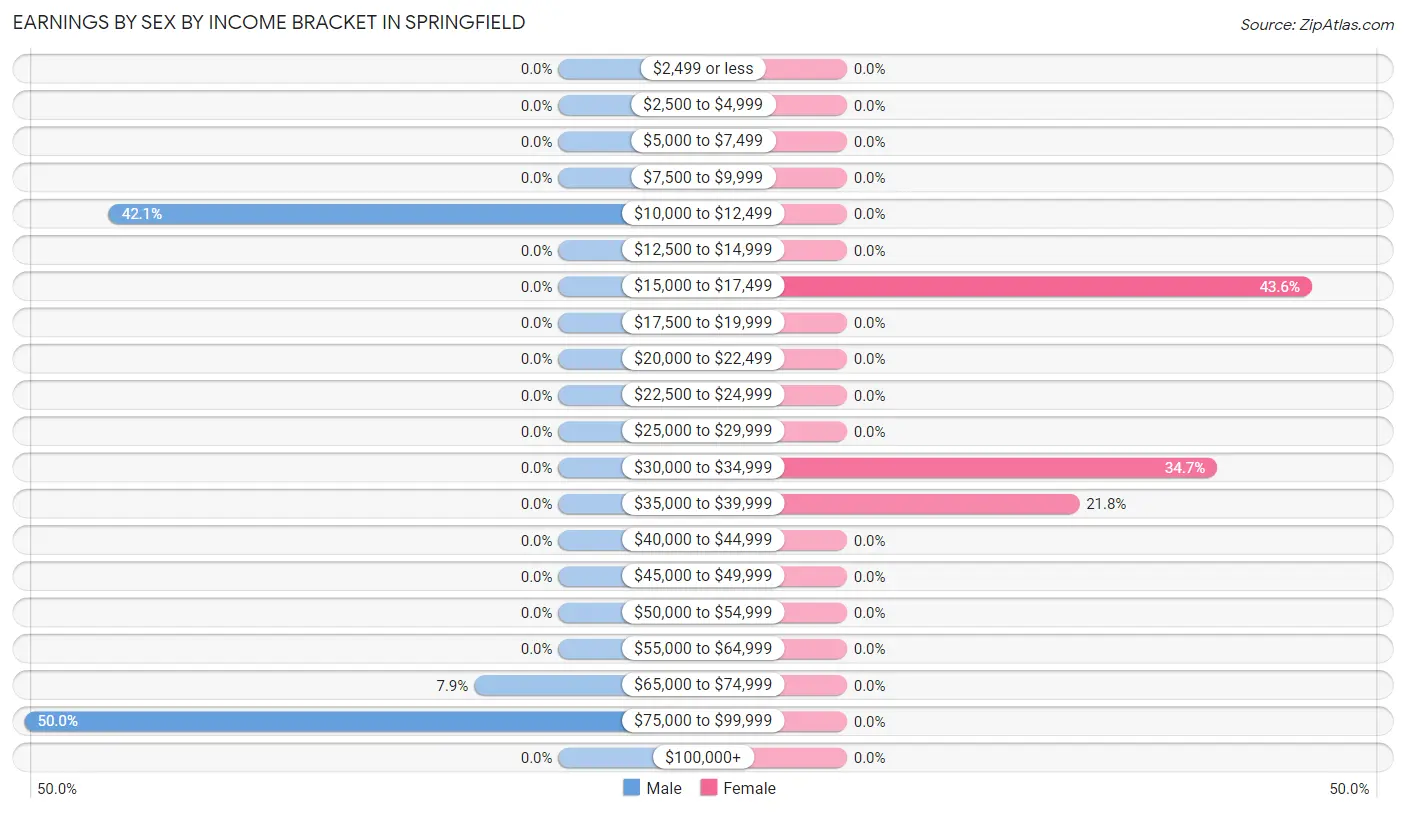
Earnings by Sex by Income Bracket in Springfield
The most common earnings brackets in Springfield are $75,000 to $99,999 for men (19 | 50.0%) and $15,000 to $17,499 for women (54 | 43.5%).
| Income | Male | Female |
| $2,499 or less | 0 (0.0%) | 0 (0.0%) |
| $2,500 to $4,999 | 0 (0.0%) | 0 (0.0%) |
| $5,000 to $7,499 | 0 (0.0%) | 0 (0.0%) |
| $7,500 to $9,999 | 0 (0.0%) | 0 (0.0%) |
| $10,000 to $12,499 | 16 (42.1%) | 0 (0.0%) |
| $12,500 to $14,999 | 0 (0.0%) | 0 (0.0%) |
| $15,000 to $17,499 | 0 (0.0%) | 54 (43.5%) |
| $17,500 to $19,999 | 0 (0.0%) | 0 (0.0%) |
| $20,000 to $22,499 | 0 (0.0%) | 0 (0.0%) |
| $22,500 to $24,999 | 0 (0.0%) | 0 (0.0%) |
| $25,000 to $29,999 | 0 (0.0%) | 0 (0.0%) |
| $30,000 to $34,999 | 0 (0.0%) | 43 (34.7%) |
| $35,000 to $39,999 | 0 (0.0%) | 27 (21.8%) |
| $40,000 to $44,999 | 0 (0.0%) | 0 (0.0%) |
| $45,000 to $49,999 | 0 (0.0%) | 0 (0.0%) |
| $50,000 to $54,999 | 0 (0.0%) | 0 (0.0%) |
| $55,000 to $64,999 | 0 (0.0%) | 0 (0.0%) |
| $65,000 to $74,999 | 3 (7.9%) | 0 (0.0%) |
| $75,000 to $99,999 | 19 (50.0%) | 0 (0.0%) |
| $100,000+ | 0 (0.0%) | 0 (0.0%) |
| Total | 38 (100.0%) | 124 (100.0%) |
Earnings by Sex by Educational Attainment in Springfield
| Educational Attainment | Male Income | Female Income |
| Less than High School | - | - |
| High School Diploma | - | - |
| College or Associate's Degree | - | - |
| Bachelor's Degree | - | - |
| Graduate Degree | - | - |
| Total | - | - |
Family Income in Springfield
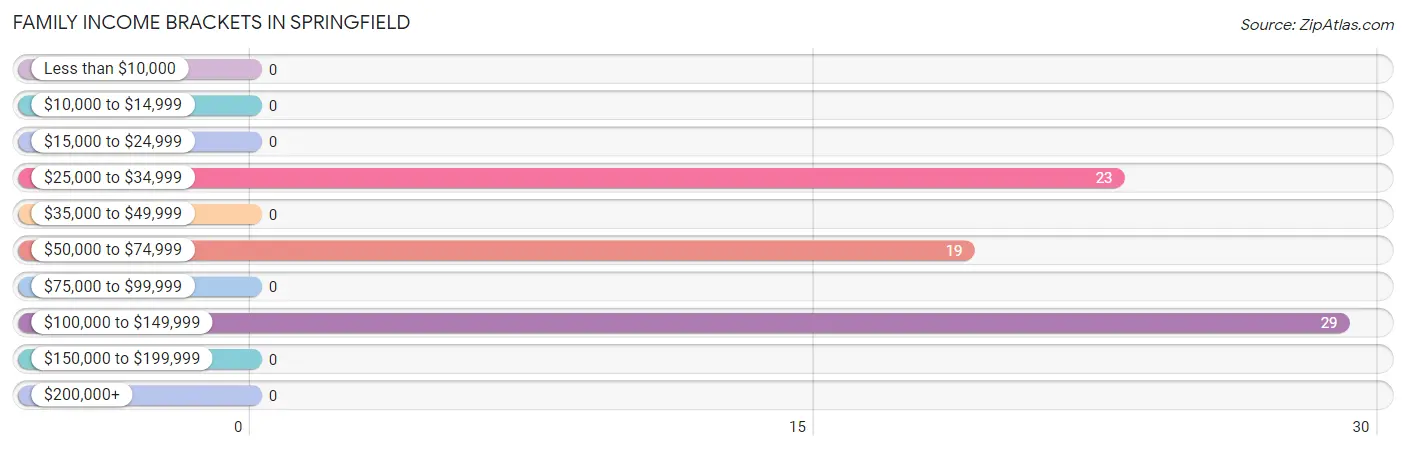
Family Income Brackets in Springfield
According to the Springfield family income data, there are 29 families falling into the $100,000 to $149,999 income range, which is the most common income bracket and makes up 40.8% of all families.
| Income Bracket | # Families | % Families |
| Less than $10,000 | 0 | 0.0% |
| $10,000 to $14,999 | 0 | 0.0% |
| $15,000 to $24,999 | 0 | 0.0% |
| $25,000 to $34,999 | 23 | 32.4% |
| $35,000 to $49,999 | 0 | 0.0% |
| $50,000 to $74,999 | 19 | 26.8% |
| $75,000 to $99,999 | 0 | 0.0% |
| $100,000 to $149,999 | 29 | 40.8% |
| $150,000 to $199,999 | 0 | 0.0% |
| $200,000+ | 0 | 0.0% |
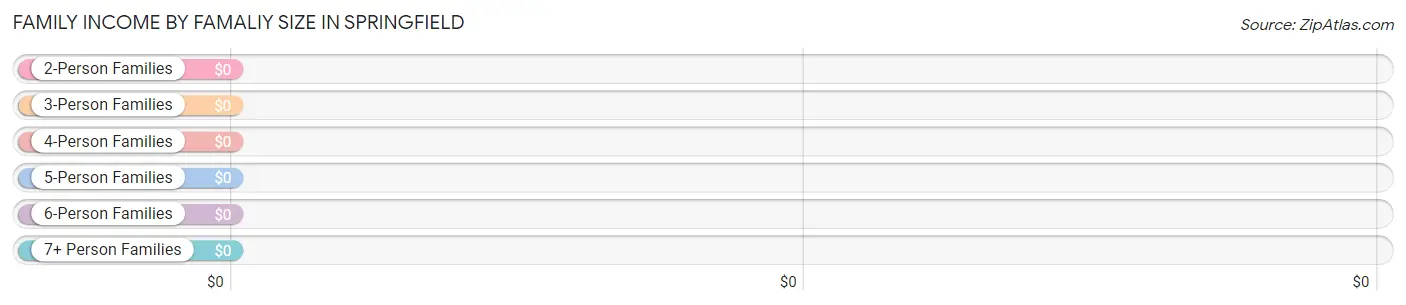
Family Income by Famaliy Size in Springfield
| Income Bracket | # Families | Median Income |
| 2-Person Families | 23 (32.4%) | $0 |
| 3-Person Families | 16 (22.5%) | $0 |
| 4-Person Families | 32 (45.1%) | $0 |
| 5-Person Families | 0 (0.0%) | $0 |
| 6-Person Families | 0 (0.0%) | $0 |
| 7+ Person Families | 0 (0.0%) | $0 |
| Total | 71 (100.0%) | $0 |
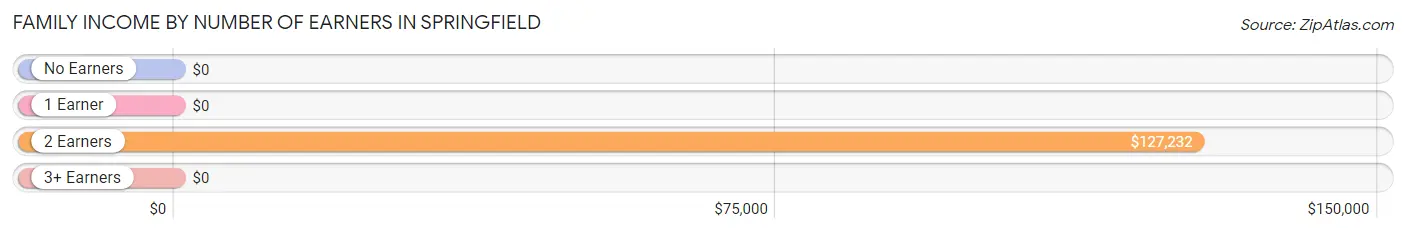
Family Income by Number of Earners in Springfield
| Number of Earners | # Families | Median Income |
| No Earners | 0 (0.0%) | $0 |
| 1 Earner | 42 (59.2%) | $0 |
| 2 Earners | 29 (40.8%) | $127,232 |
| 3+ Earners | 0 (0.0%) | $0 |
| Total | 71 (100.0%) | $0 |
Household Income in Springfield
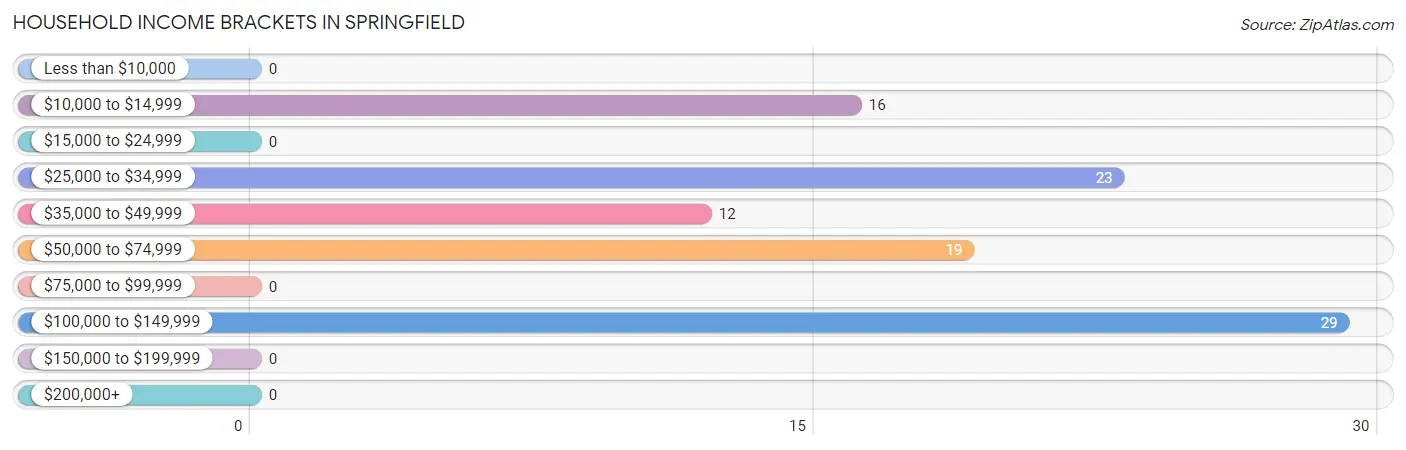
Household Income Brackets in Springfield
With 29 households falling in the category, the $100,000 to $149,999 income range is the most frequent in Springfield, accounting for 29.3% of all households.
| Income Bracket | # Households | % Households |
| Less than $10,000 | 0 | 0.0% |
| $10,000 to $14,999 | 16 | 16.2% |
| $15,000 to $24,999 | 0 | 0.0% |
| $25,000 to $34,999 | 23 | 23.2% |
| $35,000 to $49,999 | 12 | 12.1% |
| $50,000 to $74,999 | 19 | 19.2% |
| $75,000 to $99,999 | 0 | 0.0% |
| $100,000 to $149,999 | 29 | 29.3% |
| $150,000 to $199,999 | 0 | 0.0% |
| $200,000+ | 0 | 0.0% |
Household Income by Householder Age in Springfield
The median household income in Springfield is $0, with the highest median household income of $127,232 found in the 25 to 44 years age bracket for the primary householder. A total of 29 households (29.3%) fall into this category.
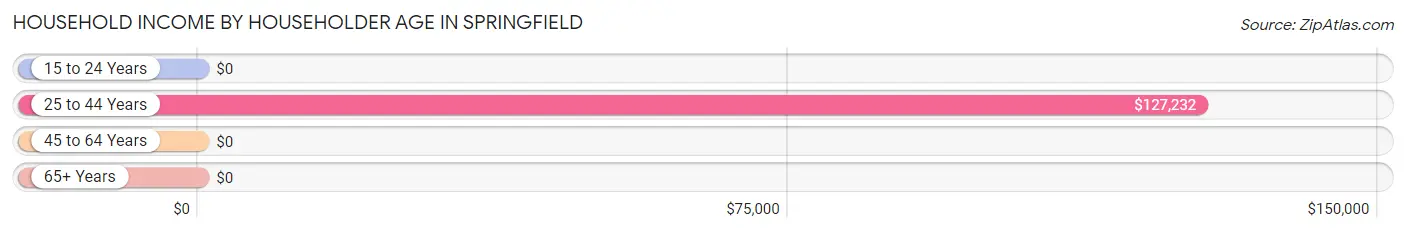
| Income Bracket | # Households | Median Income |
| 15 to 24 Years | 0 (0.0%) | $0 |
| 25 to 44 Years | 29 (29.3%) | $127,232 |
| 45 to 64 Years | 35 (35.3%) | $0 |
| 65+ Years | 35 (35.3%) | $0 |
| Total | 99 (100.0%) | $0 |
Poverty in Springfield
Income Below Poverty by Sex and Age in Springfield
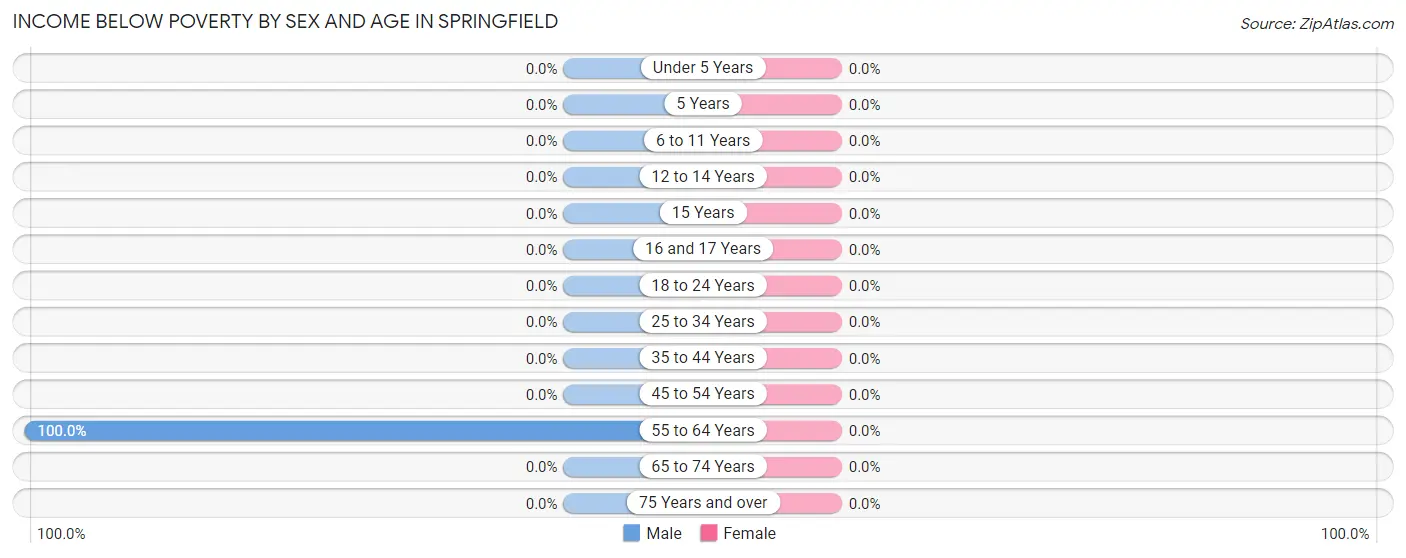
| Age Bracket | Male | Female |
| Under 5 Years | 0 (0.0%) | 0 (0.0%) |
| 5 Years | 0 (0.0%) | 0 (0.0%) |
| 6 to 11 Years | 0 (0.0%) | 0 (0.0%) |
| 12 to 14 Years | 0 (0.0%) | 0 (0.0%) |
| 15 Years | 0 (0.0%) | 0 (0.0%) |
| 16 and 17 Years | 0 (0.0%) | 0 (0.0%) |
| 18 to 24 Years | 0 (0.0%) | 0 (0.0%) |
| 25 to 34 Years | 0 (0.0%) | 0 (0.0%) |
| 35 to 44 Years | 0 (0.0%) | 0 (0.0%) |
| 45 to 54 Years | 0 (0.0%) | 0 (0.0%) |
| 55 to 64 Years | 16 (100.0%) | 0 (0.0%) |
| 65 to 74 Years | 0 (0.0%) | 0 (0.0%) |
| 75 Years and over | 0 (0.0%) | 0 (0.0%) |
| Total | 16 (10.3%) | 0 (0.0%) |
Income Above Poverty by Sex and Age in Springfield
According to the poverty statistics in Springfield, males aged 6 to 11 years and females aged under 5 years are the age groups that are most secure financially, with 100.0% of males and 100.0% of females in these age groups living above the poverty line.
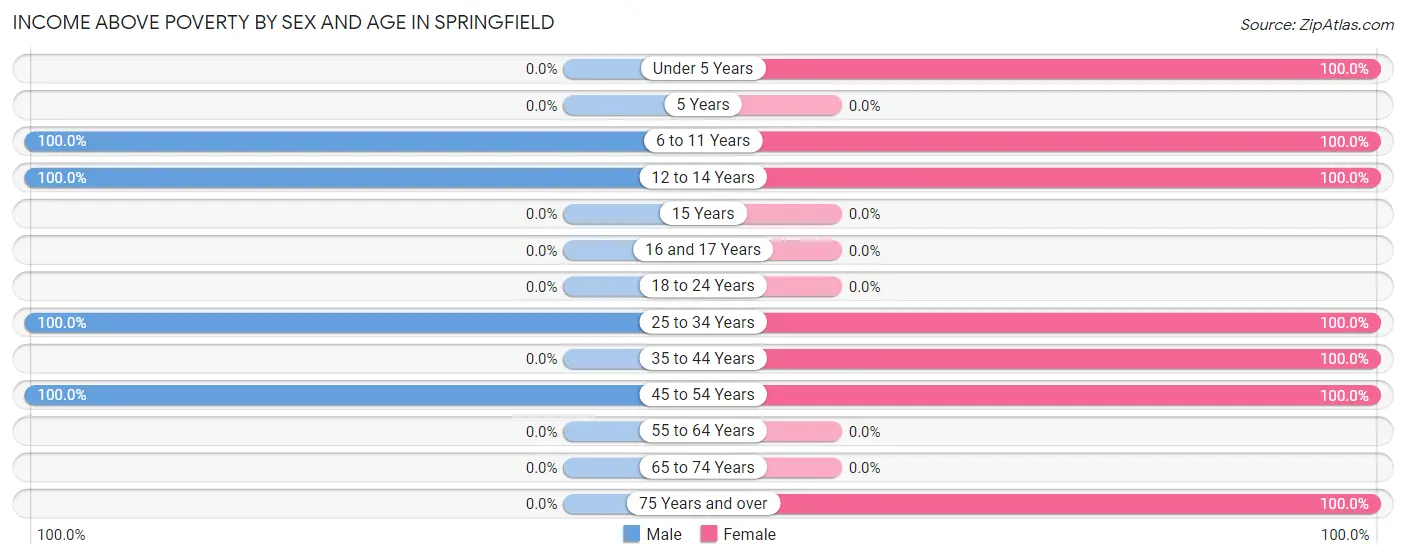
| Age Bracket | Male | Female |
| Under 5 Years | 0 (0.0%) | 3 (100.0%) |
| 5 Years | 0 (0.0%) | 0 (0.0%) |
| 6 to 11 Years | 78 (100.0%) | 39 (100.0%) |
| 12 to 14 Years | 20 (100.0%) | 55 (100.0%) |
| 15 Years | 0 (0.0%) | 0 (0.0%) |
| 16 and 17 Years | 0 (0.0%) | 0 (0.0%) |
| 18 to 24 Years | 0 (0.0%) | 0 (0.0%) |
| 25 to 34 Years | 14 (100.0%) | 14 (100.0%) |
| 35 to 44 Years | 0 (0.0%) | 69 (100.0%) |
| 45 to 54 Years | 27 (100.0%) | 41 (100.0%) |
| 55 to 64 Years | 0 (0.0%) | 0 (0.0%) |
| 65 to 74 Years | 0 (0.0%) | 0 (0.0%) |
| 75 Years and over | 0 (0.0%) | 35 (100.0%) |
| Total | 139 (89.7%) | 256 (100.0%) |
Income Below Poverty Among Married-Couple Families in Springfield
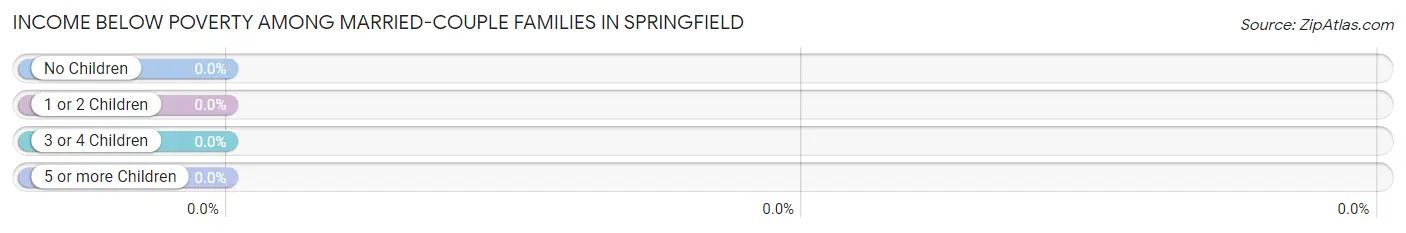
| Children | Above Poverty | Below Poverty |
| No Children | 0 (0.0%) | 0 (0.0%) |
| 1 or 2 Children | 48 (100.0%) | 0 (0.0%) |
| 3 or 4 Children | 0 (0.0%) | 0 (0.0%) |
| 5 or more Children | 0 (0.0%) | 0 (0.0%) |
| Total | 48 (100.0%) | 0 (0.0%) |
Income Below Poverty Among Single-Parent Households in Springfield
| Children | Single Father | Single Mother |
| No Children | 0 (0.0%) | 0 (0.0%) |
| 1 or 2 Children | 0 (0.0%) | 0 (0.0%) |
| 3 or 4 Children | 0 (0.0%) | 0 (0.0%) |
| 5 or more Children | 0 (0.0%) | 0 (0.0%) |
| Total | 0 (0.0%) | 0 (0.0%) |
Income Below Poverty Among Married-Couple vs Single-Parent Households in Springfield
| Children | Married-Couple Families | Single-Parent Households |
| No Children | 0 (0.0%) | 0 (0.0%) |
| 1 or 2 Children | 0 (0.0%) | 0 (0.0%) |
| 3 or 4 Children | 0 (0.0%) | 0 (0.0%) |
| 5 or more Children | 0 (0.0%) | 0 (0.0%) |
| Total | 0 (0.0%) | 0 (0.0%) |
Race in Springfield
The most populous races in Springfield are , and White / Caucasian (411 | 100.0%).
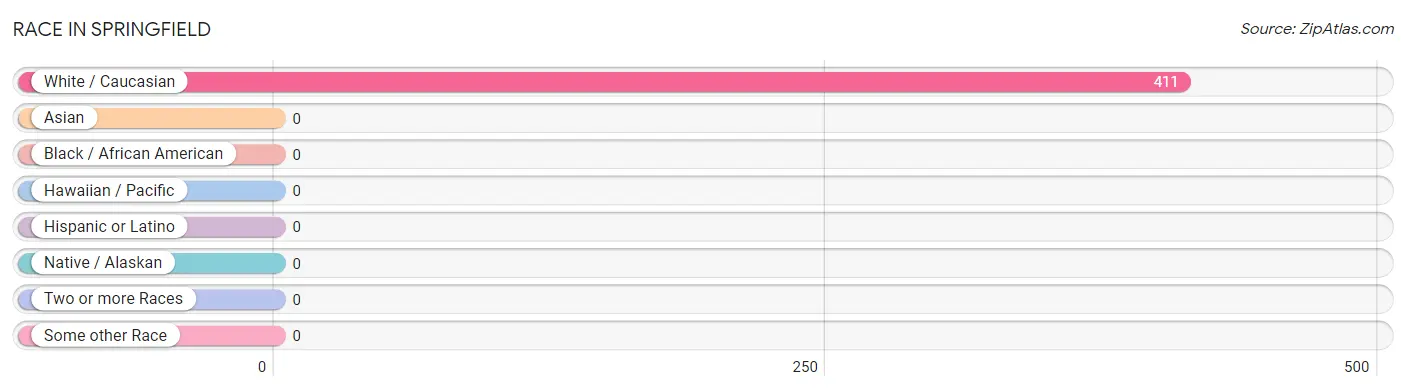
| Race | # Population | % Population |
| Asian | 0 | 0.0% |
| Black / African American | 0 | 0.0% |
| Hawaiian / Pacific | 0 | 0.0% |
| Hispanic or Latino | 0 | 0.0% |
| Native / Alaskan | 0 | 0.0% |
| White / Caucasian | 411 | 100.0% |
| Two or more Races | 0 | 0.0% |
| Some other Race | 0 | 0.0% |
| Total | 411 | 100.0% |
Ancestry in Springfield
The most populous ancestries reported in Springfield are Irish (210 | 51.1%), European (52 | 12.7%), American (34 | 8.3%), German (14 | 3.4%), and Italian (14 | 3.4%), together accounting for 78.8% of all Springfield residents.
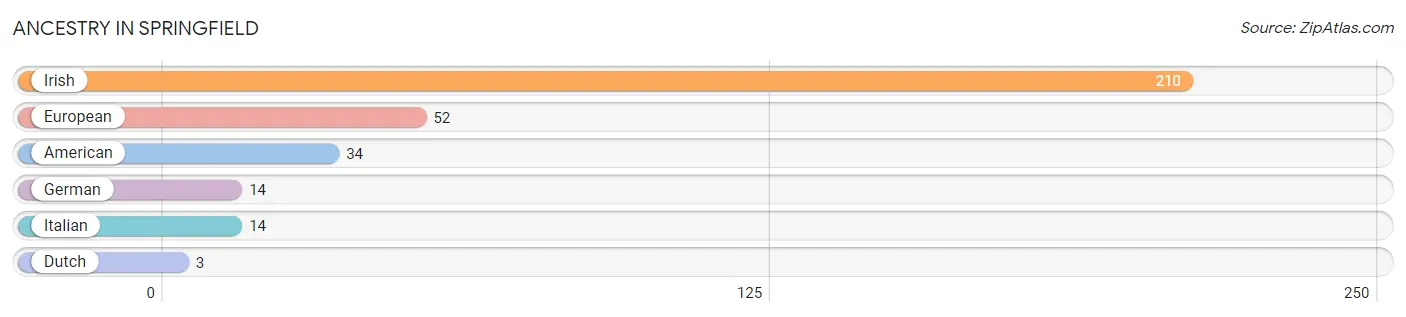
| Ancestry | # Population | % Population |
| American | 34 | 8.3% |
| Dutch | 3 | 0.7% |
| European | 52 | 12.7% |
| German | 14 | 3.4% |
| Irish | 210 | 51.1% |
| Italian | 14 | 3.4% | View All 6 Rows |
Immigrants in Springfield

| Immigration Origin | # Population | % Population | View All 0 Rows |
Sex and Age in Springfield
Sex and Age in Springfield
The most populous age groups in Springfield are 10 to 14 Years (98 | 63.2%) for men and 10 to 14 Years (75 | 29.3%) for women.
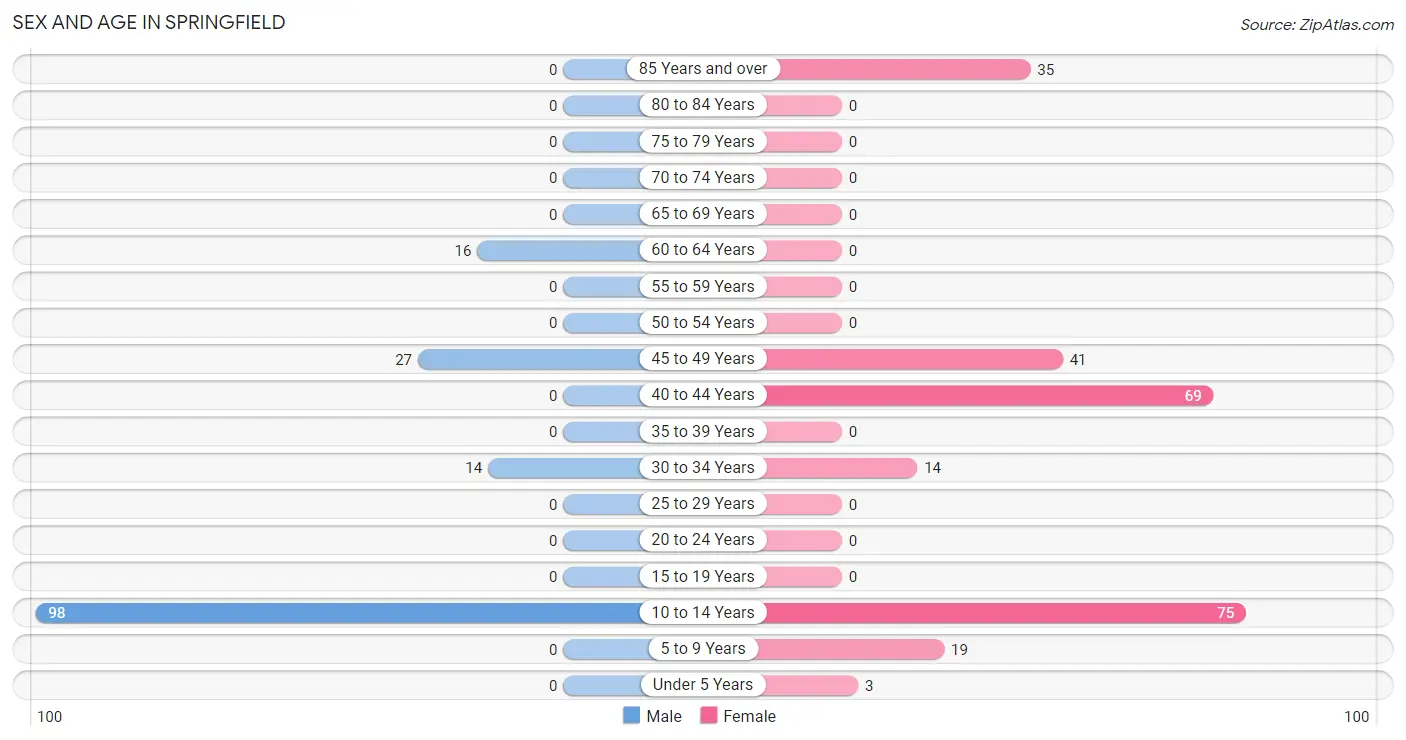
| Age Bracket | Male | Female |
| Under 5 Years | 0 (0.0%) | 3 (1.2%) |
| 5 to 9 Years | 0 (0.0%) | 19 (7.4%) |
| 10 to 14 Years | 98 (63.2%) | 75 (29.3%) |
| 15 to 19 Years | 0 (0.0%) | 0 (0.0%) |
| 20 to 24 Years | 0 (0.0%) | 0 (0.0%) |
| 25 to 29 Years | 0 (0.0%) | 0 (0.0%) |
| 30 to 34 Years | 14 (9.0%) | 14 (5.5%) |
| 35 to 39 Years | 0 (0.0%) | 0 (0.0%) |
| 40 to 44 Years | 0 (0.0%) | 69 (27.0%) |
| 45 to 49 Years | 27 (17.4%) | 41 (16.0%) |
| 50 to 54 Years | 0 (0.0%) | 0 (0.0%) |
| 55 to 59 Years | 0 (0.0%) | 0 (0.0%) |
| 60 to 64 Years | 16 (10.3%) | 0 (0.0%) |
| 65 to 69 Years | 0 (0.0%) | 0 (0.0%) |
| 70 to 74 Years | 0 (0.0%) | 0 (0.0%) |
| 75 to 79 Years | 0 (0.0%) | 0 (0.0%) |
| 80 to 84 Years | 0 (0.0%) | 0 (0.0%) |
| 85 Years and over | 0 (0.0%) | 35 (13.7%) |
| Total | 155 (100.0%) | 256 (100.0%) |
Families and Households in Springfield
Median Family Size in Springfield
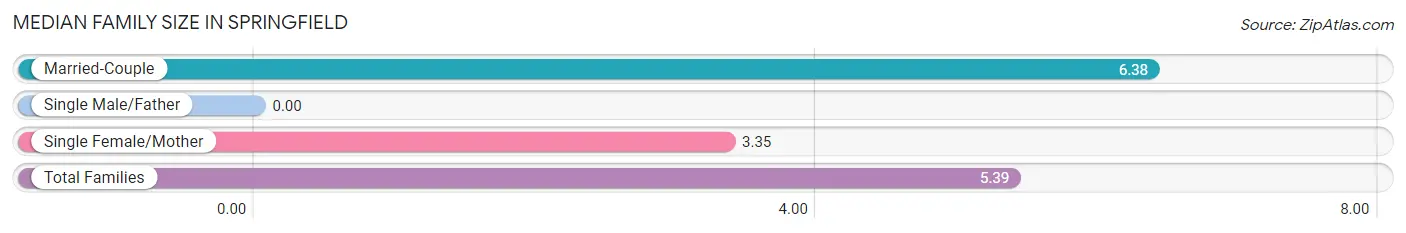
| Family Type | # Families | Family Size |
| Married-Couple | 48 (67.6%) | 6.38 |
| Single Male/Father | 0 (0.0%) | - |
| Single Female/Mother | 23 (32.4%) | 3.35 |
| Total Families | 71 (100.0%) | 5.39 |
Median Household Size in Springfield
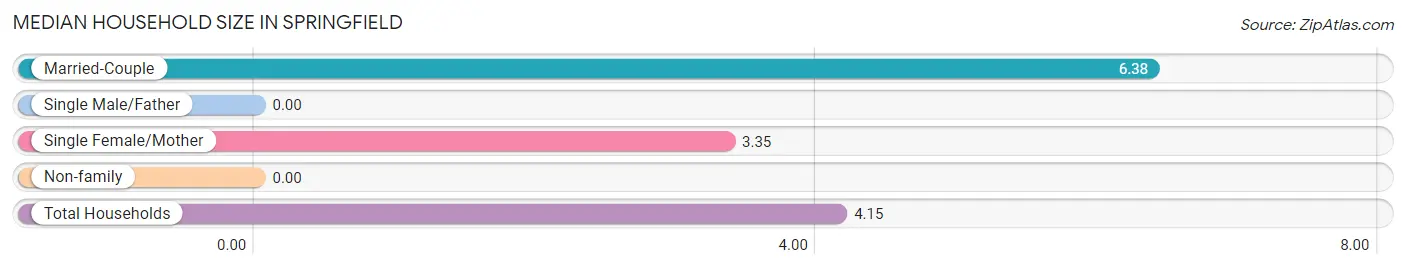
| Household Type | # Households | Household Size |
| Married-Couple | 48 (48.5%) | 6.38 |
| Single Male/Father | 0 (0.0%) | - |
| Single Female/Mother | 23 (23.2%) | 3.35 |
| Non-family | 28 (28.3%) | - |
| Total Households | 99 (100.0%) | 4.15 |
Household Size by Marriage Status in Springfield
Out of a total of 99 households in Springfield, 71 (71.7%) are family households, while 28 (28.3%) are nonfamily households. The most numerous type of family households are 4-person households, comprising 32, and the most common type of nonfamily households are 1-person households, comprising 28.
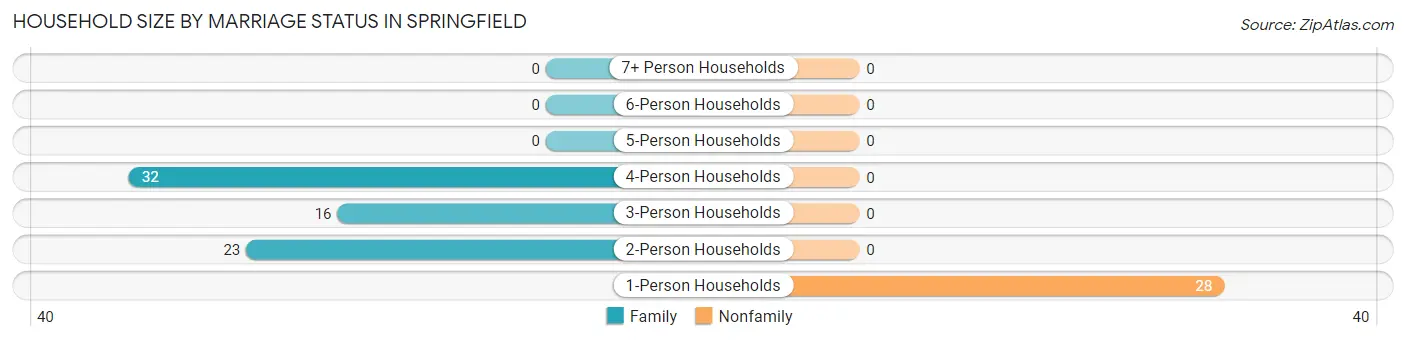
| Household Size | Family Households | Nonfamily Households |
| 1-Person Households | - | 28 (28.3%) |
| 2-Person Households | 23 (23.2%) | 0 (0.0%) |
| 3-Person Households | 16 (16.2%) | 0 (0.0%) |
| 4-Person Households | 32 (32.3%) | 0 (0.0%) |
| 5-Person Households | 0 (0.0%) | 0 (0.0%) |
| 6-Person Households | 0 (0.0%) | 0 (0.0%) |
| 7+ Person Households | 0 (0.0%) | 0 (0.0%) |
| Total | 71 (71.7%) | 28 (28.3%) |
Female Fertility in Springfield
Fertility by Age in Springfield
| Age Bracket | Women with Births | Births / 1,000 Women |
| 15 to 19 years | 0 (0.0%) | 0.0 |
| 20 to 34 years | 0 (0.0%) | 0.0 |
| 35 to 50 years | 0 (0.0%) | 0.0 |
| Total | 0 (0.0%) | 0.0 |
Fertility by Age by Marriage Status in Springfield
| Age Bracket | Married | Unmarried |
| 15 to 19 years | 0 (0.0%) | 0 (0.0%) |
| 20 to 34 years | 0 (0.0%) | 0 (0.0%) |
| 35 to 50 years | 0 (0.0%) | 0 (0.0%) |
| Total | 0 (0.0%) | 0 (0.0%) |
Fertility by Education in Springfield
| Educational Attainment | Women with Births | Births / 1,000 Women |
| Less than High School | 0 (0.0%) | 0.0 |
| High School Diploma | 0 (0.0%) | 0.0 |
| College or Associate's Degree | 0 (0.0%) | 0.0 |
| Bachelor's Degree | 0 (0.0%) | 0.0 |
| Graduate Degree | 0 (0.0%) | 0.0 |
| Total | 0 (0.0%) | 0.0 |
Fertility by Education by Marriage Status in Springfield
| Educational Attainment | Married | Unmarried |
| Less than High School | 0 (0.0%) | 0 (0.0%) |
| High School Diploma | 0 (0.0%) | 0 (0.0%) |
| College or Associate's Degree | 0 (0.0%) | 0 (0.0%) |
| Bachelor's Degree | 0 (0.0%) | 0 (0.0%) |
| Graduate Degree | 0 (0.0%) | 0 (0.0%) |
| Total | 0 (0.0%) | 0 (0.0%) |
Employment Characteristics in Springfield
Employment by Class of Employer in Springfield
Among the 92 employed individuals in Springfield, local government employees (55 | 59.8%), private company employees (22 | 23.9%), and state government employees (13 | 14.1%) make up the most common classes of employment.
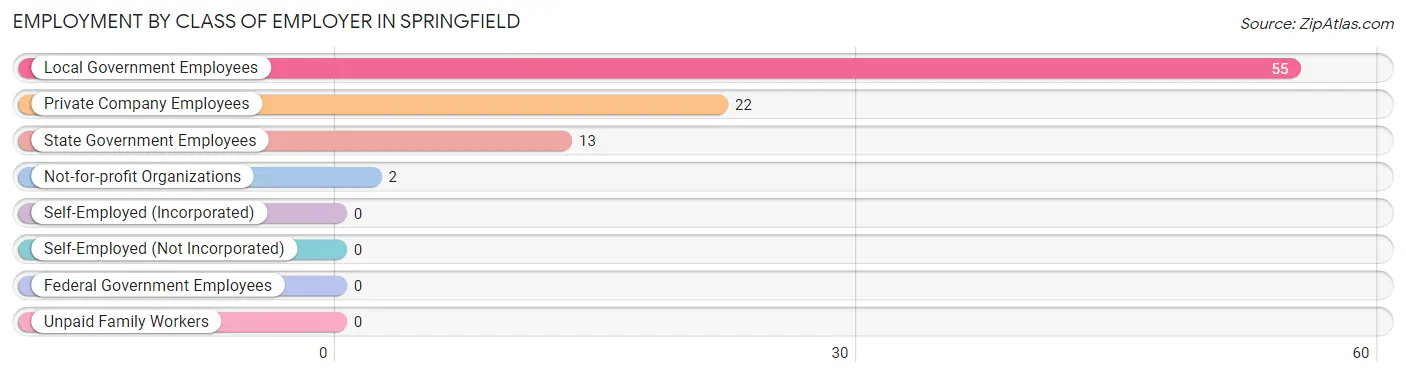
| Employer Class | # Employees | % Employees |
| Private Company Employees | 22 | 23.9% |
| Self-Employed (Incorporated) | 0 | 0.0% |
| Self-Employed (Not Incorporated) | 0 | 0.0% |
| Not-for-profit Organizations | 2 | 2.2% |
| Local Government Employees | 55 | 59.8% |
| State Government Employees | 13 | 14.1% |
| Federal Government Employees | 0 | 0.0% |
| Unpaid Family Workers | 0 | 0.0% |
| Total | 92 | 100.0% |
Employment Status by Age in Springfield
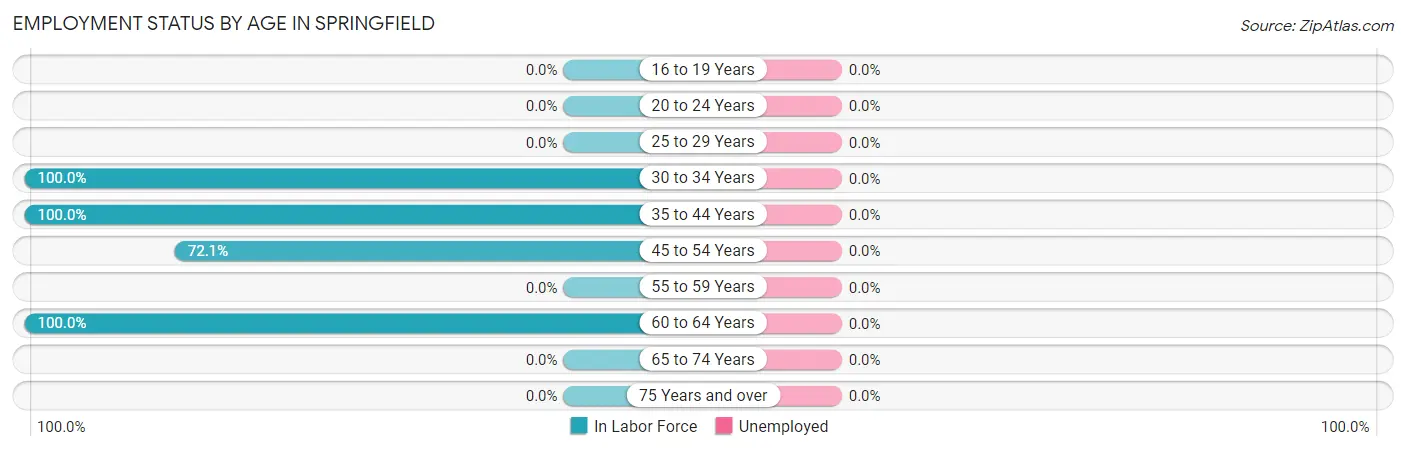
| Age Bracket | In Labor Force | Unemployed |
| 16 to 19 Years | 0 (0.0%) | 0 (0.0%) |
| 20 to 24 Years | 0 (0.0%) | 0 (0.0%) |
| 25 to 29 Years | 0 (0.0%) | 0 (0.0%) |
| 30 to 34 Years | 28 (100.0%) | 0 (0.0%) |
| 35 to 44 Years | 69 (100.0%) | 0 (0.0%) |
| 45 to 54 Years | 49 (72.1%) | 0 (0.0%) |
| 55 to 59 Years | 0 (0.0%) | 0 (0.0%) |
| 60 to 64 Years | 16 (100.0%) | 0 (0.0%) |
| 65 to 74 Years | 0 (0.0%) | 0 (0.0%) |
| 75 Years and over | 0 (0.0%) | 0 (0.0%) |
| Total | 162 (75.0%) | 0 (0.0%) |
Employment Status by Educational Attainment in Springfield
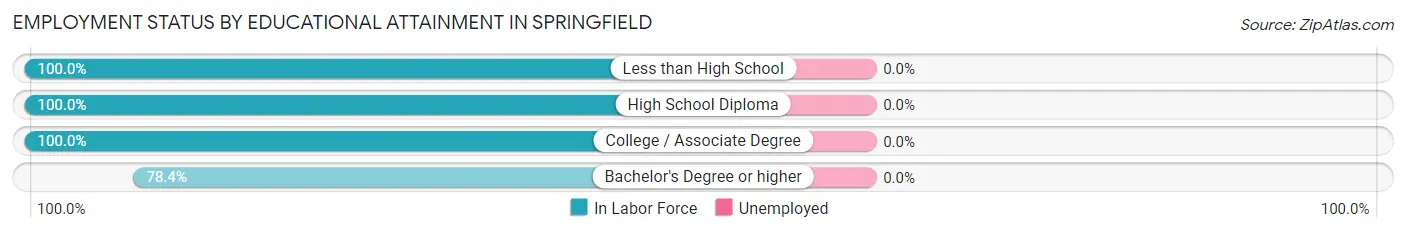
| Educational Attainment | In Labor Force | Unemployed |
| Less than High School | 16 (100.0%) | 0 (0.0%) |
| High School Diploma | 21 (100.0%) | 0 (0.0%) |
| College / Associate Degree | 56 (100.0%) | 0 (0.0%) |
| Bachelor's Degree or higher | 69 (78.4%) | 0 (0.0%) |
| Total | 162 (89.5%) | 0 (0.0%) |
Employment Occupations by Sex in Springfield
Management, Business, Science and Arts Occupations
The most common Management, Business, Science and Arts occupations in Springfield are Community & Social Service (55 | 34.0%), Education Instruction & Library (55 | 34.0%), Business & Financial (14 | 8.6%), Management (5 | 3.1%), and Health Diagnosing & Treating (2 | 1.2%).
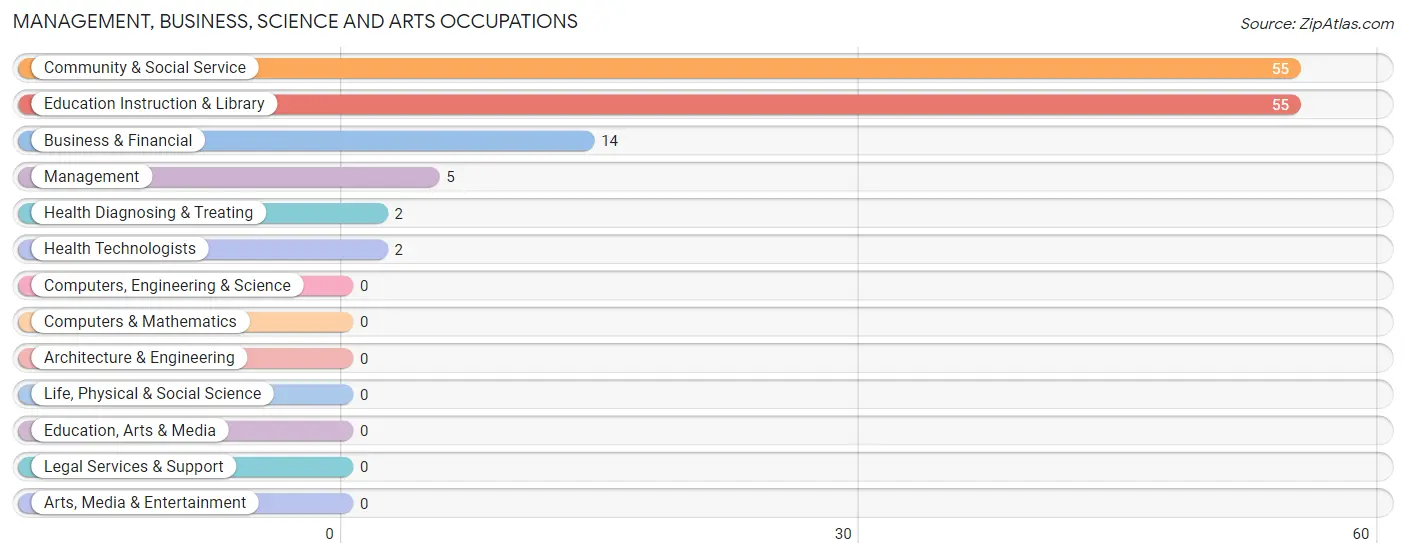
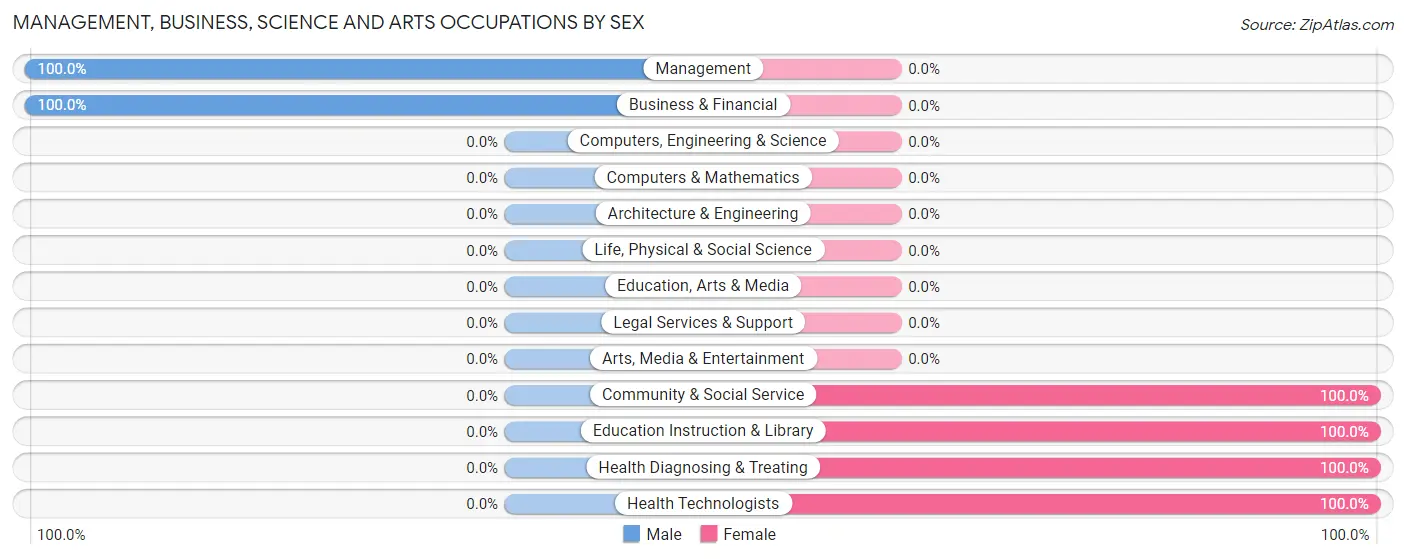
Management, Business, Science and Arts Occupations by Sex
Within the Management, Business, Science and Arts occupations in Springfield, the most male-oriented occupations are Management (100.0%), and Business & Financial (100.0%), while the most female-oriented occupations are Community & Social Service (100.0%), Education Instruction & Library (100.0%), and Health Diagnosing & Treating (100.0%).
| Occupation | Male | Female |
| Management | 5 (100.0%) | 0 (0.0%) |
| Business & Financial | 14 (100.0%) | 0 (0.0%) |
| Computers, Engineering & Science | 0 (0.0%) | 0 (0.0%) |
| Computers & Mathematics | 0 (0.0%) | 0 (0.0%) |
| Architecture & Engineering | 0 (0.0%) | 0 (0.0%) |
| Life, Physical & Social Science | 0 (0.0%) | 0 (0.0%) |
| Community & Social Service | 0 (0.0%) | 55 (100.0%) |
| Education, Arts & Media | 0 (0.0%) | 0 (0.0%) |
| Legal Services & Support | 0 (0.0%) | 0 (0.0%) |
| Education Instruction & Library | 0 (0.0%) | 55 (100.0%) |
| Arts, Media & Entertainment | 0 (0.0%) | 0 (0.0%) |
| Health Diagnosing & Treating | 0 (0.0%) | 2 (100.0%) |
| Health Technologists | 0 (0.0%) | 2 (100.0%) |
| Total (Category) | 19 (25.0%) | 57 (75.0%) |
| Total (Overall) | 38 (23.5%) | 124 (76.5%) |
Services Occupations
Services Occupations by Sex
| Occupation | Male | Female |
| Healthcare Support | 0 (0.0%) | 0 (0.0%) |
| Security & Protection | 0 (0.0%) | 0 (0.0%) |
| Firefighting & Prevention | 0 (0.0%) | 0 (0.0%) |
| Law Enforcement | 0 (0.0%) | 0 (0.0%) |
| Food Preparation & Serving | 0 (0.0%) | 0 (0.0%) |
| Cleaning & Maintenance | 0 (0.0%) | 0 (0.0%) |
| Personal Care & Service | 0 (0.0%) | 0 (0.0%) |
| Total (Category) | 0 (0.0%) | 0 (0.0%) |
| Total (Overall) | 38 (23.5%) | 124 (76.5%) |
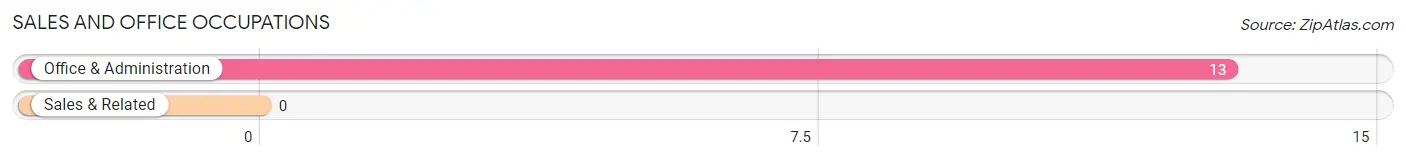
Sales and Office Occupations
The most common Sales and Office occupations in Springfield are , and Office & Administration (13 | 8.0%).
Sales and Office Occupations by Sex
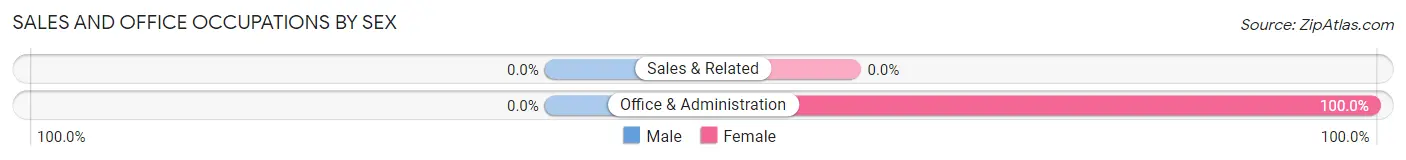
| Occupation | Male | Female |
| Sales & Related | 0 (0.0%) | 0 (0.0%) |
| Office & Administration | 0 (0.0%) | 13 (100.0%) |
| Total (Category) | 0 (0.0%) | 13 (100.0%) |
| Total (Overall) | 38 (23.5%) | 124 (76.5%) |
Natural Resources, Construction and Maintenance Occupations
The most common Natural Resources, Construction and Maintenance occupations in Springfield are , and Installation, Maintenance & Repair (16 | 9.9%).
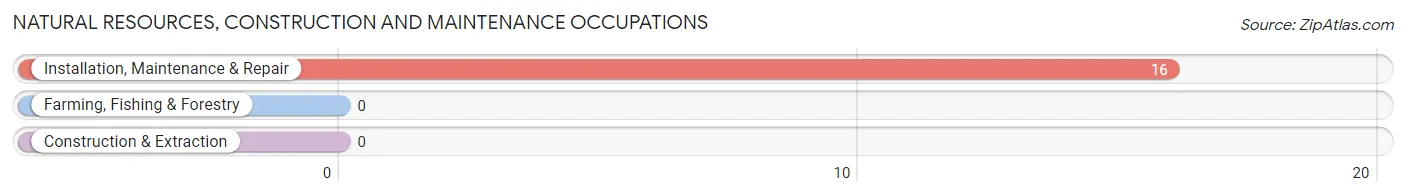
Natural Resources, Construction and Maintenance Occupations by Sex
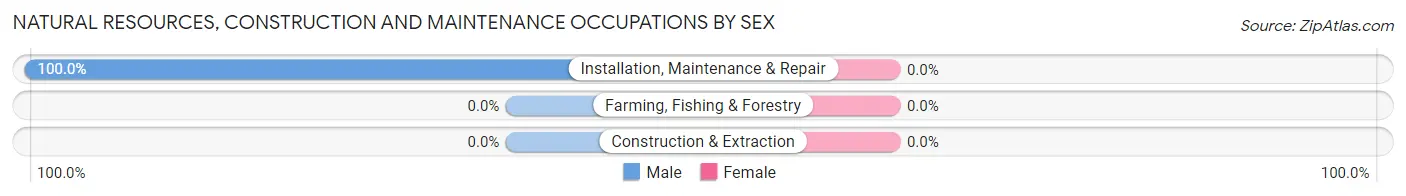
| Occupation | Male | Female |
| Farming, Fishing & Forestry | 0 (0.0%) | 0 (0.0%) |
| Construction & Extraction | 0 (0.0%) | 0 (0.0%) |
| Installation, Maintenance & Repair | 16 (100.0%) | 0 (0.0%) |
| Total (Category) | 16 (100.0%) | 0 (0.0%) |
| Total (Overall) | 38 (23.5%) | 124 (76.5%) |
Production, Transportation and Moving Occupations
The most common Production, Transportation and Moving occupations in Springfield are Material Moving (54 | 33.3%), and Production (3 | 1.8%).
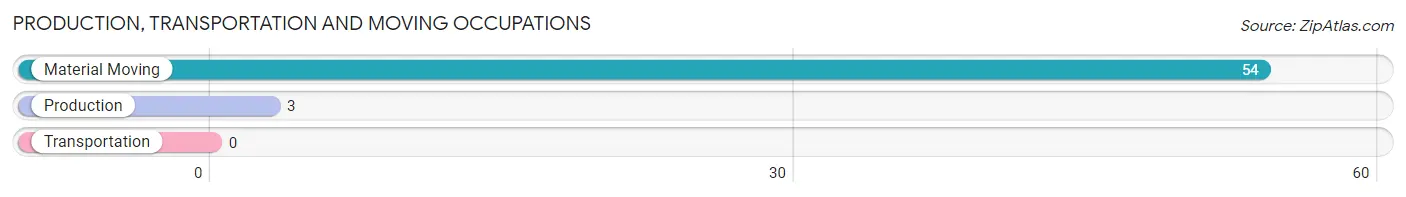
Production, Transportation and Moving Occupations by Sex
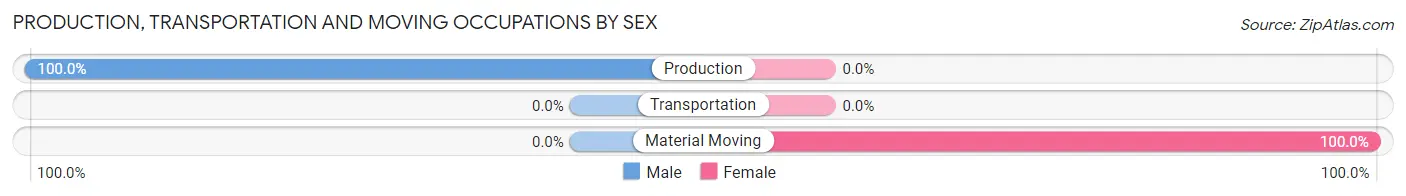
| Occupation | Male | Female |
| Production | 3 (100.0%) | 0 (0.0%) |
| Transportation | 0 (0.0%) | 0 (0.0%) |
| Material Moving | 0 (0.0%) | 54 (100.0%) |
| Total (Category) | 3 (5.3%) | 54 (94.7%) |
| Total (Overall) | 38 (23.5%) | 124 (76.5%) |
Employment Industries by Sex in Springfield
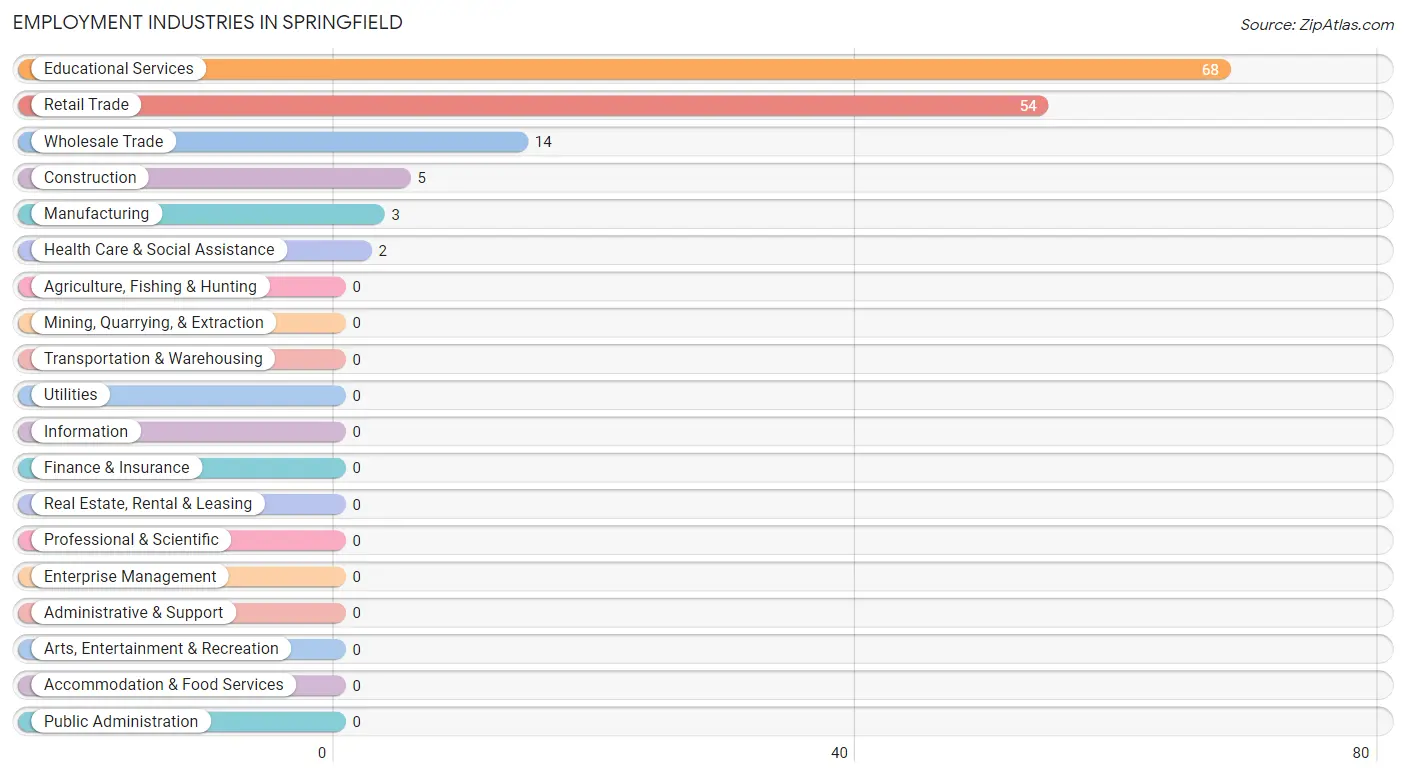
Employment Industries in Springfield
The major employment industries in Springfield include Educational Services (68 | 42.0%), Retail Trade (54 | 33.3%), Wholesale Trade (14 | 8.6%), Construction (5 | 3.1%), and Manufacturing (3 | 1.8%).
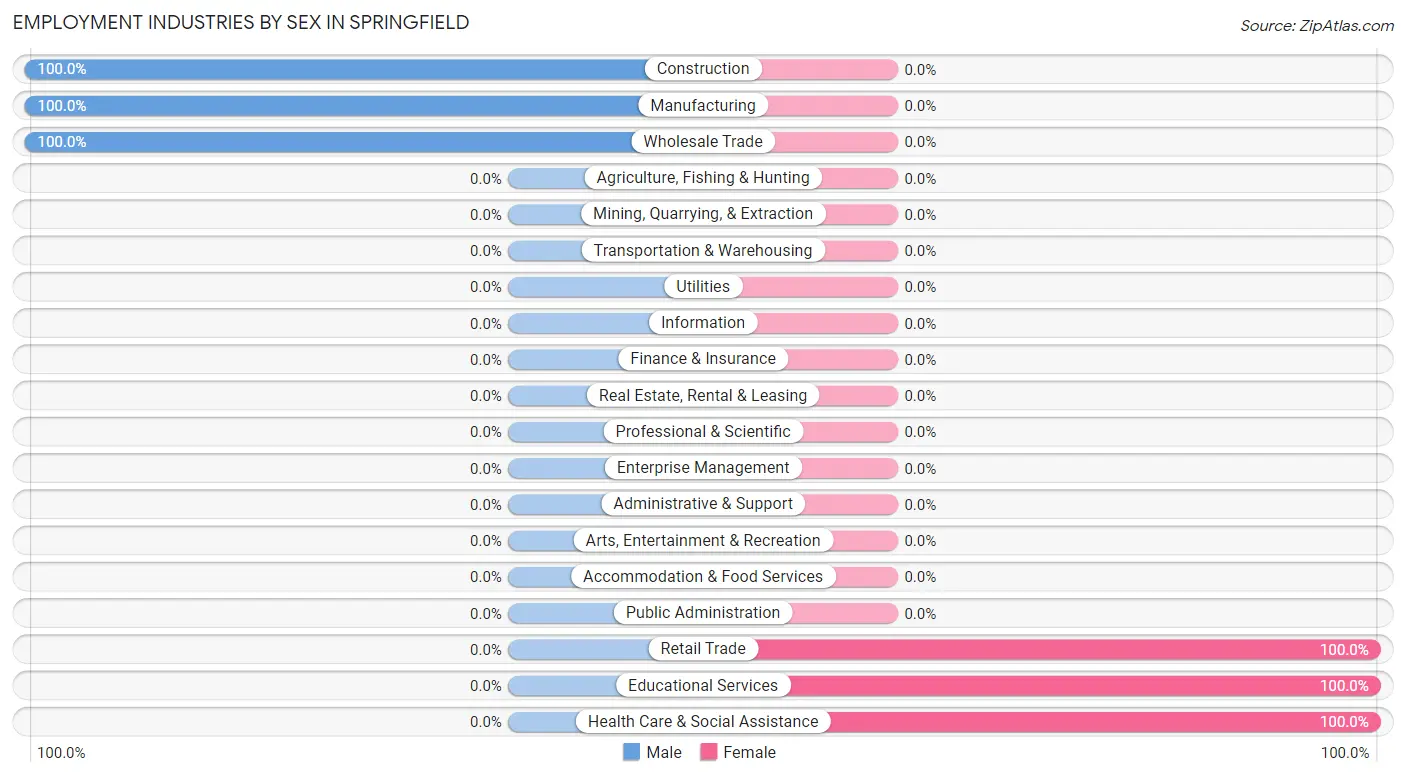
Employment Industries by Sex in Springfield
The Springfield industries that see more men than women are Construction (100.0%), Manufacturing (100.0%), and Wholesale Trade (100.0%), whereas the industries that tend to have a higher number of women are Retail Trade (100.0%), Educational Services (100.0%), and Health Care & Social Assistance (100.0%).
| Industry | Male | Female |
| Agriculture, Fishing & Hunting | 0 (0.0%) | 0 (0.0%) |
| Mining, Quarrying, & Extraction | 0 (0.0%) | 0 (0.0%) |
| Construction | 5 (100.0%) | 0 (0.0%) |
| Manufacturing | 3 (100.0%) | 0 (0.0%) |
| Wholesale Trade | 14 (100.0%) | 0 (0.0%) |
| Retail Trade | 0 (0.0%) | 54 (100.0%) |
| Transportation & Warehousing | 0 (0.0%) | 0 (0.0%) |
| Utilities | 0 (0.0%) | 0 (0.0%) |
| Information | 0 (0.0%) | 0 (0.0%) |
| Finance & Insurance | 0 (0.0%) | 0 (0.0%) |
| Real Estate, Rental & Leasing | 0 (0.0%) | 0 (0.0%) |
| Professional & Scientific | 0 (0.0%) | 0 (0.0%) |
| Enterprise Management | 0 (0.0%) | 0 (0.0%) |
| Administrative & Support | 0 (0.0%) | 0 (0.0%) |
| Educational Services | 0 (0.0%) | 68 (100.0%) |
| Health Care & Social Assistance | 0 (0.0%) | 2 (100.0%) |
| Arts, Entertainment & Recreation | 0 (0.0%) | 0 (0.0%) |
| Accommodation & Food Services | 0 (0.0%) | 0 (0.0%) |
| Public Administration | 0 (0.0%) | 0 (0.0%) |
| Total | 38 (23.5%) | 124 (76.5%) |
Education in Springfield
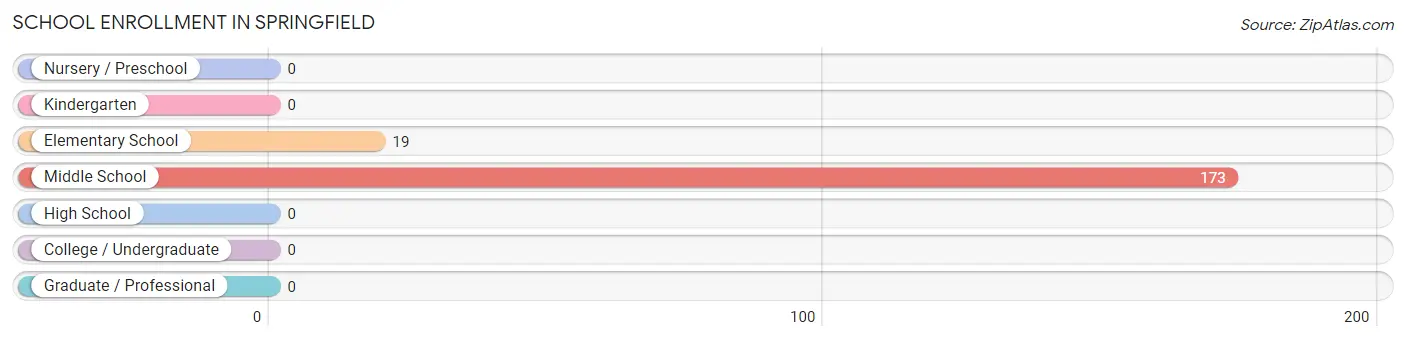
School Enrollment in Springfield
The most common levels of schooling among the 192 students in Springfield are middle school (173 | 90.1%), and elementary school (19 | 9.9%).
| School Level | # Students | % Students |
| Nursery / Preschool | 0 | 0.0% |
| Kindergarten | 0 | 0.0% |
| Elementary School | 19 | 9.9% |
| Middle School | 173 | 90.1% |
| High School | 0 | 0.0% |
| College / Undergraduate | 0 | 0.0% |
| Graduate / Professional | 0 | 0.0% |
| Total | 192 | 100.0% |
School Enrollment by Age by Funding Source in Springfield
Out of a total of 192 students who are enrolled in schools in Springfield, 133 (69.3%) attend a private institution, while the remaining 59 (30.7%) are enrolled in public schools. The age group of 10 to 14 year olds has the highest likelihood of being enrolled in private schools, with 133 (76.9% in the age bracket) enrolled. Conversely, the age group of 5 to 9 year old has the lowest likelihood of being enrolled in a private school, with 19 (100.0% in the age bracket) attending a public institution.
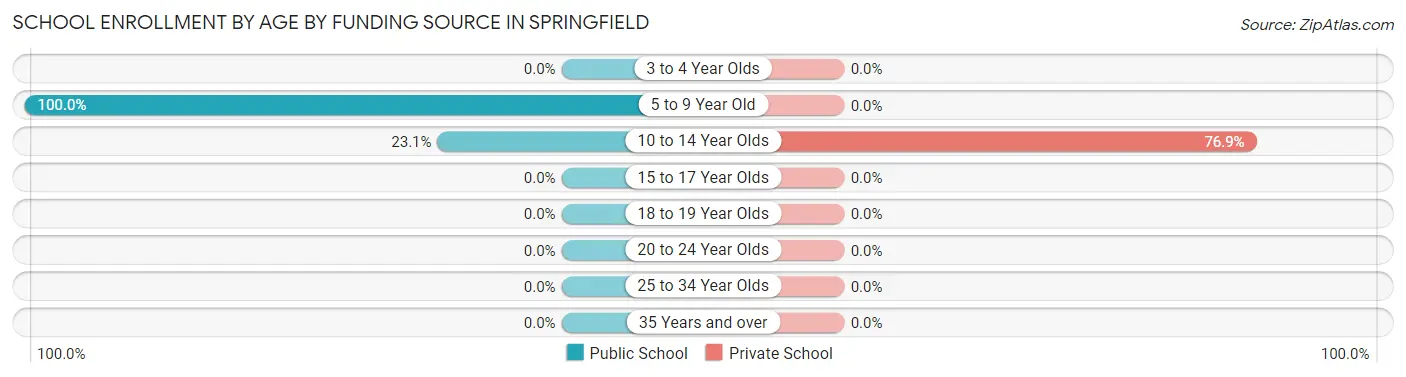
| Age Bracket | Public School | Private School |
| 3 to 4 Year Olds | 0 (0.0%) | 0 (0.0%) |
| 5 to 9 Year Old | 19 (100.0%) | 0 (0.0%) |
| 10 to 14 Year Olds | 40 (23.1%) | 133 (76.9%) |
| 15 to 17 Year Olds | 0 (0.0%) | 0 (0.0%) |
| 18 to 19 Year Olds | 0 (0.0%) | 0 (0.0%) |
| 20 to 24 Year Olds | 0 (0.0%) | 0 (0.0%) |
| 25 to 34 Year Olds | 0 (0.0%) | 0 (0.0%) |
| 35 Years and over | 0 (0.0%) | 0 (0.0%) |
| Total | 59 (30.7%) | 133 (69.3%) |
Educational Attainment by Field of Study in Springfield
Education (55 | 62.5%), engineering (19 | 21.6%), and business (14 | 15.9%) are the most common fields of study among 88 individuals in Springfield who have obtained a bachelor's degree or higher.
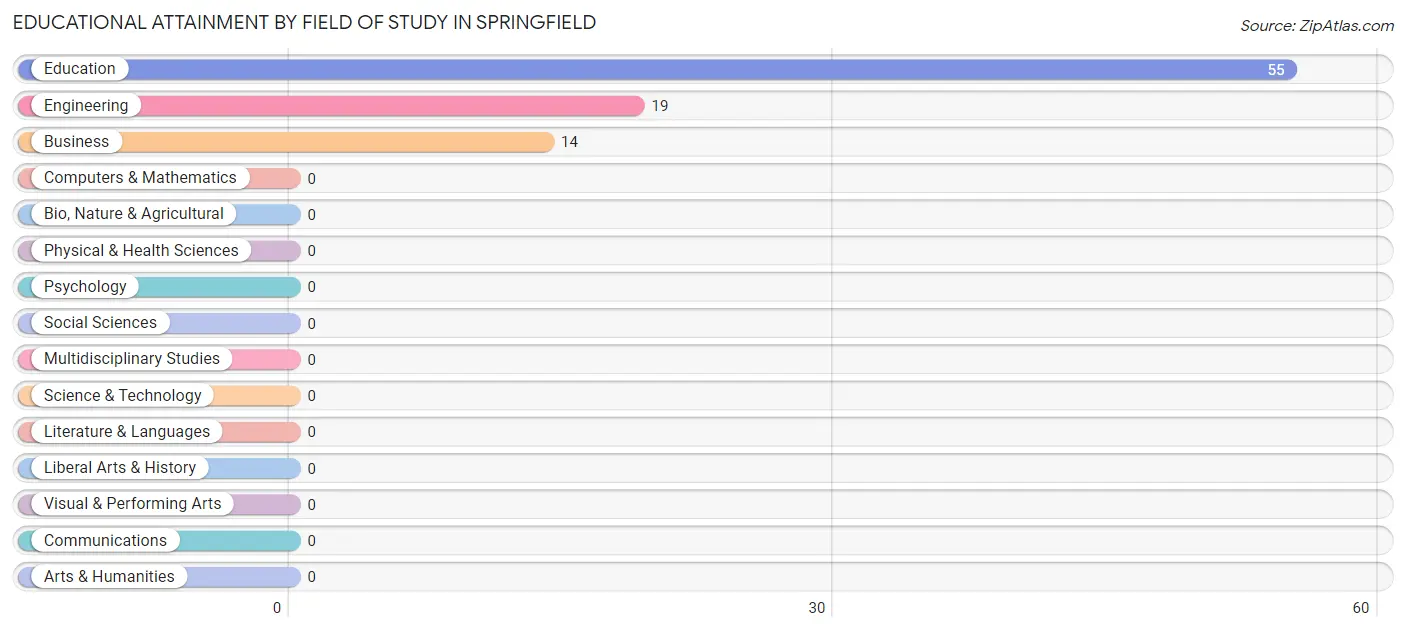
| Field of Study | # Graduates | % Graduates |
| Computers & Mathematics | 0 | 0.0% |
| Bio, Nature & Agricultural | 0 | 0.0% |
| Physical & Health Sciences | 0 | 0.0% |
| Psychology | 0 | 0.0% |
| Social Sciences | 0 | 0.0% |
| Engineering | 19 | 21.6% |
| Multidisciplinary Studies | 0 | 0.0% |
| Science & Technology | 0 | 0.0% |
| Business | 14 | 15.9% |
| Education | 55 | 62.5% |
| Literature & Languages | 0 | 0.0% |
| Liberal Arts & History | 0 | 0.0% |
| Visual & Performing Arts | 0 | 0.0% |
| Communications | 0 | 0.0% |
| Arts & Humanities | 0 | 0.0% |
| Total | 88 | 100.0% |
Transportation & Commute in Springfield
Vehicle Availability by Sex in Springfield
The most prevalent vehicle ownership categories in Springfield are males with 2 vehicles (19, accounting for 86.4%) and females with 2 vehicles (27, making up 27.1%).
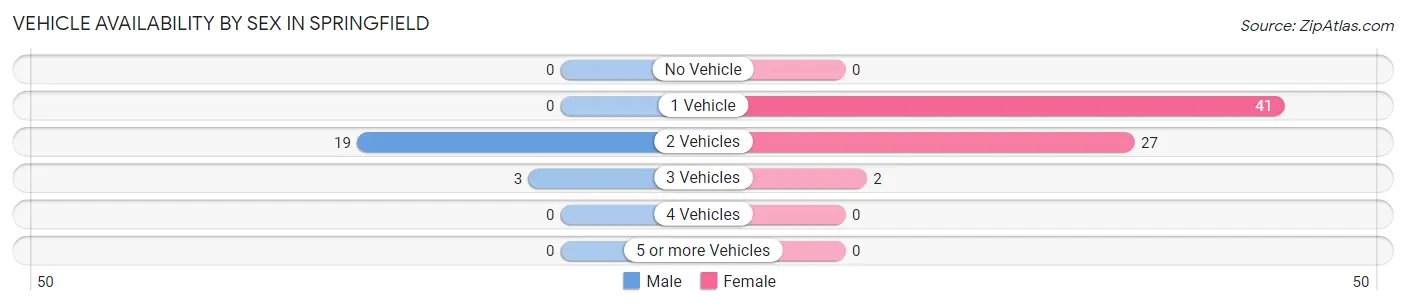
| Vehicles Available | Male | Female |
| No Vehicle | 0 (0.0%) | 0 (0.0%) |
| 1 Vehicle | 0 (0.0%) | 41 (58.6%) |
| 2 Vehicles | 19 (86.4%) | 27 (38.6%) |
| 3 Vehicles | 3 (13.6%) | 2 (2.9%) |
| 4 Vehicles | 0 (0.0%) | 0 (0.0%) |
| 5 or more Vehicles | 0 (0.0%) | 0 (0.0%) |
| Total | 22 (100.0%) | 70 (100.0%) |
Commute Time in Springfield
The most frequently occuring commute durations in Springfield are 30 to 34 minutes (41 commuters, 44.6%), less than 5 minutes (14 commuters, 15.2%), and 20 to 24 minutes (14 commuters, 15.2%).
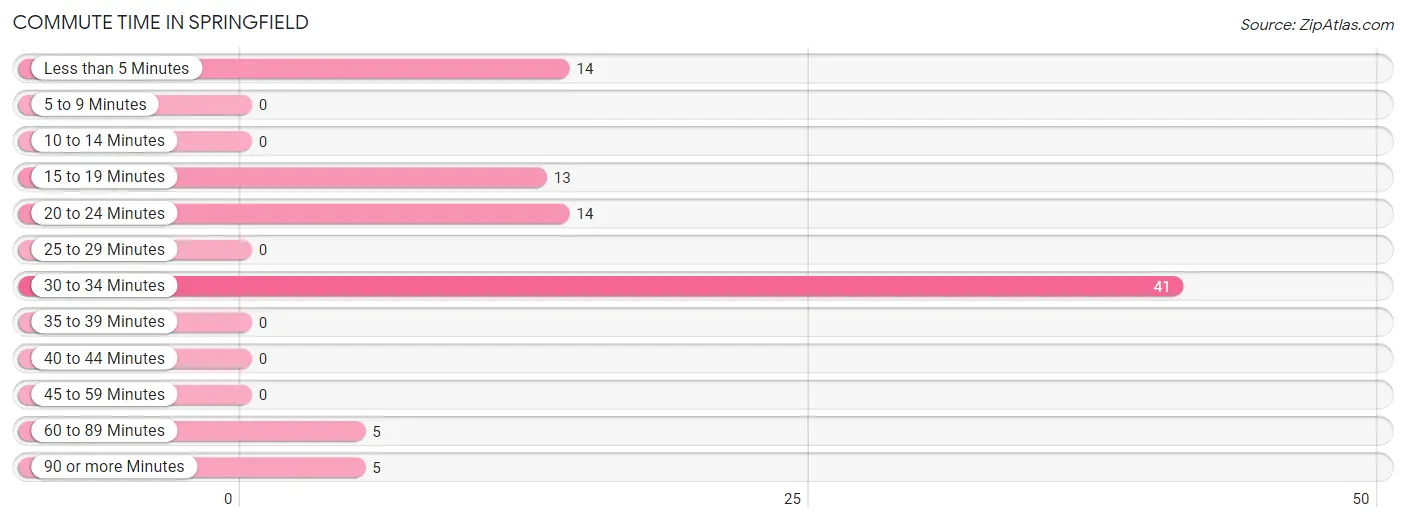
| Commute Time | # Commuters | % Commuters |
| Less than 5 Minutes | 14 | 15.2% |
| 5 to 9 Minutes | 0 | 0.0% |
| 10 to 14 Minutes | 0 | 0.0% |
| 15 to 19 Minutes | 13 | 14.1% |
| 20 to 24 Minutes | 14 | 15.2% |
| 25 to 29 Minutes | 0 | 0.0% |
| 30 to 34 Minutes | 41 | 44.6% |
| 35 to 39 Minutes | 0 | 0.0% |
| 40 to 44 Minutes | 0 | 0.0% |
| 45 to 59 Minutes | 0 | 0.0% |
| 60 to 89 Minutes | 5 | 5.4% |
| 90 or more Minutes | 5 | 5.4% |
Commute Time by Sex in Springfield
The most common commute times in Springfield are 20 to 24 minutes (14 commuters, 63.6%) for males and 30 to 34 minutes (41 commuters, 58.6%) for females.
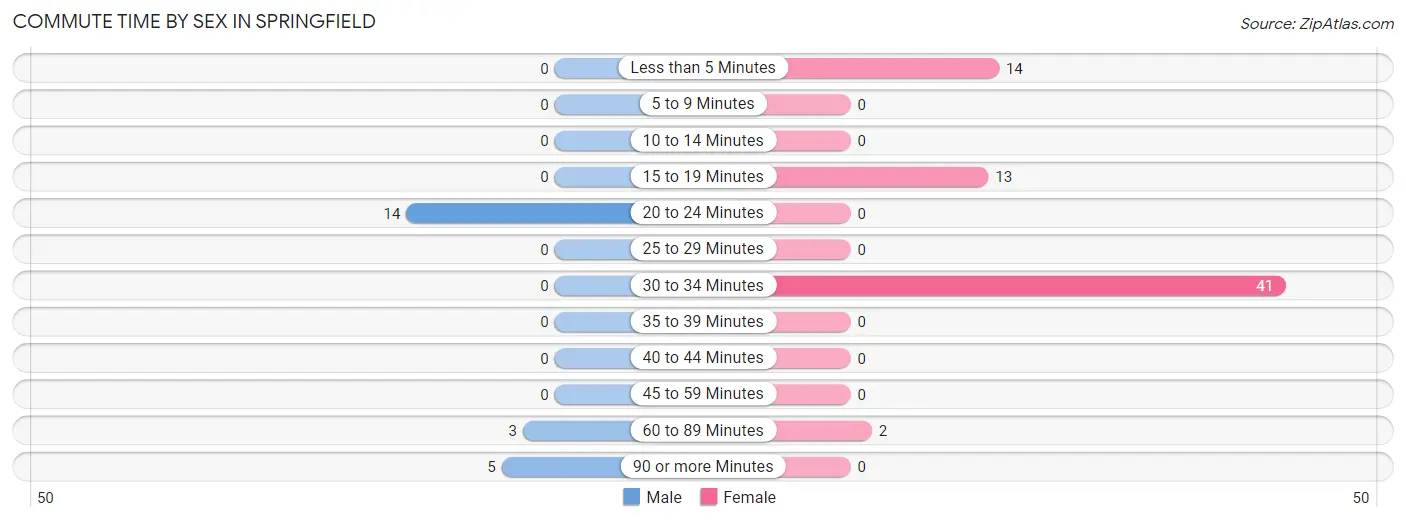
| Commute Time | Male | Female |
| Less than 5 Minutes | 0 (0.0%) | 14 (20.0%) |
| 5 to 9 Minutes | 0 (0.0%) | 0 (0.0%) |
| 10 to 14 Minutes | 0 (0.0%) | 0 (0.0%) |
| 15 to 19 Minutes | 0 (0.0%) | 13 (18.6%) |
| 20 to 24 Minutes | 14 (63.6%) | 0 (0.0%) |
| 25 to 29 Minutes | 0 (0.0%) | 0 (0.0%) |
| 30 to 34 Minutes | 0 (0.0%) | 41 (58.6%) |
| 35 to 39 Minutes | 0 (0.0%) | 0 (0.0%) |
| 40 to 44 Minutes | 0 (0.0%) | 0 (0.0%) |
| 45 to 59 Minutes | 0 (0.0%) | 0 (0.0%) |
| 60 to 89 Minutes | 3 (13.6%) | 2 (2.9%) |
| 90 or more Minutes | 5 (22.7%) | 0 (0.0%) |
Time of Departure to Work by Sex in Springfield
The most frequent times of departure to work in Springfield are 7:00 AM to 7:29 AM (14, 63.6%) for males and 4:00 PM to 11:59 PM (41, 58.6%) for females.
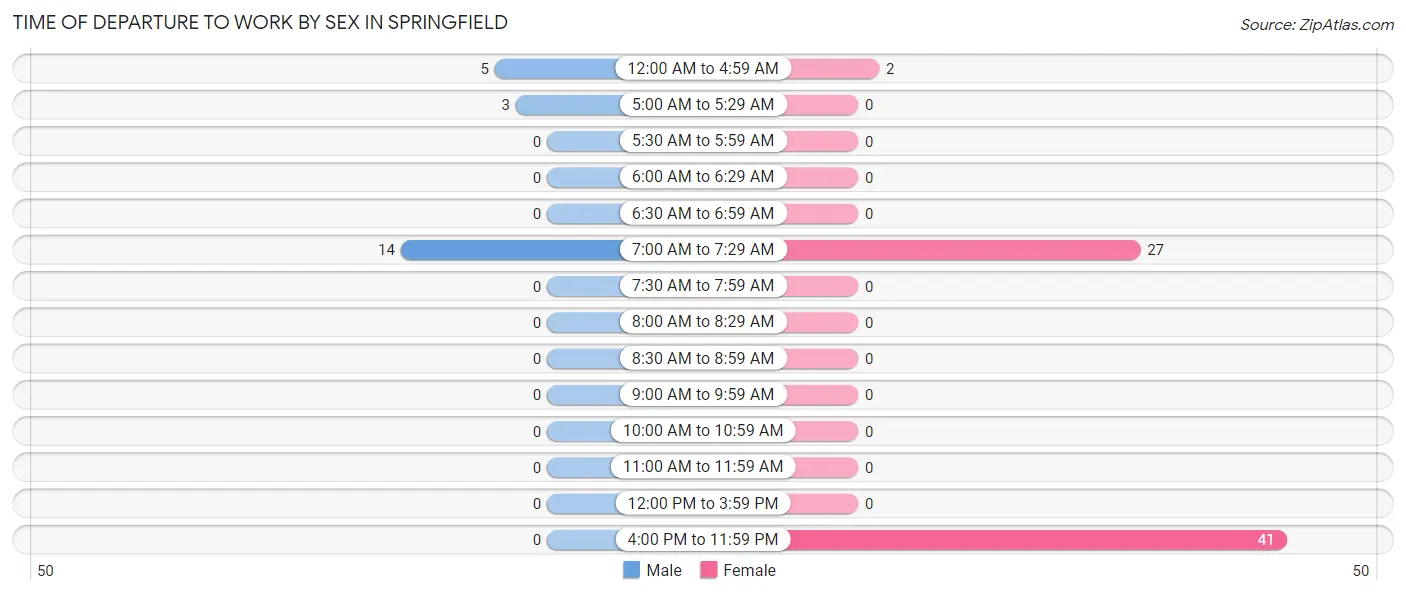
| Time of Departure | Male | Female |
| 12:00 AM to 4:59 AM | 5 (22.7%) | 2 (2.9%) |
| 5:00 AM to 5:29 AM | 3 (13.6%) | 0 (0.0%) |
| 5:30 AM to 5:59 AM | 0 (0.0%) | 0 (0.0%) |
| 6:00 AM to 6:29 AM | 0 (0.0%) | 0 (0.0%) |
| 6:30 AM to 6:59 AM | 0 (0.0%) | 0 (0.0%) |
| 7:00 AM to 7:29 AM | 14 (63.6%) | 27 (38.6%) |
| 7:30 AM to 7:59 AM | 0 (0.0%) | 0 (0.0%) |
| 8:00 AM to 8:29 AM | 0 (0.0%) | 0 (0.0%) |
| 8:30 AM to 8:59 AM | 0 (0.0%) | 0 (0.0%) |
| 9:00 AM to 9:59 AM | 0 (0.0%) | 0 (0.0%) |
| 10:00 AM to 10:59 AM | 0 (0.0%) | 0 (0.0%) |
| 11:00 AM to 11:59 AM | 0 (0.0%) | 0 (0.0%) |
| 12:00 PM to 3:59 PM | 0 (0.0%) | 0 (0.0%) |
| 4:00 PM to 11:59 PM | 0 (0.0%) | 41 (58.6%) |
| Total | 22 (100.0%) | 70 (100.0%) |
Housing Occupancy in Springfield
Occupancy by Ownership in Springfield
Of the total 99 dwellings in Springfield, owner-occupied units account for 80 (80.8%), while renter-occupied units make up 19 (19.2%).
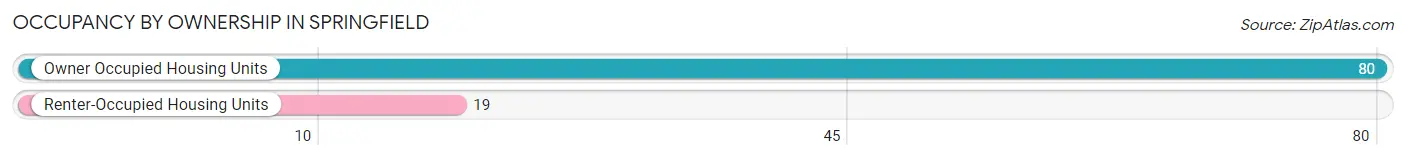
| Occupancy | # Housing Units | % Housing Units |
| Owner Occupied Housing Units | 80 | 80.8% |
| Renter-Occupied Housing Units | 19 | 19.2% |
| Total Occupied Housing Units | 99 | 100.0% |
Occupancy by Household Size in Springfield
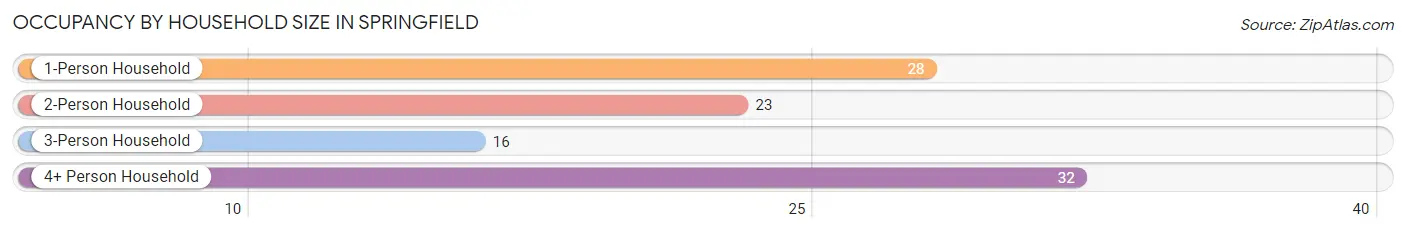
| Household Size | # Housing Units | % Housing Units |
| 1-Person Household | 28 | 28.3% |
| 2-Person Household | 23 | 23.2% |
| 3-Person Household | 16 | 16.2% |
| 4+ Person Household | 32 | 32.3% |
| Total Housing Units | 99 | 100.0% |
Occupancy by Ownership by Household Size in Springfield
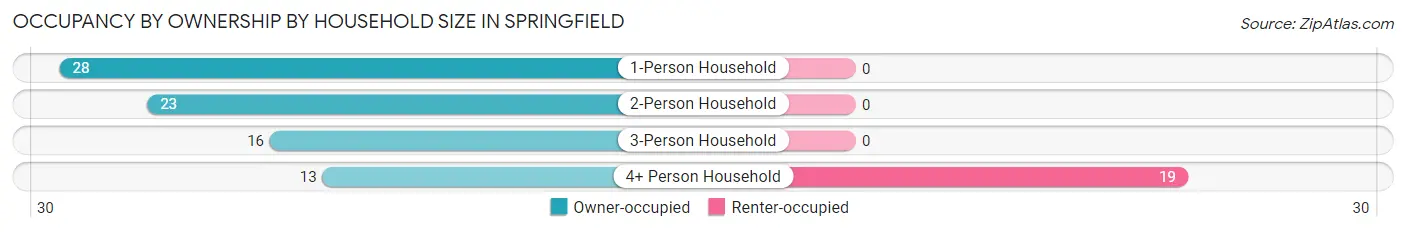
| Household Size | Owner-occupied | Renter-occupied |
| 1-Person Household | 28 (100.0%) | 0 (0.0%) |
| 2-Person Household | 23 (100.0%) | 0 (0.0%) |
| 3-Person Household | 16 (100.0%) | 0 (0.0%) |
| 4+ Person Household | 13 (40.6%) | 19 (59.4%) |
| Total Housing Units | 80 (80.8%) | 19 (19.2%) |
Occupancy by Educational Attainment in Springfield
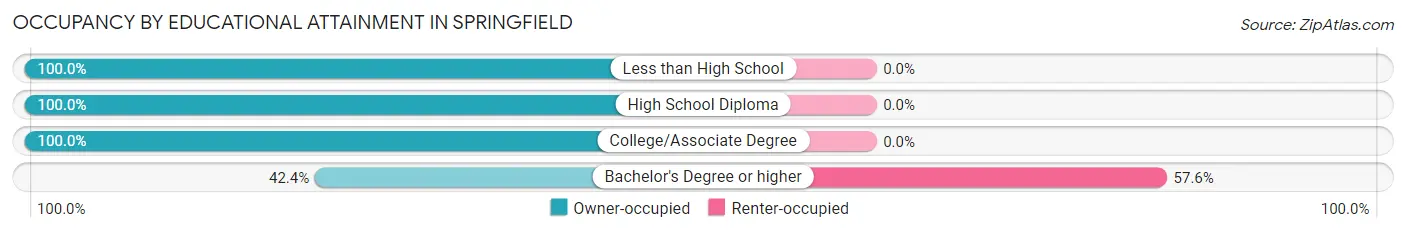
| Household Size | Owner-occupied | Renter-occupied |
| Less than High School | 16 (100.0%) | 0 (0.0%) |
| High School Diploma | 48 (100.0%) | 0 (0.0%) |
| College/Associate Degree | 2 (100.0%) | 0 (0.0%) |
| Bachelor's Degree or higher | 14 (42.4%) | 19 (57.6%) |
Occupancy by Age of Householder in Springfield
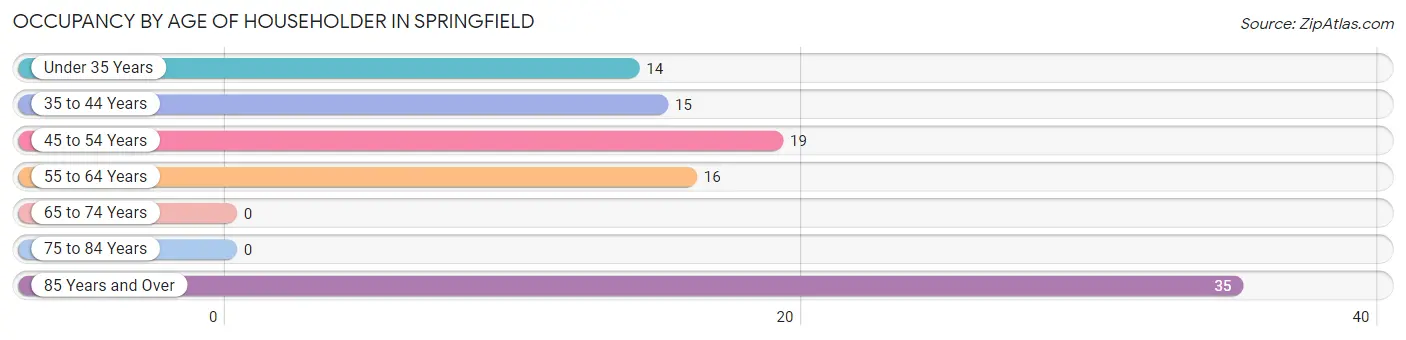
| Age Bracket | # Households | % Households |
| Under 35 Years | 14 | 14.1% |
| 35 to 44 Years | 15 | 15.1% |
| 45 to 54 Years | 19 | 19.2% |
| 55 to 64 Years | 16 | 16.2% |
| 65 to 74 Years | 0 | 0.0% |
| 75 to 84 Years | 0 | 0.0% |
| 85 Years and Over | 35 | 35.3% |
| Total | 99 | 100.0% |
Housing Finances in Springfield
Median Income by Occupancy in Springfield
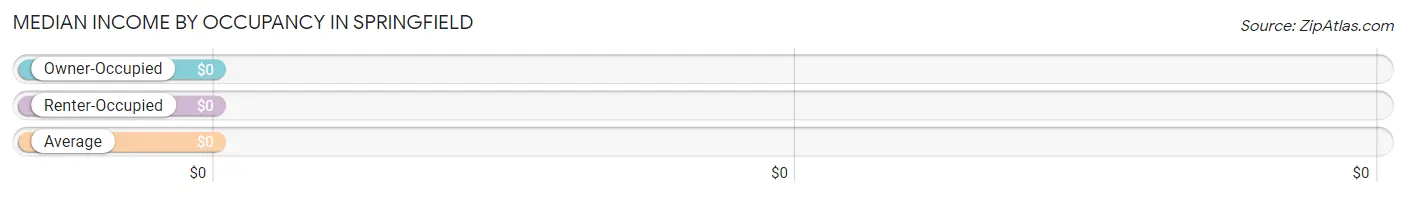
| Occupancy Type | # Households | Median Income |
| Owner-Occupied | 80 (80.8%) | $0 |
| Renter-Occupied | 19 (19.2%) | $0 |
| Average | 99 (100.0%) | $0 |
Occupancy by Householder Income Bracket in Springfield
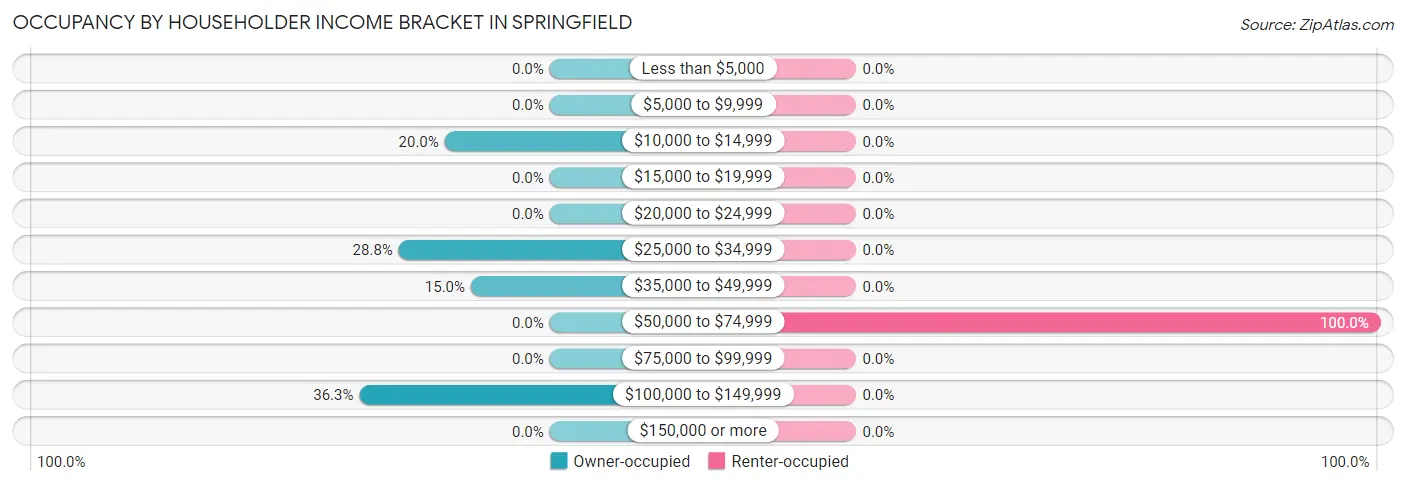
| Income Bracket | Owner-occupied | Renter-occupied |
| Less than $5,000 | 0 (0.0%) | 0 (0.0%) |
| $5,000 to $9,999 | 0 (0.0%) | 0 (0.0%) |
| $10,000 to $14,999 | 16 (20.0%) | 0 (0.0%) |
| $15,000 to $19,999 | 0 (0.0%) | 0 (0.0%) |
| $20,000 to $24,999 | 0 (0.0%) | 0 (0.0%) |
| $25,000 to $34,999 | 23 (28.7%) | 0 (0.0%) |
| $35,000 to $49,999 | 12 (15.0%) | 0 (0.0%) |
| $50,000 to $74,999 | 0 (0.0%) | 19 (100.0%) |
| $75,000 to $99,999 | 0 (0.0%) | 0 (0.0%) |
| $100,000 to $149,999 | 29 (36.2%) | 0 (0.0%) |
| $150,000 or more | 0 (0.0%) | 0 (0.0%) |
| Total | 80 (100.0%) | 19 (100.0%) |
Monthly Housing Cost Tiers in Springfield
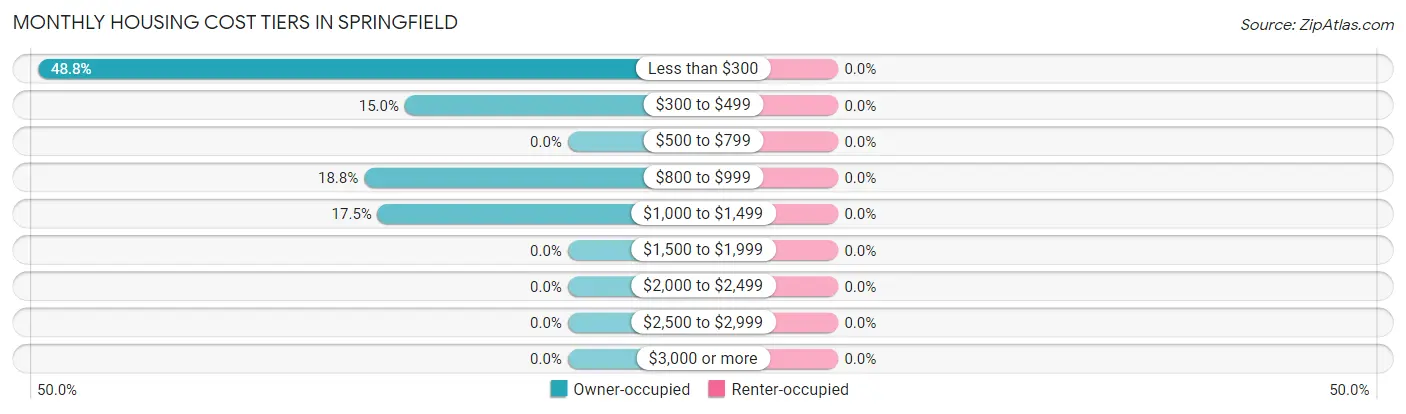
| Monthly Cost | Owner-occupied | Renter-occupied |
| Less than $300 | 39 (48.7%) | 0 (0.0%) |
| $300 to $499 | 12 (15.0%) | 0 (0.0%) |
| $500 to $799 | 0 (0.0%) | 0 (0.0%) |
| $800 to $999 | 15 (18.8%) | 0 (0.0%) |
| $1,000 to $1,499 | 14 (17.5%) | 0 (0.0%) |
| $1,500 to $1,999 | 0 (0.0%) | 0 (0.0%) |
| $2,000 to $2,499 | 0 (0.0%) | 0 (0.0%) |
| $2,500 to $2,999 | 0 (0.0%) | 0 (0.0%) |
| $3,000 or more | 0 (0.0%) | 0 (0.0%) |
| Total | 80 (100.0%) | 19 (100.0%) |
Physical Housing Characteristics in Springfield
Housing Structures in Springfield
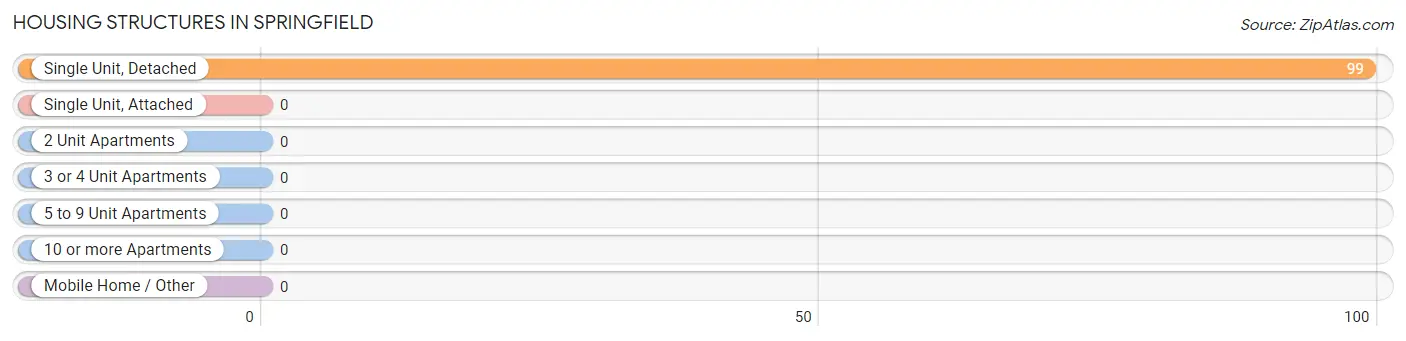
| Structure Type | # Housing Units | % Housing Units |
| Single Unit, Detached | 99 | 100.0% |
| Single Unit, Attached | 0 | 0.0% |
| 2 Unit Apartments | 0 | 0.0% |
| 3 or 4 Unit Apartments | 0 | 0.0% |
| 5 to 9 Unit Apartments | 0 | 0.0% |
| 10 or more Apartments | 0 | 0.0% |
| Mobile Home / Other | 0 | 0.0% |
| Total | 99 | 100.0% |
Housing Structures by Occupancy in Springfield
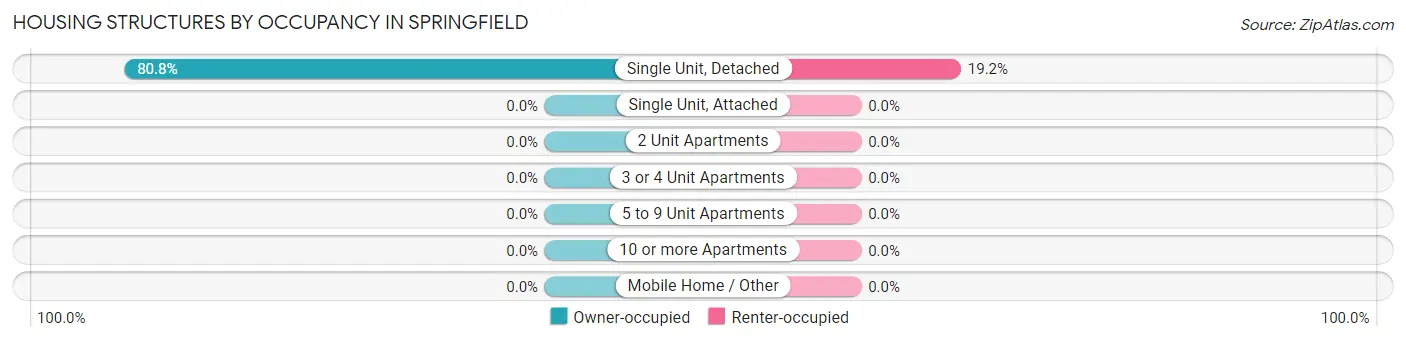
| Structure Type | Owner-occupied | Renter-occupied |
| Single Unit, Detached | 80 (80.8%) | 19 (19.2%) |
| Single Unit, Attached | 0 (0.0%) | 0 (0.0%) |
| 2 Unit Apartments | 0 (0.0%) | 0 (0.0%) |
| 3 or 4 Unit Apartments | 0 (0.0%) | 0 (0.0%) |
| 5 to 9 Unit Apartments | 0 (0.0%) | 0 (0.0%) |
| 10 or more Apartments | 0 (0.0%) | 0 (0.0%) |
| Mobile Home / Other | 0 (0.0%) | 0 (0.0%) |
| Total | 80 (80.8%) | 19 (19.2%) |
Housing Structures by Number of Rooms in Springfield
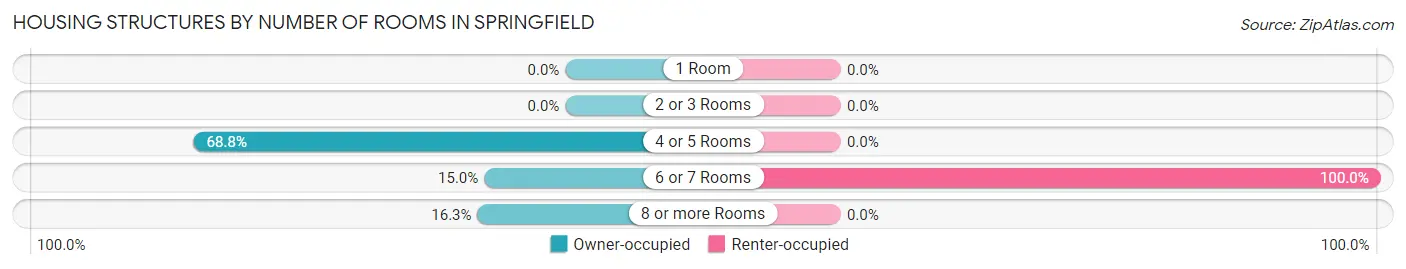
| Number of Rooms | Owner-occupied | Renter-occupied |
| 1 Room | 0 (0.0%) | 0 (0.0%) |
| 2 or 3 Rooms | 0 (0.0%) | 0 (0.0%) |
| 4 or 5 Rooms | 55 (68.8%) | 0 (0.0%) |
| 6 or 7 Rooms | 12 (15.0%) | 19 (100.0%) |
| 8 or more Rooms | 13 (16.3%) | 0 (0.0%) |
| Total | 80 (100.0%) | 19 (100.0%) |
Housing Structure by Heating Type in Springfield
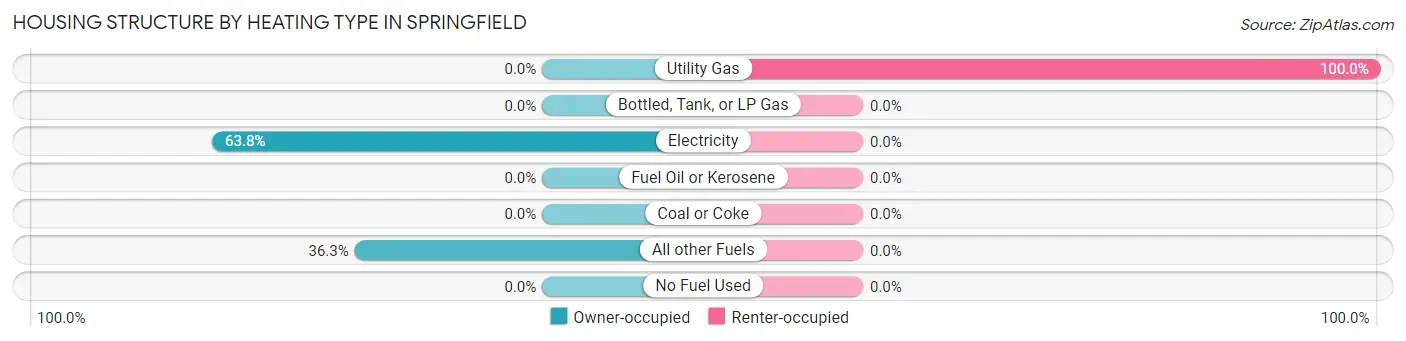
| Heating Type | Owner-occupied | Renter-occupied |
| Utility Gas | 0 (0.0%) | 19 (100.0%) |
| Bottled, Tank, or LP Gas | 0 (0.0%) | 0 (0.0%) |
| Electricity | 51 (63.7%) | 0 (0.0%) |
| Fuel Oil or Kerosene | 0 (0.0%) | 0 (0.0%) |
| Coal or Coke | 0 (0.0%) | 0 (0.0%) |
| All other Fuels | 29 (36.2%) | 0 (0.0%) |
| No Fuel Used | 0 (0.0%) | 0 (0.0%) |
| Total | 80 (100.0%) | 19 (100.0%) |
Household Vehicle Usage in Springfield
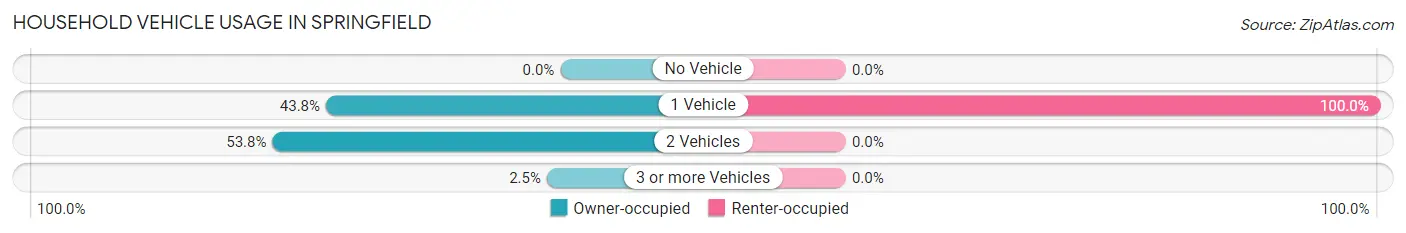
| Vehicles per Household | Owner-occupied | Renter-occupied |
| No Vehicle | 0 (0.0%) | 0 (0.0%) |
| 1 Vehicle | 35 (43.8%) | 19 (100.0%) |
| 2 Vehicles | 43 (53.7%) | 0 (0.0%) |
| 3 or more Vehicles | 2 (2.5%) | 0 (0.0%) |
| Total | 80 (100.0%) | 19 (100.0%) |
Real Estate & Mortgages in Springfield
Real Estate and Mortgage Overview in Springfield
| Characteristic | Without Mortgage | With Mortgage |
| Housing Units | 51 | 29 |
| Median Property Value | - | - |
| Median Household Income | $28,533 | $0 |
| Monthly Housing Costs | $258 | $0 |
| Real Estate Taxes | - | - |
Property Value by Mortgage Status in Springfield
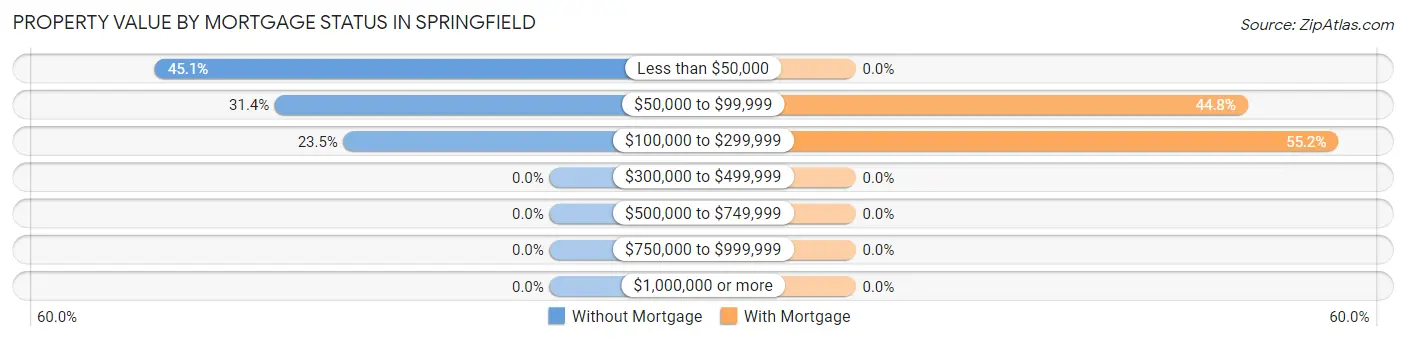
| Property Value | Without Mortgage | With Mortgage |
| Less than $50,000 | 23 (45.1%) | 0 (0.0%) |
| $50,000 to $99,999 | 16 (31.4%) | 13 (44.8%) |
| $100,000 to $299,999 | 12 (23.5%) | 16 (55.2%) |
| $300,000 to $499,999 | 0 (0.0%) | 0 (0.0%) |
| $500,000 to $749,999 | 0 (0.0%) | 0 (0.0%) |
| $750,000 to $999,999 | 0 (0.0%) | 0 (0.0%) |
| $1,000,000 or more | 0 (0.0%) | 0 (0.0%) |
| Total | 51 (100.0%) | 29 (100.0%) |
Household Income by Mortgage Status in Springfield
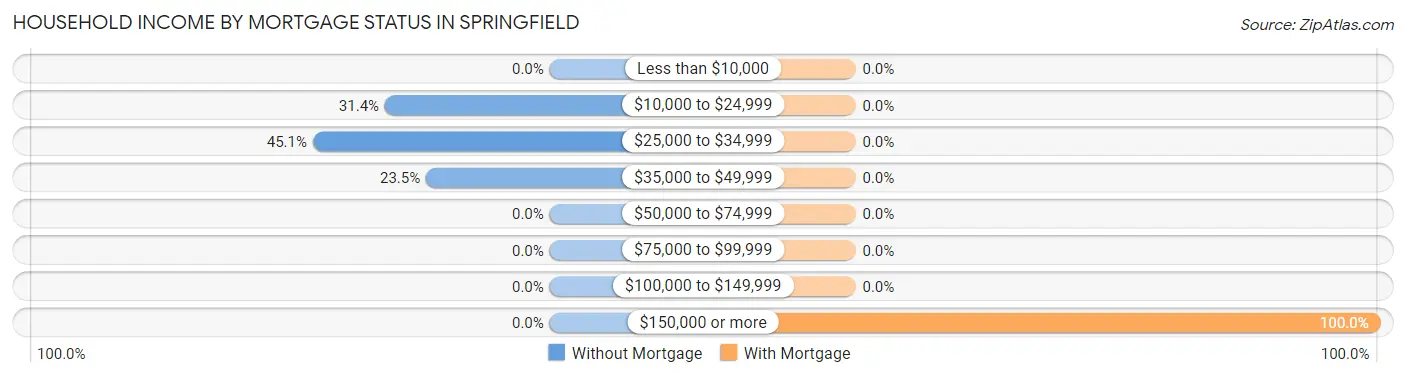
| Household Income | Without Mortgage | With Mortgage |
| Less than $10,000 | 0 (0.0%) | 0 (0.0%) |
| $10,000 to $24,999 | 16 (31.4%) | 0 (0.0%) |
| $25,000 to $34,999 | 23 (45.1%) | 0 (0.0%) |
| $35,000 to $49,999 | 12 (23.5%) | 0 (0.0%) |
| $50,000 to $74,999 | 0 (0.0%) | 0 (0.0%) |
| $75,000 to $99,999 | 0 (0.0%) | 0 (0.0%) |
| $100,000 to $149,999 | 0 (0.0%) | 0 (0.0%) |
| $150,000 or more | 0 (0.0%) | 29 (100.0%) |
| Total | 51 (100.0%) | 29 (100.0%) |
Property Value to Household Income Ratio in Springfield
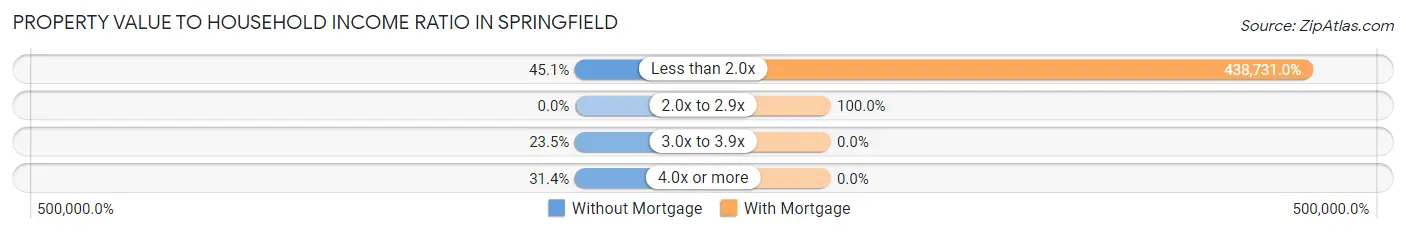
| Value-to-Income Ratio | Without Mortgage | With Mortgage |
| Less than 2.0x | 23 (45.1%) | 127,232 (438,731.0%) |
| 2.0x to 2.9x | 0 (0.0%) | 29 (100.0%) |
| 3.0x to 3.9x | 12 (23.5%) | 0 (0.0%) |
| 4.0x or more | 16 (31.4%) | 0 (0.0%) |
| Total | 51 (100.0%) | 29 (100.0%) |
Real Estate Taxes by Mortgage Status in Springfield
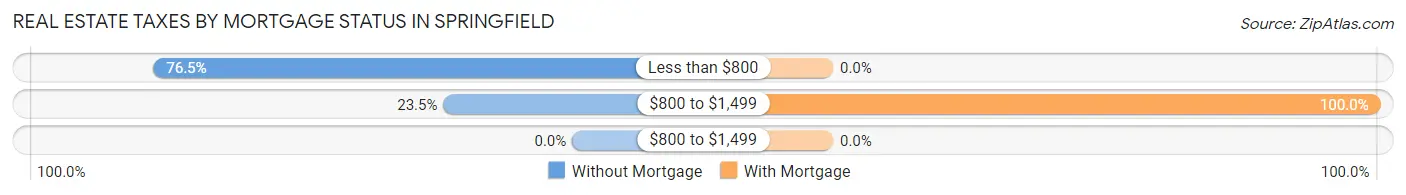
| Property Taxes | Without Mortgage | With Mortgage |
| Less than $800 | 39 (76.5%) | 0 (0.0%) |
| $800 to $1,499 | 12 (23.5%) | 29 (100.0%) |
| $800 to $1,499 | 0 (0.0%) | 0 (0.0%) |
| Total | 51 (100.0%) | 29 (100.0%) |
Health & Disability in Springfield
Health Insurance Coverage by Age in Springfield
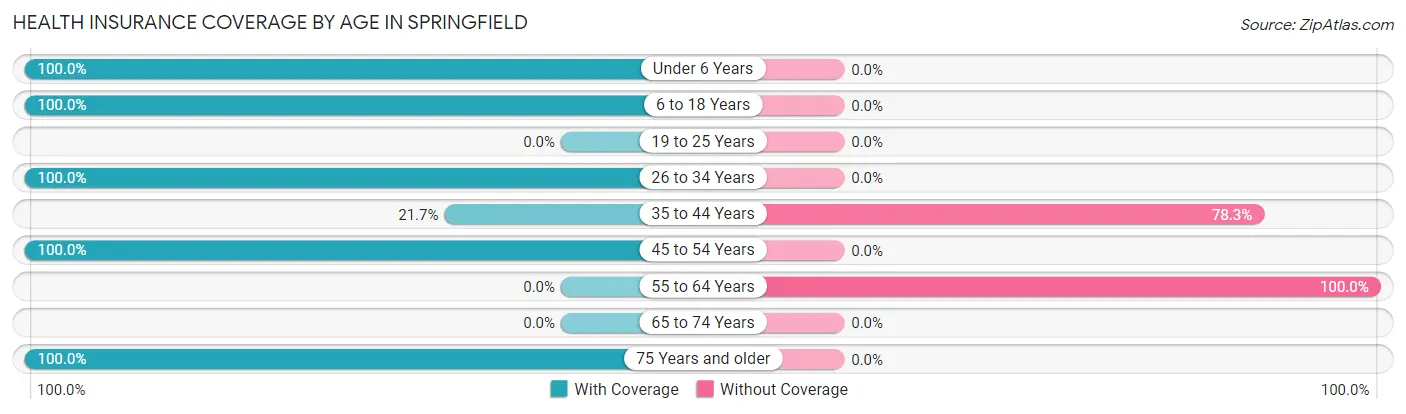
| Age Bracket | With Coverage | Without Coverage |
| Under 6 Years | 3 (100.0%) | 0 (0.0%) |
| 6 to 18 Years | 192 (100.0%) | 0 (0.0%) |
| 19 to 25 Years | 0 (0.0%) | 0 (0.0%) |
| 26 to 34 Years | 28 (100.0%) | 0 (0.0%) |
| 35 to 44 Years | 15 (21.7%) | 54 (78.3%) |
| 45 to 54 Years | 68 (100.0%) | 0 (0.0%) |
| 55 to 64 Years | 0 (0.0%) | 16 (100.0%) |
| 65 to 74 Years | 0 (0.0%) | 0 (0.0%) |
| 75 Years and older | 35 (100.0%) | 0 (0.0%) |
| Total | 341 (83.0%) | 70 (17.0%) |
Health Insurance Coverage by Citizenship Status in Springfield
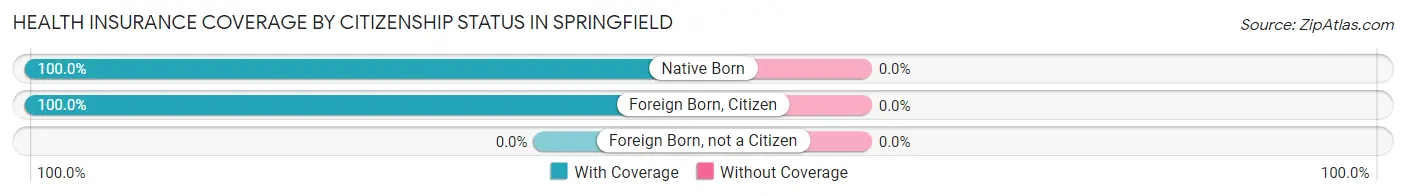
| Citizenship Status | With Coverage | Without Coverage |
| Native Born | 3 (100.0%) | 0 (0.0%) |
| Foreign Born, Citizen | 192 (100.0%) | 0 (0.0%) |
| Foreign Born, not a Citizen | 0 (0.0%) | 0 (0.0%) |
Health Insurance Coverage by Household Income in Springfield
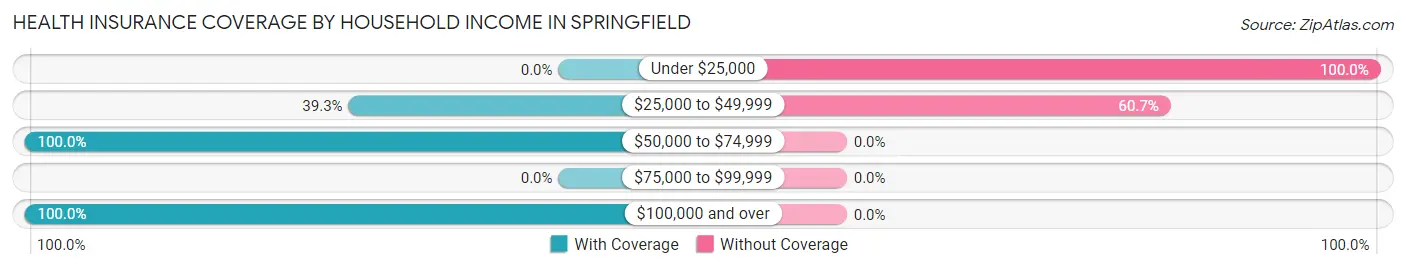
| Household Income | With Coverage | Without Coverage |
| Under $25,000 | 0 (0.0%) | 16 (100.0%) |
| $25,000 to $49,999 | 35 (39.3%) | 54 (60.7%) |
| $50,000 to $74,999 | 193 (100.0%) | 0 (0.0%) |
| $75,000 to $99,999 | 0 (0.0%) | 0 (0.0%) |
| $100,000 and over | 113 (100.0%) | 0 (0.0%) |
Public vs Private Health Insurance Coverage by Age in Springfield
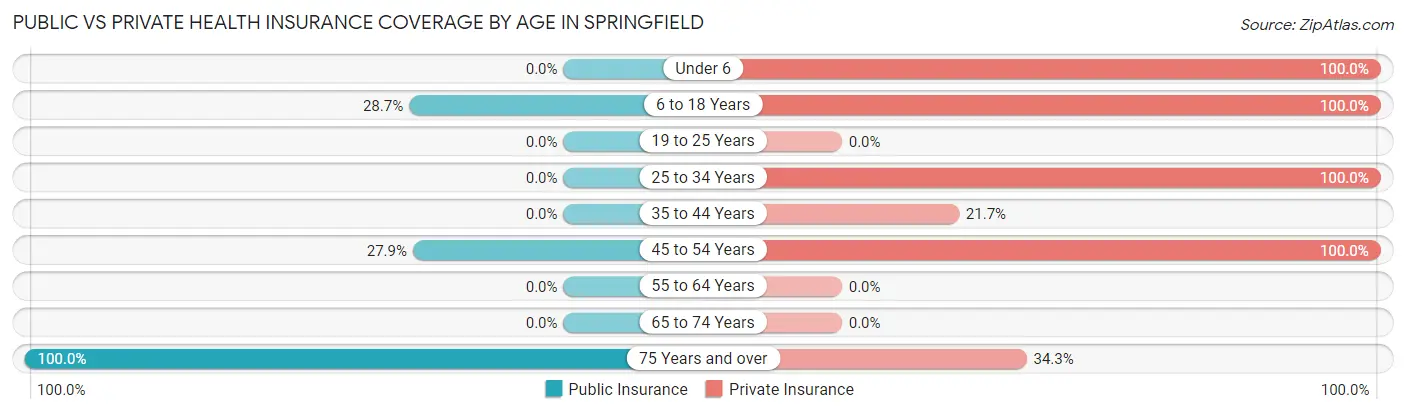
| Age Bracket | Public Insurance | Private Insurance |
| Under 6 | 0 (0.0%) | 3 (100.0%) |
| 6 to 18 Years | 55 (28.6%) | 192 (100.0%) |
| 19 to 25 Years | 0 (0.0%) | 0 (0.0%) |
| 25 to 34 Years | 0 (0.0%) | 28 (100.0%) |
| 35 to 44 Years | 0 (0.0%) | 15 (21.7%) |
| 45 to 54 Years | 19 (27.9%) | 68 (100.0%) |
| 55 to 64 Years | 0 (0.0%) | 0 (0.0%) |
| 65 to 74 Years | 0 (0.0%) | 0 (0.0%) |
| 75 Years and over | 35 (100.0%) | 12 (34.3%) |
| Total | 109 (26.5%) | 318 (77.4%) |
Disability Status by Sex by Age in Springfield
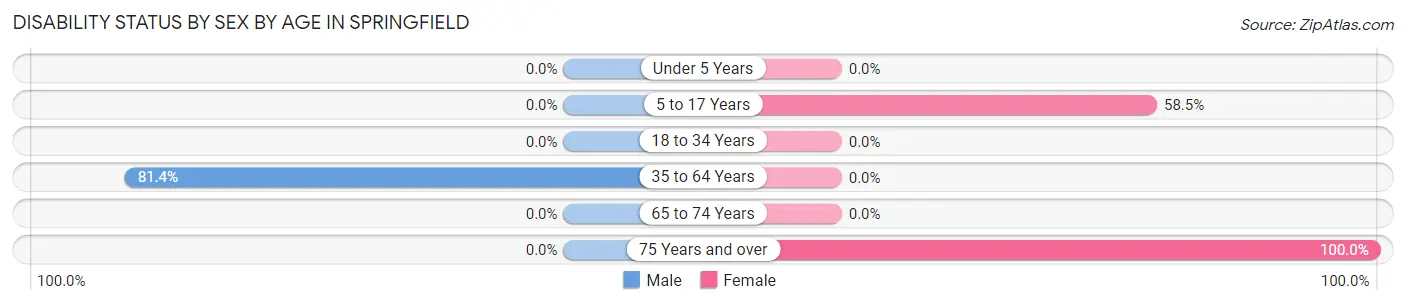
| Age Bracket | Male | Female |
| Under 5 Years | 0 (0.0%) | 0 (0.0%) |
| 5 to 17 Years | 0 (0.0%) | 55 (58.5%) |
| 18 to 34 Years | 0 (0.0%) | 0 (0.0%) |
| 35 to 64 Years | 35 (81.4%) | 0 (0.0%) |
| 65 to 74 Years | 0 (0.0%) | 0 (0.0%) |
| 75 Years and over | 0 (0.0%) | 35 (100.0%) |
Disability Class by Sex by Age in Springfield
Disability Class: Hearing Difficulty
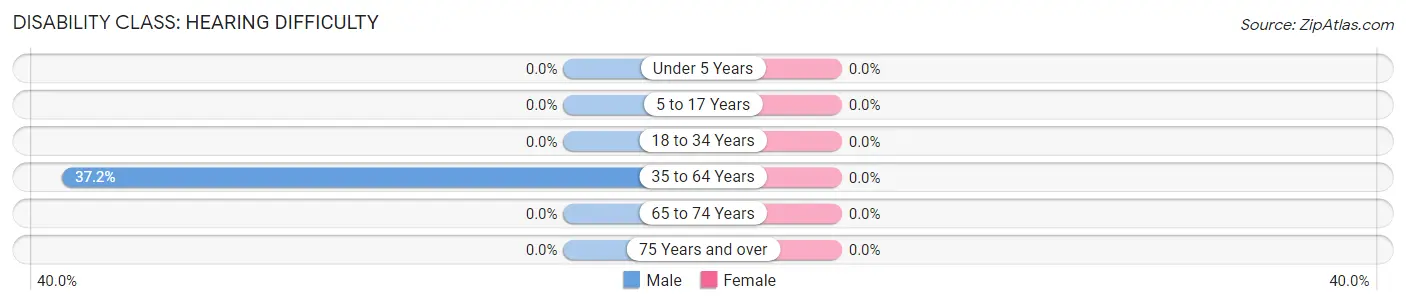
| Age Bracket | Male | Female |
| Under 5 Years | 0 (0.0%) | 0 (0.0%) |
| 5 to 17 Years | 0 (0.0%) | 0 (0.0%) |
| 18 to 34 Years | 0 (0.0%) | 0 (0.0%) |
| 35 to 64 Years | 16 (37.2%) | 0 (0.0%) |
| 65 to 74 Years | 0 (0.0%) | 0 (0.0%) |
| 75 Years and over | 0 (0.0%) | 0 (0.0%) |
Disability Class: Vision Difficulty
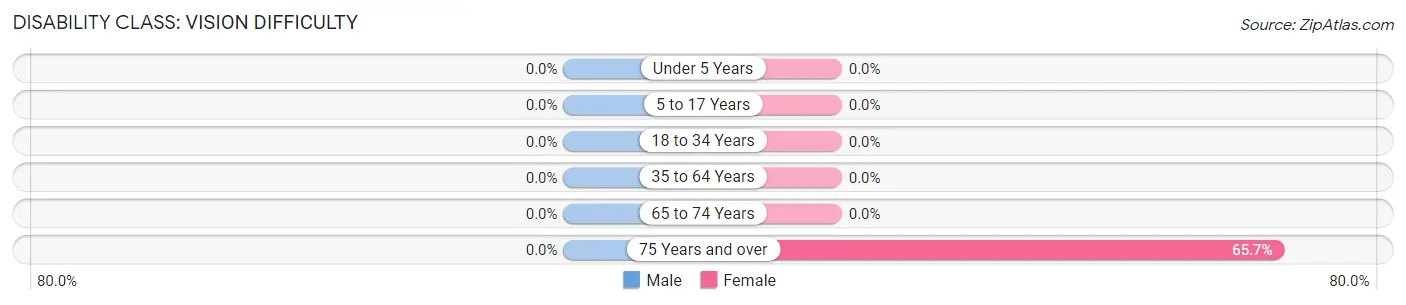
| Age Bracket | Male | Female |
| Under 5 Years | 0 (0.0%) | 0 (0.0%) |
| 5 to 17 Years | 0 (0.0%) | 0 (0.0%) |
| 18 to 34 Years | 0 (0.0%) | 0 (0.0%) |
| 35 to 64 Years | 0 (0.0%) | 0 (0.0%) |
| 65 to 74 Years | 0 (0.0%) | 0 (0.0%) |
| 75 Years and over | 0 (0.0%) | 23 (65.7%) |
Disability Class: Cognitive Difficulty
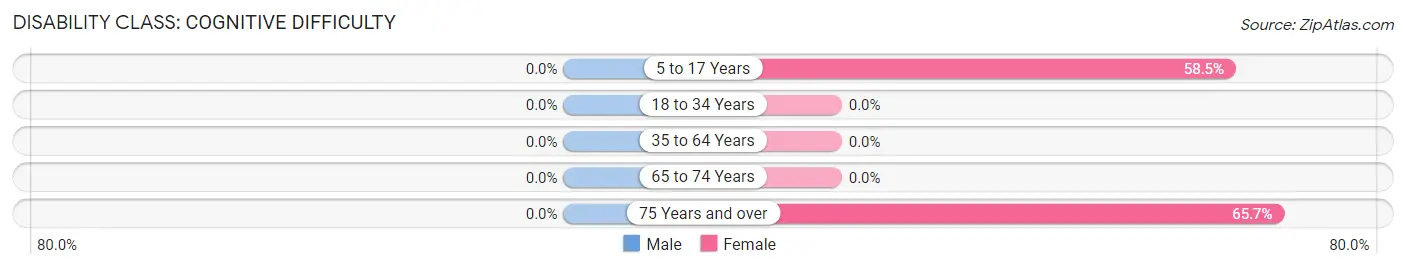
| Age Bracket | Male | Female |
| 5 to 17 Years | 0 (0.0%) | 55 (58.5%) |
| 18 to 34 Years | 0 (0.0%) | 0 (0.0%) |
| 35 to 64 Years | 0 (0.0%) | 0 (0.0%) |
| 65 to 74 Years | 0 (0.0%) | 0 (0.0%) |
| 75 Years and over | 0 (0.0%) | 23 (65.7%) |
Disability Class: Ambulatory Difficulty
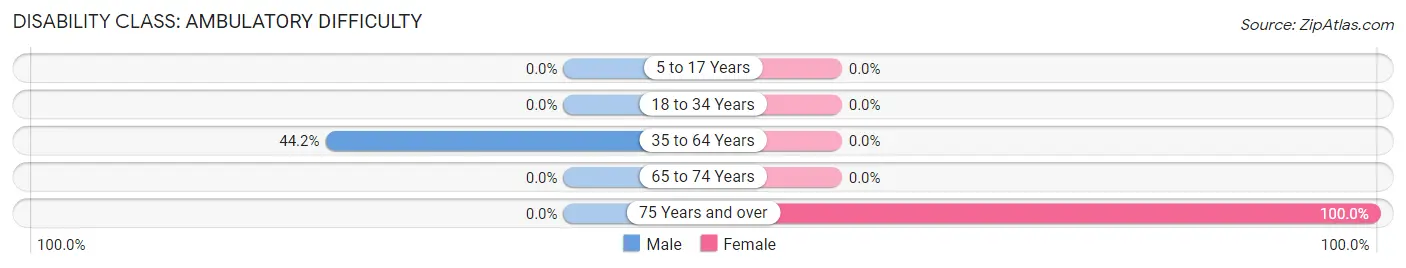
| Age Bracket | Male | Female |
| 5 to 17 Years | 0 (0.0%) | 0 (0.0%) |
| 18 to 34 Years | 0 (0.0%) | 0 (0.0%) |
| 35 to 64 Years | 19 (44.2%) | 0 (0.0%) |
| 65 to 74 Years | 0 (0.0%) | 0 (0.0%) |
| 75 Years and over | 0 (0.0%) | 35 (100.0%) |
Disability Class: Self-Care Difficulty
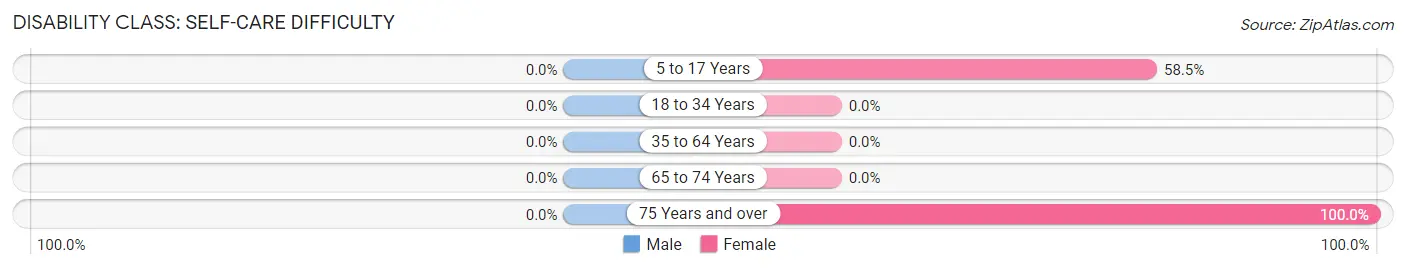
| Age Bracket | Male | Female |
| 5 to 17 Years | 0 (0.0%) | 55 (58.5%) |
| 18 to 34 Years | 0 (0.0%) | 0 (0.0%) |
| 35 to 64 Years | 0 (0.0%) | 0 (0.0%) |
| 65 to 74 Years | 0 (0.0%) | 0 (0.0%) |
| 75 Years and over | 0 (0.0%) | 35 (100.0%) |
Technology Access in Springfield
Computing Device Access in Springfield
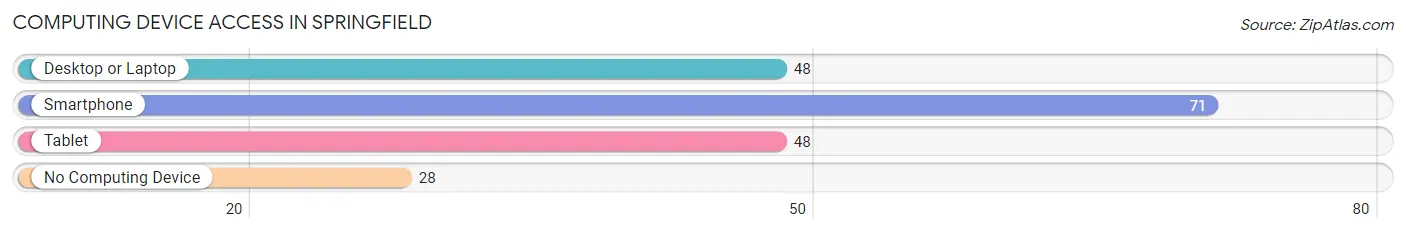
| Device Type | # Households | % Households |
| Desktop or Laptop | 48 | 48.5% |
| Smartphone | 71 | 71.7% |
| Tablet | 48 | 48.5% |
| No Computing Device | 28 | 28.3% |
| Total | 99 | 100.0% |
Internet Access in Springfield
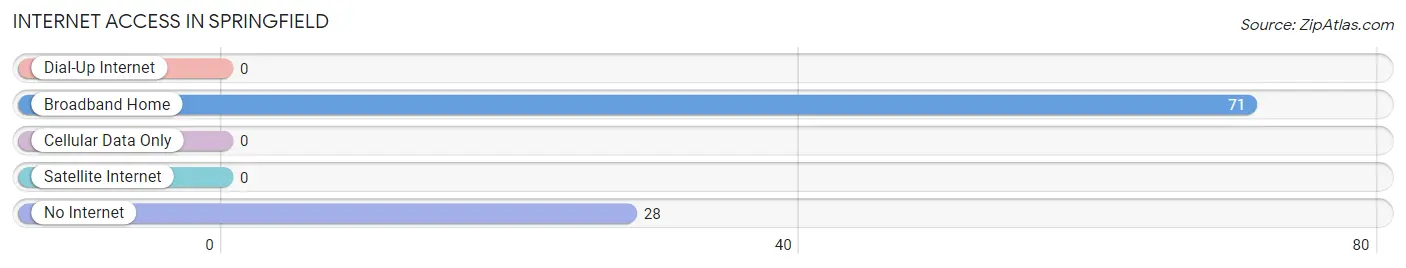
| Internet Type | # Households | % Households |
| Dial-Up Internet | 0 | 0.0% |
| Broadband Home | 71 | 71.7% |
| Cellular Data Only | 0 | 0.0% |
| Satellite Internet | 0 | 0.0% |
| No Internet | 28 | 28.3% |
| Total | 99 | 100.0% |
Springfield Summary
Springfield, West Virginia is a small town located in Hampshire County, West Virginia. It is situated in the Appalachian Mountains and is part of the Potomac Highlands region. The town has a population of approximately 1,000 people and is located about 25 miles from the state capital of Charleston.
History
The area that is now Springfield was first settled in the late 1700s by a group of German immigrants. The town was originally known as “Springfield” due to the numerous springs in the area. The town was officially incorporated in 1872 and was named after the nearby spring.
In the late 1800s, Springfield was a thriving agricultural community. The town was home to several mills, including a grist mill, a saw mill, and a woolen mill. The town also had a blacksmith shop, a general store, and a post office.
In the early 1900s, Springfield began to experience a decline in population due to the decline of the local agricultural industry. The town was also affected by the Great Depression and World War II. In the 1950s, the town began to experience a resurgence in population due to the growth of the coal industry in the area.
Geography
Springfield is located in the Appalachian Mountains in Hampshire County, West Virginia. The town is situated in the Potomac Highlands region and is surrounded by rolling hills and mountains. The town is located about 25 miles from the state capital of Charleston.
The climate in Springfield is humid and temperate. The average temperature in the summer is around 75 degrees Fahrenheit and the average temperature in the winter is around 40 degrees Fahrenheit. The town receives an average of 40 inches of precipitation per year.
Economy
The economy of Springfield is largely based on agriculture and tourism. The town is home to several farms that produce a variety of crops, including corn, soybeans, and hay. The town is also home to several wineries and breweries.
Tourism is an important part of the local economy. The town is home to several historic sites, including the Springfield Historic District, which is listed on the National Register of Historic Places. The town is also home to several outdoor recreation areas, including the George Washington National Forest and the Appalachian Trail.
Demographics
As of the 2010 census, the population of Springfield was 1,000 people. The racial makeup of the town was 97.2% White, 0.7% African American, 0.3% Native American, 0.2% Asian, and 1.6% from other races. The median household income in the town was $35,000.
The town is home to several churches, including the Springfield United Methodist Church, the Springfield Baptist Church, and the Springfield Presbyterian Church. The town is also home to several schools, including the Springfield Elementary School and the Springfield High School.
Common Questions
What is Per Capita Income in Springfield?
Per Capita income in Springfield is $15,992.
What is Inequality or Gini Index in Springfield?
Inequality or Gini Index in Springfield is 0.39.
What is the Total Population of Springfield?
Total Population of Springfield is 411.
What is the Total Male Population of Springfield?
Total Male Population of Springfield is 155.
What is the Total Female Population of Springfield?
Total Female Population of Springfield is 256.
What is the Ratio of Males per 100 Females in Springfield?
There are 60.55 Males per 100 Females in Springfield.
What is the Ratio of Females per 100 Males in Springfield?
There are 165.16 Females per 100 Males in Springfield.
What is the Median Population Age in Springfield?
Median Population Age in Springfield is 33.8 Years.
What is the Average Family Size in Springfield
Average Family Size in Springfield is 5.4 People.
What is the Average Household Size in Springfield
Average Household Size in Springfield is 4.2 People.
How Large is the Labor Force in Springfield?
There are 162 People in the Labor Forcein in Springfield.
What is the Percentage of People in the Labor Force in Springfield?
75.0% of People are in the Labor Force in Springfield.