Middleway, WV Map & Demographics
Middleway Map
Middleway Overview
$30,971
PER CAPITA INCOME
$109,191
AVG FAMILY INCOME
0.47
INEQUALITY / GINI INDEX
440
TOTAL POPULATION
163
MALE POPULATION
277
FEMALE POPULATION
58.84
MALES / 100 FEMALES
169.94
FEMALES / 100 MALES
49.3
MEDIAN AGE
3.5
AVG FAMILY SIZE
2.6
AVG HOUSEHOLD SIZE
272
LABOR FORCE [ PEOPLE ]
72.9%
PERCENT IN LABOR FORCE
Middleway Area Codes
Income in Middleway
Income Overview in Middleway
| Characteristic | Number | Measure |
| Per Capita Income | 440 | $30,971 |
| Median Family Income | 107 | $109,191 |
| Mean Family Income | 107 | $104,750 |
| Median Household Income | 167 | $0 |
| Mean Household Income | 167 | $80,198 |
| Income Deficit | 107 | $0 |
| Wage / Income Gap (%) | 440 | 0.00% |
| Wage / Income Gap ($) | 440 | 100.00¢ per $1 |
| Gini / Inequality Index | 440 | 0.47 |
Earnings by Sex in Middleway
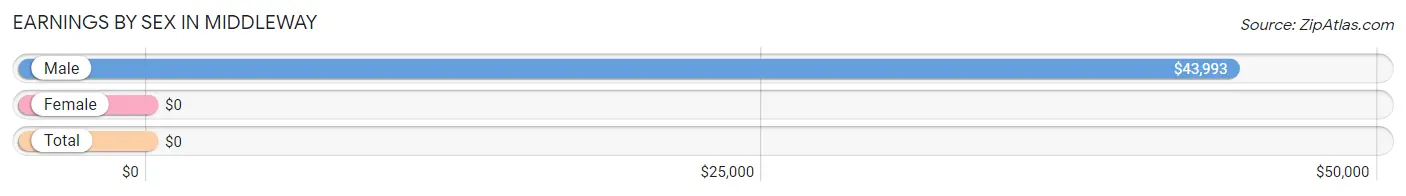
| Sex | Number | Average Earnings |
| Male | 105 (38.6%) | $43,993 |
| Female | 167 (61.4%) | $0 |
| Total | 272 (100.0%) | $0 |
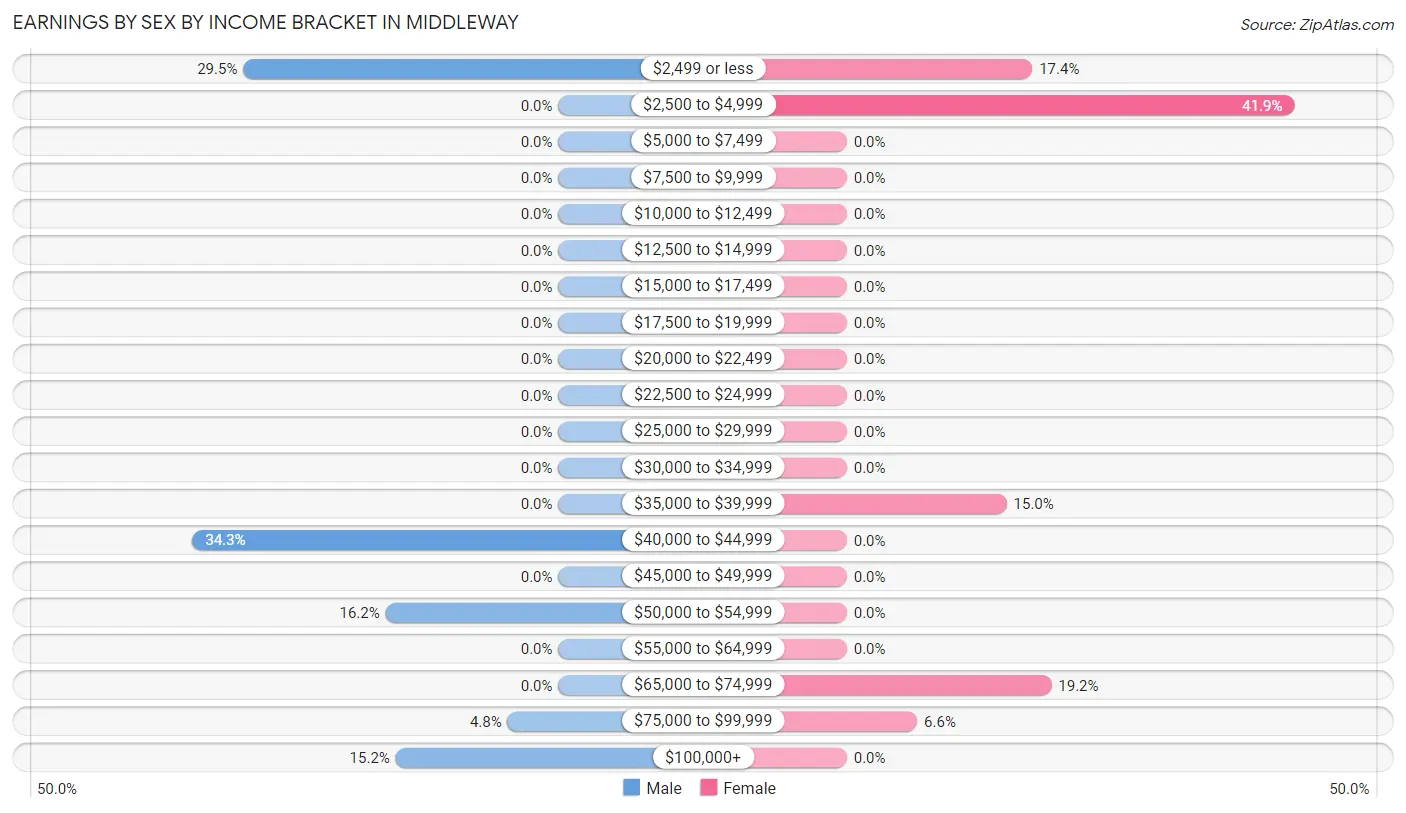
Earnings by Sex by Income Bracket in Middleway
The most common earnings brackets in Middleway are $40,000 to $44,999 for men (36 | 34.3%) and $2,500 to $4,999 for women (70 | 41.9%).
| Income | Male | Female |
| $2,499 or less | 31 (29.5%) | 29 (17.4%) |
| $2,500 to $4,999 | 0 (0.0%) | 70 (41.9%) |
| $5,000 to $7,499 | 0 (0.0%) | 0 (0.0%) |
| $7,500 to $9,999 | 0 (0.0%) | 0 (0.0%) |
| $10,000 to $12,499 | 0 (0.0%) | 0 (0.0%) |
| $12,500 to $14,999 | 0 (0.0%) | 0 (0.0%) |
| $15,000 to $17,499 | 0 (0.0%) | 0 (0.0%) |
| $17,500 to $19,999 | 0 (0.0%) | 0 (0.0%) |
| $20,000 to $22,499 | 0 (0.0%) | 0 (0.0%) |
| $22,500 to $24,999 | 0 (0.0%) | 0 (0.0%) |
| $25,000 to $29,999 | 0 (0.0%) | 0 (0.0%) |
| $30,000 to $34,999 | 0 (0.0%) | 0 (0.0%) |
| $35,000 to $39,999 | 0 (0.0%) | 25 (15.0%) |
| $40,000 to $44,999 | 36 (34.3%) | 0 (0.0%) |
| $45,000 to $49,999 | 0 (0.0%) | 0 (0.0%) |
| $50,000 to $54,999 | 17 (16.2%) | 0 (0.0%) |
| $55,000 to $64,999 | 0 (0.0%) | 0 (0.0%) |
| $65,000 to $74,999 | 0 (0.0%) | 32 (19.2%) |
| $75,000 to $99,999 | 5 (4.8%) | 11 (6.6%) |
| $100,000+ | 16 (15.2%) | 0 (0.0%) |
| Total | 105 (100.0%) | 167 (100.0%) |
Earnings by Sex by Educational Attainment in Middleway
| Educational Attainment | Male Income | Female Income |
| Less than High School | - | - |
| High School Diploma | - | - |
| College or Associate's Degree | - | - |
| Bachelor's Degree | - | - |
| Graduate Degree | - | - |
| Total | - | - |
Family Income in Middleway
Family Income Brackets in Middleway
According to the Middleway family income data, there are 49 families falling into the $100,000 to $149,999 income range, which is the most common income bracket and makes up 45.8% of all families.
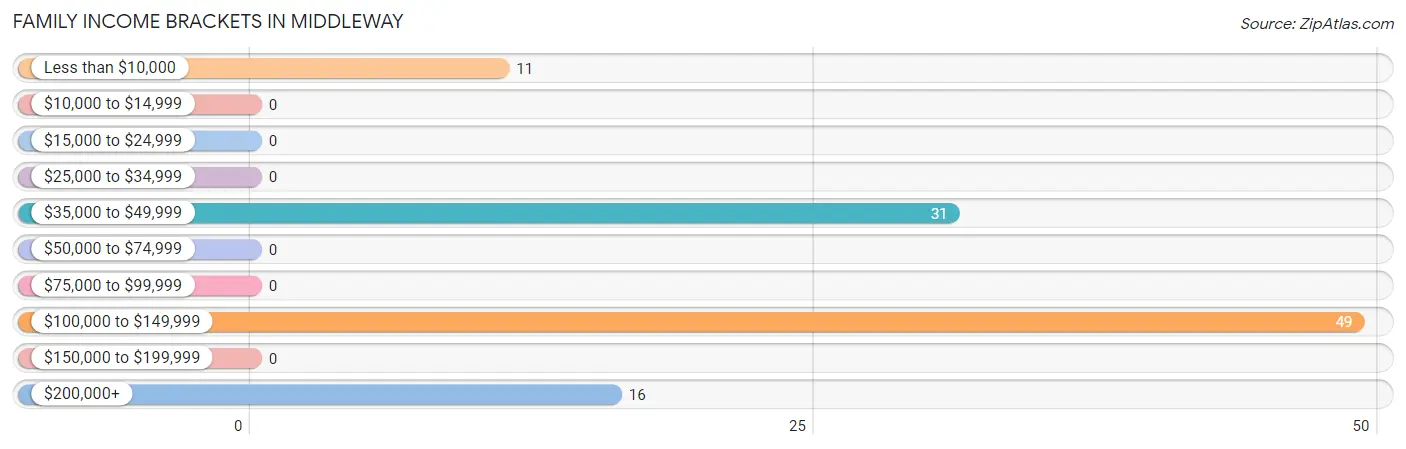
| Income Bracket | # Families | % Families |
| Less than $10,000 | 11 | 10.3% |
| $10,000 to $14,999 | 0 | 0.0% |
| $15,000 to $24,999 | 0 | 0.0% |
| $25,000 to $34,999 | 0 | 0.0% |
| $35,000 to $49,999 | 31 | 29.0% |
| $50,000 to $74,999 | 0 | 0.0% |
| $75,000 to $99,999 | 0 | 0.0% |
| $100,000 to $149,999 | 49 | 45.8% |
| $150,000 to $199,999 | 0 | 0.0% |
| $200,000+ | 16 | 15.0% |
Family Income by Famaliy Size in Middleway
2-person families (59 | 55.1%) account for the highest median family income in Middleway with $38,992 per family, while 2-person families (59 | 55.1%) have the highest median income of $19,496 per family member.
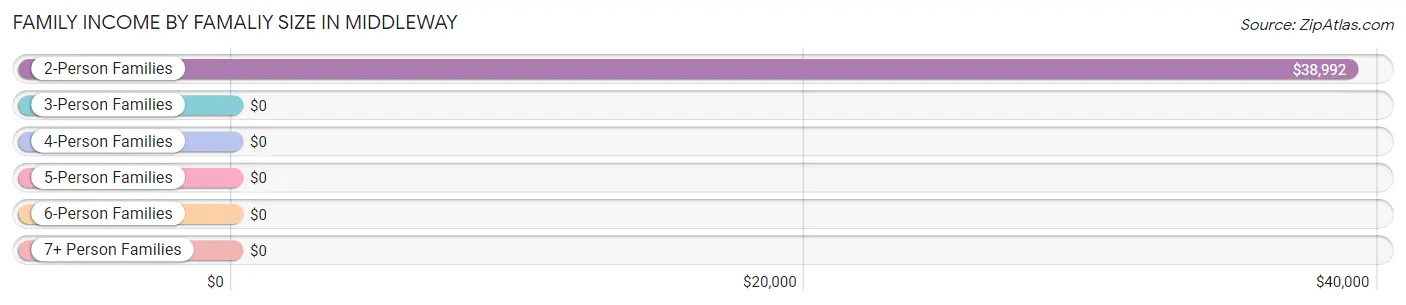
| Income Bracket | # Families | Median Income |
| 2-Person Families | 59 (55.1%) | $38,992 |
| 3-Person Families | 0 (0.0%) | $0 |
| 4-Person Families | 32 (29.9%) | $0 |
| 5-Person Families | 16 (14.9%) | $0 |
| 6-Person Families | 0 (0.0%) | $0 |
| 7+ Person Families | 0 (0.0%) | $0 |
| Total | 107 (100.0%) | $109,191 |
Family Income by Number of Earners in Middleway

| Number of Earners | # Families | Median Income |
| No Earners | 24 (22.4%) | $0 |
| 1 Earner | 4 (3.7%) | $0 |
| 2 Earners | 63 (58.9%) | $0 |
| 3+ Earners | 16 (14.9%) | $0 |
| Total | 107 (100.0%) | $109,191 |
Household Income in Middleway
Household Income Brackets in Middleway
With 49 households falling in the category, the $100,000 to $149,999 income range is the most frequent in Middleway, accounting for 29.3% of all households.
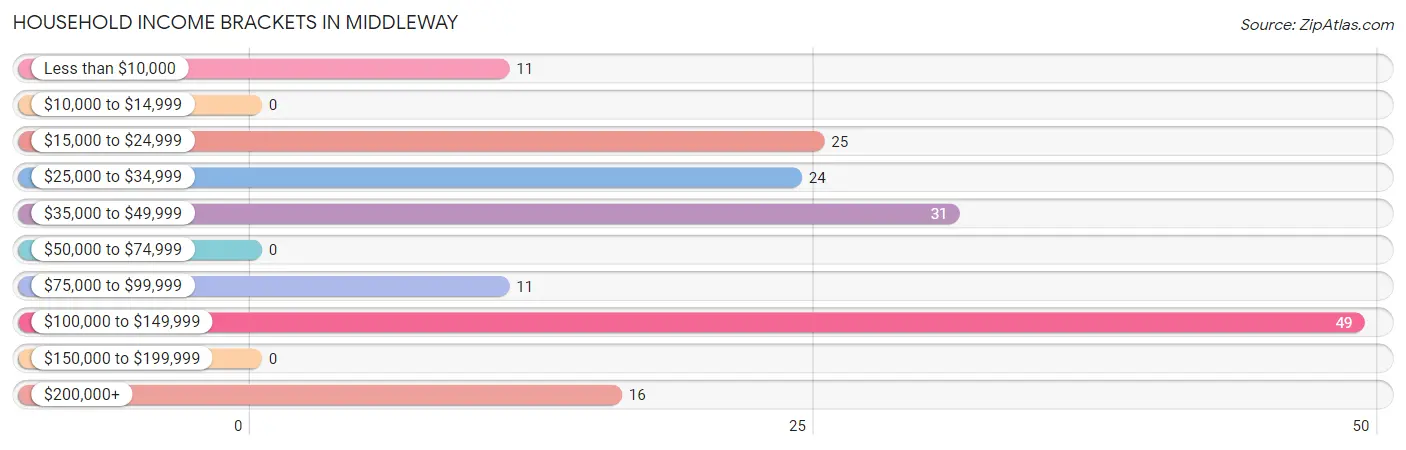
| Income Bracket | # Households | % Households |
| Less than $10,000 | 11 | 6.6% |
| $10,000 to $14,999 | 0 | 0.0% |
| $15,000 to $24,999 | 25 | 15.0% |
| $25,000 to $34,999 | 24 | 14.4% |
| $35,000 to $49,999 | 31 | 18.6% |
| $50,000 to $74,999 | 0 | 0.0% |
| $75,000 to $99,999 | 11 | 6.6% |
| $100,000 to $149,999 | 49 | 29.3% |
| $150,000 to $199,999 | 0 | 0.0% |
| $200,000+ | 16 | 9.6% |
Household Income by Householder Age in Middleway
| Income Bracket | # Households | Median Income |
| 15 to 24 Years | 0 (0.0%) | $0 |
| 25 to 44 Years | 32 (19.2%) | $0 |
| 45 to 64 Years | 51 (30.5%) | $0 |
| 65+ Years | 84 (50.3%) | $0 |
| Total | 167 (100.0%) | $0 |
Poverty in Middleway
Income Below Poverty by Sex and Age in Middleway
With 6.8% poverty level for males and 4.0% for females among the residents of Middleway, 65 to 74 year old males and 65 to 74 year old females are the most vulnerable to poverty, with 11 males (100.0%) and 11 females (18.3%) in their respective age groups living below the poverty level.
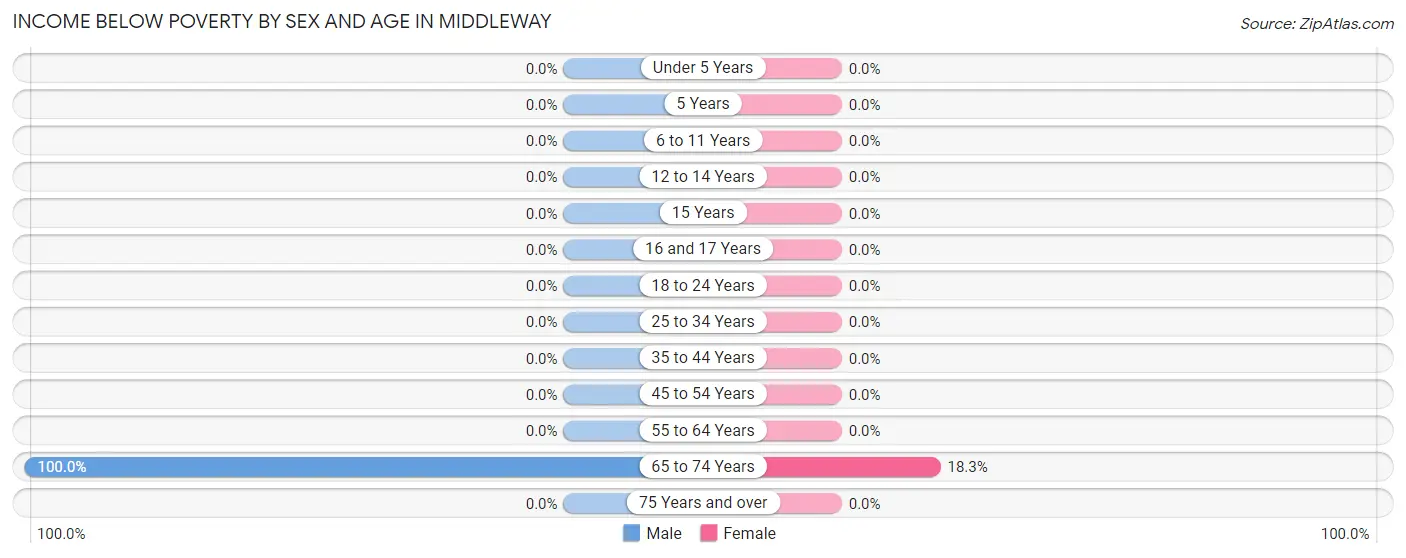
| Age Bracket | Male | Female |
| Under 5 Years | 0 (0.0%) | 0 (0.0%) |
| 5 Years | 0 (0.0%) | 0 (0.0%) |
| 6 to 11 Years | 0 (0.0%) | 0 (0.0%) |
| 12 to 14 Years | 0 (0.0%) | 0 (0.0%) |
| 15 Years | 0 (0.0%) | 0 (0.0%) |
| 16 and 17 Years | 0 (0.0%) | 0 (0.0%) |
| 18 to 24 Years | 0 (0.0%) | 0 (0.0%) |
| 25 to 34 Years | 0 (0.0%) | 0 (0.0%) |
| 35 to 44 Years | 0 (0.0%) | 0 (0.0%) |
| 45 to 54 Years | 0 (0.0%) | 0 (0.0%) |
| 55 to 64 Years | 0 (0.0%) | 0 (0.0%) |
| 65 to 74 Years | 11 (100.0%) | 11 (18.3%) |
| 75 Years and over | 0 (0.0%) | 0 (0.0%) |
| Total | 11 (6.8%) | 11 (4.0%) |
Income Above Poverty by Sex and Age in Middleway
According to the poverty statistics in Middleway, males aged under 5 years and females aged 5 years are the age groups that are most secure financially, with 100.0% of males and 100.0% of females in these age groups living above the poverty line.
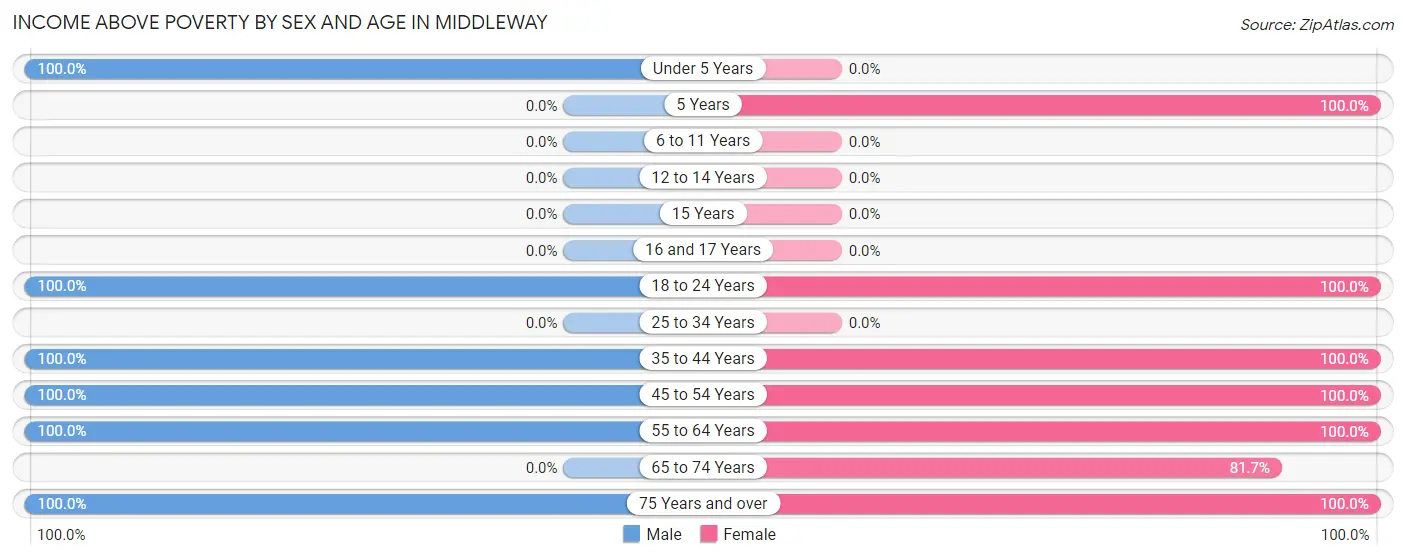
| Age Bracket | Male | Female |
| Under 5 Years | 34 (100.0%) | 0 (0.0%) |
| 5 Years | 0 (0.0%) | 33 (100.0%) |
| 6 to 11 Years | 0 (0.0%) | 0 (0.0%) |
| 12 to 14 Years | 0 (0.0%) | 0 (0.0%) |
| 15 Years | 0 (0.0%) | 0 (0.0%) |
| 16 and 17 Years | 0 (0.0%) | 0 (0.0%) |
| 18 to 24 Years | 17 (100.0%) | 60 (100.0%) |
| 25 to 34 Years | 0 (0.0%) | 0 (0.0%) |
| 35 to 44 Years | 36 (100.0%) | 32 (100.0%) |
| 45 to 54 Years | 5 (100.0%) | 64 (100.0%) |
| 55 to 64 Years | 47 (100.0%) | 4 (100.0%) |
| 65 to 74 Years | 0 (0.0%) | 49 (81.7%) |
| 75 Years and over | 13 (100.0%) | 24 (100.0%) |
| Total | 152 (93.2%) | 266 (96.0%) |
Income Below Poverty Among Married-Couple Families in Middleway
The poverty statistics for married-couple families in Middleway show that 10.3% or 11 of the total 107 families live below the poverty line. Families with no children have the highest poverty rate of 14.7%, comprising of 11 families. On the other hand, families with 1 or 2 children have the lowest poverty rate of 0.0%, which includes 0 families.
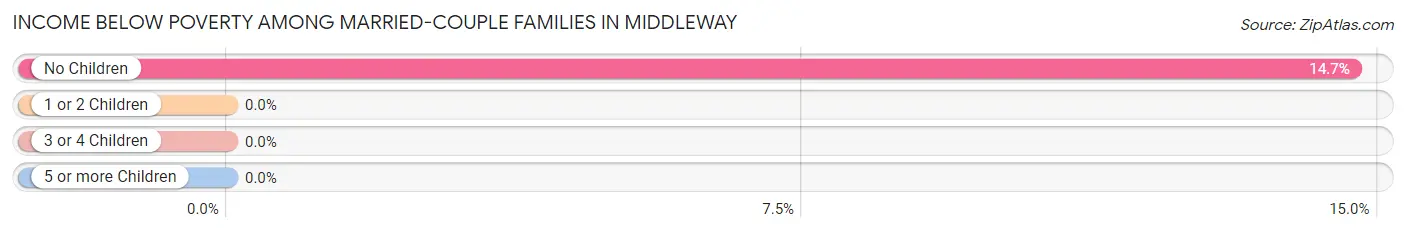
| Children | Above Poverty | Below Poverty |
| No Children | 64 (85.3%) | 11 (14.7%) |
| 1 or 2 Children | 32 (100.0%) | 0 (0.0%) |
| 3 or 4 Children | 0 (0.0%) | 0 (0.0%) |
| 5 or more Children | 0 (0.0%) | 0 (0.0%) |
| Total | 96 (89.7%) | 11 (10.3%) |
Income Below Poverty Among Single-Parent Households in Middleway
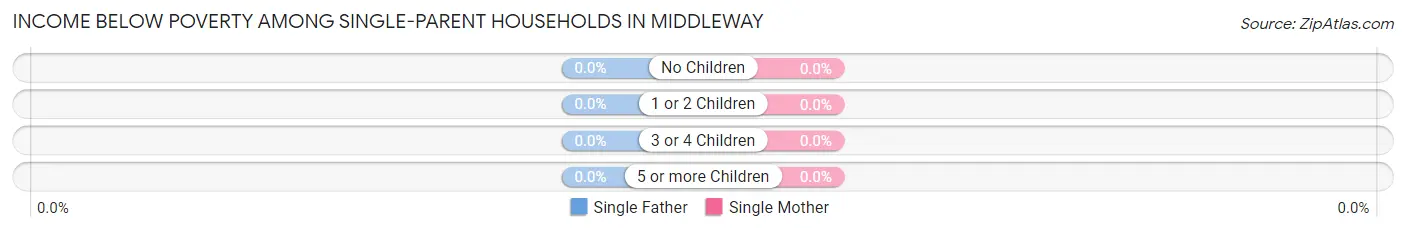
| Children | Single Father | Single Mother |
| No Children | 0 (0.0%) | 0 (0.0%) |
| 1 or 2 Children | 0 (0.0%) | 0 (0.0%) |
| 3 or 4 Children | 0 (0.0%) | 0 (0.0%) |
| 5 or more Children | 0 (0.0%) | 0 (0.0%) |
| Total | 0 (0.0%) | 0 (0.0%) |
Income Below Poverty Among Married-Couple vs Single-Parent Households in Middleway
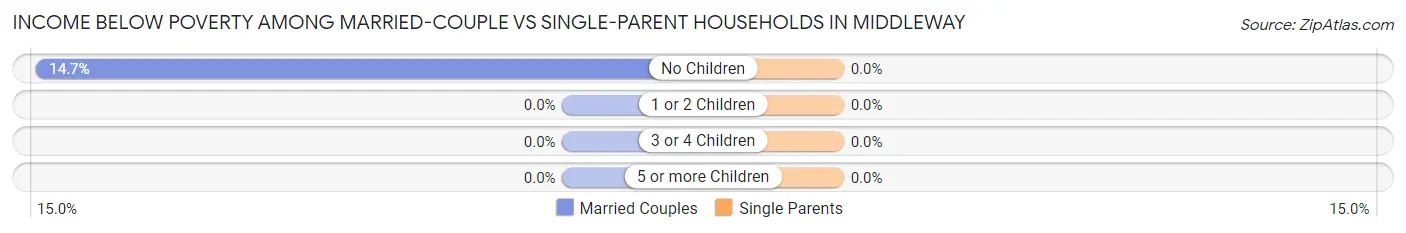
| Children | Married-Couple Families | Single-Parent Households |
| No Children | 11 (14.7%) | 0 (0.0%) |
| 1 or 2 Children | 0 (0.0%) | 0 (0.0%) |
| 3 or 4 Children | 0 (0.0%) | 0 (0.0%) |
| 5 or more Children | 0 (0.0%) | 0 (0.0%) |
| Total | 11 (10.3%) | 0 (0.0%) |
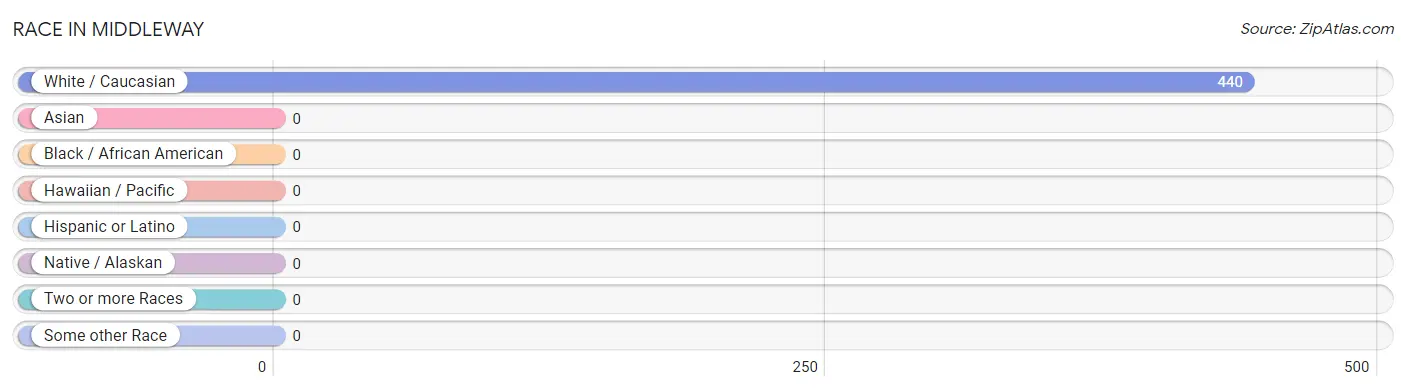
Race in Middleway
The most populous races in Middleway are , and White / Caucasian (440 | 100.0%).
| Race | # Population | % Population |
| Asian | 0 | 0.0% |
| Black / African American | 0 | 0.0% |
| Hawaiian / Pacific | 0 | 0.0% |
| Hispanic or Latino | 0 | 0.0% |
| Native / Alaskan | 0 | 0.0% |
| White / Caucasian | 440 | 100.0% |
| Two or more Races | 0 | 0.0% |
| Some other Race | 0 | 0.0% |
| Total | 440 | 100.0% |
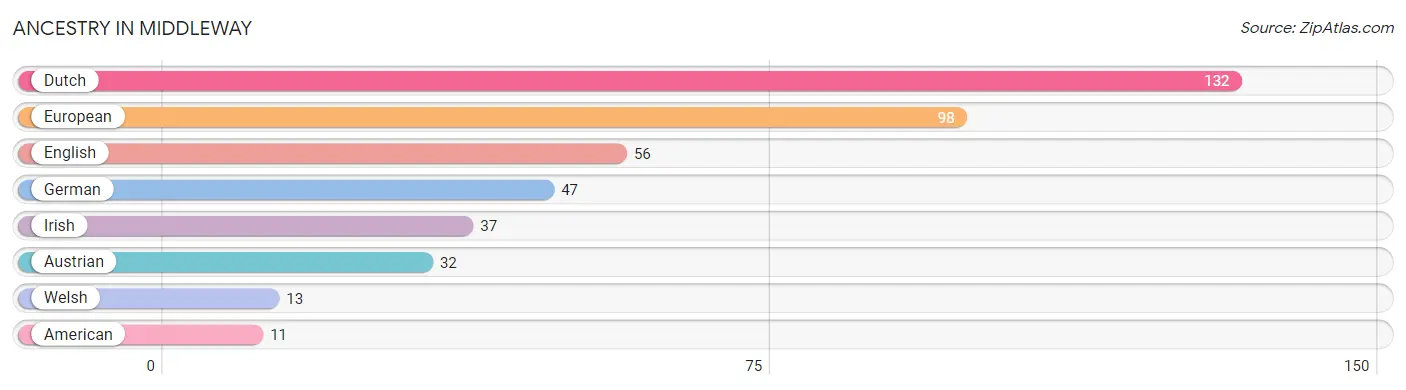
Ancestry in Middleway
The most populous ancestries reported in Middleway are Dutch (132 | 30.0%), European (98 | 22.3%), English (56 | 12.7%), German (47 | 10.7%), and Irish (37 | 8.4%), together accounting for 84.1% of all Middleway residents.
| Ancestry | # Population | % Population |
| American | 11 | 2.5% |
| Austrian | 32 | 7.3% |
| Dutch | 132 | 30.0% |
| English | 56 | 12.7% |
| European | 98 | 22.3% |
| German | 47 | 10.7% |
| Irish | 37 | 8.4% |
| Welsh | 13 | 2.9% | View All 8 Rows |
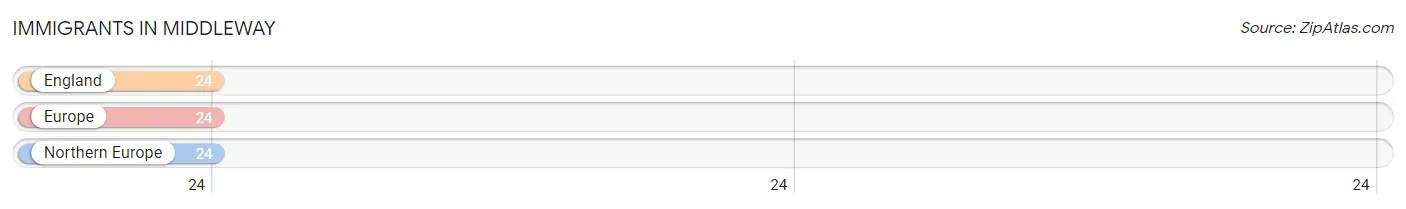
Immigrants in Middleway
The most numerous immigrant groups reported in Middleway came from England (24 | 5.4%), Europe (24 | 5.4%), and Northern Europe (24 | 5.4%), together accounting for 16.4% of all Middleway residents.
| Immigration Origin | # Population | % Population |
| England | 24 | 5.4% |
| Europe | 24 | 5.4% |
| Northern Europe | 24 | 5.4% | View All 3 Rows |
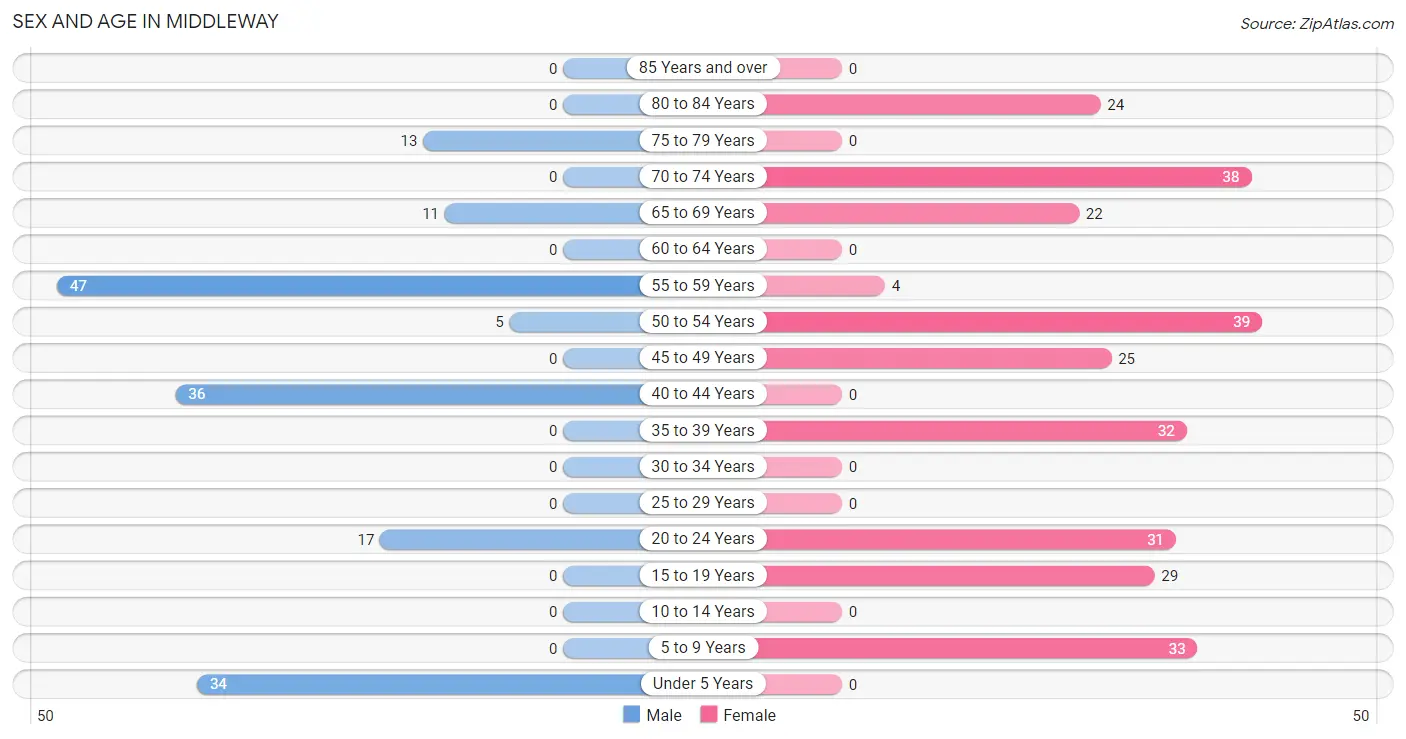
Sex and Age in Middleway
Sex and Age in Middleway
The most populous age groups in Middleway are 55 to 59 Years (47 | 28.8%) for men and 50 to 54 Years (39 | 14.1%) for women.
| Age Bracket | Male | Female |
| Under 5 Years | 34 (20.9%) | 0 (0.0%) |
| 5 to 9 Years | 0 (0.0%) | 33 (11.9%) |
| 10 to 14 Years | 0 (0.0%) | 0 (0.0%) |
| 15 to 19 Years | 0 (0.0%) | 29 (10.5%) |
| 20 to 24 Years | 17 (10.4%) | 31 (11.2%) |
| 25 to 29 Years | 0 (0.0%) | 0 (0.0%) |
| 30 to 34 Years | 0 (0.0%) | 0 (0.0%) |
| 35 to 39 Years | 0 (0.0%) | 32 (11.6%) |
| 40 to 44 Years | 36 (22.1%) | 0 (0.0%) |
| 45 to 49 Years | 0 (0.0%) | 25 (9.0%) |
| 50 to 54 Years | 5 (3.1%) | 39 (14.1%) |
| 55 to 59 Years | 47 (28.8%) | 4 (1.4%) |
| 60 to 64 Years | 0 (0.0%) | 0 (0.0%) |
| 65 to 69 Years | 11 (6.8%) | 22 (7.9%) |
| 70 to 74 Years | 0 (0.0%) | 38 (13.7%) |
| 75 to 79 Years | 13 (8.0%) | 0 (0.0%) |
| 80 to 84 Years | 0 (0.0%) | 24 (8.7%) |
| 85 Years and over | 0 (0.0%) | 0 (0.0%) |
| Total | 163 (100.0%) | 277 (100.0%) |
Families and Households in Middleway
Median Family Size in Middleway
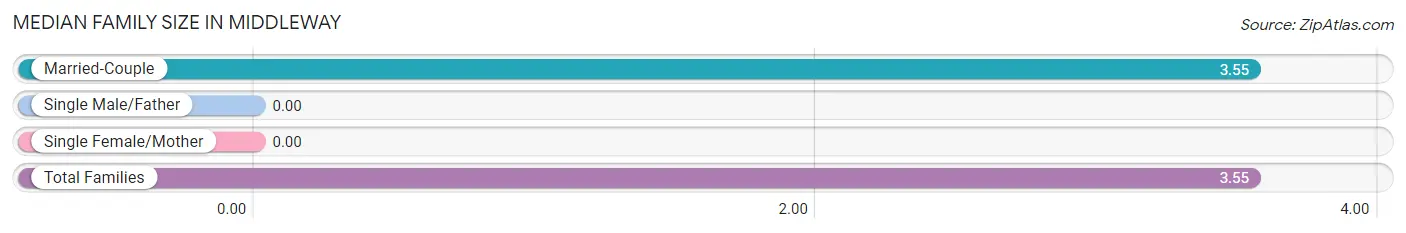
| Family Type | # Families | Family Size |
| Married-Couple | 107 (100.0%) | 3.55 |
| Single Male/Father | 0 (0.0%) | - |
| Single Female/Mother | 0 (0.0%) | - |
| Total Families | 107 (100.0%) | 3.55 |
Median Household Size in Middleway
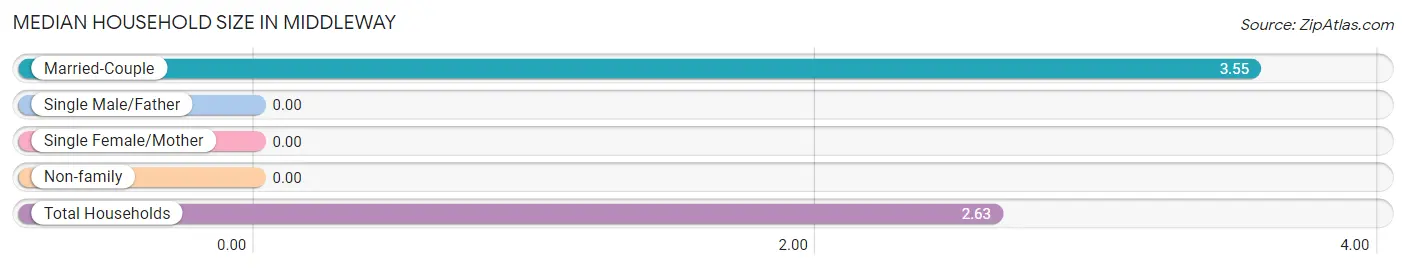
| Household Type | # Households | Household Size |
| Married-Couple | 107 (64.1%) | 3.55 |
| Single Male/Father | 0 (0.0%) | - |
| Single Female/Mother | 0 (0.0%) | - |
| Non-family | 60 (35.9%) | - |
| Total Households | 167 (100.0%) | 2.63 |
Household Size by Marriage Status in Middleway
Out of a total of 167 households in Middleway, 107 (64.1%) are family households, while 60 (35.9%) are nonfamily households. The most numerous type of family households are 2-person households, comprising 59, and the most common type of nonfamily households are 1-person households, comprising 60.
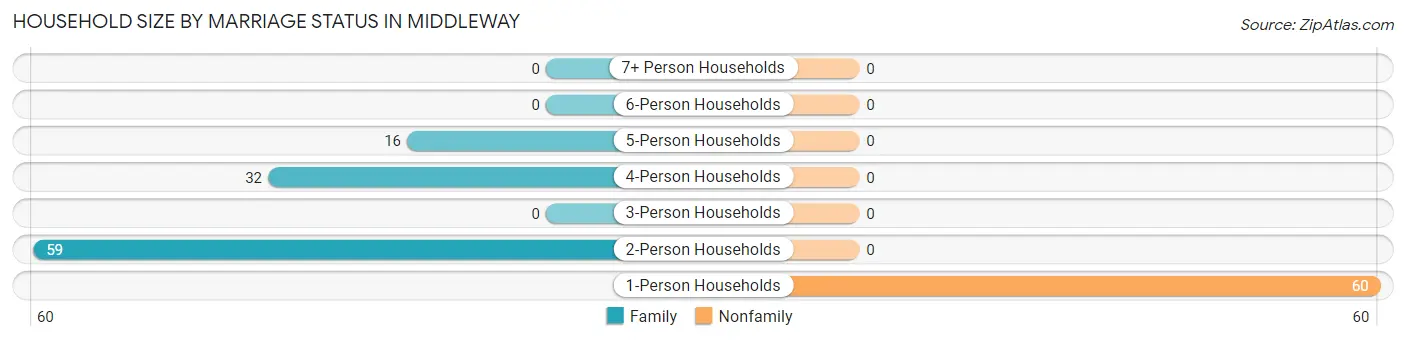
| Household Size | Family Households | Nonfamily Households |
| 1-Person Households | - | 60 (35.9%) |
| 2-Person Households | 59 (35.3%) | 0 (0.0%) |
| 3-Person Households | 0 (0.0%) | 0 (0.0%) |
| 4-Person Households | 32 (19.2%) | 0 (0.0%) |
| 5-Person Households | 16 (9.6%) | 0 (0.0%) |
| 6-Person Households | 0 (0.0%) | 0 (0.0%) |
| 7+ Person Households | 0 (0.0%) | 0 (0.0%) |
| Total | 107 (64.1%) | 60 (35.9%) |
Female Fertility in Middleway
Fertility by Age in Middleway
| Age Bracket | Women with Births | Births / 1,000 Women |
| 15 to 19 years | 0 (0.0%) | 0.0 |
| 20 to 34 years | 0 (0.0%) | 0.0 |
| 35 to 50 years | 0 (0.0%) | 0.0 |
| Total | 0 (0.0%) | 0.0 |
Fertility by Age by Marriage Status in Middleway
| Age Bracket | Married | Unmarried |
| 15 to 19 years | 0 (0.0%) | 0 (0.0%) |
| 20 to 34 years | 0 (0.0%) | 0 (0.0%) |
| 35 to 50 years | 0 (0.0%) | 0 (0.0%) |
| Total | 0 (0.0%) | 0 (0.0%) |
Fertility by Education in Middleway
| Educational Attainment | Women with Births | Births / 1,000 Women |
| Less than High School | 0 (0.0%) | 0.0 |
| High School Diploma | 0 (0.0%) | 0.0 |
| College or Associate's Degree | 0 (0.0%) | 0.0 |
| Bachelor's Degree | 0 (0.0%) | 0.0 |
| Graduate Degree | 0 (0.0%) | 0.0 |
| Total | 0 (0.0%) | 0.0 |
Fertility by Education by Marriage Status in Middleway
| Educational Attainment | Married | Unmarried |
| Less than High School | 0 (0.0%) | 0 (0.0%) |
| High School Diploma | 0 (0.0%) | 0 (0.0%) |
| College or Associate's Degree | 0 (0.0%) | 0 (0.0%) |
| Bachelor's Degree | 0 (0.0%) | 0 (0.0%) |
| Graduate Degree | 0 (0.0%) | 0 (0.0%) |
| Total | 0 (0.0%) | 0 (0.0%) |
Employment Characteristics in Middleway
Employment by Class of Employer in Middleway
Among the 272 employed individuals in Middleway, private company employees (64 | 23.5%), self-employed (incorporated) (56 | 20.6%), and self-employed (not incorporated) (52 | 19.1%) make up the most common classes of employment.
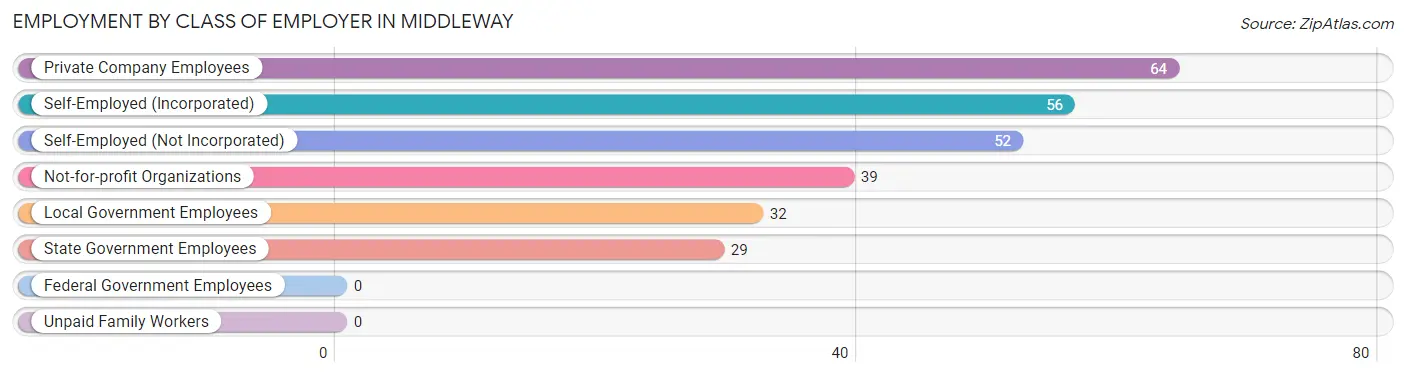
| Employer Class | # Employees | % Employees |
| Private Company Employees | 64 | 23.5% |
| Self-Employed (Incorporated) | 56 | 20.6% |
| Self-Employed (Not Incorporated) | 52 | 19.1% |
| Not-for-profit Organizations | 39 | 14.3% |
| Local Government Employees | 32 | 11.8% |
| State Government Employees | 29 | 10.7% |
| Federal Government Employees | 0 | 0.0% |
| Unpaid Family Workers | 0 | 0.0% |
| Total | 272 | 100.0% |
Employment Status by Age in Middleway
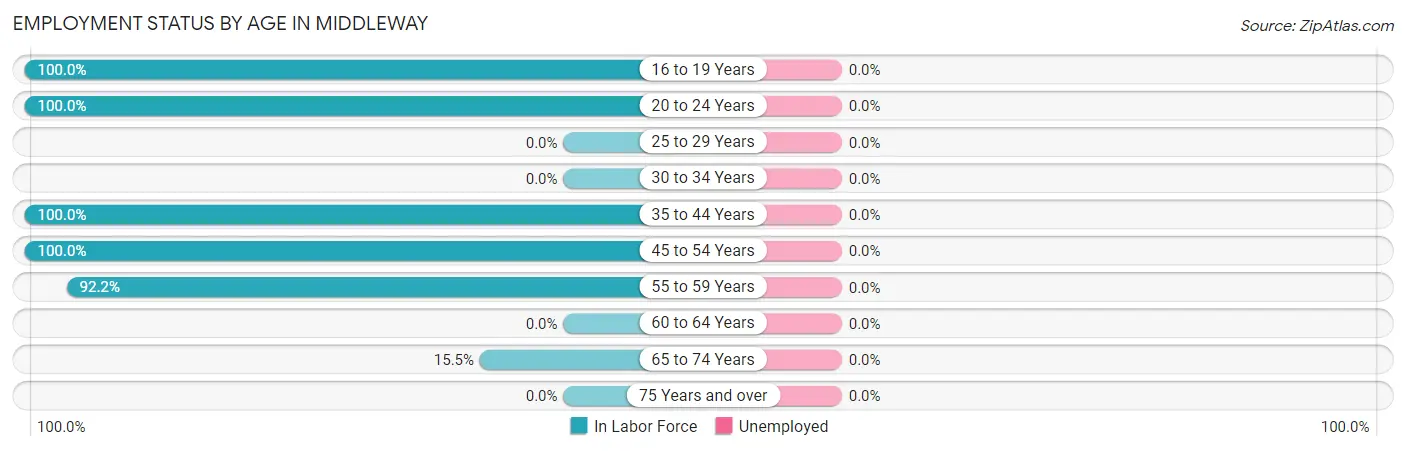
| Age Bracket | In Labor Force | Unemployed |
| 16 to 19 Years | 29 (100.0%) | 0 (0.0%) |
| 20 to 24 Years | 48 (100.0%) | 0 (0.0%) |
| 25 to 29 Years | 0 (0.0%) | 0 (0.0%) |
| 30 to 34 Years | 0 (0.0%) | 0 (0.0%) |
| 35 to 44 Years | 68 (100.0%) | 0 (0.0%) |
| 45 to 54 Years | 69 (100.0%) | 0 (0.0%) |
| 55 to 59 Years | 47 (92.2%) | 0 (0.0%) |
| 60 to 64 Years | 0 (0.0%) | 0 (0.0%) |
| 65 to 74 Years | 11 (15.5%) | 0 (0.0%) |
| 75 Years and over | 0 (0.0%) | 0 (0.0%) |
| Total | 272 (72.9%) | 0 (0.0%) |
Employment Status by Educational Attainment in Middleway
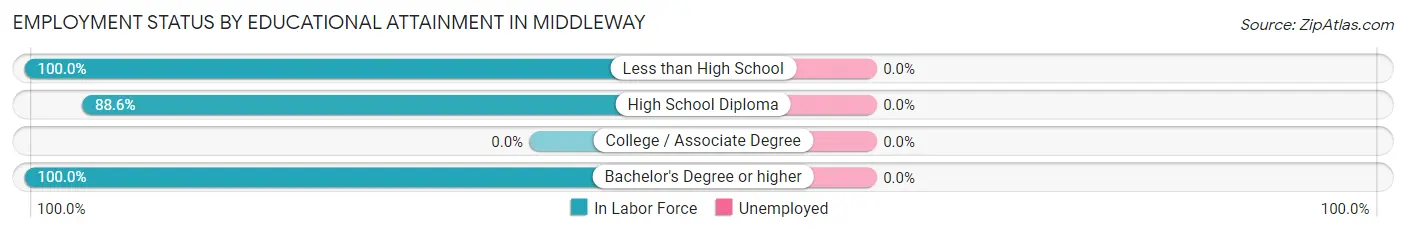
| Educational Attainment | In Labor Force | Unemployed |
| Less than High School | 5 (100.0%) | 0 (0.0%) |
| High School Diploma | 31 (88.6%) | 0 (0.0%) |
| College / Associate Degree | 0 (0.0%) | 0 (0.0%) |
| Bachelor's Degree or higher | 148 (100.0%) | 0 (0.0%) |
| Total | 184 (97.9%) | 0 (0.0%) |
Employment Occupations by Sex in Middleway
Management, Business, Science and Arts Occupations
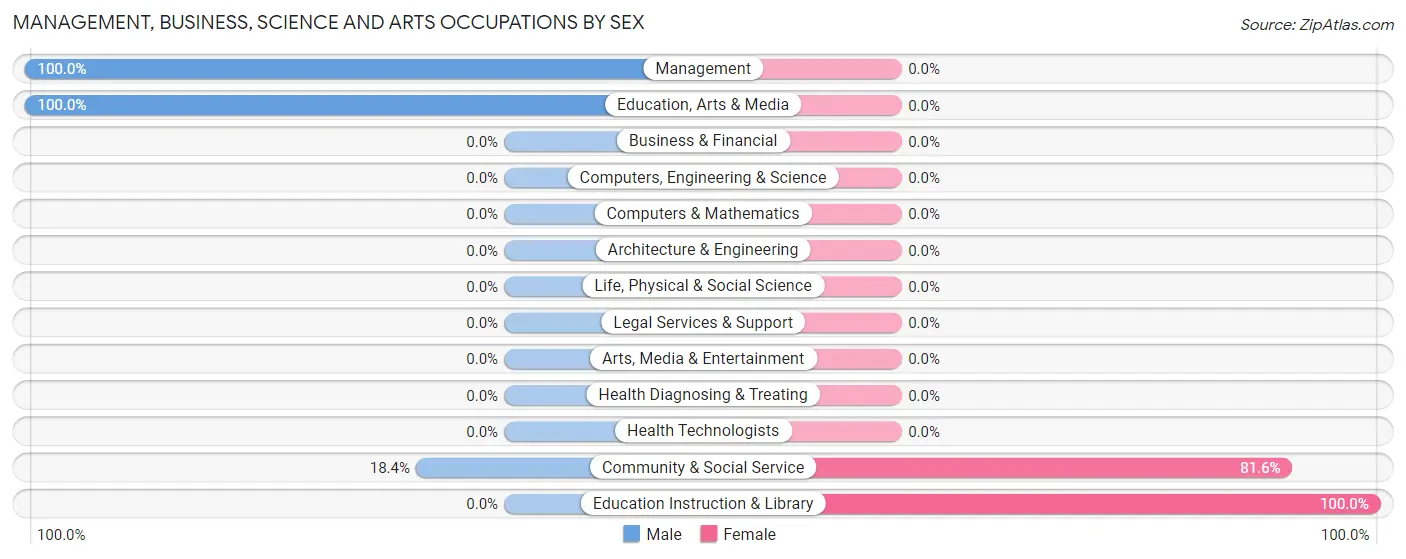
The most common Management, Business, Science and Arts occupations in Middleway are Community & Social Service (87 | 32.0%), Education Instruction & Library (71 | 26.1%), Education, Arts & Media (16 | 5.9%), and Management (5 | 1.8%).
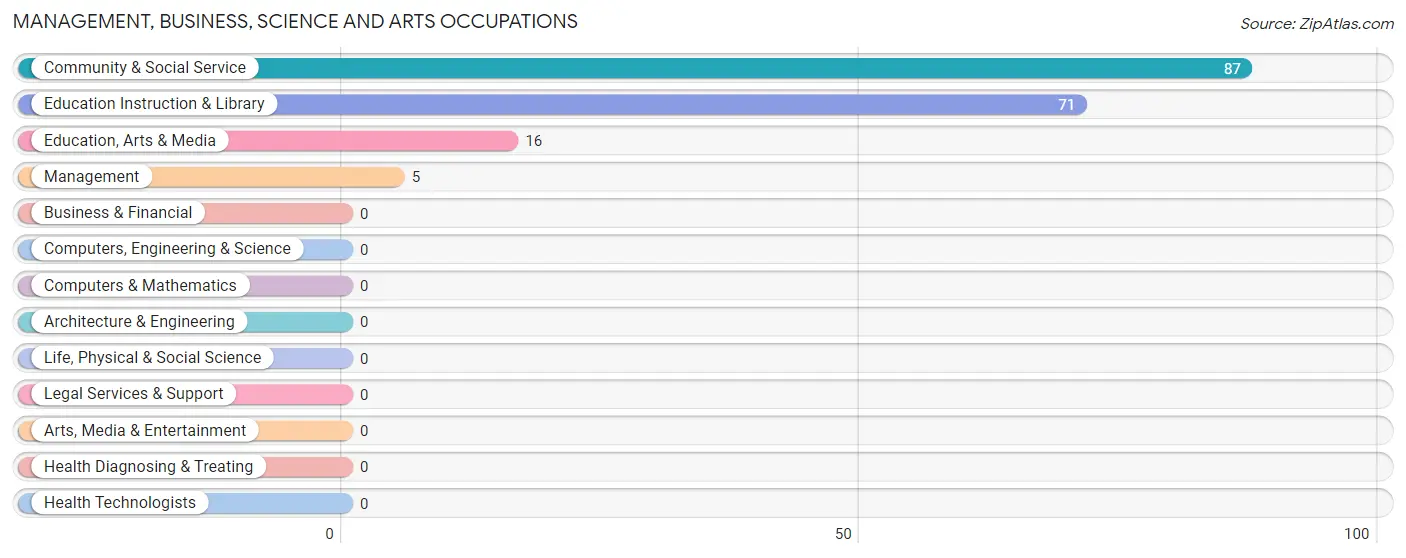
Management, Business, Science and Arts Occupations by Sex
Within the Management, Business, Science and Arts occupations in Middleway, the most male-oriented occupations are Management (100.0%), Education, Arts & Media (100.0%), and Community & Social Service (18.4%), while the most female-oriented occupations are Education Instruction & Library (100.0%), and Community & Social Service (81.6%).
| Occupation | Male | Female |
| Management | 5 (100.0%) | 0 (0.0%) |
| Business & Financial | 0 (0.0%) | 0 (0.0%) |
| Computers, Engineering & Science | 0 (0.0%) | 0 (0.0%) |
| Computers & Mathematics | 0 (0.0%) | 0 (0.0%) |
| Architecture & Engineering | 0 (0.0%) | 0 (0.0%) |
| Life, Physical & Social Science | 0 (0.0%) | 0 (0.0%) |
| Community & Social Service | 16 (18.4%) | 71 (81.6%) |
| Education, Arts & Media | 16 (100.0%) | 0 (0.0%) |
| Legal Services & Support | 0 (0.0%) | 0 (0.0%) |
| Education Instruction & Library | 0 (0.0%) | 71 (100.0%) |
| Arts, Media & Entertainment | 0 (0.0%) | 0 (0.0%) |
| Health Diagnosing & Treating | 0 (0.0%) | 0 (0.0%) |
| Health Technologists | 0 (0.0%) | 0 (0.0%) |
| Total (Category) | 21 (22.8%) | 71 (77.2%) |
| Total (Overall) | 105 (38.6%) | 167 (61.4%) |
Services Occupations
The most common Services occupations in Middleway are , and Cleaning & Maintenance (36 | 13.2%).
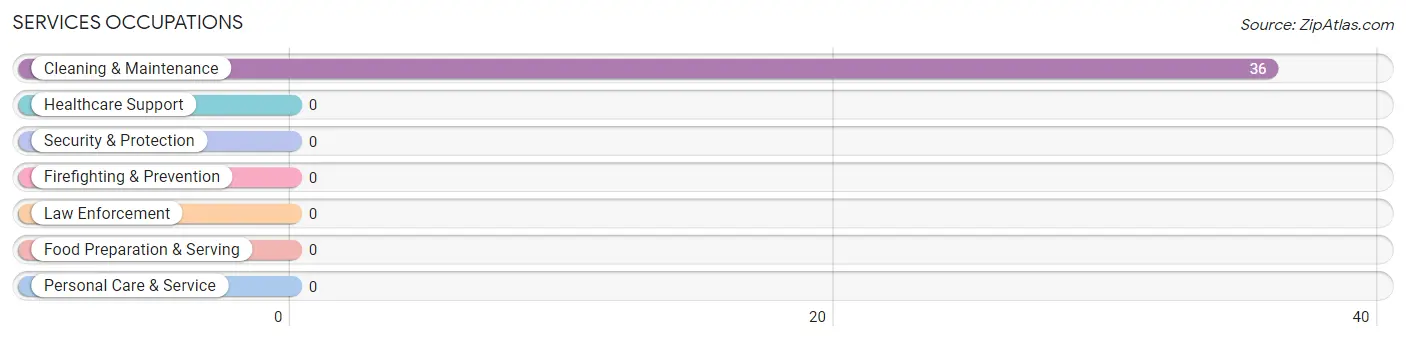
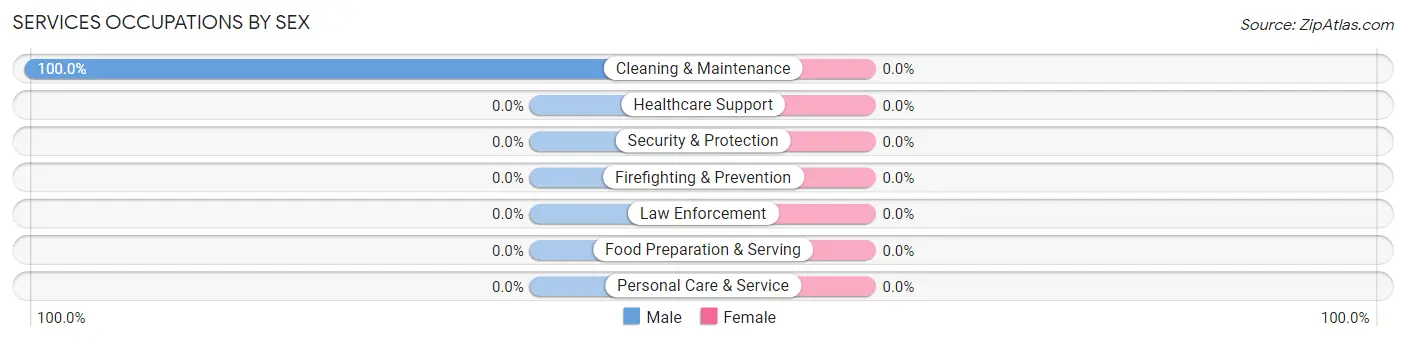
Services Occupations by Sex
| Occupation | Male | Female |
| Healthcare Support | 0 (0.0%) | 0 (0.0%) |
| Security & Protection | 0 (0.0%) | 0 (0.0%) |
| Firefighting & Prevention | 0 (0.0%) | 0 (0.0%) |
| Law Enforcement | 0 (0.0%) | 0 (0.0%) |
| Food Preparation & Serving | 0 (0.0%) | 0 (0.0%) |
| Cleaning & Maintenance | 36 (100.0%) | 0 (0.0%) |
| Personal Care & Service | 0 (0.0%) | 0 (0.0%) |
| Total (Category) | 36 (100.0%) | 0 (0.0%) |
| Total (Overall) | 105 (38.6%) | 167 (61.4%) |
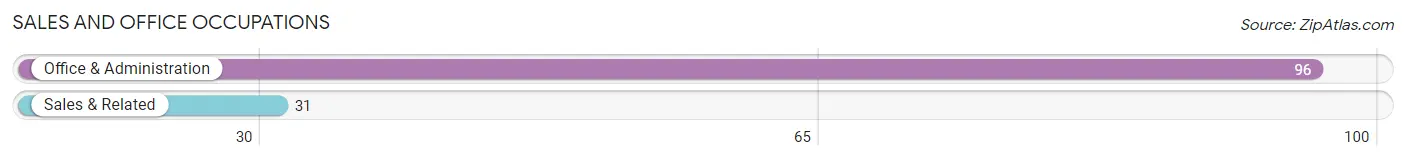
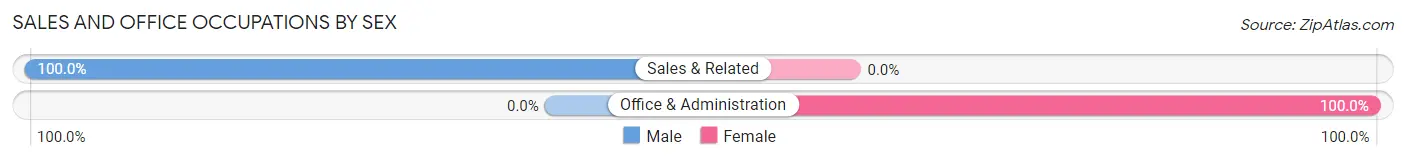
Sales and Office Occupations
The most common Sales and Office occupations in Middleway are Office & Administration (96 | 35.3%), and Sales & Related (31 | 11.4%).
Sales and Office Occupations by Sex
| Occupation | Male | Female |
| Sales & Related | 31 (100.0%) | 0 (0.0%) |
| Office & Administration | 0 (0.0%) | 96 (100.0%) |
| Total (Category) | 31 (24.4%) | 96 (75.6%) |
| Total (Overall) | 105 (38.6%) | 167 (61.4%) |
Natural Resources, Construction and Maintenance Occupations
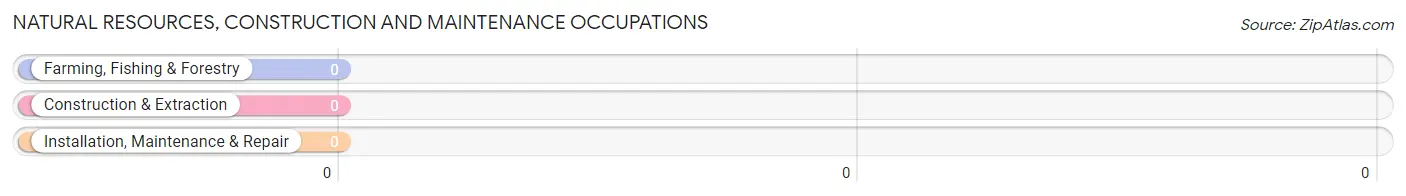
Natural Resources, Construction and Maintenance Occupations by Sex
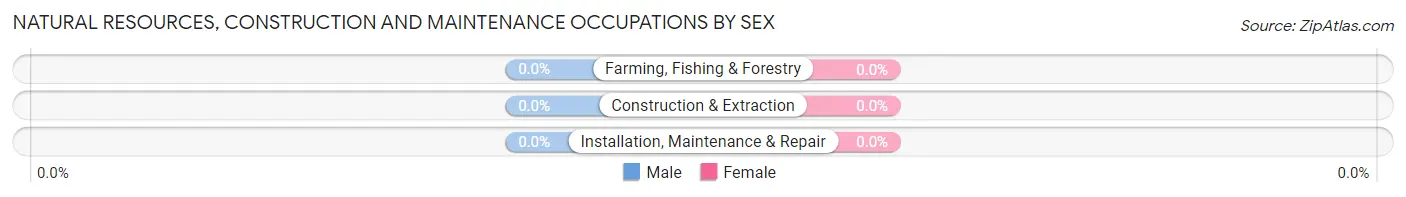
| Occupation | Male | Female |
| Farming, Fishing & Forestry | 0 (0.0%) | 0 (0.0%) |
| Construction & Extraction | 0 (0.0%) | 0 (0.0%) |
| Installation, Maintenance & Repair | 0 (0.0%) | 0 (0.0%) |
| Total (Category) | 0 (0.0%) | 0 (0.0%) |
| Total (Overall) | 105 (38.6%) | 167 (61.4%) |
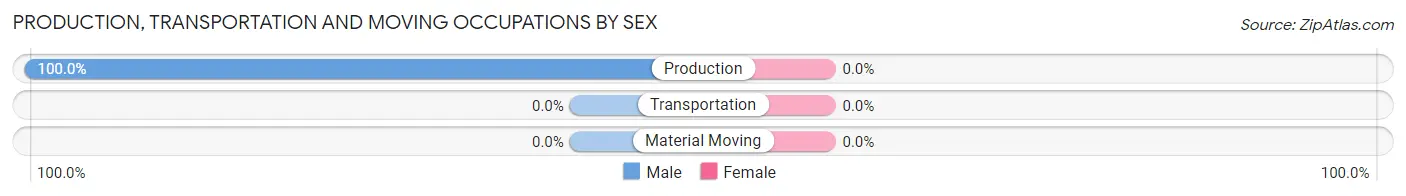
Production, Transportation and Moving Occupations
The most common Production, Transportation and Moving occupations in Middleway are , and Production (17 | 6.2%).
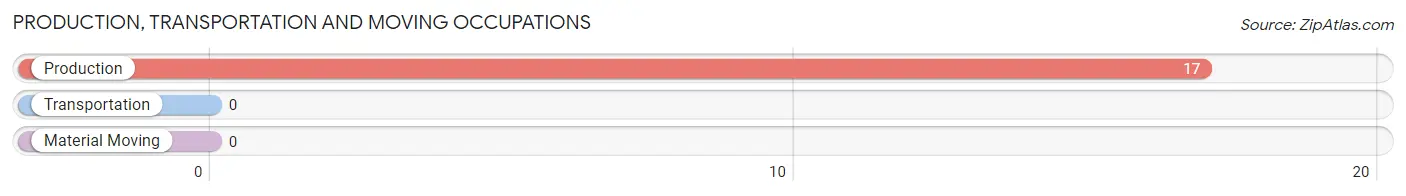
Production, Transportation and Moving Occupations by Sex
| Occupation | Male | Female |
| Production | 17 (100.0%) | 0 (0.0%) |
| Transportation | 0 (0.0%) | 0 (0.0%) |
| Material Moving | 0 (0.0%) | 0 (0.0%) |
| Total (Category) | 17 (100.0%) | 0 (0.0%) |
| Total (Overall) | 105 (38.6%) | 167 (61.4%) |
Employment Industries by Sex in Middleway
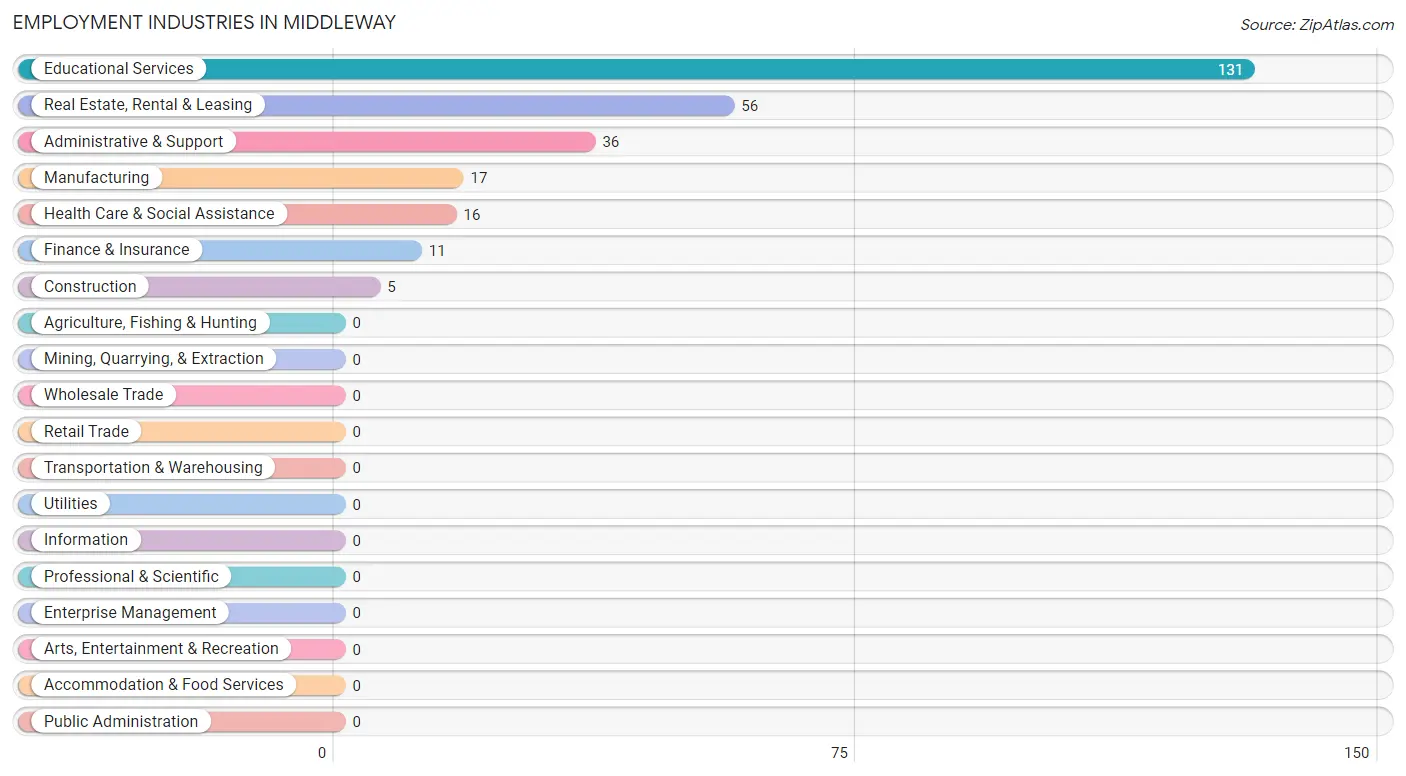
Employment Industries in Middleway
The major employment industries in Middleway include Educational Services (131 | 48.2%), Real Estate, Rental & Leasing (56 | 20.6%), Administrative & Support (36 | 13.2%), Manufacturing (17 | 6.2%), and Health Care & Social Assistance (16 | 5.9%).
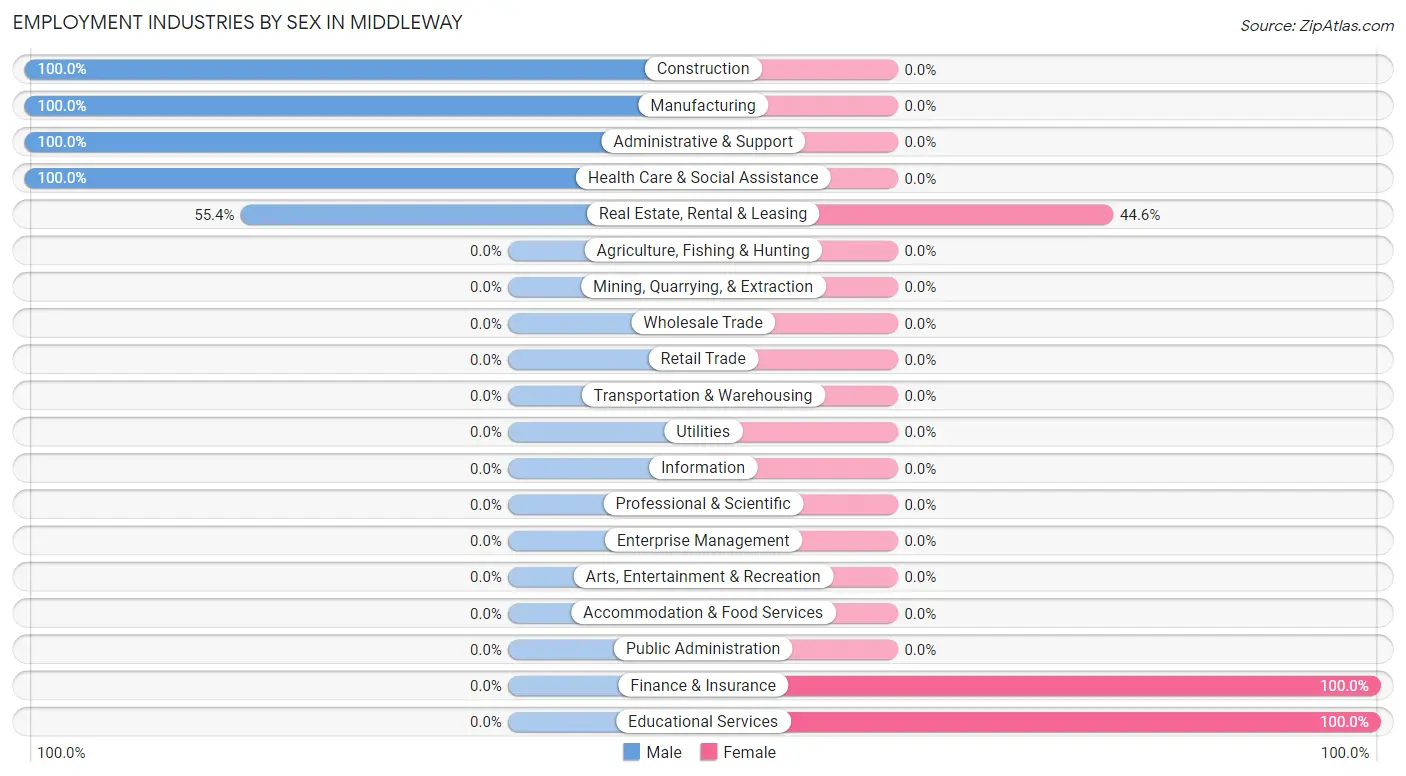
Employment Industries by Sex in Middleway
The Middleway industries that see more men than women are Construction (100.0%), Manufacturing (100.0%), and Administrative & Support (100.0%), whereas the industries that tend to have a higher number of women are Finance & Insurance (100.0%), Educational Services (100.0%), and Real Estate, Rental & Leasing (44.6%).
| Industry | Male | Female |
| Agriculture, Fishing & Hunting | 0 (0.0%) | 0 (0.0%) |
| Mining, Quarrying, & Extraction | 0 (0.0%) | 0 (0.0%) |
| Construction | 5 (100.0%) | 0 (0.0%) |
| Manufacturing | 17 (100.0%) | 0 (0.0%) |
| Wholesale Trade | 0 (0.0%) | 0 (0.0%) |
| Retail Trade | 0 (0.0%) | 0 (0.0%) |
| Transportation & Warehousing | 0 (0.0%) | 0 (0.0%) |
| Utilities | 0 (0.0%) | 0 (0.0%) |
| Information | 0 (0.0%) | 0 (0.0%) |
| Finance & Insurance | 0 (0.0%) | 11 (100.0%) |
| Real Estate, Rental & Leasing | 31 (55.4%) | 25 (44.6%) |
| Professional & Scientific | 0 (0.0%) | 0 (0.0%) |
| Enterprise Management | 0 (0.0%) | 0 (0.0%) |
| Administrative & Support | 36 (100.0%) | 0 (0.0%) |
| Educational Services | 0 (0.0%) | 131 (100.0%) |
| Health Care & Social Assistance | 16 (100.0%) | 0 (0.0%) |
| Arts, Entertainment & Recreation | 0 (0.0%) | 0 (0.0%) |
| Accommodation & Food Services | 0 (0.0%) | 0 (0.0%) |
| Public Administration | 0 (0.0%) | 0 (0.0%) |
| Total | 105 (38.6%) | 167 (61.4%) |
Education in Middleway
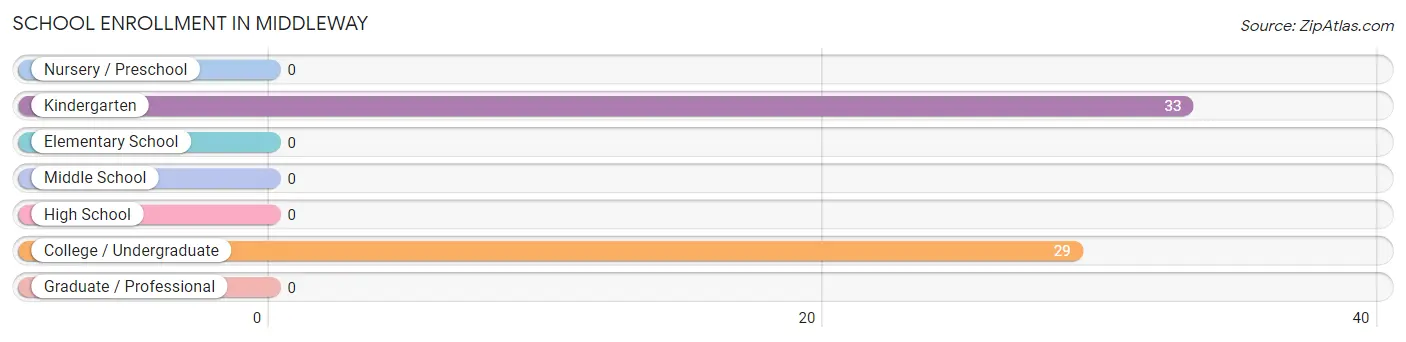
School Enrollment in Middleway
The most common levels of schooling among the 62 students in Middleway are kindergarten (33 | 53.2%), and college / undergraduate (29 | 46.8%).
| School Level | # Students | % Students |
| Nursery / Preschool | 0 | 0.0% |
| Kindergarten | 33 | 53.2% |
| Elementary School | 0 | 0.0% |
| Middle School | 0 | 0.0% |
| High School | 0 | 0.0% |
| College / Undergraduate | 29 | 46.8% |
| Graduate / Professional | 0 | 0.0% |
| Total | 62 | 100.0% |
School Enrollment by Age by Funding Source in Middleway
Out of a total of 62 students who are enrolled in schools in Middleway, 33 (53.2%) attend a private institution, while the remaining 29 (46.8%) are enrolled in public schools. The age group of 5 to 9 year old has the highest likelihood of being enrolled in private schools, with 33 (100.0% in the age bracket) enrolled. Conversely, the age group of 18 to 19 year olds has the lowest likelihood of being enrolled in a private school, with 29 (100.0% in the age bracket) attending a public institution.
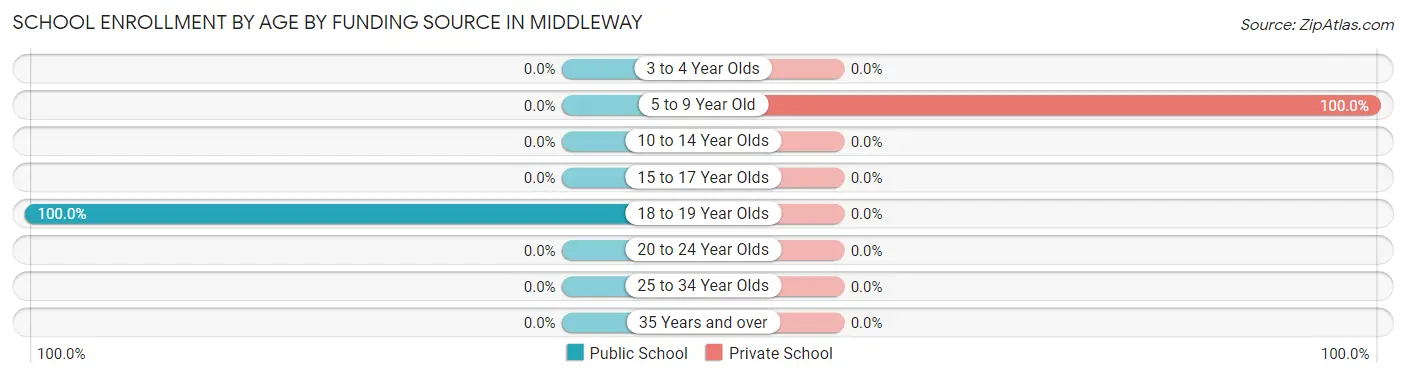
| Age Bracket | Public School | Private School |
| 3 to 4 Year Olds | 0 (0.0%) | 0 (0.0%) |
| 5 to 9 Year Old | 0 (0.0%) | 33 (100.0%) |
| 10 to 14 Year Olds | 0 (0.0%) | 0 (0.0%) |
| 15 to 17 Year Olds | 0 (0.0%) | 0 (0.0%) |
| 18 to 19 Year Olds | 29 (100.0%) | 0 (0.0%) |
| 20 to 24 Year Olds | 0 (0.0%) | 0 (0.0%) |
| 25 to 34 Year Olds | 0 (0.0%) | 0 (0.0%) |
| 35 Years and over | 0 (0.0%) | 0 (0.0%) |
| Total | 29 (46.8%) | 33 (53.2%) |
Educational Attainment by Field of Study in Middleway
Education (74 | 31.9%), bio, nature & agricultural (68 | 29.3%), social sciences (50 | 21.5%), psychology (16 | 6.9%), and engineering (13 | 5.6%) are the most common fields of study among 232 individuals in Middleway who have obtained a bachelor's degree or higher.
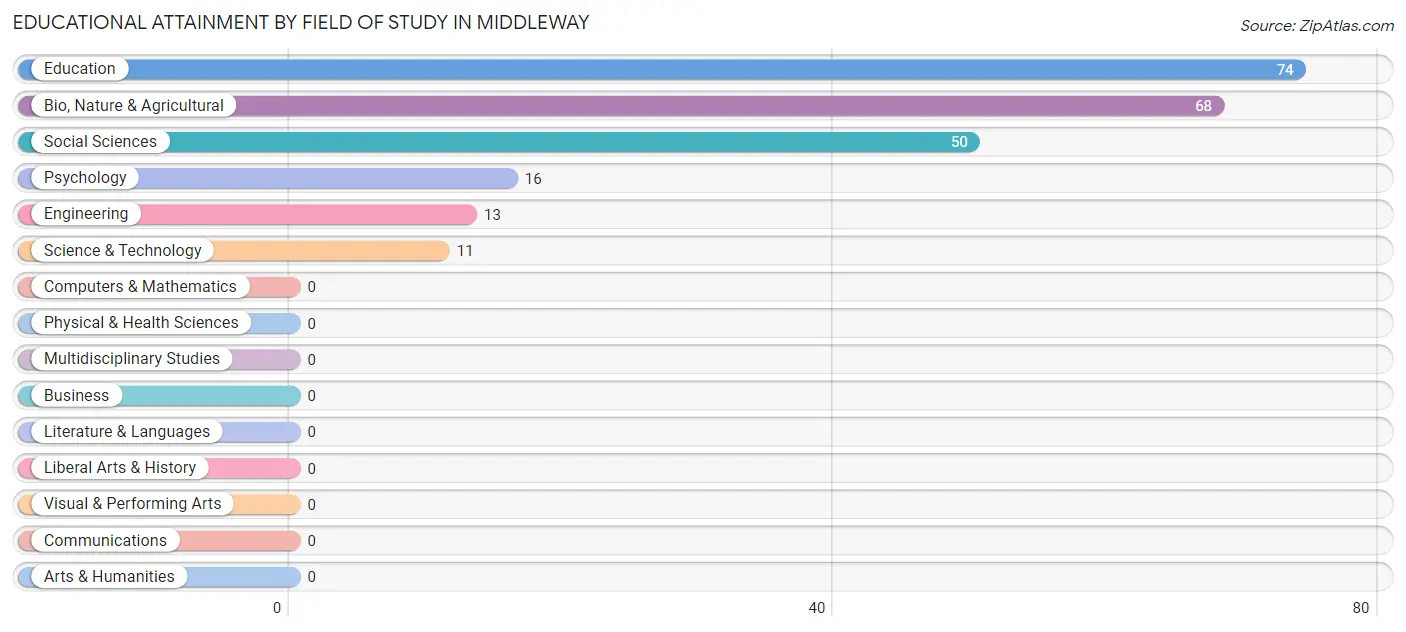
| Field of Study | # Graduates | % Graduates |
| Computers & Mathematics | 0 | 0.0% |
| Bio, Nature & Agricultural | 68 | 29.3% |
| Physical & Health Sciences | 0 | 0.0% |
| Psychology | 16 | 6.9% |
| Social Sciences | 50 | 21.5% |
| Engineering | 13 | 5.6% |
| Multidisciplinary Studies | 0 | 0.0% |
| Science & Technology | 11 | 4.7% |
| Business | 0 | 0.0% |
| Education | 74 | 31.9% |
| Literature & Languages | 0 | 0.0% |
| Liberal Arts & History | 0 | 0.0% |
| Visual & Performing Arts | 0 | 0.0% |
| Communications | 0 | 0.0% |
| Arts & Humanities | 0 | 0.0% |
| Total | 232 | 100.0% |
Transportation & Commute in Middleway
Vehicle Availability by Sex in Middleway
The most prevalent vehicle ownership categories in Middleway are males with 3 vehicles (41, accounting for 39.1%) and females with 3 vehicles (32, making up 24.5%).
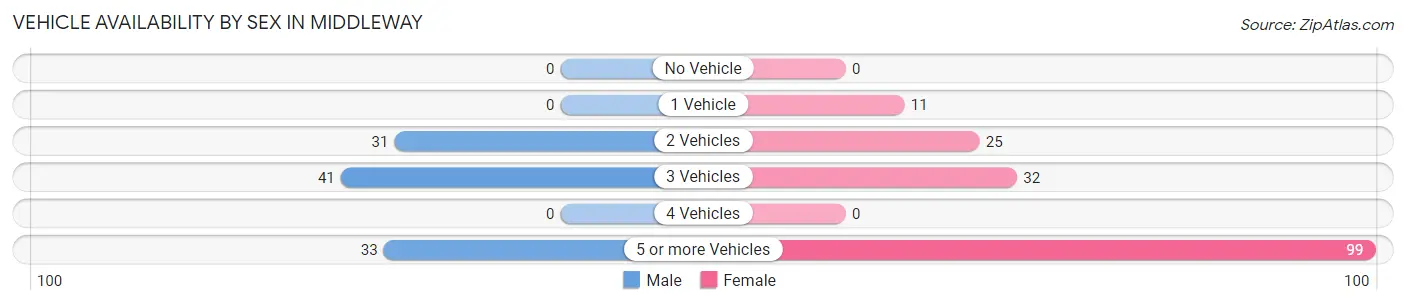
| Vehicles Available | Male | Female |
| No Vehicle | 0 (0.0%) | 0 (0.0%) |
| 1 Vehicle | 0 (0.0%) | 11 (6.6%) |
| 2 Vehicles | 31 (29.5%) | 25 (15.0%) |
| 3 Vehicles | 41 (39.1%) | 32 (19.2%) |
| 4 Vehicles | 0 (0.0%) | 0 (0.0%) |
| 5 or more Vehicles | 33 (31.4%) | 99 (59.3%) |
| Total | 105 (100.0%) | 167 (100.0%) |
Commute Time in Middleway
The most frequently occuring commute durations in Middleway are 15 to 19 minutes (87 commuters, 36.1%), 10 to 14 minutes (56 commuters, 23.2%), and 25 to 29 minutes (40 commuters, 16.6%).
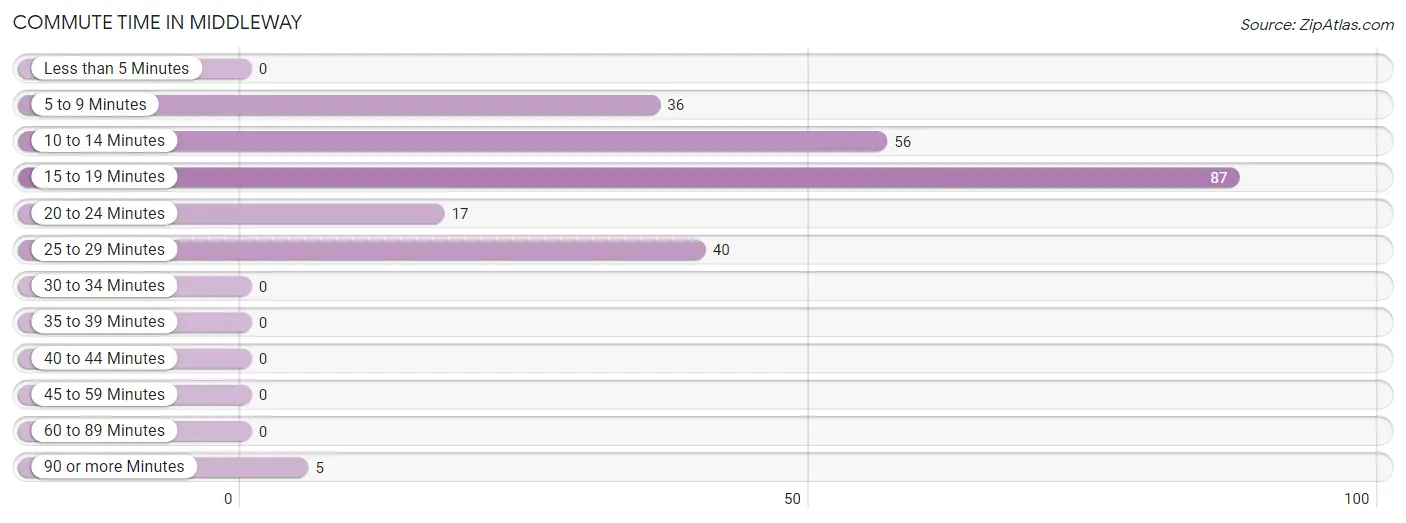
| Commute Time | # Commuters | % Commuters |
| Less than 5 Minutes | 0 | 0.0% |
| 5 to 9 Minutes | 36 | 14.9% |
| 10 to 14 Minutes | 56 | 23.2% |
| 15 to 19 Minutes | 87 | 36.1% |
| 20 to 24 Minutes | 17 | 7.0% |
| 25 to 29 Minutes | 40 | 16.6% |
| 30 to 34 Minutes | 0 | 0.0% |
| 35 to 39 Minutes | 0 | 0.0% |
| 40 to 44 Minutes | 0 | 0.0% |
| 45 to 59 Minutes | 0 | 0.0% |
| 60 to 89 Minutes | 0 | 0.0% |
| 90 or more Minutes | 5 | 2.1% |
Commute Time by Sex in Middleway
The most common commute times in Middleway are 5 to 9 minutes (36 commuters, 34.3%) for males and 15 to 19 minutes (71 commuters, 52.2%) for females.
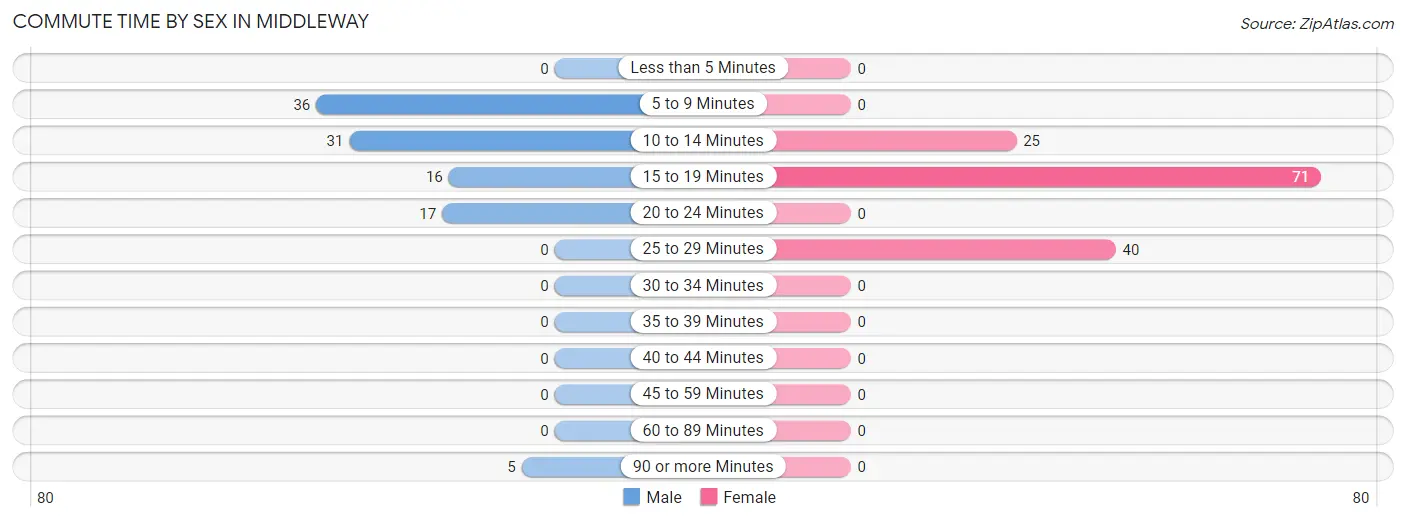
| Commute Time | Male | Female |
| Less than 5 Minutes | 0 (0.0%) | 0 (0.0%) |
| 5 to 9 Minutes | 36 (34.3%) | 0 (0.0%) |
| 10 to 14 Minutes | 31 (29.5%) | 25 (18.4%) |
| 15 to 19 Minutes | 16 (15.2%) | 71 (52.2%) |
| 20 to 24 Minutes | 17 (16.2%) | 0 (0.0%) |
| 25 to 29 Minutes | 0 (0.0%) | 40 (29.4%) |
| 30 to 34 Minutes | 0 (0.0%) | 0 (0.0%) |
| 35 to 39 Minutes | 0 (0.0%) | 0 (0.0%) |
| 40 to 44 Minutes | 0 (0.0%) | 0 (0.0%) |
| 45 to 59 Minutes | 0 (0.0%) | 0 (0.0%) |
| 60 to 89 Minutes | 0 (0.0%) | 0 (0.0%) |
| 90 or more Minutes | 5 (4.8%) | 0 (0.0%) |
Time of Departure to Work by Sex in Middleway
The most frequent times of departure to work in Middleway are 7:30 AM to 7:59 AM (83, 79.0%) for males and 4:00 PM to 11:59 PM (39, 28.7%) for females.
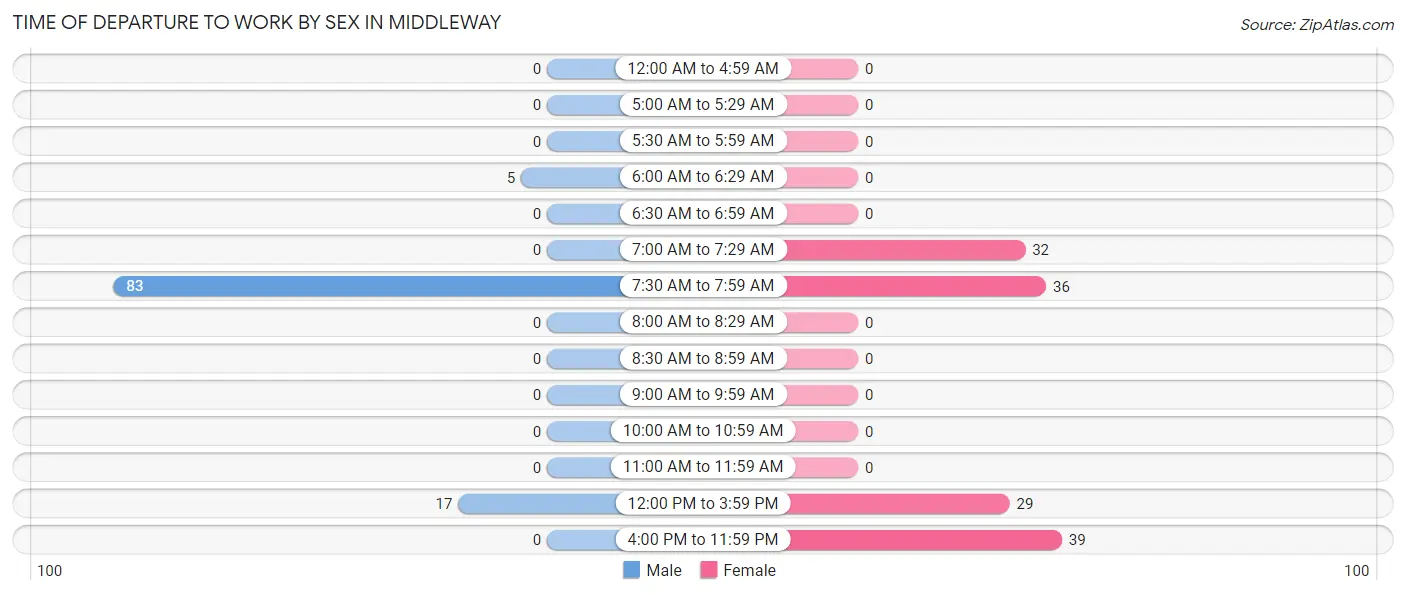
| Time of Departure | Male | Female |
| 12:00 AM to 4:59 AM | 0 (0.0%) | 0 (0.0%) |
| 5:00 AM to 5:29 AM | 0 (0.0%) | 0 (0.0%) |
| 5:30 AM to 5:59 AM | 0 (0.0%) | 0 (0.0%) |
| 6:00 AM to 6:29 AM | 5 (4.8%) | 0 (0.0%) |
| 6:30 AM to 6:59 AM | 0 (0.0%) | 0 (0.0%) |
| 7:00 AM to 7:29 AM | 0 (0.0%) | 32 (23.5%) |
| 7:30 AM to 7:59 AM | 83 (79.0%) | 36 (26.5%) |
| 8:00 AM to 8:29 AM | 0 (0.0%) | 0 (0.0%) |
| 8:30 AM to 8:59 AM | 0 (0.0%) | 0 (0.0%) |
| 9:00 AM to 9:59 AM | 0 (0.0%) | 0 (0.0%) |
| 10:00 AM to 10:59 AM | 0 (0.0%) | 0 (0.0%) |
| 11:00 AM to 11:59 AM | 0 (0.0%) | 0 (0.0%) |
| 12:00 PM to 3:59 PM | 17 (16.2%) | 29 (21.3%) |
| 4:00 PM to 11:59 PM | 0 (0.0%) | 39 (28.7%) |
| Total | 105 (100.0%) | 136 (100.0%) |
Housing Occupancy in Middleway
Occupancy by Ownership in Middleway
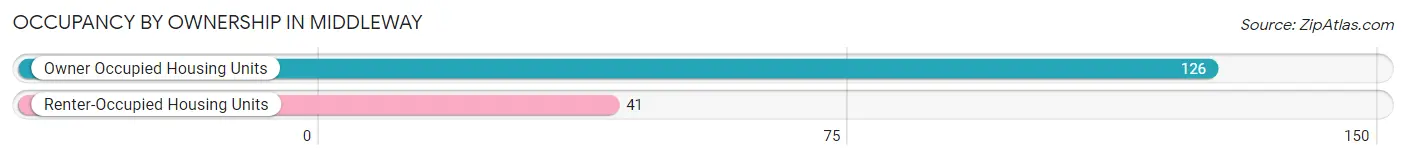
Of the total 167 dwellings in Middleway, owner-occupied units account for 126 (75.4%), while renter-occupied units make up 41 (24.5%).
| Occupancy | # Housing Units | % Housing Units |
| Owner Occupied Housing Units | 126 | 75.4% |
| Renter-Occupied Housing Units | 41 | 24.5% |
| Total Occupied Housing Units | 167 | 100.0% |
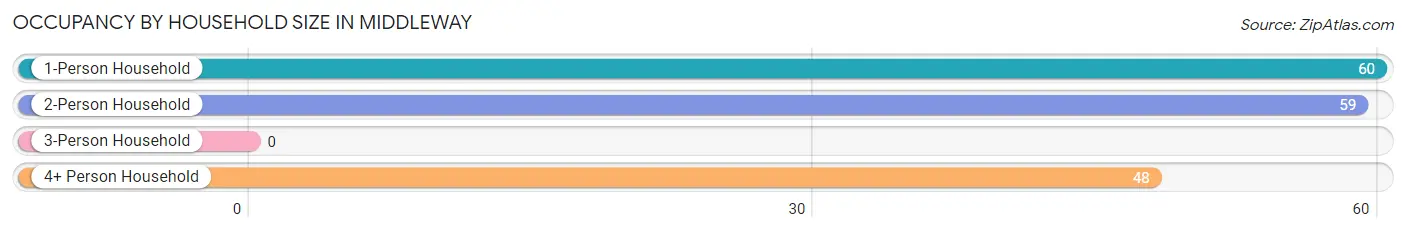
Occupancy by Household Size in Middleway
| Household Size | # Housing Units | % Housing Units |
| 1-Person Household | 60 | 35.9% |
| 2-Person Household | 59 | 35.3% |
| 3-Person Household | 0 | 0.0% |
| 4+ Person Household | 48 | 28.7% |
| Total Housing Units | 167 | 100.0% |
Occupancy by Ownership by Household Size in Middleway
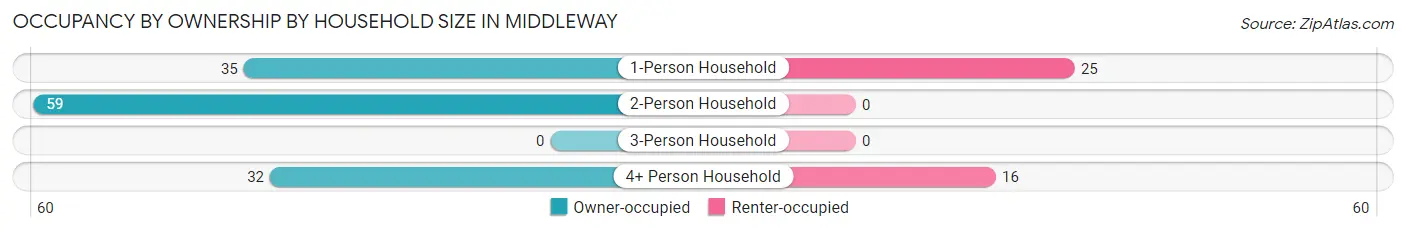
| Household Size | Owner-occupied | Renter-occupied |
| 1-Person Household | 35 (58.3%) | 25 (41.7%) |
| 2-Person Household | 59 (100.0%) | 0 (0.0%) |
| 3-Person Household | 0 (0.0%) | 0 (0.0%) |
| 4+ Person Household | 32 (66.7%) | 16 (33.3%) |
| Total Housing Units | 126 (75.4%) | 41 (24.5%) |
Occupancy by Educational Attainment in Middleway
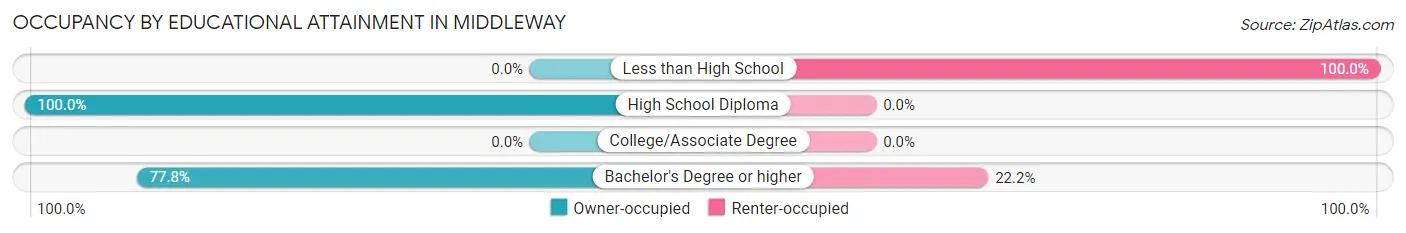
| Household Size | Owner-occupied | Renter-occupied |
| Less than High School | 0 (0.0%) | 25 (100.0%) |
| High School Diploma | 70 (100.0%) | 0 (0.0%) |
| College/Associate Degree | 0 (0.0%) | 0 (0.0%) |
| Bachelor's Degree or higher | 56 (77.8%) | 16 (22.2%) |
Occupancy by Age of Householder in Middleway
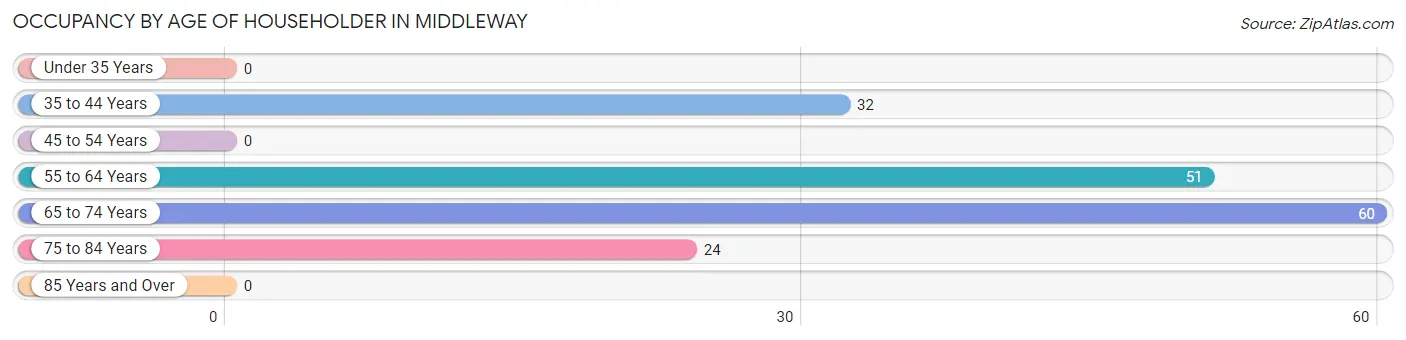
| Age Bracket | # Households | % Households |
| Under 35 Years | 0 | 0.0% |
| 35 to 44 Years | 32 | 19.2% |
| 45 to 54 Years | 0 | 0.0% |
| 55 to 64 Years | 51 | 30.5% |
| 65 to 74 Years | 60 | 35.9% |
| 75 to 84 Years | 24 | 14.4% |
| 85 Years and Over | 0 | 0.0% |
| Total | 167 | 100.0% |
Housing Finances in Middleway
Median Income by Occupancy in Middleway
| Occupancy Type | # Households | Median Income |
| Owner-Occupied | 126 (75.4%) | $0 |
| Renter-Occupied | 41 (24.5%) | $0 |
| Average | 167 (100.0%) | $0 |
Occupancy by Householder Income Bracket in Middleway
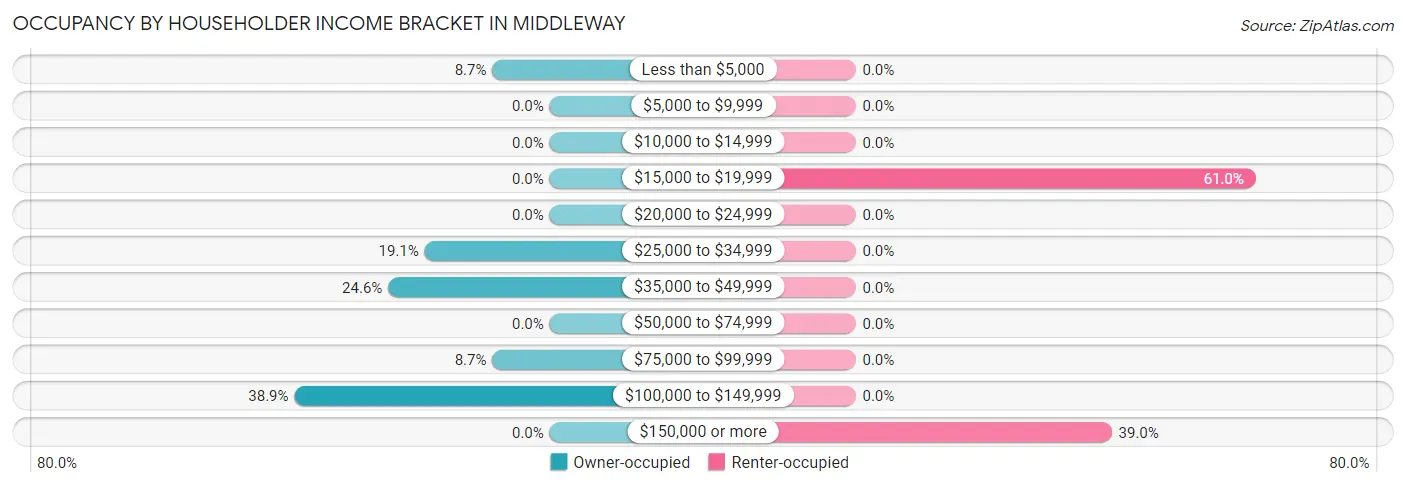
| Income Bracket | Owner-occupied | Renter-occupied |
| Less than $5,000 | 11 (8.7%) | 0 (0.0%) |
| $5,000 to $9,999 | 0 (0.0%) | 0 (0.0%) |
| $10,000 to $14,999 | 0 (0.0%) | 0 (0.0%) |
| $15,000 to $19,999 | 0 (0.0%) | 25 (61.0%) |
| $20,000 to $24,999 | 0 (0.0%) | 0 (0.0%) |
| $25,000 to $34,999 | 24 (19.1%) | 0 (0.0%) |
| $35,000 to $49,999 | 31 (24.6%) | 0 (0.0%) |
| $50,000 to $74,999 | 0 (0.0%) | 0 (0.0%) |
| $75,000 to $99,999 | 11 (8.7%) | 0 (0.0%) |
| $100,000 to $149,999 | 49 (38.9%) | 0 (0.0%) |
| $150,000 or more | 0 (0.0%) | 16 (39.0%) |
| Total | 126 (100.0%) | 41 (100.0%) |
Monthly Housing Cost Tiers in Middleway
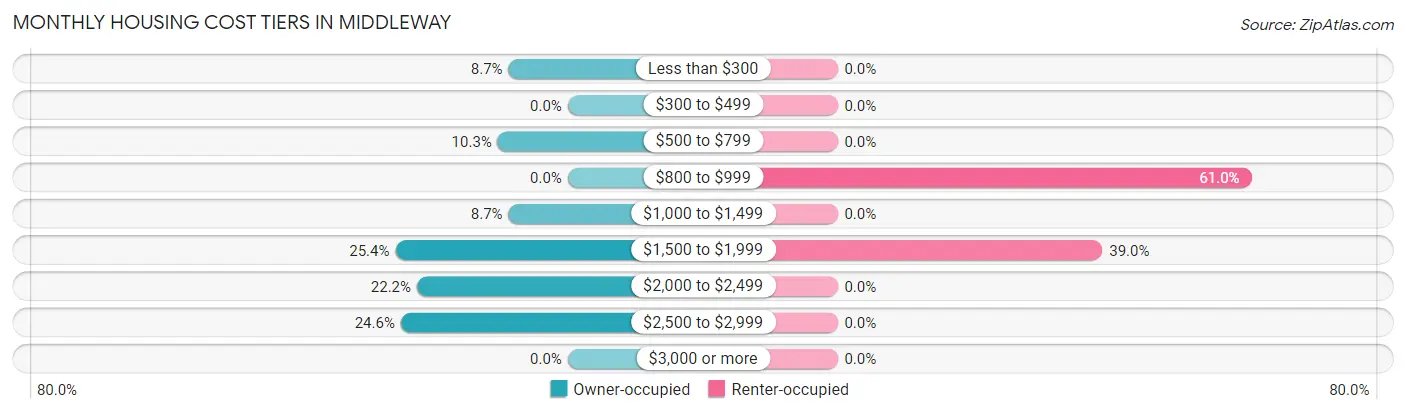
| Monthly Cost | Owner-occupied | Renter-occupied |
| Less than $300 | 11 (8.7%) | 0 (0.0%) |
| $300 to $499 | 0 (0.0%) | 0 (0.0%) |
| $500 to $799 | 13 (10.3%) | 0 (0.0%) |
| $800 to $999 | 0 (0.0%) | 25 (61.0%) |
| $1,000 to $1,499 | 11 (8.7%) | 0 (0.0%) |
| $1,500 to $1,999 | 32 (25.4%) | 16 (39.0%) |
| $2,000 to $2,499 | 28 (22.2%) | 0 (0.0%) |
| $2,500 to $2,999 | 31 (24.6%) | 0 (0.0%) |
| $3,000 or more | 0 (0.0%) | 0 (0.0%) |
| Total | 126 (100.0%) | 41 (100.0%) |
Physical Housing Characteristics in Middleway
Housing Structures in Middleway
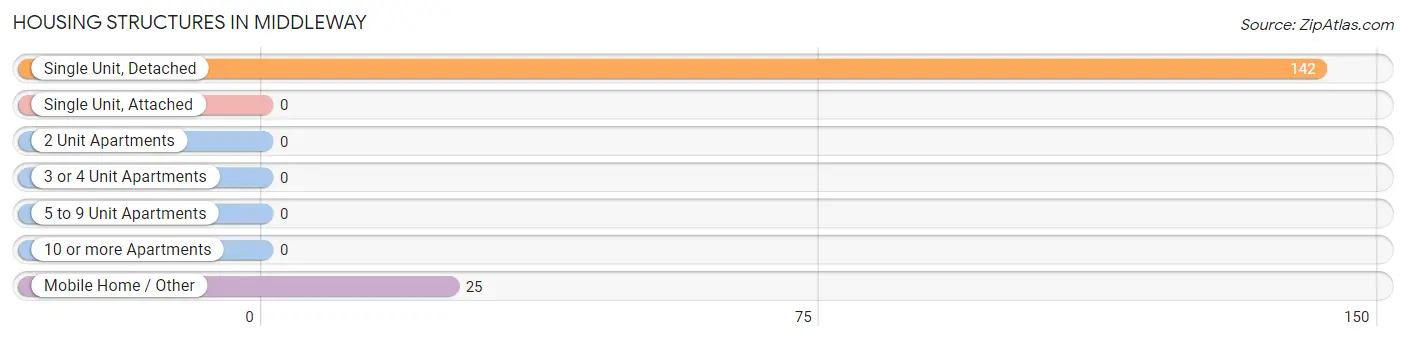
| Structure Type | # Housing Units | % Housing Units |
| Single Unit, Detached | 142 | 85.0% |
| Single Unit, Attached | 0 | 0.0% |
| 2 Unit Apartments | 0 | 0.0% |
| 3 or 4 Unit Apartments | 0 | 0.0% |
| 5 to 9 Unit Apartments | 0 | 0.0% |
| 10 or more Apartments | 0 | 0.0% |
| Mobile Home / Other | 25 | 15.0% |
| Total | 167 | 100.0% |
Housing Structures by Occupancy in Middleway
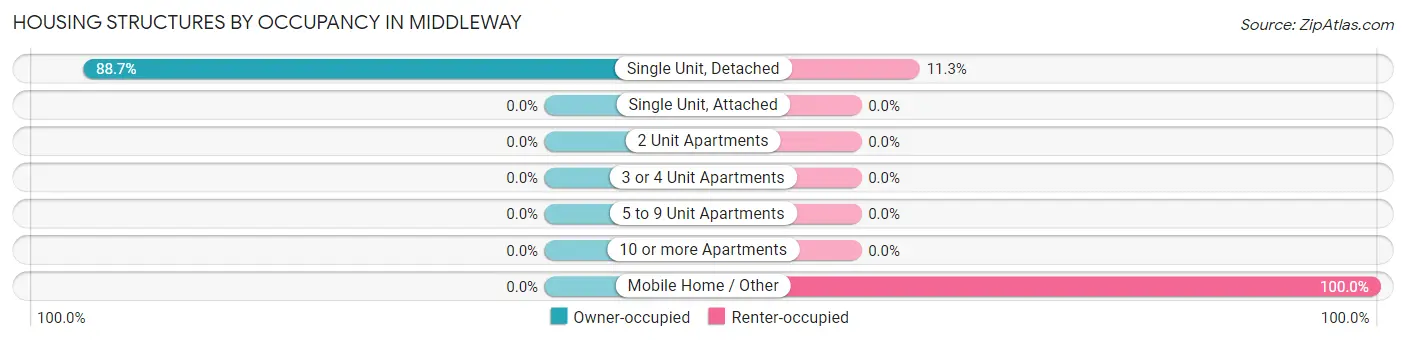
| Structure Type | Owner-occupied | Renter-occupied |
| Single Unit, Detached | 126 (88.7%) | 16 (11.3%) |
| Single Unit, Attached | 0 (0.0%) | 0 (0.0%) |
| 2 Unit Apartments | 0 (0.0%) | 0 (0.0%) |
| 3 or 4 Unit Apartments | 0 (0.0%) | 0 (0.0%) |
| 5 to 9 Unit Apartments | 0 (0.0%) | 0 (0.0%) |
| 10 or more Apartments | 0 (0.0%) | 0 (0.0%) |
| Mobile Home / Other | 0 (0.0%) | 25 (100.0%) |
| Total | 126 (75.4%) | 41 (24.5%) |
Housing Structures by Number of Rooms in Middleway
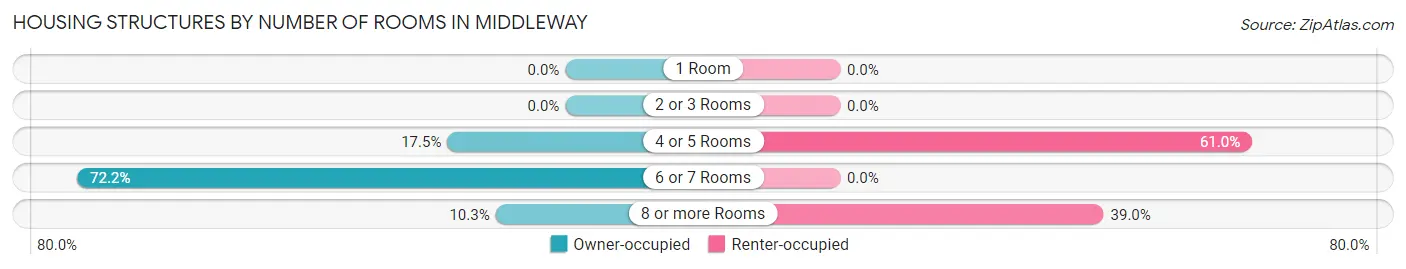
| Number of Rooms | Owner-occupied | Renter-occupied |
| 1 Room | 0 (0.0%) | 0 (0.0%) |
| 2 or 3 Rooms | 0 (0.0%) | 0 (0.0%) |
| 4 or 5 Rooms | 22 (17.5%) | 25 (61.0%) |
| 6 or 7 Rooms | 91 (72.2%) | 0 (0.0%) |
| 8 or more Rooms | 13 (10.3%) | 16 (39.0%) |
| Total | 126 (100.0%) | 41 (100.0%) |
Housing Structure by Heating Type in Middleway
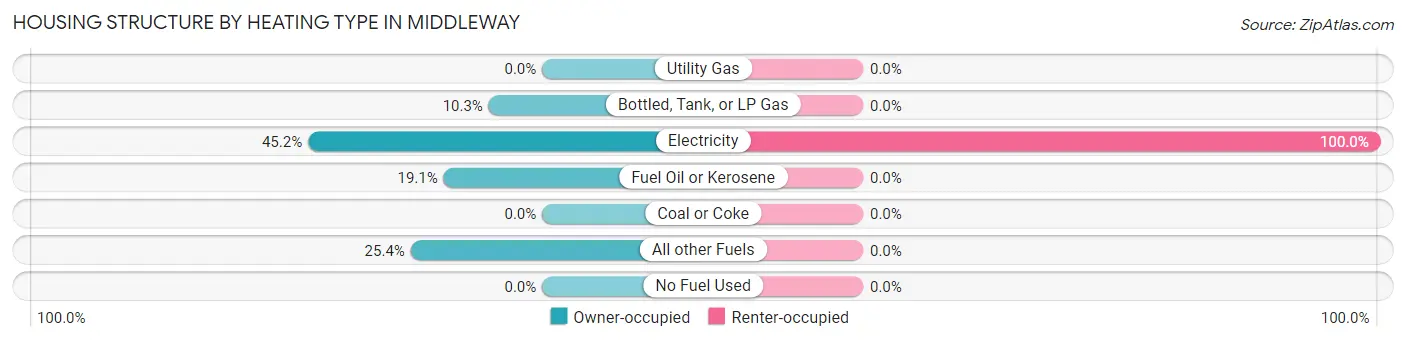
| Heating Type | Owner-occupied | Renter-occupied |
| Utility Gas | 0 (0.0%) | 0 (0.0%) |
| Bottled, Tank, or LP Gas | 13 (10.3%) | 0 (0.0%) |
| Electricity | 57 (45.2%) | 41 (100.0%) |
| Fuel Oil or Kerosene | 24 (19.1%) | 0 (0.0%) |
| Coal or Coke | 0 (0.0%) | 0 (0.0%) |
| All other Fuels | 32 (25.4%) | 0 (0.0%) |
| No Fuel Used | 0 (0.0%) | 0 (0.0%) |
| Total | 126 (100.0%) | 41 (100.0%) |
Household Vehicle Usage in Middleway
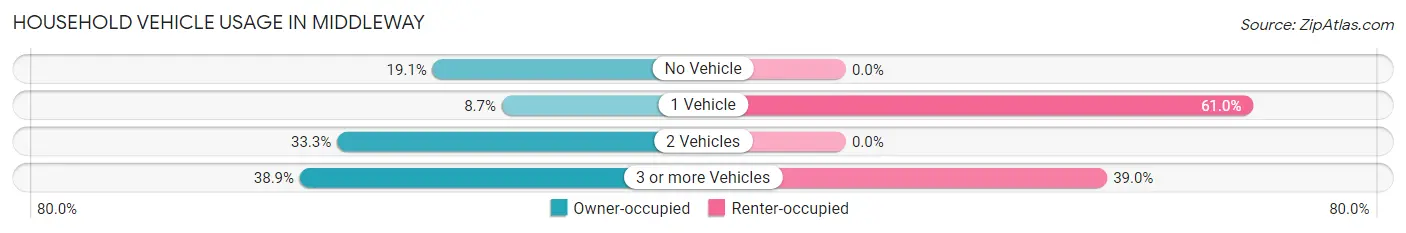
| Vehicles per Household | Owner-occupied | Renter-occupied |
| No Vehicle | 24 (19.1%) | 0 (0.0%) |
| 1 Vehicle | 11 (8.7%) | 25 (61.0%) |
| 2 Vehicles | 42 (33.3%) | 0 (0.0%) |
| 3 or more Vehicles | 49 (38.9%) | 16 (39.0%) |
| Total | 126 (100.0%) | 41 (100.0%) |
Real Estate & Mortgages in Middleway
Real Estate and Mortgage Overview in Middleway
| Characteristic | Without Mortgage | With Mortgage |
| Housing Units | 24 | 102 |
| Median Property Value | - | - |
| Median Household Income | - | - |
| Monthly Housing Costs | - | - |
| Real Estate Taxes | - | - |
Property Value by Mortgage Status in Middleway
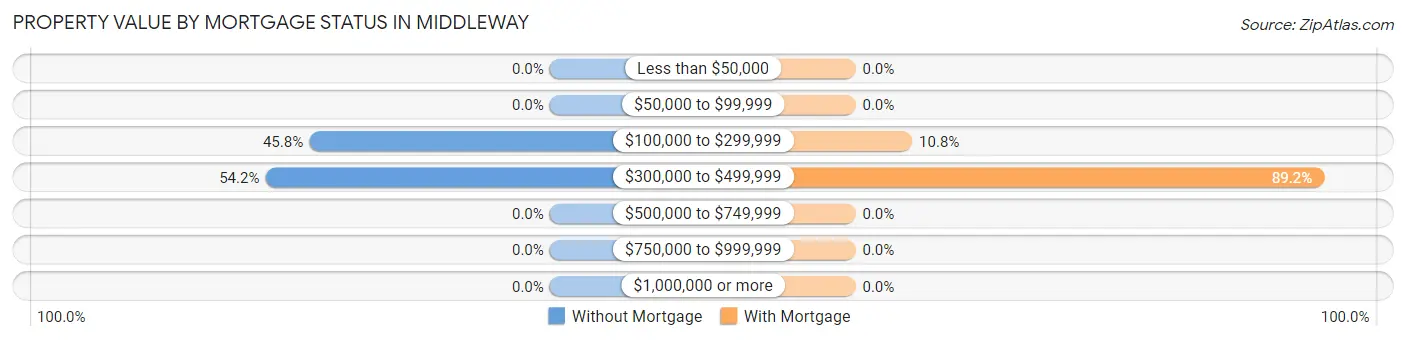
| Property Value | Without Mortgage | With Mortgage |
| Less than $50,000 | 0 (0.0%) | 0 (0.0%) |
| $50,000 to $99,999 | 0 (0.0%) | 0 (0.0%) |
| $100,000 to $299,999 | 11 (45.8%) | 11 (10.8%) |
| $300,000 to $499,999 | 13 (54.2%) | 91 (89.2%) |
| $500,000 to $749,999 | 0 (0.0%) | 0 (0.0%) |
| $750,000 to $999,999 | 0 (0.0%) | 0 (0.0%) |
| $1,000,000 or more | 0 (0.0%) | 0 (0.0%) |
| Total | 24 (100.0%) | 102 (100.0%) |
Household Income by Mortgage Status in Middleway
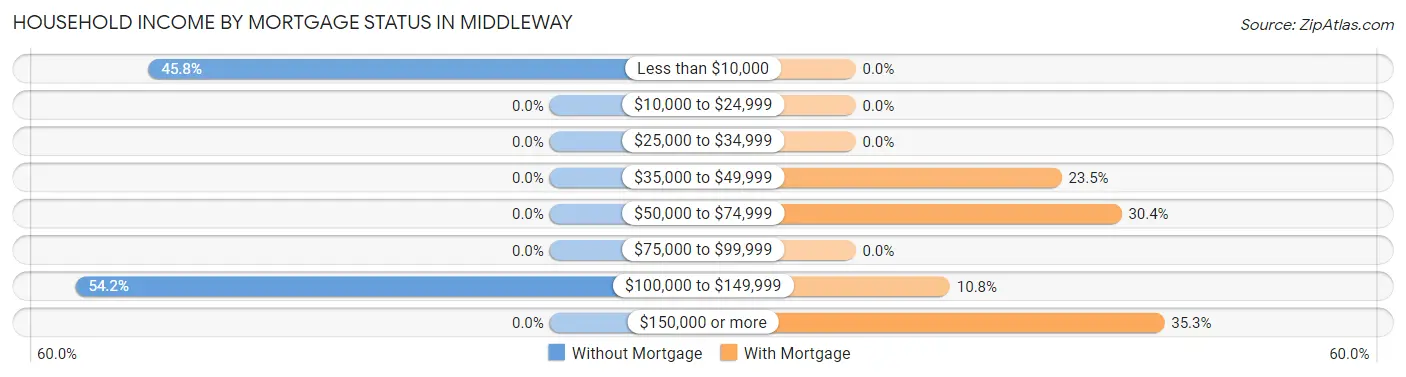
| Household Income | Without Mortgage | With Mortgage |
| Less than $10,000 | 11 (45.8%) | 0 (0.0%) |
| $10,000 to $24,999 | 0 (0.0%) | 0 (0.0%) |
| $25,000 to $34,999 | 0 (0.0%) | 0 (0.0%) |
| $35,000 to $49,999 | 0 (0.0%) | 24 (23.5%) |
| $50,000 to $74,999 | 0 (0.0%) | 31 (30.4%) |
| $75,000 to $99,999 | 0 (0.0%) | 0 (0.0%) |
| $100,000 to $149,999 | 13 (54.2%) | 11 (10.8%) |
| $150,000 or more | 0 (0.0%) | 36 (35.3%) |
| Total | 24 (100.0%) | 102 (100.0%) |
Property Value to Household Income Ratio in Middleway
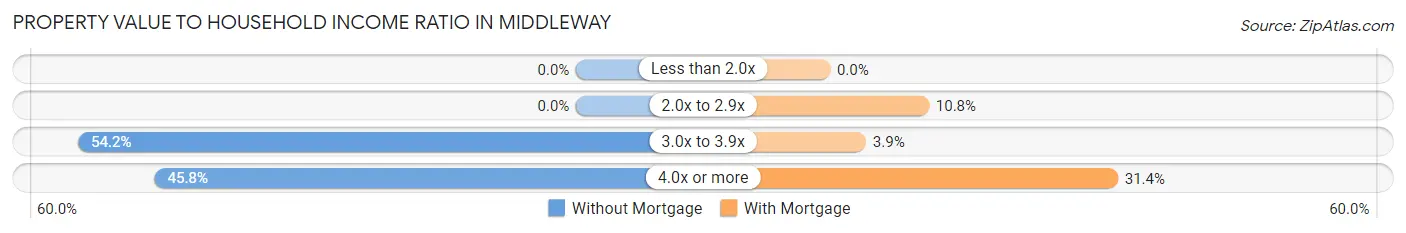
| Value-to-Income Ratio | Without Mortgage | With Mortgage |
| Less than 2.0x | 0 (0.0%) | 0 (0.0%) |
| 2.0x to 2.9x | 0 (0.0%) | 11 (10.8%) |
| 3.0x to 3.9x | 13 (54.2%) | 4 (3.9%) |
| 4.0x or more | 11 (45.8%) | 32 (31.4%) |
| Total | 24 (100.0%) | 102 (100.0%) |
Real Estate Taxes by Mortgage Status in Middleway
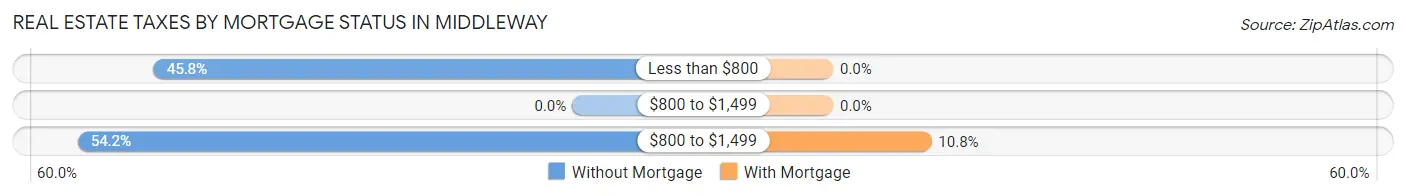
| Property Taxes | Without Mortgage | With Mortgage |
| Less than $800 | 11 (45.8%) | 0 (0.0%) |
| $800 to $1,499 | 0 (0.0%) | 0 (0.0%) |
| $800 to $1,499 | 13 (54.2%) | 11 (10.8%) |
| Total | 24 (100.0%) | 102 (100.0%) |
Health & Disability in Middleway
Health Insurance Coverage by Age in Middleway
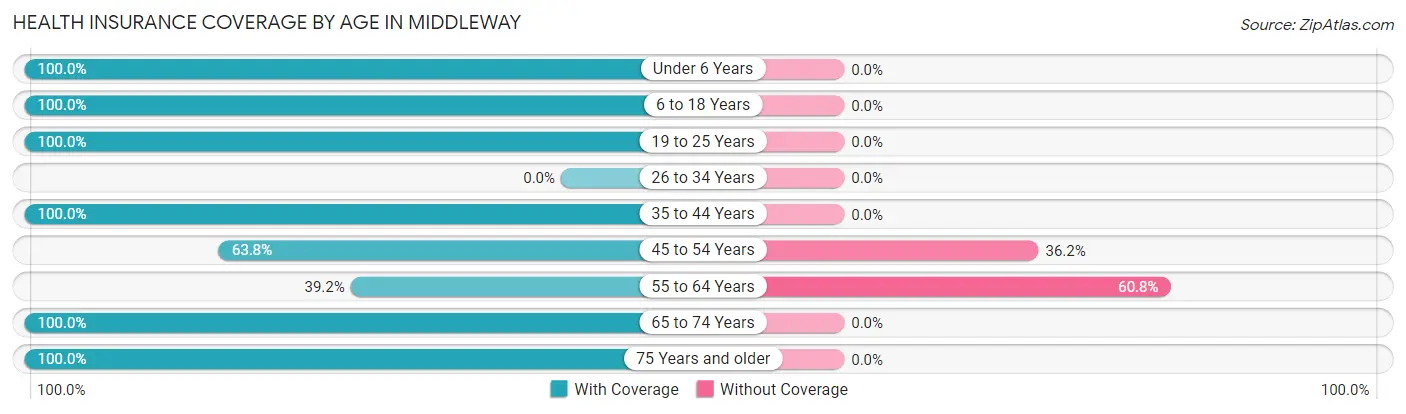
| Age Bracket | With Coverage | Without Coverage |
| Under 6 Years | 67 (100.0%) | 0 (0.0%) |
| 6 to 18 Years | 29 (100.0%) | 0 (0.0%) |
| 19 to 25 Years | 48 (100.0%) | 0 (0.0%) |
| 26 to 34 Years | 0 (0.0%) | 0 (0.0%) |
| 35 to 44 Years | 68 (100.0%) | 0 (0.0%) |
| 45 to 54 Years | 44 (63.8%) | 25 (36.2%) |
| 55 to 64 Years | 20 (39.2%) | 31 (60.8%) |
| 65 to 74 Years | 71 (100.0%) | 0 (0.0%) |
| 75 Years and older | 37 (100.0%) | 0 (0.0%) |
| Total | 384 (87.3%) | 56 (12.7%) |
Health Insurance Coverage by Citizenship Status in Middleway
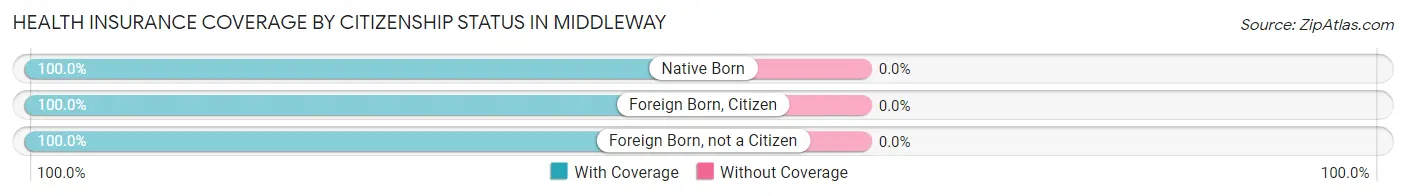
| Citizenship Status | With Coverage | Without Coverage |
| Native Born | 67 (100.0%) | 0 (0.0%) |
| Foreign Born, Citizen | 29 (100.0%) | 0 (0.0%) |
| Foreign Born, not a Citizen | 48 (100.0%) | 0 (0.0%) |
Health Insurance Coverage by Household Income in Middleway
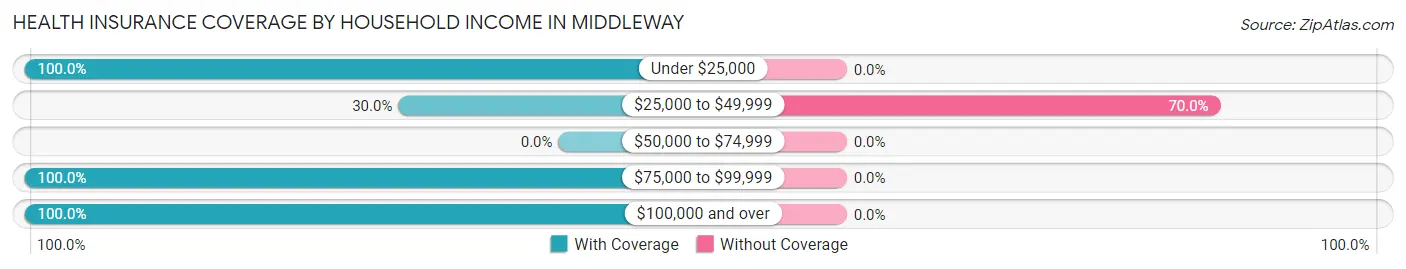
| Household Income | With Coverage | Without Coverage |
| Under $25,000 | 47 (100.0%) | 0 (0.0%) |
| $25,000 to $49,999 | 24 (30.0%) | 56 (70.0%) |
| $50,000 to $74,999 | 0 (0.0%) | 0 (0.0%) |
| $75,000 to $99,999 | 11 (100.0%) | 0 (0.0%) |
| $100,000 and over | 302 (100.0%) | 0 (0.0%) |
Public vs Private Health Insurance Coverage by Age in Middleway
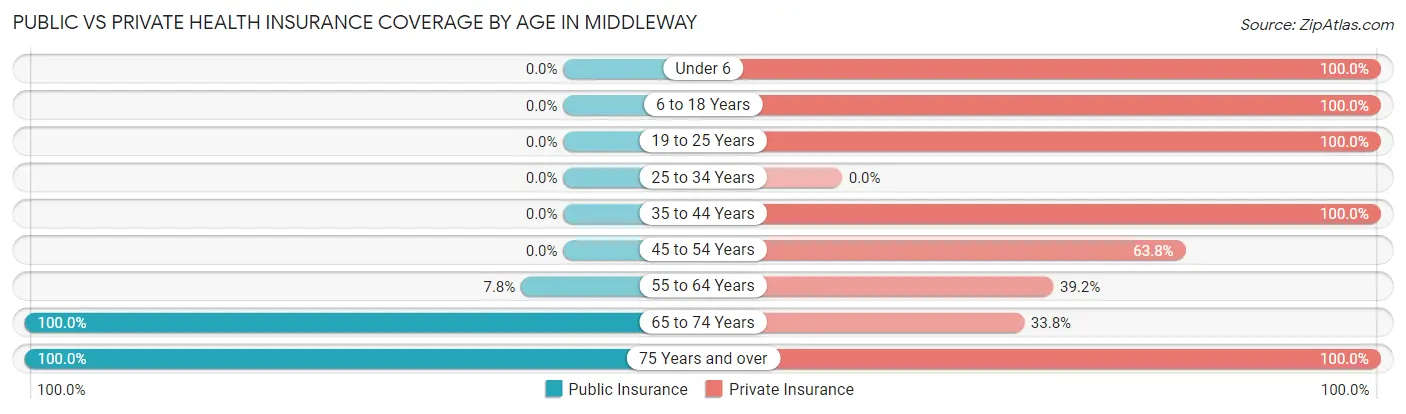
| Age Bracket | Public Insurance | Private Insurance |
| Under 6 | 0 (0.0%) | 67 (100.0%) |
| 6 to 18 Years | 0 (0.0%) | 29 (100.0%) |
| 19 to 25 Years | 0 (0.0%) | 48 (100.0%) |
| 25 to 34 Years | 0 (0.0%) | 0 (0.0%) |
| 35 to 44 Years | 0 (0.0%) | 68 (100.0%) |
| 45 to 54 Years | 0 (0.0%) | 44 (63.8%) |
| 55 to 64 Years | 4 (7.8%) | 20 (39.2%) |
| 65 to 74 Years | 71 (100.0%) | 24 (33.8%) |
| 75 Years and over | 37 (100.0%) | 37 (100.0%) |
| Total | 112 (25.5%) | 337 (76.6%) |
Disability Status by Sex by Age in Middleway
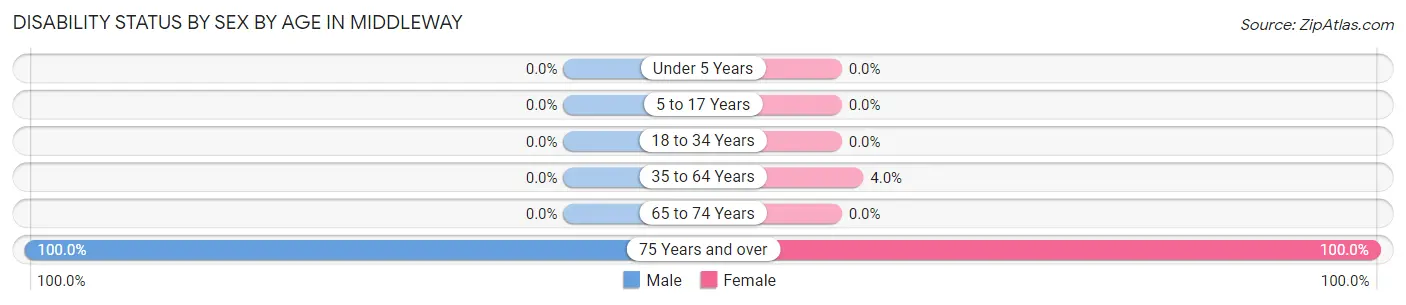
| Age Bracket | Male | Female |
| Under 5 Years | 0 (0.0%) | 0 (0.0%) |
| 5 to 17 Years | 0 (0.0%) | 0 (0.0%) |
| 18 to 34 Years | 0 (0.0%) | 0 (0.0%) |
| 35 to 64 Years | 0 (0.0%) | 4 (4.0%) |
| 65 to 74 Years | 0 (0.0%) | 0 (0.0%) |
| 75 Years and over | 13 (100.0%) | 24 (100.0%) |
Disability Class by Sex by Age in Middleway
Disability Class: Hearing Difficulty
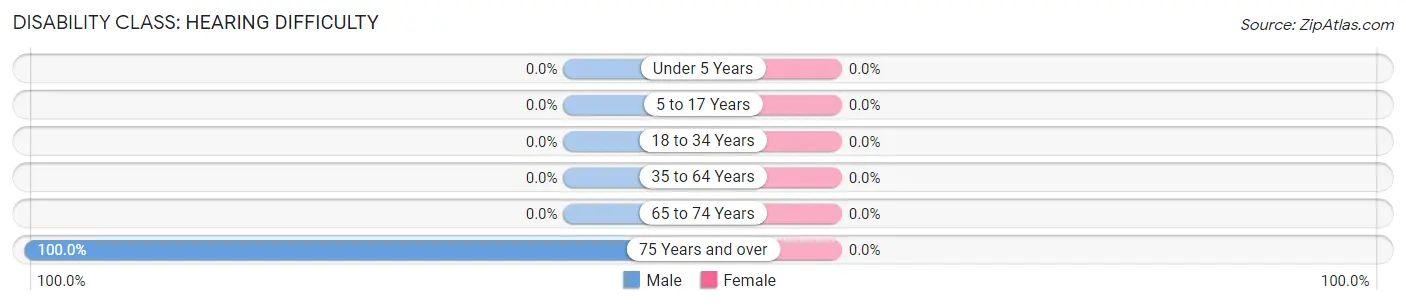
| Age Bracket | Male | Female |
| Under 5 Years | 0 (0.0%) | 0 (0.0%) |
| 5 to 17 Years | 0 (0.0%) | 0 (0.0%) |
| 18 to 34 Years | 0 (0.0%) | 0 (0.0%) |
| 35 to 64 Years | 0 (0.0%) | 0 (0.0%) |
| 65 to 74 Years | 0 (0.0%) | 0 (0.0%) |
| 75 Years and over | 13 (100.0%) | 0 (0.0%) |
Disability Class: Vision Difficulty
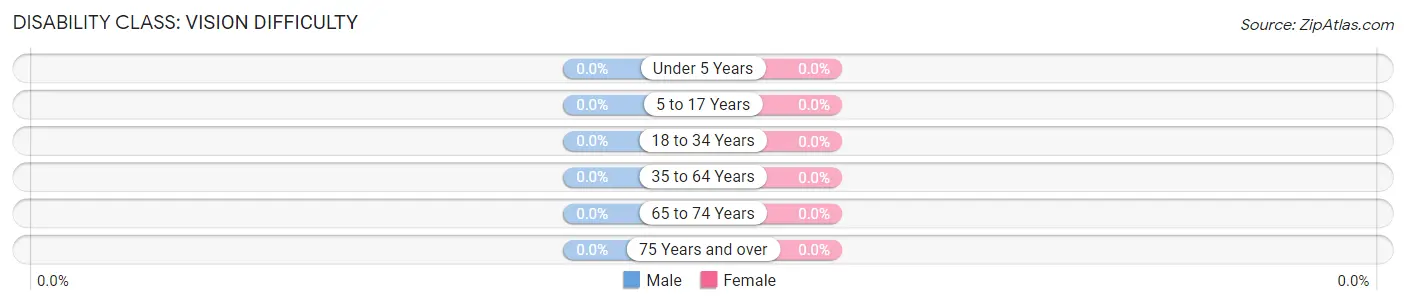
| Age Bracket | Male | Female |
| Under 5 Years | 0 (0.0%) | 0 (0.0%) |
| 5 to 17 Years | 0 (0.0%) | 0 (0.0%) |
| 18 to 34 Years | 0 (0.0%) | 0 (0.0%) |
| 35 to 64 Years | 0 (0.0%) | 0 (0.0%) |
| 65 to 74 Years | 0 (0.0%) | 0 (0.0%) |
| 75 Years and over | 0 (0.0%) | 0 (0.0%) |
Disability Class: Cognitive Difficulty
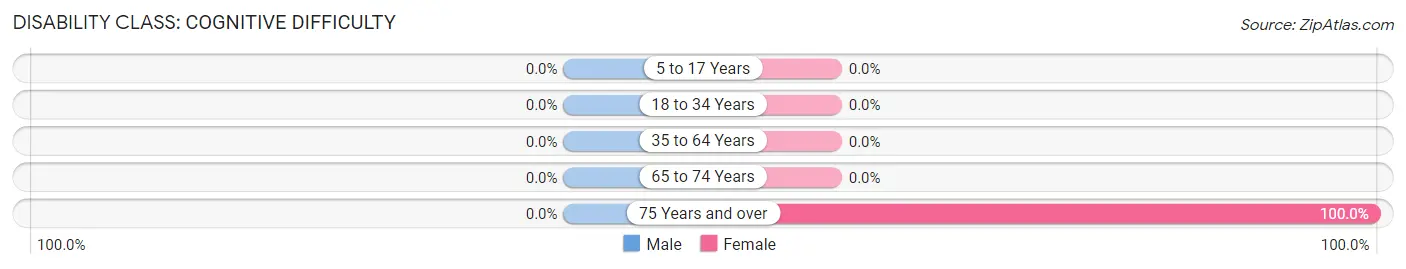
| Age Bracket | Male | Female |
| 5 to 17 Years | 0 (0.0%) | 0 (0.0%) |
| 18 to 34 Years | 0 (0.0%) | 0 (0.0%) |
| 35 to 64 Years | 0 (0.0%) | 0 (0.0%) |
| 65 to 74 Years | 0 (0.0%) | 0 (0.0%) |
| 75 Years and over | 0 (0.0%) | 24 (100.0%) |
Disability Class: Ambulatory Difficulty
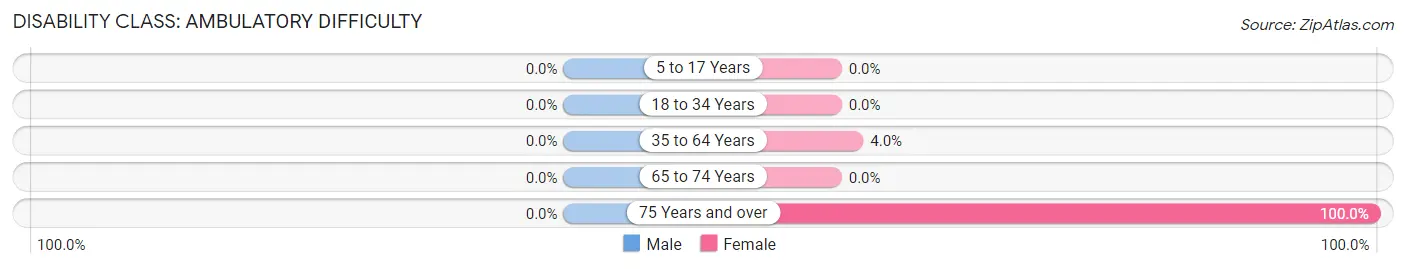
| Age Bracket | Male | Female |
| 5 to 17 Years | 0 (0.0%) | 0 (0.0%) |
| 18 to 34 Years | 0 (0.0%) | 0 (0.0%) |
| 35 to 64 Years | 0 (0.0%) | 4 (4.0%) |
| 65 to 74 Years | 0 (0.0%) | 0 (0.0%) |
| 75 Years and over | 0 (0.0%) | 24 (100.0%) |
Disability Class: Self-Care Difficulty
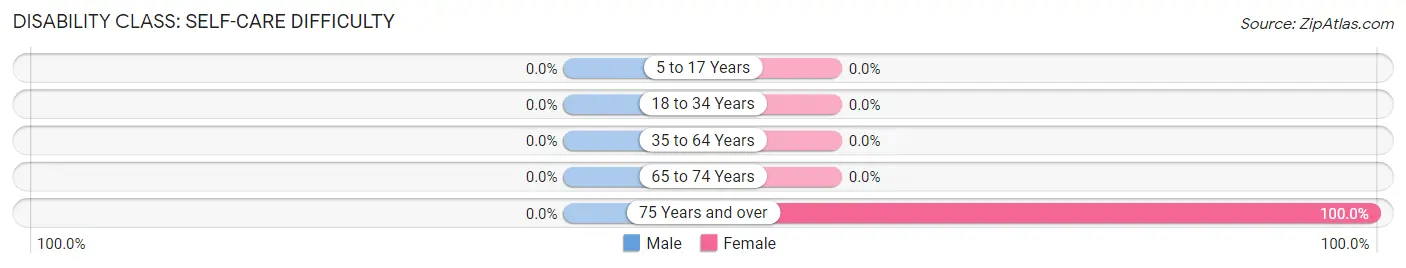
| Age Bracket | Male | Female |
| 5 to 17 Years | 0 (0.0%) | 0 (0.0%) |
| 18 to 34 Years | 0 (0.0%) | 0 (0.0%) |
| 35 to 64 Years | 0 (0.0%) | 0 (0.0%) |
| 65 to 74 Years | 0 (0.0%) | 0 (0.0%) |
| 75 Years and over | 0 (0.0%) | 24 (100.0%) |
Technology Access in Middleway
Computing Device Access in Middleway
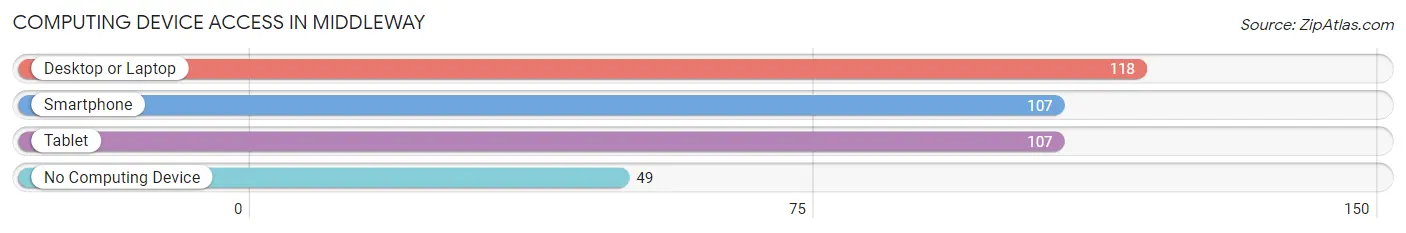
| Device Type | # Households | % Households |
| Desktop or Laptop | 118 | 70.7% |
| Smartphone | 107 | 64.1% |
| Tablet | 107 | 64.1% |
| No Computing Device | 49 | 29.3% |
| Total | 167 | 100.0% |
Internet Access in Middleway
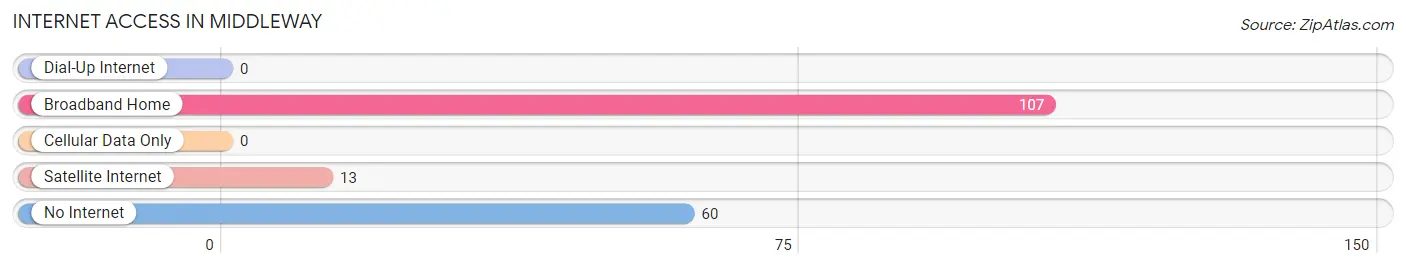
| Internet Type | # Households | % Households |
| Dial-Up Internet | 0 | 0.0% |
| Broadband Home | 107 | 64.1% |
| Cellular Data Only | 0 | 0.0% |
| Satellite Internet | 13 | 7.8% |
| No Internet | 60 | 35.9% |
| Total | 167 | 100.0% |
Middleway Summary
Middleway is a small unincorporated community located in Jefferson County, West Virginia. It is situated along the eastern edge of the Shenandoah Valley, approximately 8 miles south of Charles Town and 8 miles north of Shepherdstown. The community is located along the Northwestern Turnpike (U.S. Route 340) and is bordered by the Potomac River to the east.
History
Middleway was first settled in the late 1700s by German immigrants who were attracted to the area by its fertile soil and abundant natural resources. The town was originally known as “Middleway Crossroads” due to its location at the intersection of two major roads. The town was officially incorporated in 1819 and was named after the nearby Middleway Church, which was established in 1790.
The town grew steadily throughout the 19th century, and by the early 20th century, it had become a bustling agricultural center. The town was home to several mills, a cannery, a blacksmith shop, and a general store. The town also had a post office, a school, and several churches.
In the late 19th century, the town was connected to the rest of the country by the Northwestern Turnpike (U.S. Route 340). This allowed for increased trade and travel, and the town continued to grow.
Geography
Middleway is located in the eastern part of Jefferson County, West Virginia. It is situated along the eastern edge of the Shenandoah Valley, approximately 8 miles south of Charles Town and 8 miles north of Shepherdstown. The community is located along the Northwestern Turnpike (U.S. Route 340) and is bordered by the Potomac River to the east.
The town is situated on a plateau that is surrounded by rolling hills and mountains. The terrain is mostly flat, with some areas of gently rolling hills. The climate is temperate, with hot summers and cold winters.
Economy
The economy of Middleway is largely based on agriculture. The town is home to several farms, which produce a variety of crops, including corn, wheat, soybeans, and hay. The town also has several small businesses, including a general store, a gas station, and a few restaurants.
The town is also home to several small manufacturing companies, which produce a variety of products, including furniture, clothing, and electronics. The town is also home to a few small technology companies, which provide software and web design services.
Demographics
As of the 2010 census, the population of Middleway was 1,845. The racial makeup of the town was 94.3% White, 2.2% African American, 0.3% Native American, 0.7% Asian, 0.1% Pacific Islander, and 2.4% from other races. The median household income was $45,938, and the median family income was $51,938.
The town is served by the Jefferson County Public Schools system. The town is also home to several churches, including the Middleway Church, which was established in 1790.
Conclusion
Middleway is a small unincorporated community located in Jefferson County, West Virginia. It is situated along the eastern edge of the Shenandoah Valley, approximately 8 miles south of Charles Town and 8 miles north of Shepherdstown. The town was first settled in the late 1700s by German immigrants and was officially incorporated in 1819. The town is largely based on agriculture, with several farms producing a variety of crops. The town is also home to several small businesses and manufacturing companies. As of the 2010 census, the population of Middleway was 1,845. The town is served by the Jefferson County Public Schools system and is home to several churches.
Common Questions
What is Per Capita Income in Middleway?
Per Capita income in Middleway is $30,971.
What is the Median Family Income in Middleway?
Median Family Income in Middleway is $109,191.
What is Inequality or Gini Index in Middleway?
Inequality or Gini Index in Middleway is 0.47.
What is the Total Population of Middleway?
Total Population of Middleway is 440.
What is the Total Male Population of Middleway?
Total Male Population of Middleway is 163.
What is the Total Female Population of Middleway?
Total Female Population of Middleway is 277.
What is the Ratio of Males per 100 Females in Middleway?
There are 58.84 Males per 100 Females in Middleway.
What is the Ratio of Females per 100 Males in Middleway?
There are 169.94 Females per 100 Males in Middleway.
What is the Median Population Age in Middleway?
Median Population Age in Middleway is 49.3 Years.
What is the Average Family Size in Middleway
Average Family Size in Middleway is 3.5 People.
What is the Average Household Size in Middleway
Average Household Size in Middleway is 2.6 People.
How Large is the Labor Force in Middleway?
There are 272 People in the Labor Forcein in Middleway.
What is the Percentage of People in the Labor Force in Middleway?
72.9% of People are in the Labor Force in Middleway.