Zip Codes with the Highest Percentage of Population Employed in Agriculture, Fishing & Hunting in Lenoir City, TN
RELATED REPORTS & OPTIONS
Agriculture, Fishing & Hunting
Lenoir City
Compare Zip Codes
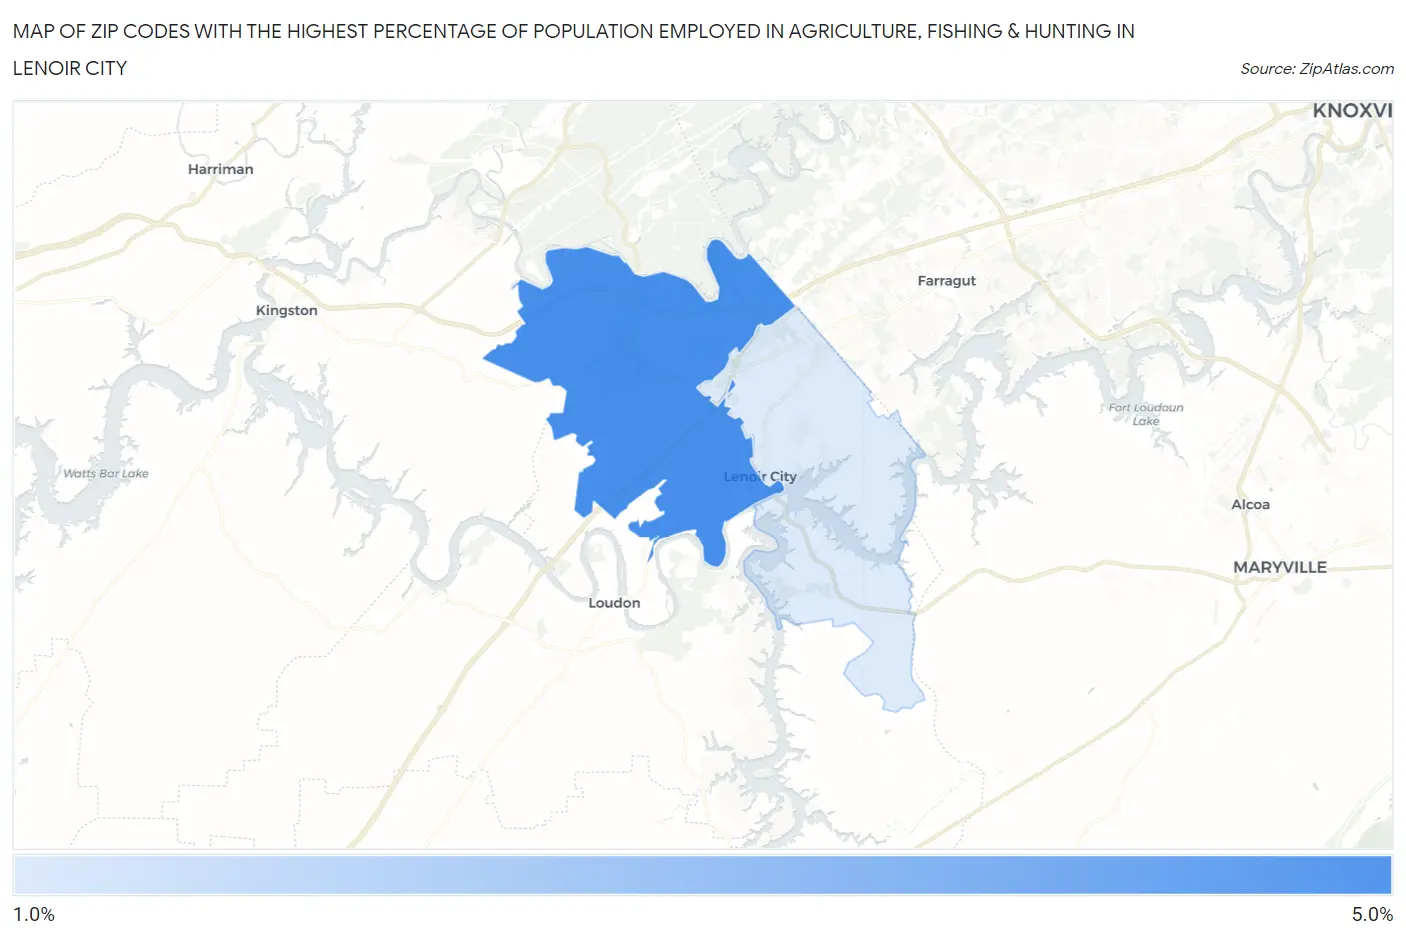
Map of Zip Codes with the Highest Percentage of Population Employed in Agriculture, Fishing & Hunting in Lenoir City
1.8%
4.2%
Zip Codes with the Highest Percentage of Population Employed in Agriculture, Fishing & Hunting in Lenoir City, TN
| Zip Code | % Employed | vs State | vs National | |
| 1. | 37771 | 4.2% | 0.74%(+3.51)#65 | 1.2%(+3.05)#8,722 |
| 2. | 37772 | 1.8% | 0.74%(+1.03)#177 | 1.2%(+0.569)#13,435 |
1
Common Questions
What are the Top Zip Codes with the Highest Percentage of Population Employed in Agriculture, Fishing & Hunting in Lenoir City, TN?
Top Zip Codes with the Highest Percentage of Population Employed in Agriculture, Fishing & Hunting in Lenoir City, TN are:
What zip code has the Highest Percentage of Population Employed in Agriculture, Fishing & Hunting in Lenoir City, TN?
37771 has the Highest Percentage of Population Employed in Agriculture, Fishing & Hunting in Lenoir City, TN with 4.2%.
What is the Percentage of Population Employed in Agriculture, Fishing & Hunting in Lenoir City, TN?
Percentage of Population Employed in Agriculture, Fishing & Hunting in Lenoir City is 1.2%.
What is the Percentage of Population Employed in Agriculture, Fishing & Hunting in Tennessee?
Percentage of Population Employed in Agriculture, Fishing & Hunting in Tennessee is 0.74%.
What is the Percentage of Population Employed in Agriculture, Fishing & Hunting in the United States?
Percentage of Population Employed in Agriculture, Fishing & Hunting in the United States is 1.2%.