Zip Codes with the Highest Percentage of Population Employed in Agriculture, Fishing & Hunting in Kingsport, TN
RELATED REPORTS & OPTIONS
Agriculture, Fishing & Hunting
Kingsport
Compare Zip Codes
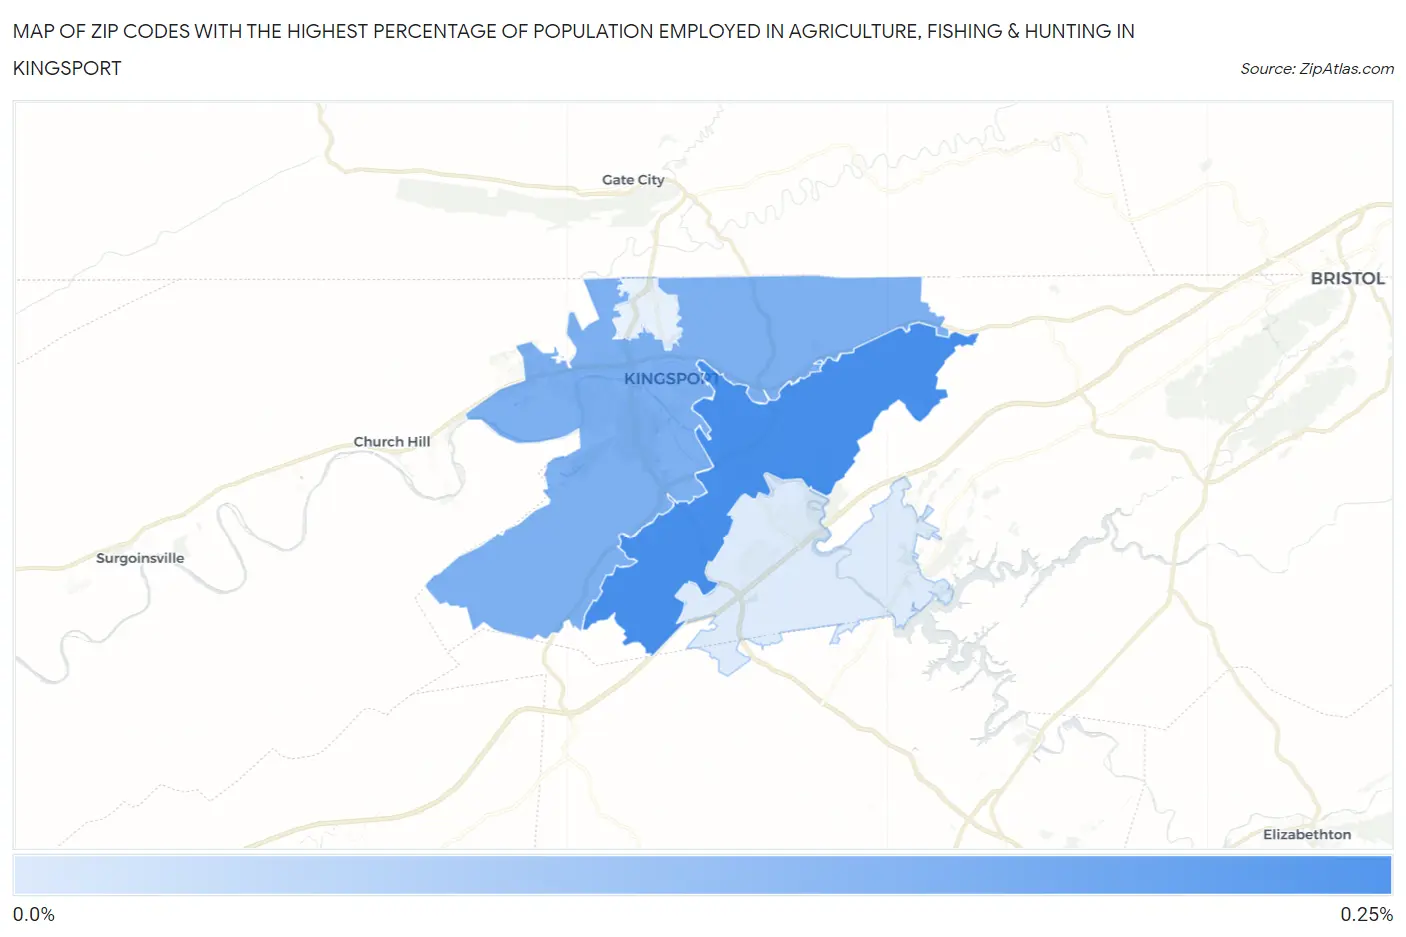
Map of Zip Codes with the Highest Percentage of Population Employed in Agriculture, Fishing & Hunting in Kingsport
0.015%
0.23%
Zip Codes with the Highest Percentage of Population Employed in Agriculture, Fishing & Hunting in Kingsport, TN
| Zip Code | % Employed | vs State | vs National | |
| 1. | 37664 | 0.23% | 0.74%(-0.510)#401 | 1.2%(-0.973)#22,032 |
| 2. | 37660 | 0.15% | 0.74%(-0.587)#430 | 1.2%(-1.05)#23,015 |
| 3. | 37663 | 0.015% | 0.74%(-0.721)#467 | 1.2%(-1.18)#24,602 |
1
Common Questions
What are the Top 3 Zip Codes with the Highest Percentage of Population Employed in Agriculture, Fishing & Hunting in Kingsport, TN?
Top 3 Zip Codes with the Highest Percentage of Population Employed in Agriculture, Fishing & Hunting in Kingsport, TN are:
What zip code has the Highest Percentage of Population Employed in Agriculture, Fishing & Hunting in Kingsport, TN?
37664 has the Highest Percentage of Population Employed in Agriculture, Fishing & Hunting in Kingsport, TN with 0.23%.
What is the Percentage of Population Employed in Agriculture, Fishing & Hunting in Kingsport, TN?
Percentage of Population Employed in Agriculture, Fishing & Hunting in Kingsport is 0.094%.
What is the Percentage of Population Employed in Agriculture, Fishing & Hunting in Tennessee?
Percentage of Population Employed in Agriculture, Fishing & Hunting in Tennessee is 0.74%.
What is the Percentage of Population Employed in Agriculture, Fishing & Hunting in the United States?
Percentage of Population Employed in Agriculture, Fishing & Hunting in the United States is 1.2%.