Zip Codes with the Highest Percentage of Population Employed in Agriculture, Fishing & Hunting in Chattanooga, TN
RELATED REPORTS & OPTIONS
Agriculture, Fishing & Hunting
Chattanooga
Compare Zip Codes
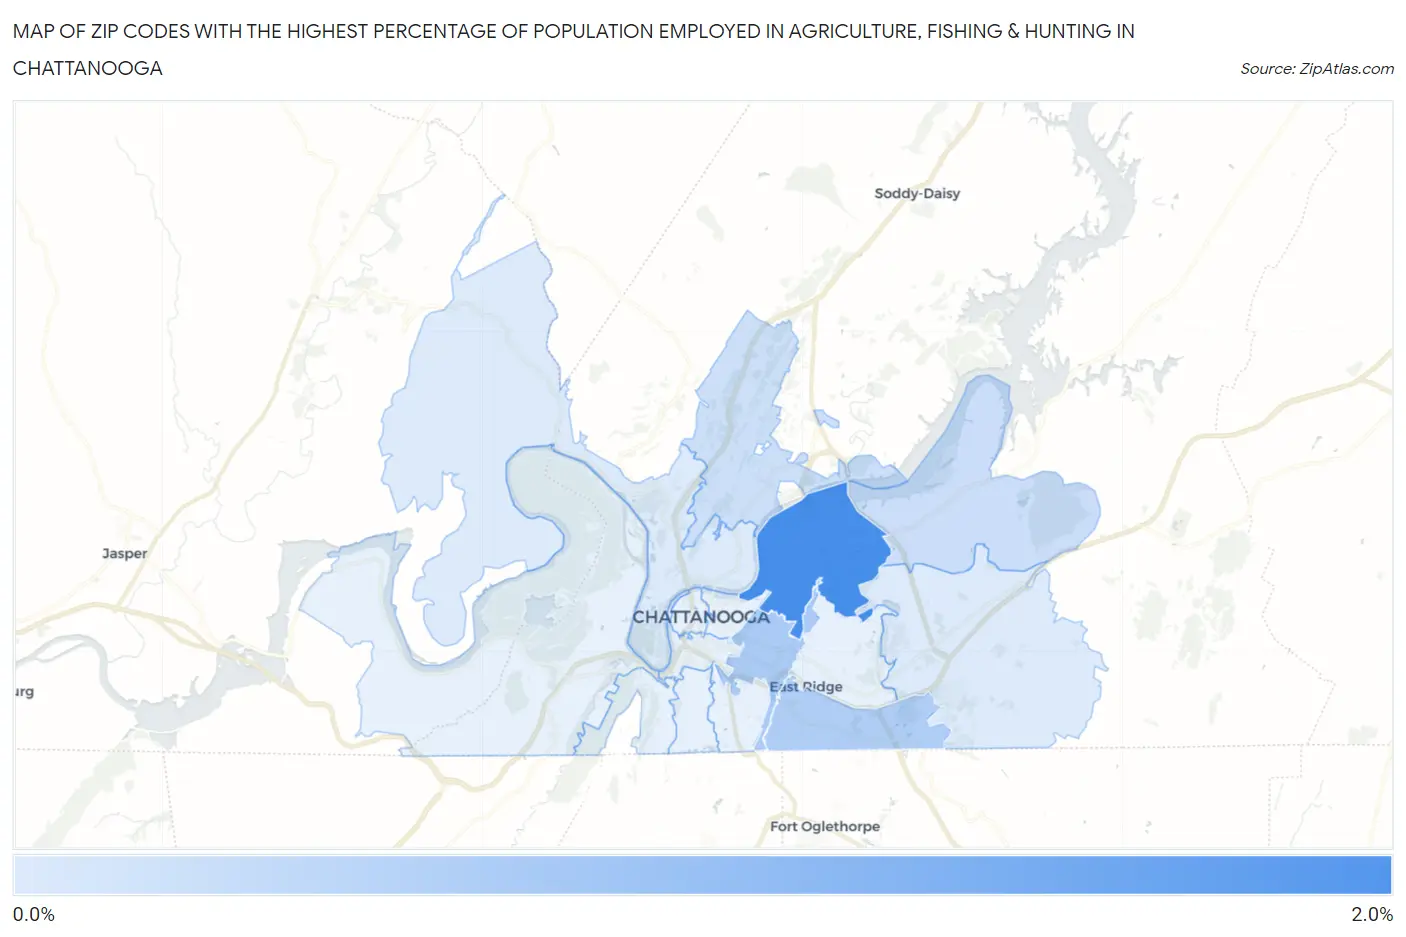
Map of Zip Codes with the Highest Percentage of Population Employed in Agriculture, Fishing & Hunting in Chattanooga
0.084%
1.9%
Zip Codes with the Highest Percentage of Population Employed in Agriculture, Fishing & Hunting in Chattanooga, TN
| Zip Code | % Employed | vs State | vs National | |
| 1. | 37406 | 1.9% | 0.74%(+1.19)#172 | 1.2%(+0.729)#12,955 |
| 2. | 37404 | 0.69% | 0.74%(-0.042)#295 | 1.2%(-0.505)#17,873 |
| 3. | 37412 | 0.66% | 0.74%(-0.080)#302 | 1.2%(-0.542)#18,091 |
| 4. | 37416 | 0.31% | 0.74%(-0.430)#371 | 1.2%(-0.893)#21,101 |
| 5. | 37415 | 0.27% | 0.74%(-0.468)#384 | 1.2%(-0.931)#21,561 |
| 6. | 37421 | 0.088% | 0.74%(-0.649)#447 | 1.2%(-1.11)#23,848 |
| 7. | 37405 | 0.084% | 0.74%(-0.652)#451 | 1.2%(-1.11)#23,901 |
1
Common Questions
What are the Top 10 Zip Codes with the Highest Percentage of Population Employed in Agriculture, Fishing & Hunting in Chattanooga, TN?
Top 10 Zip Codes with the Highest Percentage of Population Employed in Agriculture, Fishing & Hunting in Chattanooga, TN are:
What zip code has the Highest Percentage of Population Employed in Agriculture, Fishing & Hunting in Chattanooga, TN?
37406 has the Highest Percentage of Population Employed in Agriculture, Fishing & Hunting in Chattanooga, TN with 1.9%.
What is the Percentage of Population Employed in Agriculture, Fishing & Hunting in Chattanooga, TN?
Percentage of Population Employed in Agriculture, Fishing & Hunting in Chattanooga is 0.25%.
What is the Percentage of Population Employed in Agriculture, Fishing & Hunting in Tennessee?
Percentage of Population Employed in Agriculture, Fishing & Hunting in Tennessee is 0.74%.
What is the Percentage of Population Employed in Agriculture, Fishing & Hunting in the United States?
Percentage of Population Employed in Agriculture, Fishing & Hunting in the United States is 1.2%.