Zip Codes with the Highest Percentage of Population with a Degree in Education in South Dakota
RELATED REPORTS & OPTIONS
Education
South Dakota
Compare Zip Codes
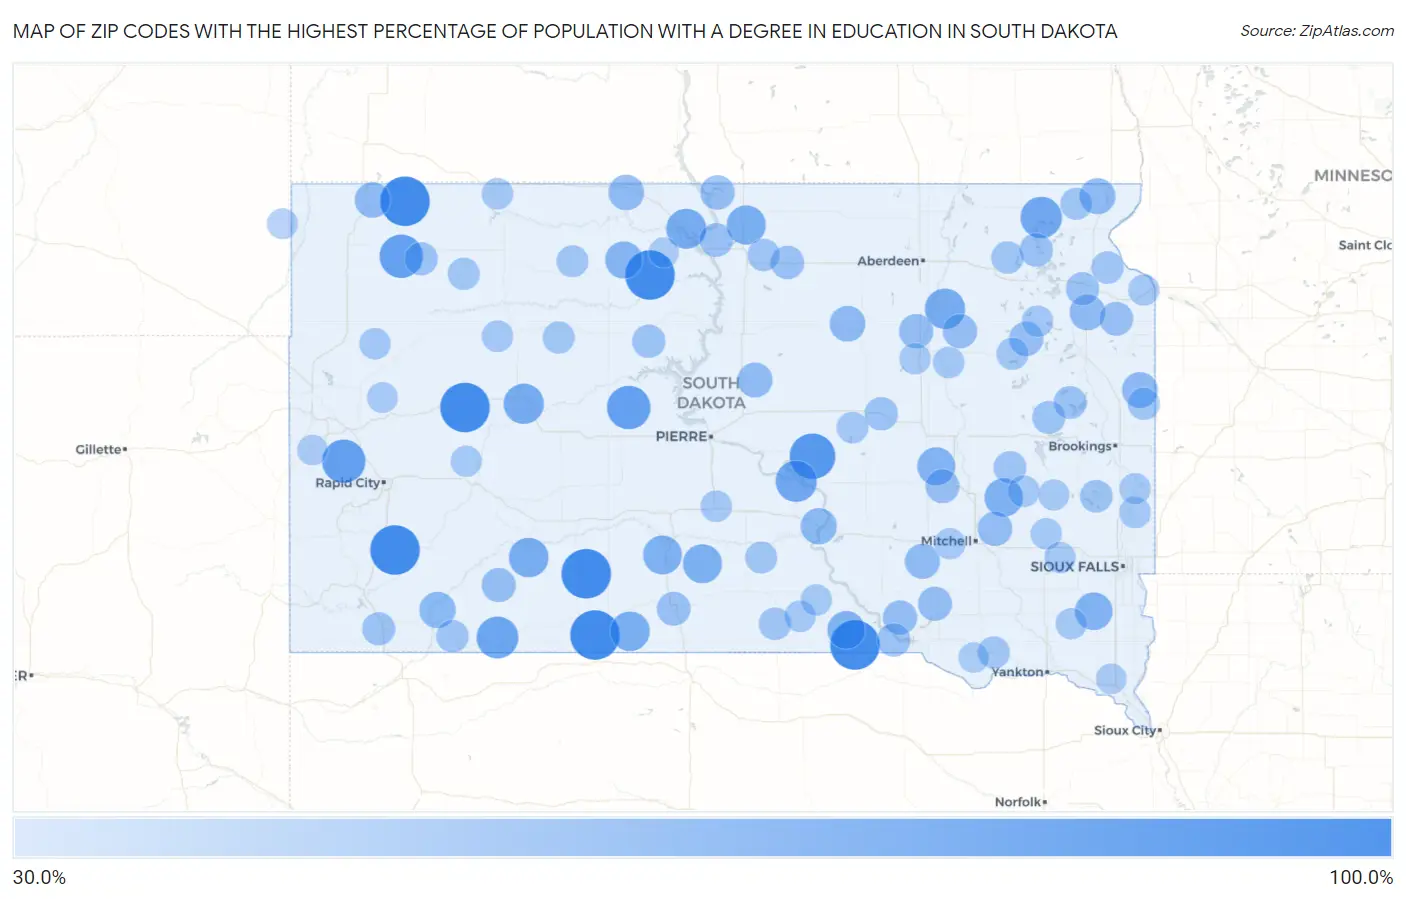
Map of Zip Codes with the Highest Percentage of Population with a Degree in Education in South Dakota
30.0%
100.0%
Zip Codes with the Highest Percentage of Population with a Degree in Education in South Dakota
| Zip Code | % Graduates | vs State | vs National | |
| 1. | 57738 | 100.0% | 18.8%(+81.2)#1 | 11.1%(+88.9)#88 |
| 2. | 57547 | 100.0% | 18.8%(+81.2)#2 | 11.1%(+88.9)#208 |
| 3. | 57574 | 100.0% | 18.8%(+81.2)#3 | 11.1%(+88.9)#212 |
| 4. | 57737 | 100.0% | 18.8%(+81.2)#4 | 11.1%(+88.9)#270 |
| 5. | 57630 | 100.0% | 18.8%(+81.2)#6 | 11.1%(+88.9)#288 |
| 6. | 57571 | 100.0% | 18.8%(+81.2)#7 | 11.1%(+88.9)#289 |
| 7. | 57650 | 100.0% | 18.8%(+81.2)#8 | 11.1%(+88.9)#301 |
| 8. | 57346 | 86.2% | 18.8%(+67.4)#9 | 11.1%(+75.1)#349 |
| 9. | 57537 | 78.3% | 18.8%(+59.5)#10 | 11.1%(+67.2)#411 |
| 10. | 57759 | 77.8% | 18.8%(+59.0)#11 | 11.1%(+66.7)#417 |
| 11. | 57651 | 77.8% | 18.8%(+59.0)#12 | 11.1%(+66.7)#419 |
| 12. | 57716 | 72.2% | 18.8%(+53.4)#13 | 11.1%(+61.1)#488 |
| 13. | 57247 | 70.6% | 18.8%(+51.8)#14 | 11.1%(+59.5)#505 |
| 14. | 57548 | 70.1% | 18.8%(+51.3)#15 | 11.1%(+59.1)#508 |
| 15. | 57748 | 66.7% | 18.8%(+47.9)#16 | 11.1%(+55.6)#558 |
| 16. | 57429 | 66.7% | 18.8%(+47.9)#17 | 11.1%(+55.6)#575 |
| 17. | 57658 | 65.6% | 18.8%(+46.8)#18 | 11.1%(+54.6)#592 |
| 18. | 57750 | 64.3% | 18.8%(+45.5)#19 | 11.1%(+53.2)#630 |
| 19. | 57572 | 63.8% | 18.8%(+45.1)#20 | 11.1%(+52.8)#646 |
| 20. | 57646 | 62.9% | 18.8%(+44.1)#21 | 11.1%(+51.8)#666 |
| 21. | 57585 | 62.5% | 18.8%(+43.7)#22 | 11.1%(+51.4)#679 |
| 22. | 57579 | 61.2% | 18.8%(+42.4)#23 | 11.1%(+50.1)#713 |
| 23. | 57337 | 60.0% | 18.8%(+41.2)#24 | 11.1%(+48.9)#754 |
| 24. | 57312 | 58.3% | 18.8%(+39.6)#25 | 11.1%(+47.3)#800 |
| 25. | 57538 | 57.9% | 18.8%(+39.1)#26 | 11.1%(+46.8)#814 |
| 26. | 57021 | 57.2% | 18.8%(+38.4)#27 | 11.1%(+46.2)#835 |
| 27. | 57656 | 55.5% | 18.8%(+36.7)#28 | 11.1%(+44.4)#902 |
| 28. | 57764 | 52.6% | 18.8%(+33.8)#29 | 11.1%(+41.5)#1,030 |
| 29. | 57365 | 52.0% | 18.8%(+33.3)#30 | 11.1%(+41.0)#1,054 |
| 30. | 57255 | 51.5% | 18.8%(+32.7)#31 | 11.1%(+40.4)#1,078 |
| 31. | 57218 | 50.8% | 18.8%(+32.1)#32 | 11.1%(+39.8)#1,104 |
| 32. | 57438 | 50.5% | 18.8%(+31.7)#33 | 11.1%(+39.4)#1,127 |
| 33. | 57263 | 50.0% | 18.8%(+31.2)#34 | 11.1%(+38.9)#1,168 |
| 34. | 57755 | 50.0% | 18.8%(+31.2)#35 | 11.1%(+38.9)#1,222 |
| 35. | 57659 | 50.0% | 18.8%(+31.2)#36 | 11.1%(+38.9)#1,253 |
| 36. | 57375 | 48.8% | 18.8%(+30.1)#37 | 11.1%(+37.8)#1,286 |
| 37. | 57564 | 47.7% | 18.8%(+28.9)#38 | 11.1%(+36.7)#1,352 |
| 38. | 57340 | 46.4% | 18.8%(+27.6)#39 | 11.1%(+35.4)#1,443 |
| 39. | 57648 | 46.0% | 18.8%(+27.2)#40 | 11.1%(+34.9)#1,480 |
| 40. | 57424 | 45.9% | 18.8%(+27.2)#41 | 11.1%(+34.9)#1,484 |
| 41. | 57477 | 45.5% | 18.8%(+26.7)#42 | 11.1%(+34.4)#1,525 |
| 42. | 57236 | 45.5% | 18.8%(+26.7)#43 | 11.1%(+34.4)#1,526 |
| 43. | 57342 | 45.3% | 18.8%(+26.5)#44 | 11.1%(+34.3)#1,538 |
| 44. | 57752 | 45.0% | 18.8%(+26.2)#45 | 11.1%(+33.9)#1,562 |
| 45. | 57313 | 45.0% | 18.8%(+26.2)#46 | 11.1%(+33.9)#1,574 |
| 46. | 57385 | 44.2% | 18.8%(+25.5)#47 | 11.1%(+33.2)#1,639 |
| 47. | 57555 | 43.8% | 18.8%(+25.0)#48 | 11.1%(+32.7)#1,682 |
| 48. | 57264 | 43.8% | 18.8%(+25.0)#49 | 11.1%(+32.7)#1,688 |
| 49. | 57631 | 43.0% | 18.8%(+24.2)#50 | 11.1%(+32.0)#1,750 |
| 50. | 57261 | 42.5% | 18.8%(+23.7)#51 | 11.1%(+31.4)#1,812 |
| 51. | 57428 | 42.5% | 18.8%(+23.7)#52 | 11.1%(+31.4)#1,815 |
| 52. | 57625 | 42.2% | 18.8%(+23.4)#53 | 11.1%(+31.1)#1,844 |
| 53. | 57373 | 42.2% | 18.8%(+23.4)#54 | 11.1%(+31.1)#1,849 |
| 54. | 57335 | 42.1% | 18.8%(+23.3)#55 | 11.1%(+31.0)#1,858 |
| 55. | 57266 | 41.7% | 18.8%(+22.9)#56 | 11.1%(+30.6)#1,902 |
| 56. | 57649 | 41.4% | 18.8%(+22.6)#57 | 11.1%(+30.3)#1,945 |
| 57. | 57763 | 41.3% | 18.8%(+22.5)#58 | 11.1%(+30.2)#1,959 |
| 58. | 57233 | 40.9% | 18.8%(+22.1)#59 | 11.1%(+29.9)#2,023 |
| 59. | 57248 | 40.9% | 18.8%(+22.1)#60 | 11.1%(+29.8)#2,027 |
| 60. | 57075 | 39.7% | 18.8%(+20.9)#61 | 11.1%(+28.6)#2,208 |
| 61. | 57323 | 39.7% | 18.8%(+20.9)#62 | 11.1%(+28.6)#2,209 |
| 62. | 57770 | 39.4% | 18.8%(+20.6)#63 | 11.1%(+28.3)#2,245 |
| 63. | 57528 | 39.3% | 18.8%(+20.5)#64 | 11.1%(+28.2)#2,262 |
| 64. | 57279 | 39.3% | 18.8%(+20.5)#65 | 11.1%(+28.2)#2,269 |
| 65. | 57468 | 39.2% | 18.8%(+20.4)#66 | 11.1%(+28.2)#2,278 |
| 66. | 57452 | 39.1% | 18.8%(+20.4)#67 | 11.1%(+28.1)#2,296 |
| 67. | 57213 | 38.1% | 18.8%(+19.3)#68 | 11.1%(+27.0)#2,455 |
| 68. | 57066 | 38.1% | 18.8%(+19.3)#69 | 11.1%(+27.0)#2,464 |
| 69. | 57225 | 37.9% | 18.8%(+19.1)#70 | 11.1%(+26.8)#2,507 |
| 70. | 57623 | 37.9% | 18.8%(+19.1)#71 | 11.1%(+26.8)#2,509 |
| 71. | 57620 | 37.9% | 18.8%(+19.1)#72 | 11.1%(+26.8)#2,510 |
| 72. | 57224 | 37.5% | 18.8%(+18.7)#73 | 11.1%(+26.4)#2,576 |
| 73. | 57633 | 37.3% | 18.8%(+18.5)#74 | 11.1%(+26.2)#2,612 |
| 74. | 57541 | 37.1% | 18.8%(+18.4)#75 | 11.1%(+26.1)#2,641 |
| 75. | 57349 | 36.6% | 18.8%(+17.8)#76 | 11.1%(+25.6)#2,720 |
| 76. | 57362 | 36.3% | 18.8%(+17.6)#77 | 11.1%(+25.3)#2,775 |
| 77. | 57626 | 36.2% | 18.8%(+17.4)#78 | 11.1%(+25.1)#2,794 |
| 78. | 57065 | 36.1% | 18.8%(+17.3)#79 | 11.1%(+25.1)#2,803 |
| 79. | 57440 | 36.0% | 18.8%(+17.2)#80 | 11.1%(+24.9)#2,822 |
| 80. | 57529 | 35.7% | 18.8%(+16.9)#81 | 11.1%(+24.7)#2,883 |
| 81. | 57272 | 35.7% | 18.8%(+16.9)#82 | 11.1%(+24.7)#2,886 |
| 82. | 57576 | 35.7% | 18.8%(+16.9)#83 | 11.1%(+24.7)#2,892 |
| 83. | 57638 | 35.5% | 18.8%(+16.8)#84 | 11.1%(+24.5)#2,910 |
| 84. | 57760 | 35.4% | 18.8%(+16.6)#85 | 11.1%(+24.4)#2,933 |
| 85. | 57058 | 35.3% | 18.8%(+16.5)#86 | 11.1%(+24.2)#2,965 |
| 86. | 57533 | 35.2% | 18.8%(+16.5)#87 | 11.1%(+24.2)#2,968 |
| 87. | 57028 | 34.9% | 18.8%(+16.1)#88 | 11.1%(+23.8)#3,042 |
| 88. | 57070 | 34.8% | 18.8%(+16.0)#89 | 11.1%(+23.7)#3,075 |
| 89. | 57469 | 34.7% | 18.8%(+15.9)#90 | 11.1%(+23.7)#3,094 |
| 90. | 57012 | 34.7% | 18.8%(+15.9)#91 | 11.1%(+23.7)#3,099 |
| 91. | 57216 | 34.4% | 18.8%(+15.6)#92 | 11.1%(+23.3)#3,165 |
| 92. | 57363 | 34.4% | 18.8%(+15.6)#93 | 11.1%(+23.3)#3,173 |
| 93. | 57791 | 34.1% | 18.8%(+15.4)#94 | 11.1%(+23.1)#3,235 |
| 94. | 57076 | 34.0% | 18.8%(+15.3)#95 | 11.1%(+23.0)#3,263 |
| 95. | 57788 | 33.3% | 18.8%(+14.6)#96 | 11.1%(+22.3)#3,438 |
| 96. | 57724 | 33.3% | 18.8%(+14.6)#97 | 11.1%(+22.3)#3,471 |
| 97. | 57315 | 32.6% | 18.8%(+13.8)#98 | 11.1%(+21.5)#3,658 |
| 98. | 57754 | 32.6% | 18.8%(+13.8)#99 | 11.1%(+21.5)#3,661 |
| 99. | 57010 | 32.4% | 18.8%(+13.6)#100 | 11.1%(+21.3)#3,725 |
| 100. | 57657 | 32.0% | 18.8%(+13.2)#101 | 11.1%(+20.9)#3,837 |
Common Questions
What are the Top 10 Zip Codes with the Highest Percentage of Population with a Degree in Education in South Dakota?
Top 10 Zip Codes with the Highest Percentage of Population with a Degree in Education in South Dakota are:
What zip code has the Highest Percentage of Population with a Degree in Education in South Dakota?
57738 has the Highest Percentage of Population with a Degree in Education in South Dakota with 100.0%.
What is the Percentage of Population with a Degree in Education in the State of South Dakota?
Percentage of Population with a Degree in Education in South Dakota is 18.8%.
What is the Percentage of Population with a Degree in Education in the United States?
Percentage of Population with a Degree in Education in the United States is 11.1%.