Hoople, ND Map & Demographics
Hoople Map
Hoople Overview
$30,274
PER CAPITA INCOME
$77,917
AVG FAMILY INCOME
$73,542
AVG HOUSEHOLD INCOME
38.5%
WAGE / INCOME GAP [ % ]
61.5¢/ $1
WAGE / INCOME GAP [ $ ]
0.39
INEQUALITY / GINI INDEX
239
TOTAL POPULATION
118
MALE POPULATION
121
FEMALE POPULATION
97.52
MALES / 100 FEMALES
102.54
FEMALES / 100 MALES
35.6
MEDIAN AGE
3.0
AVG FAMILY SIZE
2.6
AVG HOUSEHOLD SIZE
118
LABOR FORCE [ PEOPLE ]
71.5%
PERCENT IN LABOR FORCE
6.8%
UNEMPLOYMENT RATE
Hoople Zip Codes
Hoople Area Codes
Income in Hoople
Income Overview in Hoople
Per Capita Income in Hoople is $30,274, while median incomes of families and households are $77,917 and $73,542 respectively.
| Characteristic | Number | Measure |
| Per Capita Income | 239 | $30,274 |
| Median Family Income | 67 | $77,917 |
| Mean Family Income | 67 | $86,569 |
| Median Household Income | 93 | $73,542 |
| Mean Household Income | 93 | $78,770 |
| Income Deficit | 67 | $0 |
| Wage / Income Gap (%) | 239 | 38.46% |
| Wage / Income Gap ($) | 239 | 61.54¢ per $1 |
| Gini / Inequality Index | 239 | 0.39 |
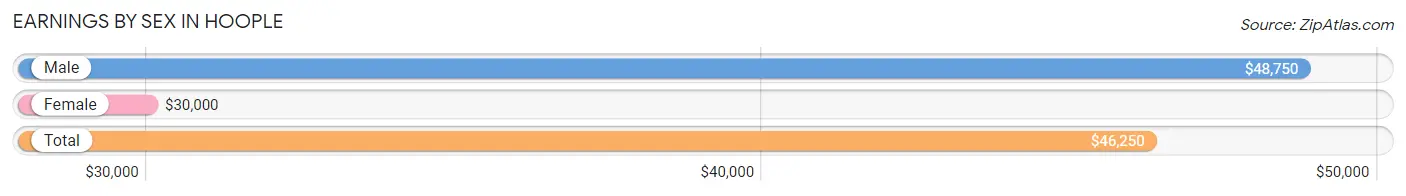
Earnings by Sex in Hoople
Average Earnings in Hoople are $46,250, $48,750 for men and $30,000 for women, a difference of 38.5%.
| Sex | Number | Average Earnings |
| Male | 81 (68.1%) | $48,750 |
| Female | 38 (31.9%) | $30,000 |
| Total | 119 (100.0%) | $46,250 |
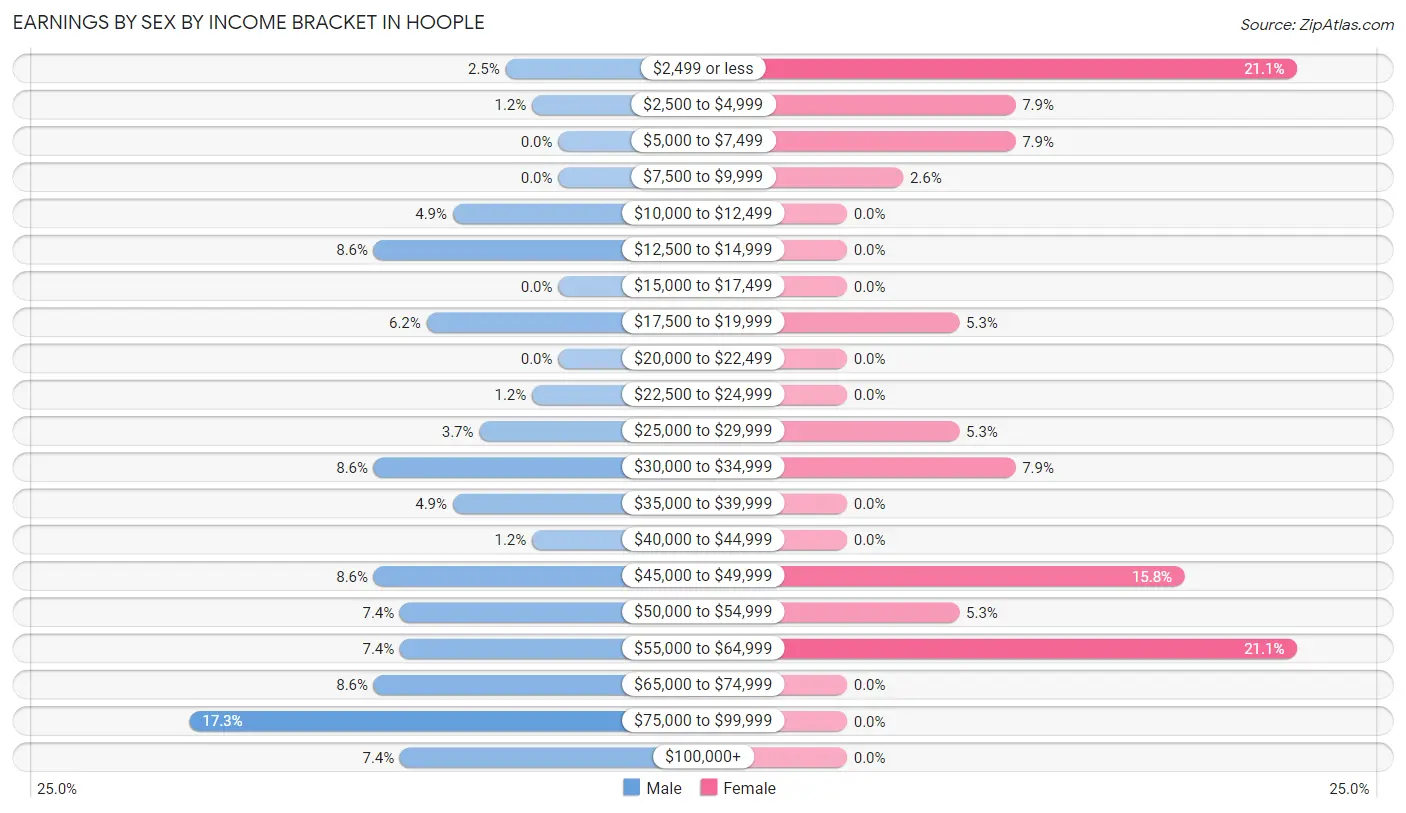
Earnings by Sex by Income Bracket in Hoople
The most common earnings brackets in Hoople are $75,000 to $99,999 for men (14 | 17.3%) and $2,499 or less for women (8 | 21.0%).
| Income | Male | Female |
| $2,499 or less | 2 (2.5%) | 8 (21.0%) |
| $2,500 to $4,999 | 1 (1.2%) | 3 (7.9%) |
| $5,000 to $7,499 | 0 (0.0%) | 3 (7.9%) |
| $7,500 to $9,999 | 0 (0.0%) | 1 (2.6%) |
| $10,000 to $12,499 | 4 (4.9%) | 0 (0.0%) |
| $12,500 to $14,999 | 7 (8.6%) | 0 (0.0%) |
| $15,000 to $17,499 | 0 (0.0%) | 0 (0.0%) |
| $17,500 to $19,999 | 5 (6.2%) | 2 (5.3%) |
| $20,000 to $22,499 | 0 (0.0%) | 0 (0.0%) |
| $22,500 to $24,999 | 1 (1.2%) | 0 (0.0%) |
| $25,000 to $29,999 | 3 (3.7%) | 2 (5.3%) |
| $30,000 to $34,999 | 7 (8.6%) | 3 (7.9%) |
| $35,000 to $39,999 | 4 (4.9%) | 0 (0.0%) |
| $40,000 to $44,999 | 1 (1.2%) | 0 (0.0%) |
| $45,000 to $49,999 | 7 (8.6%) | 6 (15.8%) |
| $50,000 to $54,999 | 6 (7.4%) | 2 (5.3%) |
| $55,000 to $64,999 | 6 (7.4%) | 8 (21.0%) |
| $65,000 to $74,999 | 7 (8.6%) | 0 (0.0%) |
| $75,000 to $99,999 | 14 (17.3%) | 0 (0.0%) |
| $100,000+ | 6 (7.4%) | 0 (0.0%) |
| Total | 81 (100.0%) | 38 (100.0%) |
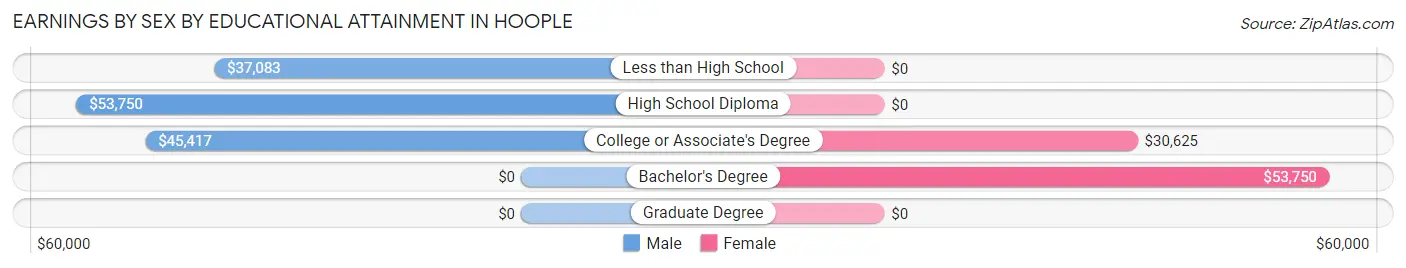
Earnings by Sex by Educational Attainment in Hoople
Average earnings in Hoople are $47,500 for men and $30,000 for women, a difference of 36.8%. Men with an educational attainment of high school diploma enjoy the highest average annual earnings of $53,750, while those with less than high school education earn the least with $37,083. Women with an educational attainment of bachelor's degree earn the most with the average annual earnings of $53,750, while those with college or associate's degree education have the smallest earnings of $30,625.
| Educational Attainment | Male Income | Female Income |
| Less than High School | $37,083 | $0 |
| High School Diploma | $53,750 | $0 |
| College or Associate's Degree | $45,417 | $30,625 |
| Bachelor's Degree | - | - |
| Graduate Degree | - | - |
| Total | $47,500 | $30,000 |
Family Income in Hoople
Family Income Brackets in Hoople
According to the Hoople family income data, there are 16 families falling into the $100,000 to $149,999 income range, which is the most common income bracket and makes up 23.9% of all families.
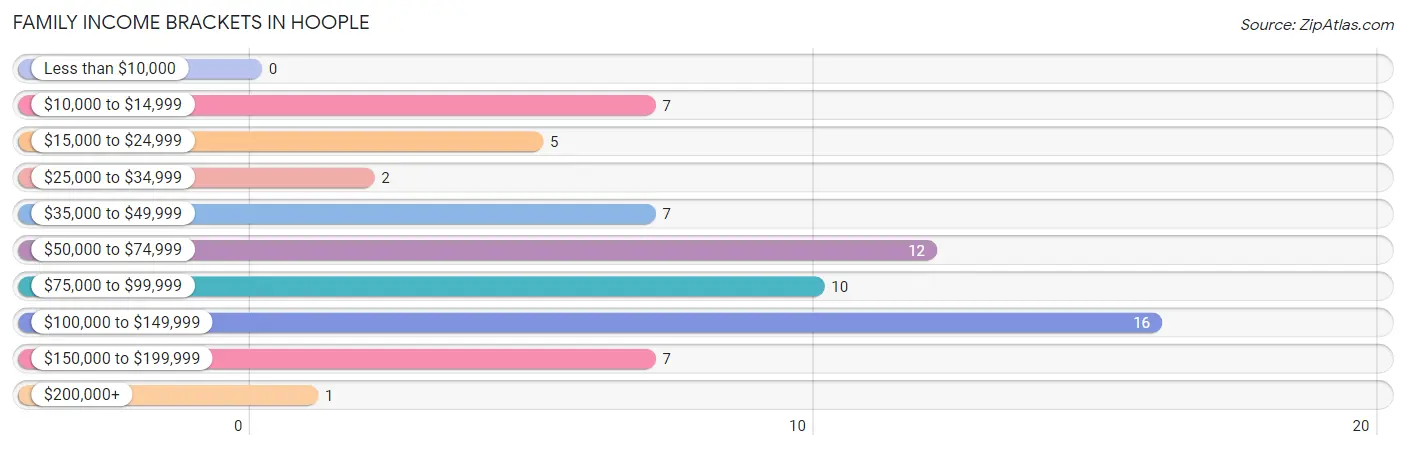
| Income Bracket | # Families | % Families |
| Less than $10,000 | 0 | 0.0% |
| $10,000 to $14,999 | 7 | 10.4% |
| $15,000 to $24,999 | 5 | 7.5% |
| $25,000 to $34,999 | 2 | 3.0% |
| $35,000 to $49,999 | 7 | 10.4% |
| $50,000 to $74,999 | 12 | 17.9% |
| $75,000 to $99,999 | 10 | 14.9% |
| $100,000 to $149,999 | 16 | 23.9% |
| $150,000 to $199,999 | 7 | 10.4% |
| $200,000+ | 1 | 1.5% |
Family Income by Famaliy Size in Hoople
5-person families (4 | 6.0%) account for the highest median family income in Hoople with $117,500 per family, while 2-person families (29 | 43.3%) have the highest median income of $55,104 per family member.
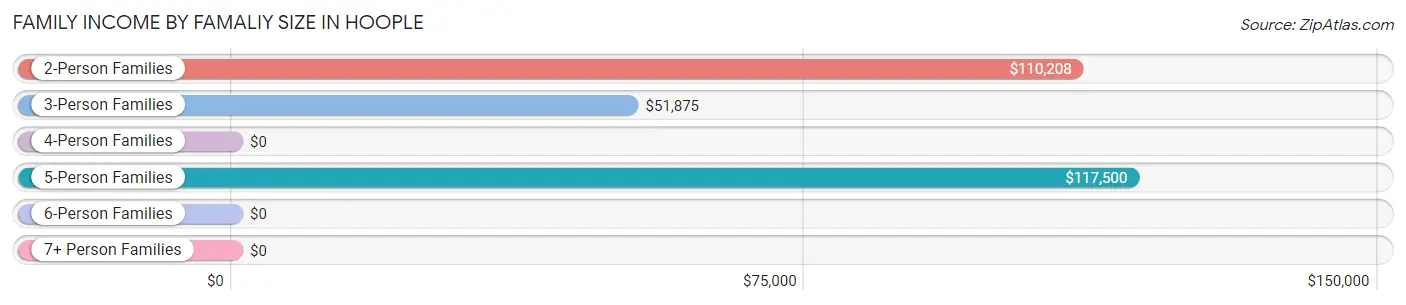
| Income Bracket | # Families | Median Income |
| 2-Person Families | 29 (43.3%) | $110,208 |
| 3-Person Families | 13 (19.4%) | $51,875 |
| 4-Person Families | 21 (31.3%) | $0 |
| 5-Person Families | 4 (6.0%) | $117,500 |
| 6-Person Families | 0 (0.0%) | $0 |
| 7+ Person Families | 0 (0.0%) | $0 |
| Total | 67 (100.0%) | $77,917 |
Family Income by Number of Earners in Hoople
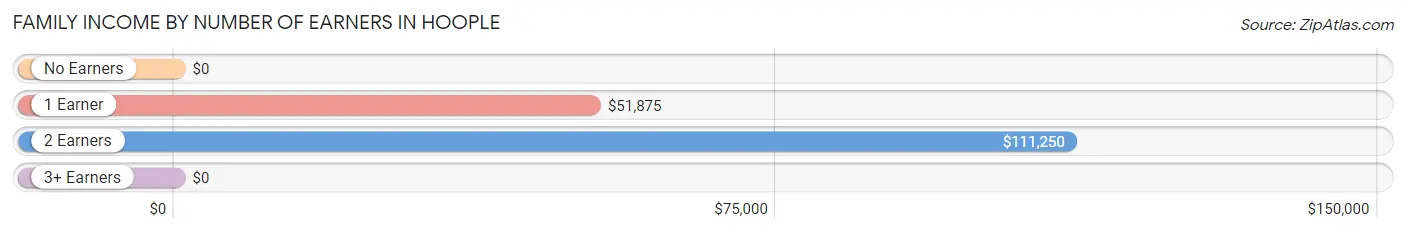
| Number of Earners | # Families | Median Income |
| No Earners | 2 (3.0%) | $0 |
| 1 Earner | 34 (50.7%) | $51,875 |
| 2 Earners | 31 (46.3%) | $111,250 |
| 3+ Earners | 0 (0.0%) | $0 |
| Total | 67 (100.0%) | $77,917 |
Household Income in Hoople
Household Income Brackets in Hoople
With 21 households falling in the category, the $50,000 to $74,999 income range is the most frequent in Hoople, accounting for 22.6% of all households.
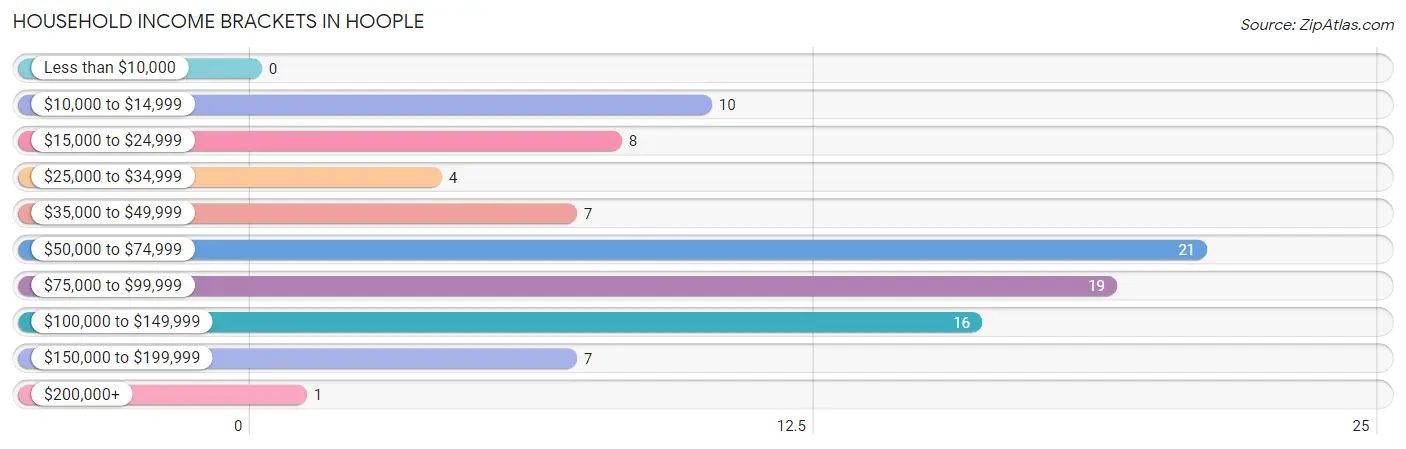
| Income Bracket | # Households | % Households |
| Less than $10,000 | 0 | 0.0% |
| $10,000 to $14,999 | 10 | 10.8% |
| $15,000 to $24,999 | 8 | 8.6% |
| $25,000 to $34,999 | 4 | 4.3% |
| $35,000 to $49,999 | 7 | 7.5% |
| $50,000 to $74,999 | 21 | 22.6% |
| $75,000 to $99,999 | 19 | 20.4% |
| $100,000 to $149,999 | 16 | 17.2% |
| $150,000 to $199,999 | 7 | 7.5% |
| $200,000+ | 1 | 1.1% |
Household Income by Householder Age in Hoople
The median household income in Hoople is $73,542, with the highest median household income of $82,917 found in the 45 to 64 years age bracket for the primary householder. A total of 31 households (33.3%) fall into this category. Meanwhile, the 15 to 24 years age bracket for the primary householder has the lowest median household income of $0, with 10 households (10.7%) in this group.
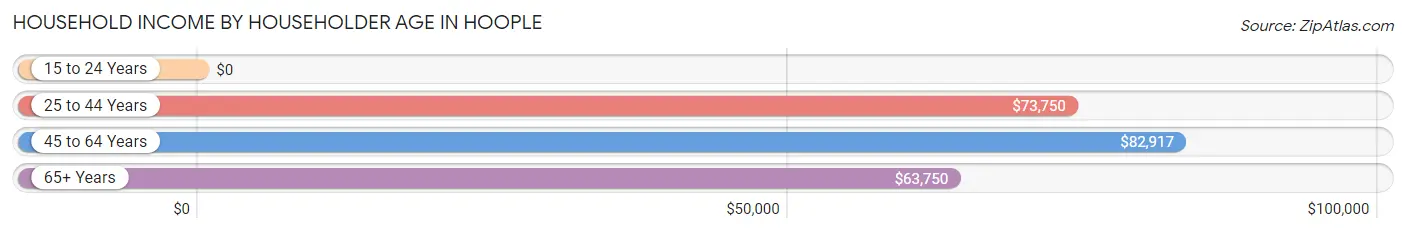
| Income Bracket | # Households | Median Income |
| 15 to 24 Years | 10 (10.7%) | $0 |
| 25 to 44 Years | 34 (36.6%) | $73,750 |
| 45 to 64 Years | 31 (33.3%) | $82,917 |
| 65+ Years | 18 (19.4%) | $63,750 |
| Total | 93 (100.0%) | $73,542 |
Poverty in Hoople
Income Below Poverty by Sex and Age in Hoople
With 16.1% poverty level for males and 24.0% for females among the residents of Hoople, 55 to 64 year old males and 18 to 24 year old females are the most vulnerable to poverty, with 9 males (36.0%) and 8 females (88.9%) in their respective age groups living below the poverty level.
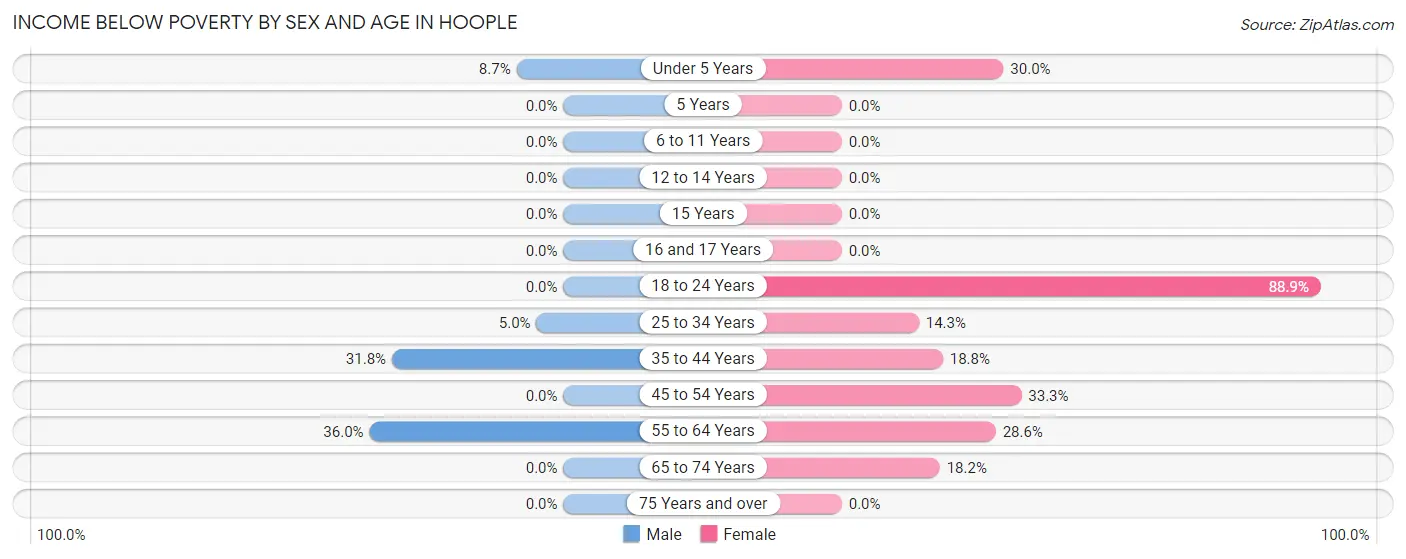
| Age Bracket | Male | Female |
| Under 5 Years | 2 (8.7%) | 6 (30.0%) |
| 5 Years | 0 (0.0%) | 0 (0.0%) |
| 6 to 11 Years | 0 (0.0%) | 0 (0.0%) |
| 12 to 14 Years | 0 (0.0%) | 0 (0.0%) |
| 15 Years | 0 (0.0%) | 0 (0.0%) |
| 16 and 17 Years | 0 (0.0%) | 0 (0.0%) |
| 18 to 24 Years | 0 (0.0%) | 8 (88.9%) |
| 25 to 34 Years | 1 (5.0%) | 1 (14.3%) |
| 35 to 44 Years | 7 (31.8%) | 3 (18.8%) |
| 45 to 54 Years | 0 (0.0%) | 3 (33.3%) |
| 55 to 64 Years | 9 (36.0%) | 6 (28.6%) |
| 65 to 74 Years | 0 (0.0%) | 2 (18.2%) |
| 75 Years and over | 0 (0.0%) | 0 (0.0%) |
| Total | 19 (16.1%) | 29 (24.0%) |
Income Above Poverty by Sex and Age in Hoople
According to the poverty statistics in Hoople, males aged 6 to 11 years and females aged 5 years are the age groups that are most secure financially, with 100.0% of males and 100.0% of females in these age groups living above the poverty line.
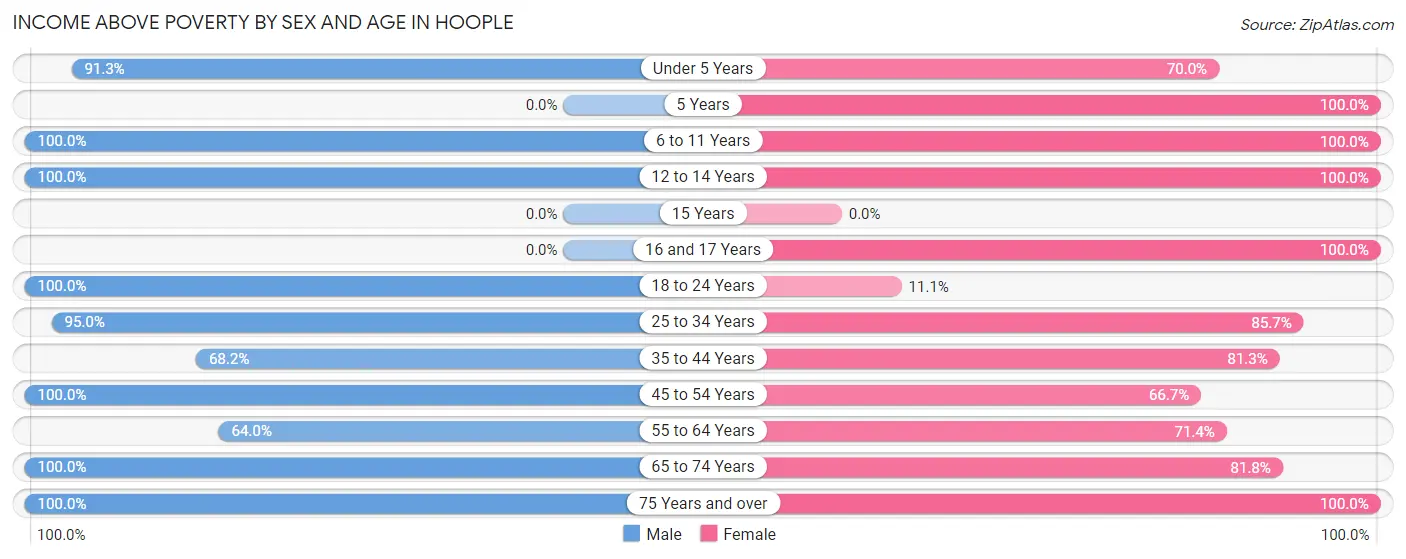
| Age Bracket | Male | Female |
| Under 5 Years | 21 (91.3%) | 14 (70.0%) |
| 5 Years | 0 (0.0%) | 7 (100.0%) |
| 6 to 11 Years | 6 (100.0%) | 14 (100.0%) |
| 12 to 14 Years | 1 (100.0%) | 3 (100.0%) |
| 15 Years | 0 (0.0%) | 0 (0.0%) |
| 16 and 17 Years | 0 (0.0%) | 2 (100.0%) |
| 18 to 24 Years | 3 (100.0%) | 1 (11.1%) |
| 25 to 34 Years | 19 (95.0%) | 6 (85.7%) |
| 35 to 44 Years | 15 (68.2%) | 13 (81.2%) |
| 45 to 54 Years | 1 (100.0%) | 6 (66.7%) |
| 55 to 64 Years | 16 (64.0%) | 15 (71.4%) |
| 65 to 74 Years | 14 (100.0%) | 9 (81.8%) |
| 75 Years and over | 3 (100.0%) | 2 (100.0%) |
| Total | 99 (83.9%) | 92 (76.0%) |
Income Below Poverty Among Married-Couple Families in Hoople
The poverty statistics for married-couple families in Hoople show that 22.2% or 12 of the total 54 families live below the poverty line. Families with 1 or 2 children have the highest poverty rate of 33.3%, comprising of 7 families. On the other hand, families with 3 or 4 children have the lowest poverty rate of 0.0%, which includes 0 families.
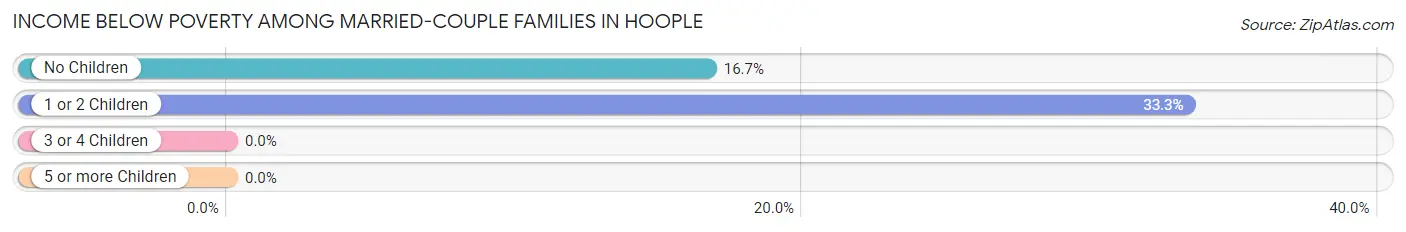
| Children | Above Poverty | Below Poverty |
| No Children | 25 (83.3%) | 5 (16.7%) |
| 1 or 2 Children | 14 (66.7%) | 7 (33.3%) |
| 3 or 4 Children | 3 (100.0%) | 0 (0.0%) |
| 5 or more Children | 0 (0.0%) | 0 (0.0%) |
| Total | 42 (77.8%) | 12 (22.2%) |
Income Below Poverty Among Single-Parent Households in Hoople
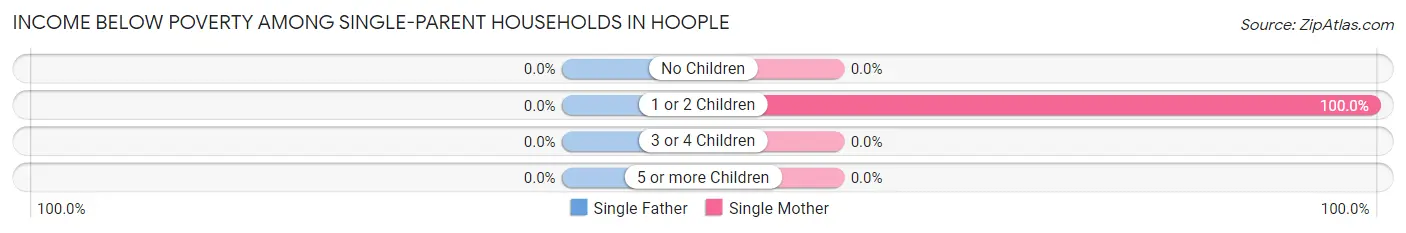
| Children | Single Father | Single Mother |
| No Children | 0 (0.0%) | 0 (0.0%) |
| 1 or 2 Children | 0 (0.0%) | 1 (100.0%) |
| 3 or 4 Children | 0 (0.0%) | 0 (0.0%) |
| 5 or more Children | 0 (0.0%) | 0 (0.0%) |
| Total | 0 (0.0%) | 1 (50.0%) |
Income Below Poverty Among Married-Couple vs Single-Parent Households in Hoople
The poverty data for Hoople shows that 12 of the married-couple family households (22.2%) and 1 of the single-parent households (7.7%) are living below the poverty level. Within the married-couple family households, those with 1 or 2 children have the highest poverty rate, with 7 households (33.3%) falling below the poverty line. Among the single-parent households, those with 1 or 2 children have the highest poverty rate, with 1 household (12.5%) living below poverty.
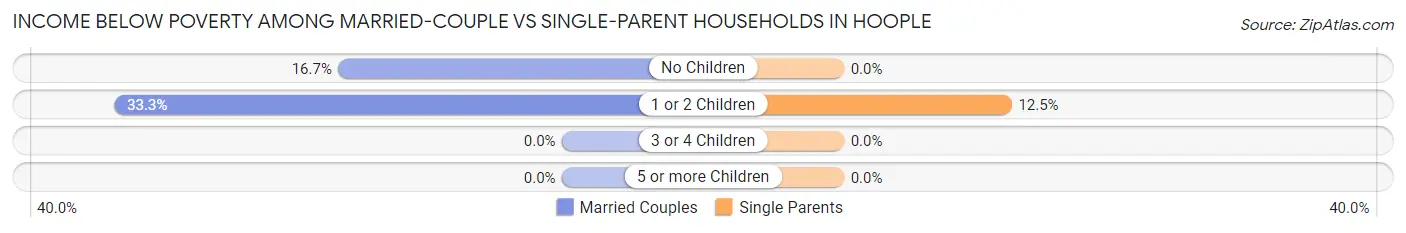
| Children | Married-Couple Families | Single-Parent Households |
| No Children | 5 (16.7%) | 0 (0.0%) |
| 1 or 2 Children | 7 (33.3%) | 1 (12.5%) |
| 3 or 4 Children | 0 (0.0%) | 0 (0.0%) |
| 5 or more Children | 0 (0.0%) | 0 (0.0%) |
| Total | 12 (22.2%) | 1 (7.7%) |
Race in Hoople
The most populous races in Hoople are White / Caucasian (184 | 77.0%), Hispanic or Latino (68 | 28.4%), and Two or more Races (55 | 23.0%).
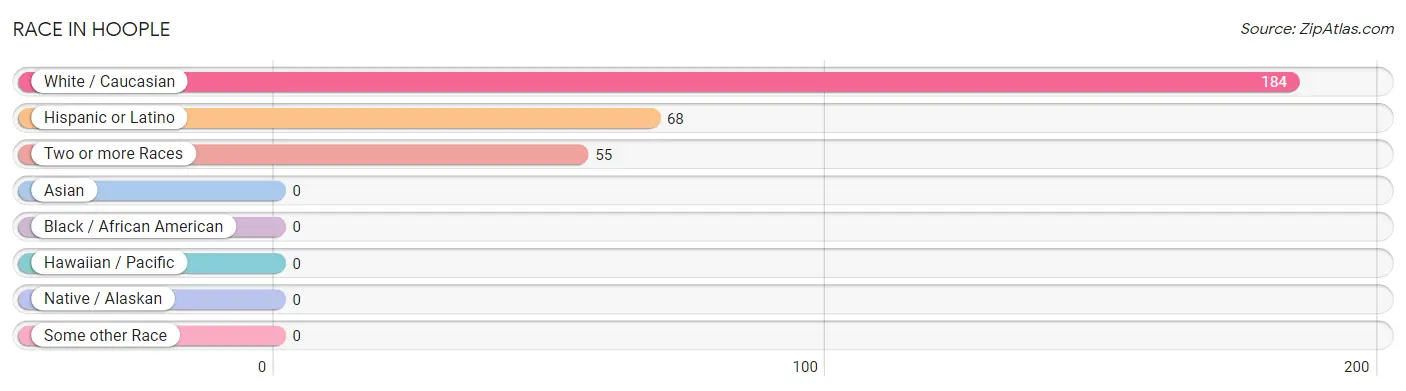
| Race | # Population | % Population |
| Asian | 0 | 0.0% |
| Black / African American | 0 | 0.0% |
| Hawaiian / Pacific | 0 | 0.0% |
| Hispanic or Latino | 68 | 28.4% |
| Native / Alaskan | 0 | 0.0% |
| White / Caucasian | 184 | 77.0% |
| Two or more Races | 55 | 23.0% |
| Some other Race | 0 | 0.0% |
| Total | 239 | 100.0% |
Ancestry in Hoople
The most populous ancestries reported in Hoople are Mexican (68 | 28.4%), Norwegian (68 | 28.4%), German (58 | 24.3%), Icelander (25 | 10.5%), and Czech (16 | 6.7%), together accounting for 98.3% of all Hoople residents.
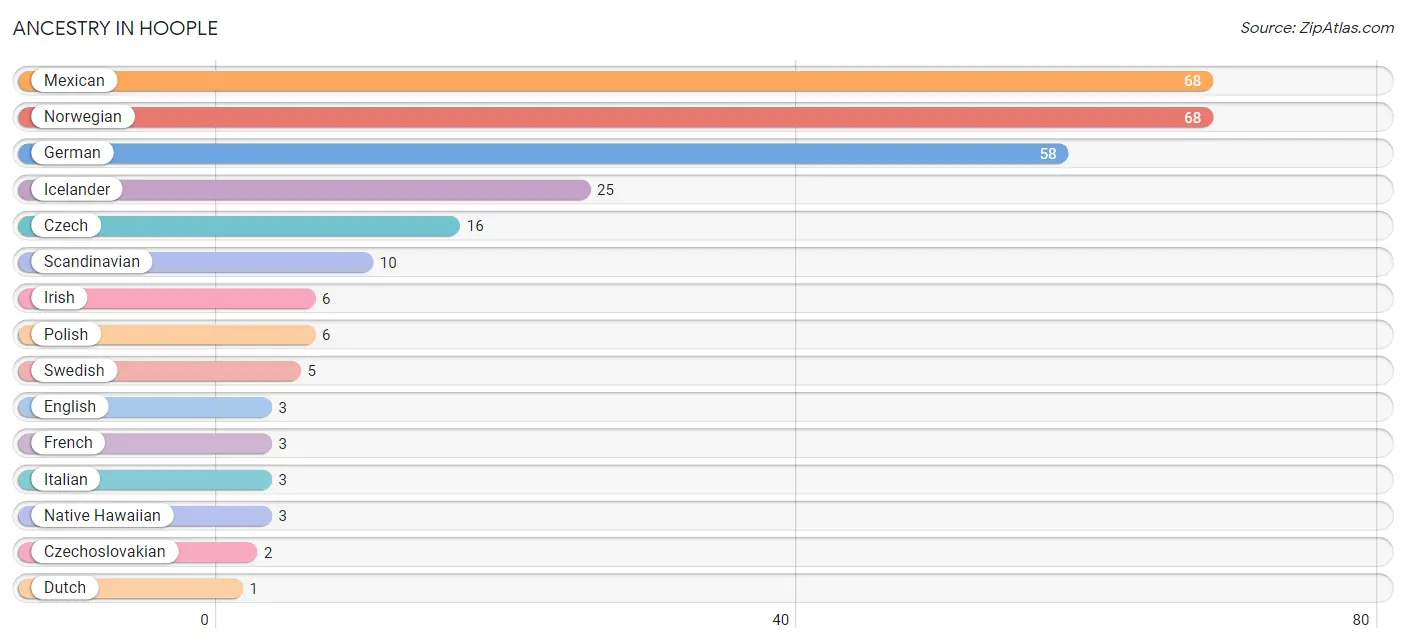
| Ancestry | # Population | % Population |
| Czech | 16 | 6.7% |
| Czechoslovakian | 2 | 0.8% |
| Dutch | 1 | 0.4% |
| English | 3 | 1.3% |
| French | 3 | 1.3% |
| German | 58 | 24.3% |
| Icelander | 25 | 10.5% |
| Irish | 6 | 2.5% |
| Italian | 3 | 1.3% |
| Mexican | 68 | 28.4% |
| Native Hawaiian | 3 | 1.3% |
| Norwegian | 68 | 28.4% |
| Polish | 6 | 2.5% |
| Russian | 1 | 0.4% |
| Scandinavian | 10 | 4.2% |
| Swedish | 5 | 2.1% | View All 16 Rows |
Immigrants in Hoople
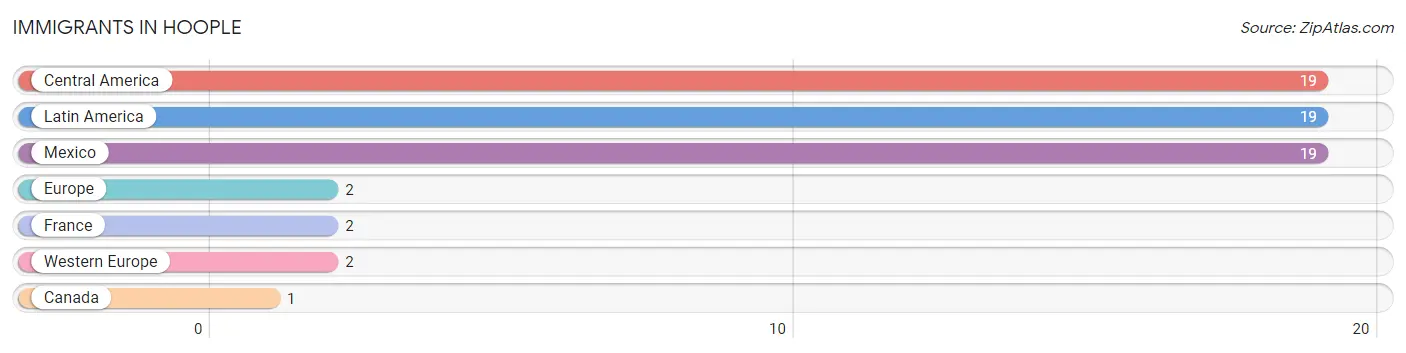
The most numerous immigrant groups reported in Hoople came from Central America (19 | 8.0%), Latin America (19 | 8.0%), Mexico (19 | 8.0%), Europe (2 | 0.8%), and France (2 | 0.8%), together accounting for 25.5% of all Hoople residents.
| Immigration Origin | # Population | % Population |
| Canada | 1 | 0.4% |
| Central America | 19 | 8.0% |
| Europe | 2 | 0.8% |
| France | 2 | 0.8% |
| Latin America | 19 | 8.0% |
| Mexico | 19 | 8.0% |
| Western Europe | 2 | 0.8% | View All 7 Rows |
Sex and Age in Hoople
Sex and Age in Hoople
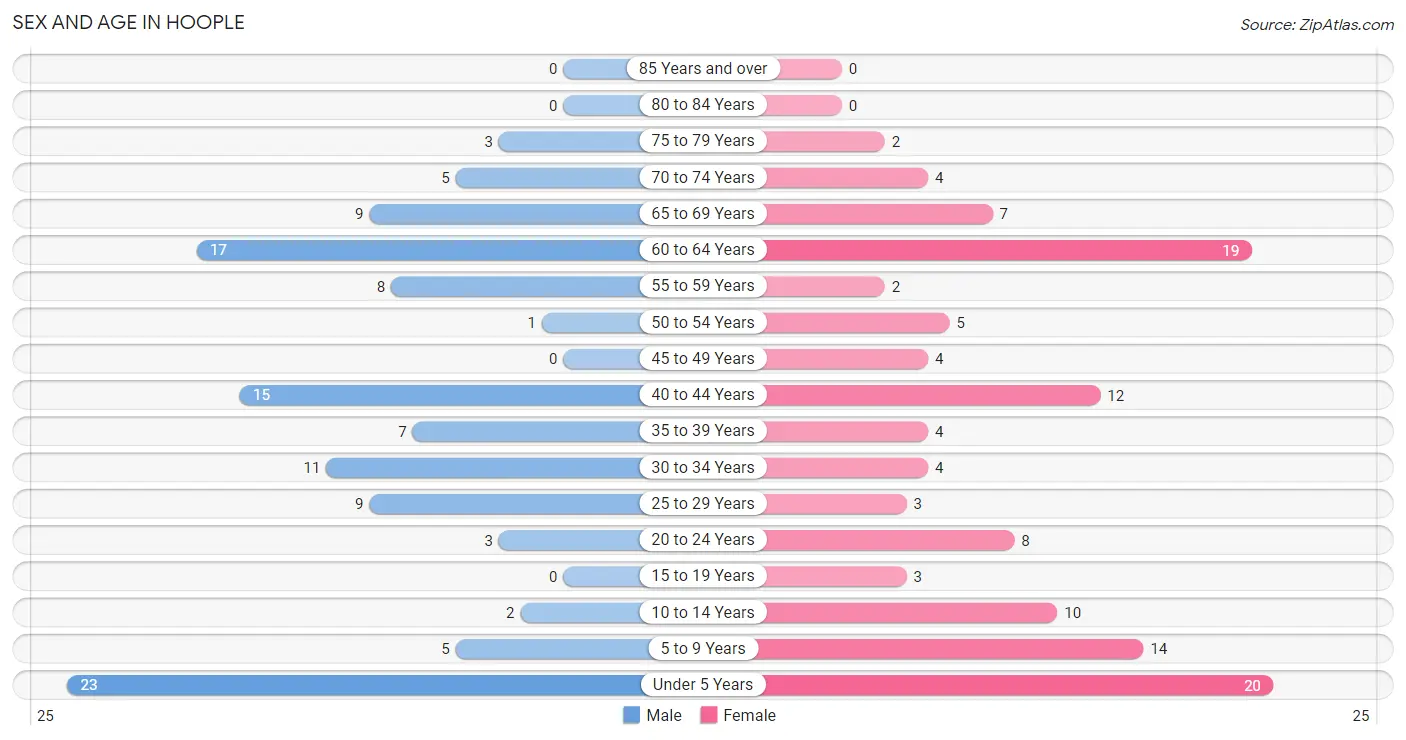
The most populous age groups in Hoople are Under 5 Years (23 | 19.5%) for men and Under 5 Years (20 | 16.5%) for women.
| Age Bracket | Male | Female |
| Under 5 Years | 23 (19.5%) | 20 (16.5%) |
| 5 to 9 Years | 5 (4.2%) | 14 (11.6%) |
| 10 to 14 Years | 2 (1.7%) | 10 (8.3%) |
| 15 to 19 Years | 0 (0.0%) | 3 (2.5%) |
| 20 to 24 Years | 3 (2.5%) | 8 (6.6%) |
| 25 to 29 Years | 9 (7.6%) | 3 (2.5%) |
| 30 to 34 Years | 11 (9.3%) | 4 (3.3%) |
| 35 to 39 Years | 7 (5.9%) | 4 (3.3%) |
| 40 to 44 Years | 15 (12.7%) | 12 (9.9%) |
| 45 to 49 Years | 0 (0.0%) | 4 (3.3%) |
| 50 to 54 Years | 1 (0.9%) | 5 (4.1%) |
| 55 to 59 Years | 8 (6.8%) | 2 (1.7%) |
| 60 to 64 Years | 17 (14.4%) | 19 (15.7%) |
| 65 to 69 Years | 9 (7.6%) | 7 (5.8%) |
| 70 to 74 Years | 5 (4.2%) | 4 (3.3%) |
| 75 to 79 Years | 3 (2.5%) | 2 (1.7%) |
| 80 to 84 Years | 0 (0.0%) | 0 (0.0%) |
| 85 Years and over | 0 (0.0%) | 0 (0.0%) |
| Total | 118 (100.0%) | 121 (100.0%) |
Families and Households in Hoople
Median Family Size in Hoople
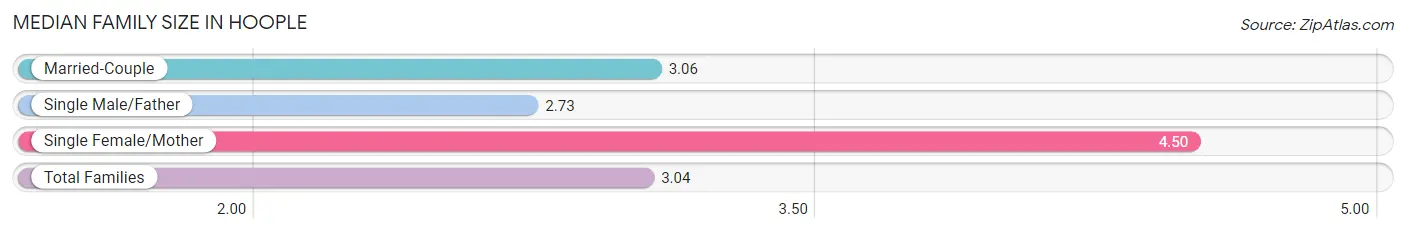
The median family size in Hoople is 3.04 persons per family, with single female/mother families (2 | 3.0%) accounting for the largest median family size of 4.5 persons per family. On the other hand, single male/father families (11 | 16.4%) represent the smallest median family size with 2.73 persons per family.
| Family Type | # Families | Family Size |
| Married-Couple | 54 (80.6%) | 3.06 |
| Single Male/Father | 11 (16.4%) | 2.73 |
| Single Female/Mother | 2 (3.0%) | 4.50 |
| Total Families | 67 (100.0%) | 3.04 |
Median Household Size in Hoople
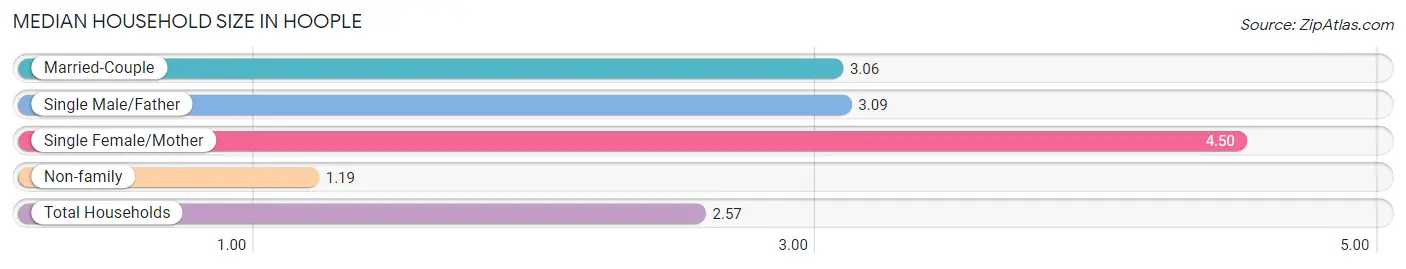
The median household size in Hoople is 2.57 persons per household, with single female/mother households (2 | 2.1%) accounting for the largest median household size of 4.5 persons per household. non-family households (26 | 28.0%) represent the smallest median household size with 1.19 persons per household.
| Household Type | # Households | Household Size |
| Married-Couple | 54 (58.1%) | 3.06 |
| Single Male/Father | 11 (11.8%) | 3.09 |
| Single Female/Mother | 2 (2.1%) | 4.50 |
| Non-family | 26 (28.0%) | 1.19 |
| Total Households | 93 (100.0%) | 2.57 |
Household Size by Marriage Status in Hoople
Out of a total of 93 households in Hoople, 67 (72.0%) are family households, while 26 (28.0%) are nonfamily households. The most numerous type of family households are 2-person households, comprising 29, and the most common type of nonfamily households are 1-person households, comprising 23.
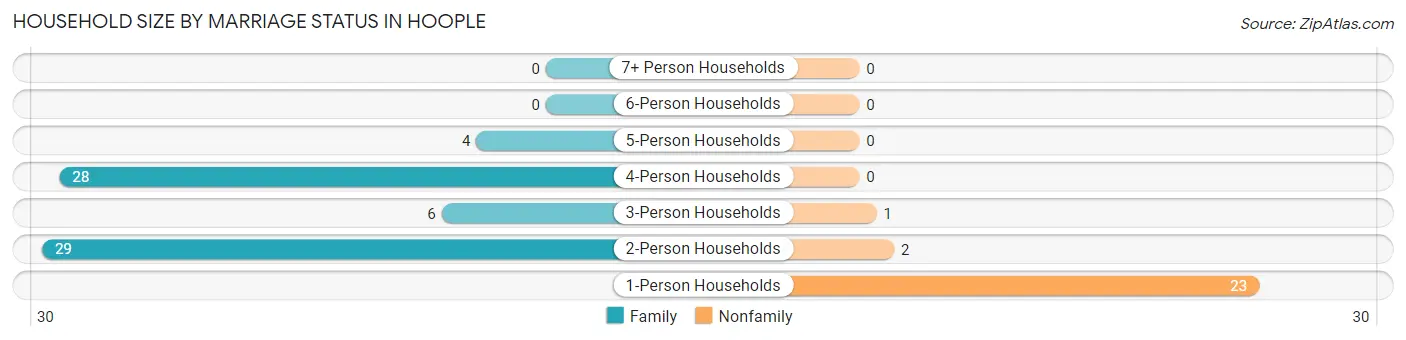
| Household Size | Family Households | Nonfamily Households |
| 1-Person Households | - | 23 (24.7%) |
| 2-Person Households | 29 (31.2%) | 2 (2.1%) |
| 3-Person Households | 6 (6.5%) | 1 (1.1%) |
| 4-Person Households | 28 (30.1%) | 0 (0.0%) |
| 5-Person Households | 4 (4.3%) | 0 (0.0%) |
| 6-Person Households | 0 (0.0%) | 0 (0.0%) |
| 7+ Person Households | 0 (0.0%) | 0 (0.0%) |
| Total | 67 (72.0%) | 26 (28.0%) |
Female Fertility in Hoople
Fertility by Age in Hoople
Average fertility rate in Hoople is 105.0 births per 1,000 women. Women in the age bracket of 35 to 50 years have the highest fertility rate with 200.0 births per 1,000 women. Women in the age bracket of 35 to 50 years acount for 100.0% of all women with births.
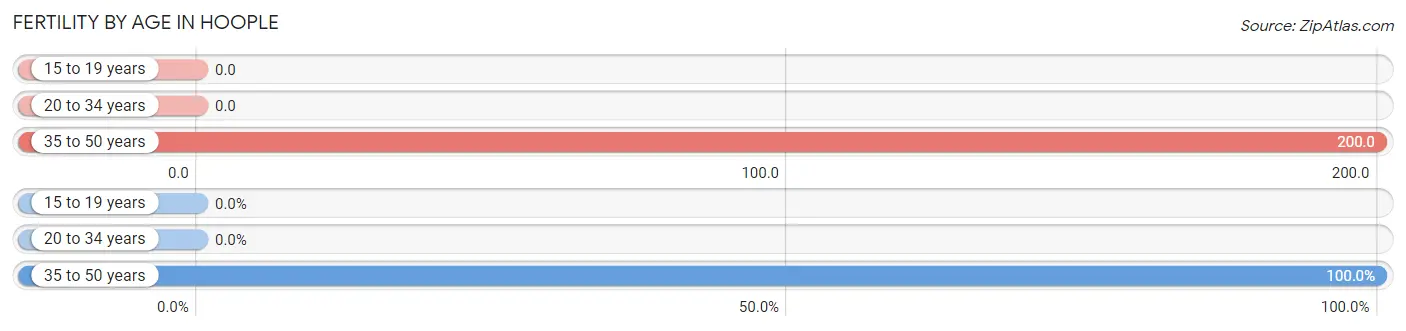
| Age Bracket | Women with Births | Births / 1,000 Women |
| 15 to 19 years | 0 (0.0%) | 0.0 |
| 20 to 34 years | 0 (0.0%) | 0.0 |
| 35 to 50 years | 4 (100.0%) | 200.0 |
| Total | 4 (100.0%) | 105.0 |
Fertility by Age by Marriage Status in Hoople
25.0% of women with births (4) in Hoople are married. The highest percentage of unmarried women with births falls into 35 to 50 years age bracket with 75.0% of them unmarried at the time of birth, while the lowest percentage of unmarried women with births belong to 35 to 50 years age bracket with 75.0% of them unmarried.
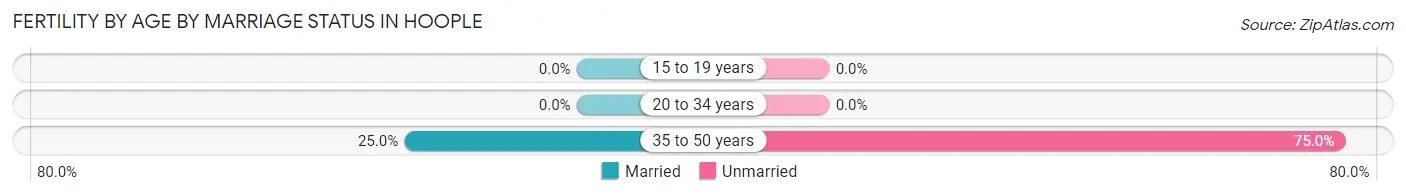
| Age Bracket | Married | Unmarried |
| 15 to 19 years | 0 (0.0%) | 0 (0.0%) |
| 20 to 34 years | 0 (0.0%) | 0 (0.0%) |
| 35 to 50 years | 1 (25.0%) | 3 (75.0%) |
| Total | 1 (25.0%) | 3 (75.0%) |
Fertility by Education in Hoople
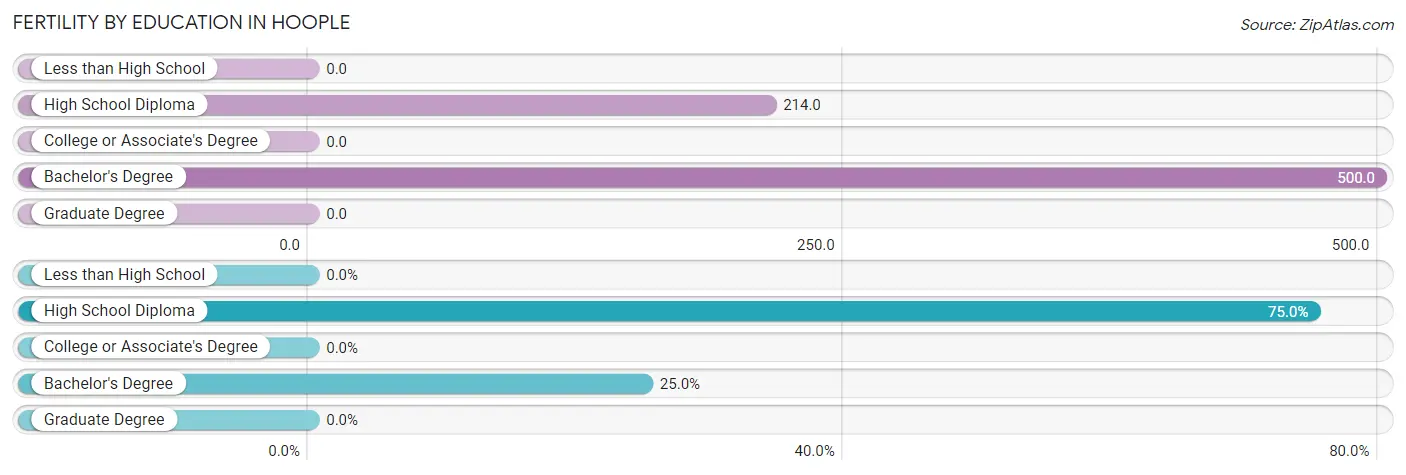
| Educational Attainment | Women with Births | Births / 1,000 Women |
| Less than High School | 0 (0.0%) | 0.0 |
| High School Diploma | 3 (75.0%) | 214.0 |
| College or Associate's Degree | 0 (0.0%) | 0.0 |
| Bachelor's Degree | 1 (25.0%) | 500.0 |
| Graduate Degree | 0 (0.0%) | 0.0 |
| Total | 4 (100.0%) | 105.0 |
Fertility by Education by Marriage Status in Hoople
75.0% of women with births in Hoople are unmarried. Women with the educational attainment of bachelor's degree are most likely to be married with 100.0% of them married at childbirth, while women with the educational attainment of high school diploma are least likely to be married with 100.0% of them unmarried at childbirth.
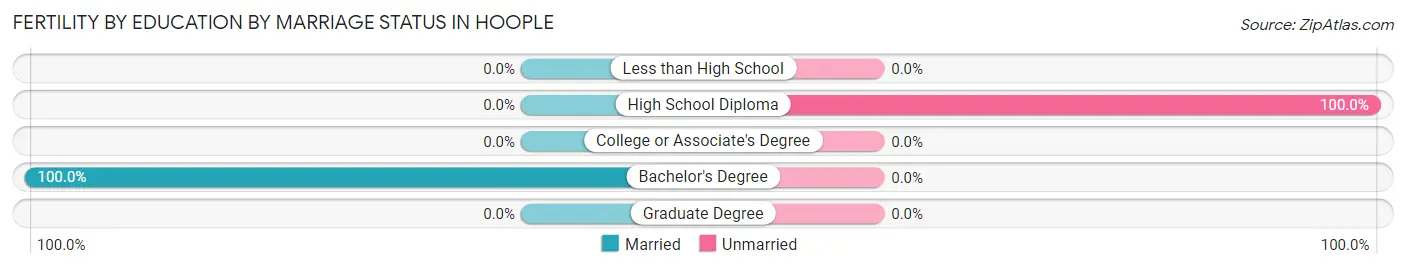
| Educational Attainment | Married | Unmarried |
| Less than High School | 0 (0.0%) | 0 (0.0%) |
| High School Diploma | 0 (0.0%) | 3 (100.0%) |
| College or Associate's Degree | 0 (0.0%) | 0 (0.0%) |
| Bachelor's Degree | 1 (100.0%) | 0 (0.0%) |
| Graduate Degree | 0 (0.0%) | 0 (0.0%) |
| Total | 1 (25.0%) | 3 (75.0%) |
Employment Characteristics in Hoople
Employment by Class of Employer in Hoople
Among the 110 employed individuals in Hoople, private company employees (47 | 42.7%), self-employed (not incorporated) (22 | 20.0%), and local government employees (18 | 16.4%) make up the most common classes of employment.
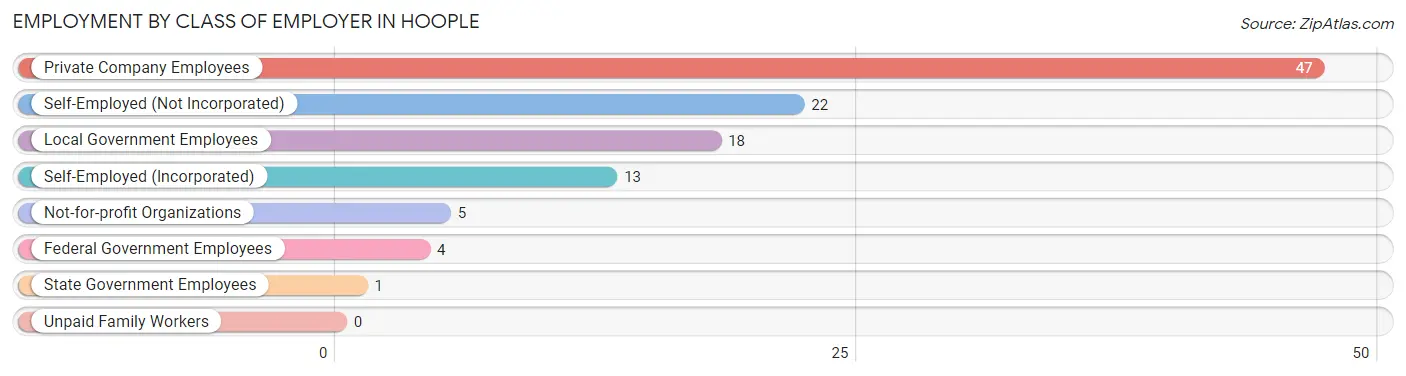
| Employer Class | # Employees | % Employees |
| Private Company Employees | 47 | 42.7% |
| Self-Employed (Incorporated) | 13 | 11.8% |
| Self-Employed (Not Incorporated) | 22 | 20.0% |
| Not-for-profit Organizations | 5 | 4.5% |
| Local Government Employees | 18 | 16.4% |
| State Government Employees | 1 | 0.9% |
| Federal Government Employees | 4 | 3.6% |
| Unpaid Family Workers | 0 | 0.0% |
| Total | 110 | 100.0% |
Employment Status by Age in Hoople
According to the labor force statistics for Hoople, out of the total population over 16 years of age (165), 71.5% or 118 individuals are in the labor force, with 6.8% or 8 of them unemployed. The age group with the highest labor force participation rate is 30 to 34 years, with 100.0% or 15 individuals in the labor force. Within the labor force, the 45 to 54 years age range has the highest percentage of unemployed individuals, with 42.9% or 3 of them being unemployed.
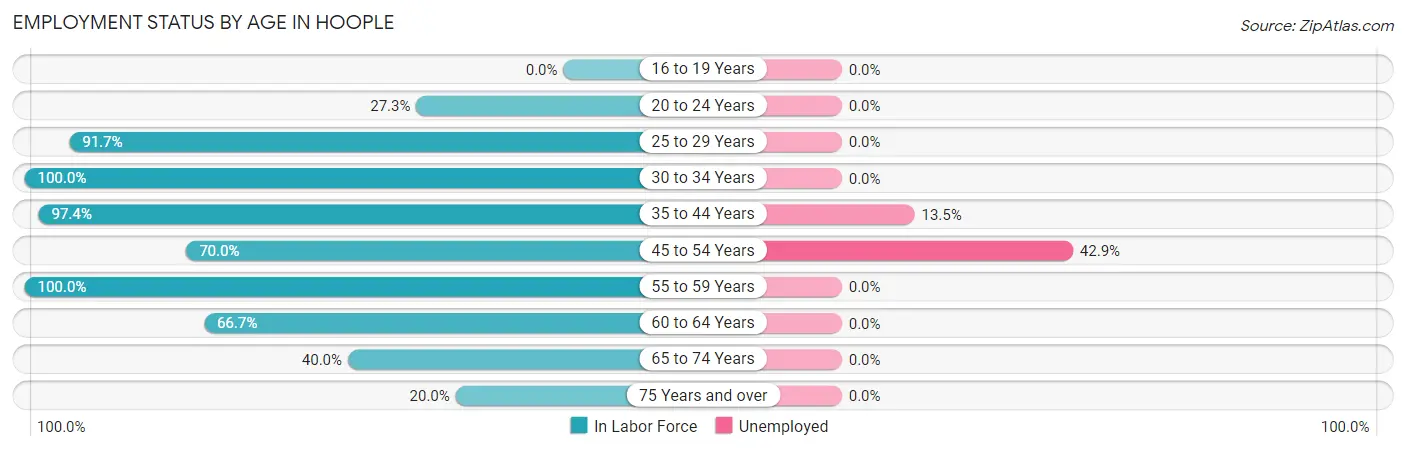
| Age Bracket | In Labor Force | Unemployed |
| 16 to 19 Years | 0 (0.0%) | 0 (0.0%) |
| 20 to 24 Years | 3 (27.3%) | 0 (0.0%) |
| 25 to 29 Years | 11 (91.7%) | 0 (0.0%) |
| 30 to 34 Years | 15 (100.0%) | 0 (0.0%) |
| 35 to 44 Years | 37 (97.4%) | 5 (13.5%) |
| 45 to 54 Years | 7 (70.0%) | 3 (42.9%) |
| 55 to 59 Years | 10 (100.0%) | 0 (0.0%) |
| 60 to 64 Years | 24 (66.7%) | 0 (0.0%) |
| 65 to 74 Years | 10 (40.0%) | 0 (0.0%) |
| 75 Years and over | 1 (20.0%) | 0 (0.0%) |
| Total | 118 (71.5%) | 8 (6.8%) |
Employment Status by Educational Attainment in Hoople
According to labor force statistics for Hoople, 86.0% of individuals (104) out of the total population between 25 and 64 years of age (121) are in the labor force, with 7.7% or 8 of them being unemployed. The group with the highest labor force participation rate are those with the educational attainment of bachelor's degree or higher, with 92.0% or 23 individuals in the labor force. Within the labor force, individuals with less than high school education have the highest percentage of unemployment, with 53.3% or 8 of them being unemployed.
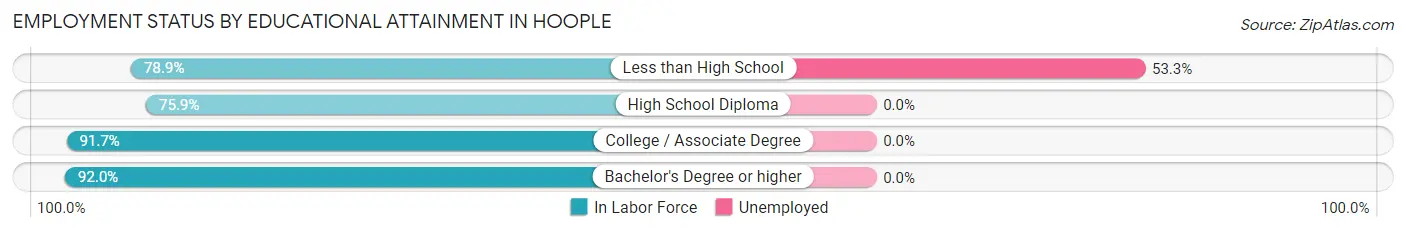
| Educational Attainment | In Labor Force | Unemployed |
| Less than High School | 15 (78.9%) | 10 (53.3%) |
| High School Diploma | 22 (75.9%) | 0 (0.0%) |
| College / Associate Degree | 44 (91.7%) | 0 (0.0%) |
| Bachelor's Degree or higher | 23 (92.0%) | 0 (0.0%) |
| Total | 104 (86.0%) | 9 (7.7%) |
Employment Occupations by Sex in Hoople
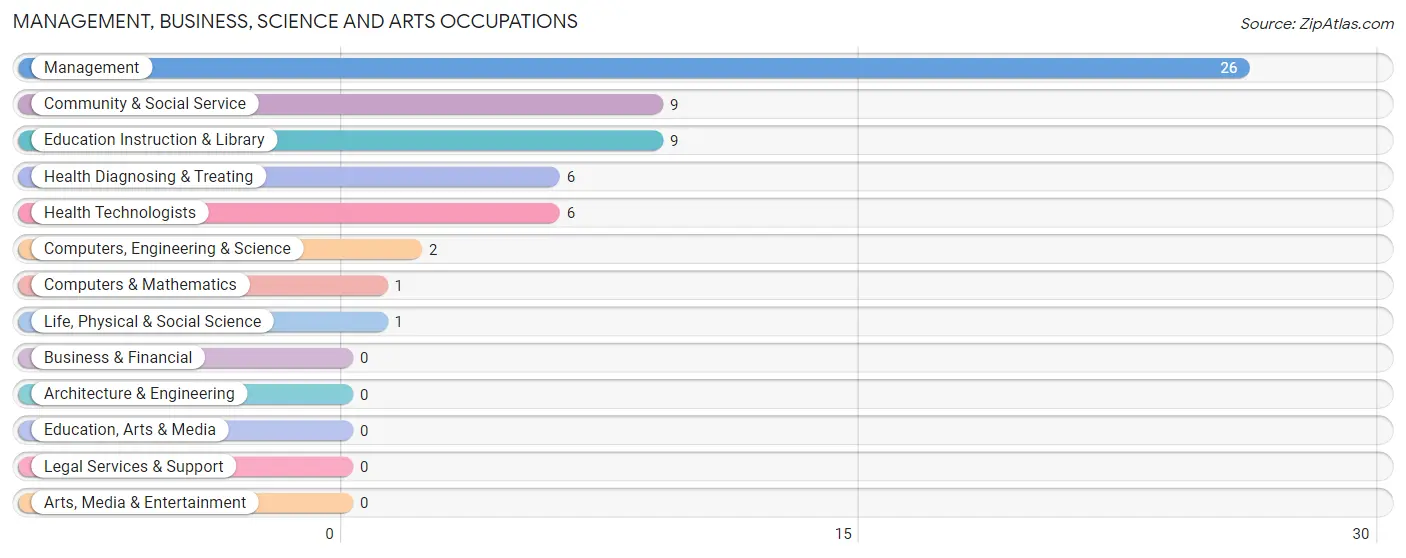
Management, Business, Science and Arts Occupations
The most common Management, Business, Science and Arts occupations in Hoople are Management (26 | 23.6%), Community & Social Service (9 | 8.2%), Education Instruction & Library (9 | 8.2%), Health Diagnosing & Treating (6 | 5.4%), and Health Technologists (6 | 5.4%).
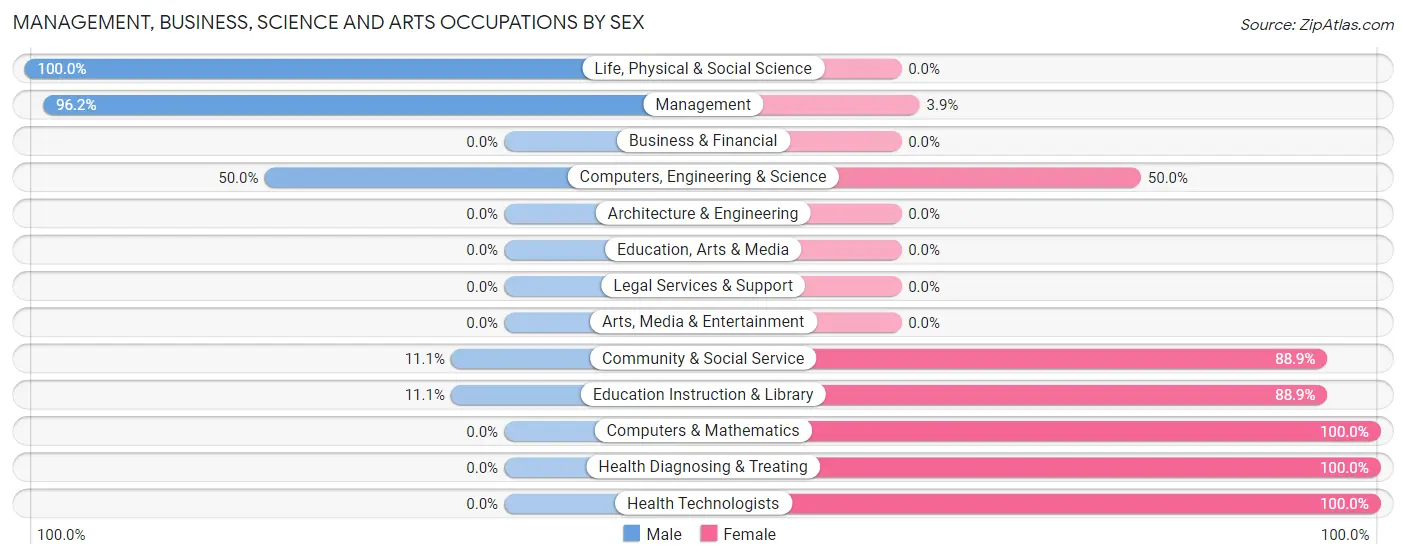
Management, Business, Science and Arts Occupations by Sex
Within the Management, Business, Science and Arts occupations in Hoople, the most male-oriented occupations are Life, Physical & Social Science (100.0%), Management (96.2%), and Computers, Engineering & Science (50.0%), while the most female-oriented occupations are Computers & Mathematics (100.0%), Health Diagnosing & Treating (100.0%), and Health Technologists (100.0%).
| Occupation | Male | Female |
| Management | 25 (96.2%) | 1 (3.8%) |
| Business & Financial | 0 (0.0%) | 0 (0.0%) |
| Computers, Engineering & Science | 1 (50.0%) | 1 (50.0%) |
| Computers & Mathematics | 0 (0.0%) | 1 (100.0%) |
| Architecture & Engineering | 0 (0.0%) | 0 (0.0%) |
| Life, Physical & Social Science | 1 (100.0%) | 0 (0.0%) |
| Community & Social Service | 1 (11.1%) | 8 (88.9%) |
| Education, Arts & Media | 0 (0.0%) | 0 (0.0%) |
| Legal Services & Support | 0 (0.0%) | 0 (0.0%) |
| Education Instruction & Library | 1 (11.1%) | 8 (88.9%) |
| Arts, Media & Entertainment | 0 (0.0%) | 0 (0.0%) |
| Health Diagnosing & Treating | 0 (0.0%) | 6 (100.0%) |
| Health Technologists | 0 (0.0%) | 6 (100.0%) |
| Total (Category) | 27 (62.8%) | 16 (37.2%) |
| Total (Overall) | 80 (72.7%) | 30 (27.3%) |
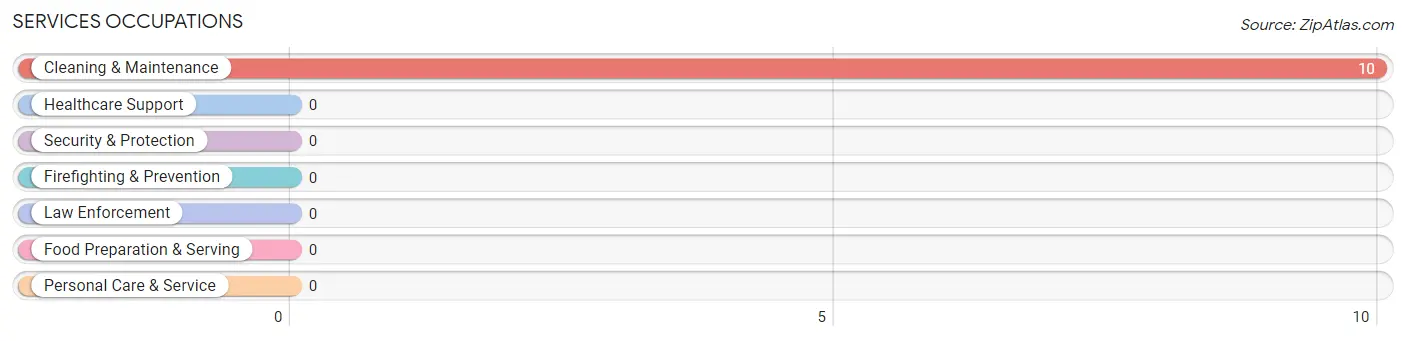
Services Occupations
The most common Services occupations in Hoople are , and Cleaning & Maintenance (10 | 9.1%).
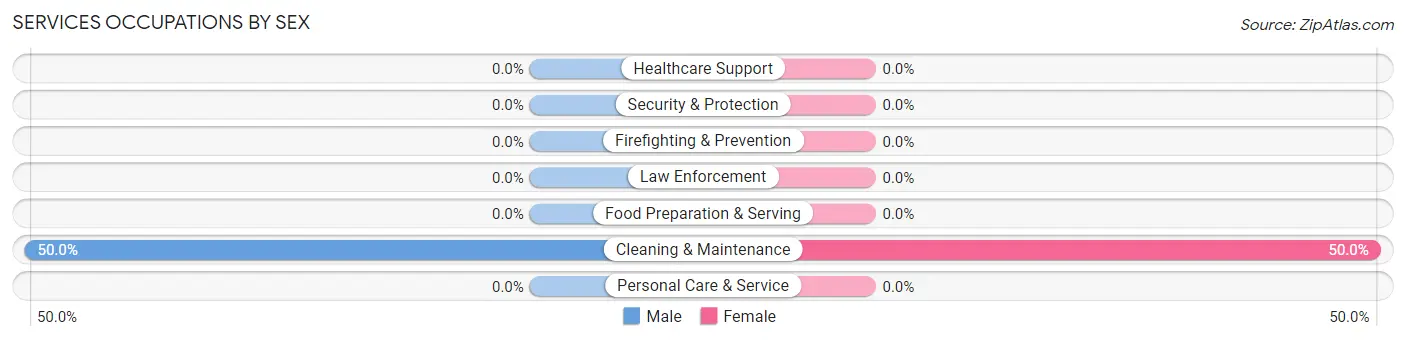
Services Occupations by Sex
| Occupation | Male | Female |
| Healthcare Support | 0 (0.0%) | 0 (0.0%) |
| Security & Protection | 0 (0.0%) | 0 (0.0%) |
| Firefighting & Prevention | 0 (0.0%) | 0 (0.0%) |
| Law Enforcement | 0 (0.0%) | 0 (0.0%) |
| Food Preparation & Serving | 0 (0.0%) | 0 (0.0%) |
| Cleaning & Maintenance | 5 (50.0%) | 5 (50.0%) |
| Personal Care & Service | 0 (0.0%) | 0 (0.0%) |
| Total (Category) | 5 (50.0%) | 5 (50.0%) |
| Total (Overall) | 80 (72.7%) | 30 (27.3%) |
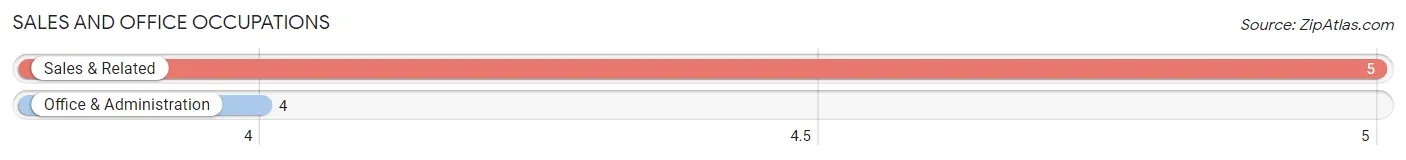
Sales and Office Occupations
The most common Sales and Office occupations in Hoople are Sales & Related (5 | 4.5%), and Office & Administration (4 | 3.6%).
Sales and Office Occupations by Sex
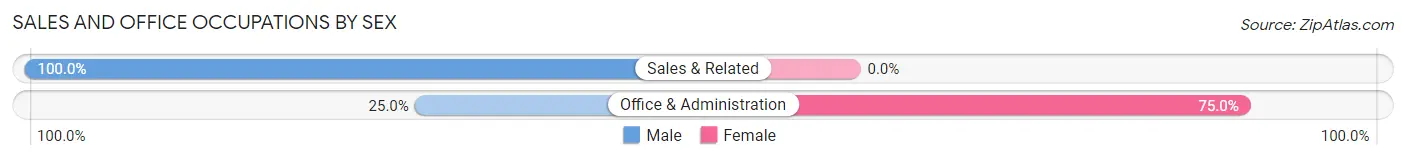
| Occupation | Male | Female |
| Sales & Related | 5 (100.0%) | 0 (0.0%) |
| Office & Administration | 1 (25.0%) | 3 (75.0%) |
| Total (Category) | 6 (66.7%) | 3 (33.3%) |
| Total (Overall) | 80 (72.7%) | 30 (27.3%) |
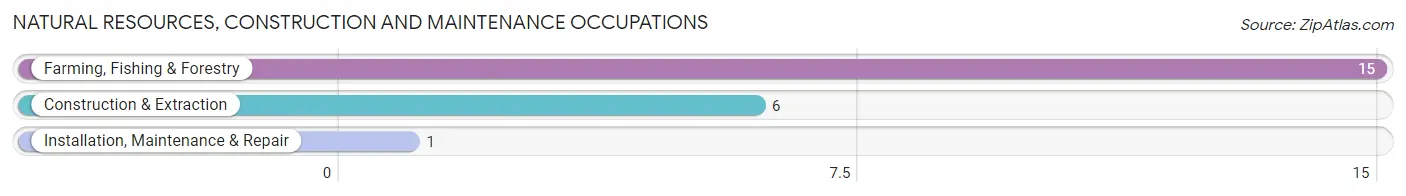
Natural Resources, Construction and Maintenance Occupations
The most common Natural Resources, Construction and Maintenance occupations in Hoople are Farming, Fishing & Forestry (15 | 13.6%), Construction & Extraction (6 | 5.4%), and Installation, Maintenance & Repair (1 | 0.9%).
Natural Resources, Construction and Maintenance Occupations by Sex
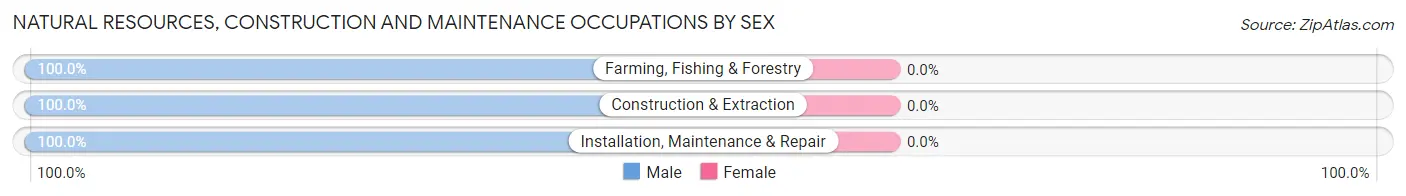
| Occupation | Male | Female |
| Farming, Fishing & Forestry | 15 (100.0%) | 0 (0.0%) |
| Construction & Extraction | 6 (100.0%) | 0 (0.0%) |
| Installation, Maintenance & Repair | 1 (100.0%) | 0 (0.0%) |
| Total (Category) | 22 (100.0%) | 0 (0.0%) |
| Total (Overall) | 80 (72.7%) | 30 (27.3%) |
Production, Transportation and Moving Occupations
The most common Production, Transportation and Moving occupations in Hoople are Transportation (12 | 10.9%), Material Moving (10 | 9.1%), and Production (4 | 3.6%).

Production, Transportation and Moving Occupations by Sex
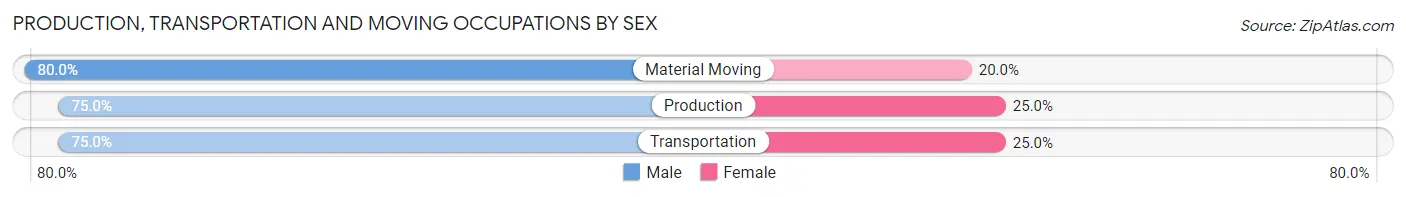
| Occupation | Male | Female |
| Production | 3 (75.0%) | 1 (25.0%) |
| Transportation | 9 (75.0%) | 3 (25.0%) |
| Material Moving | 8 (80.0%) | 2 (20.0%) |
| Total (Category) | 20 (76.9%) | 6 (23.1%) |
| Total (Overall) | 80 (72.7%) | 30 (27.3%) |
Employment Industries by Sex in Hoople
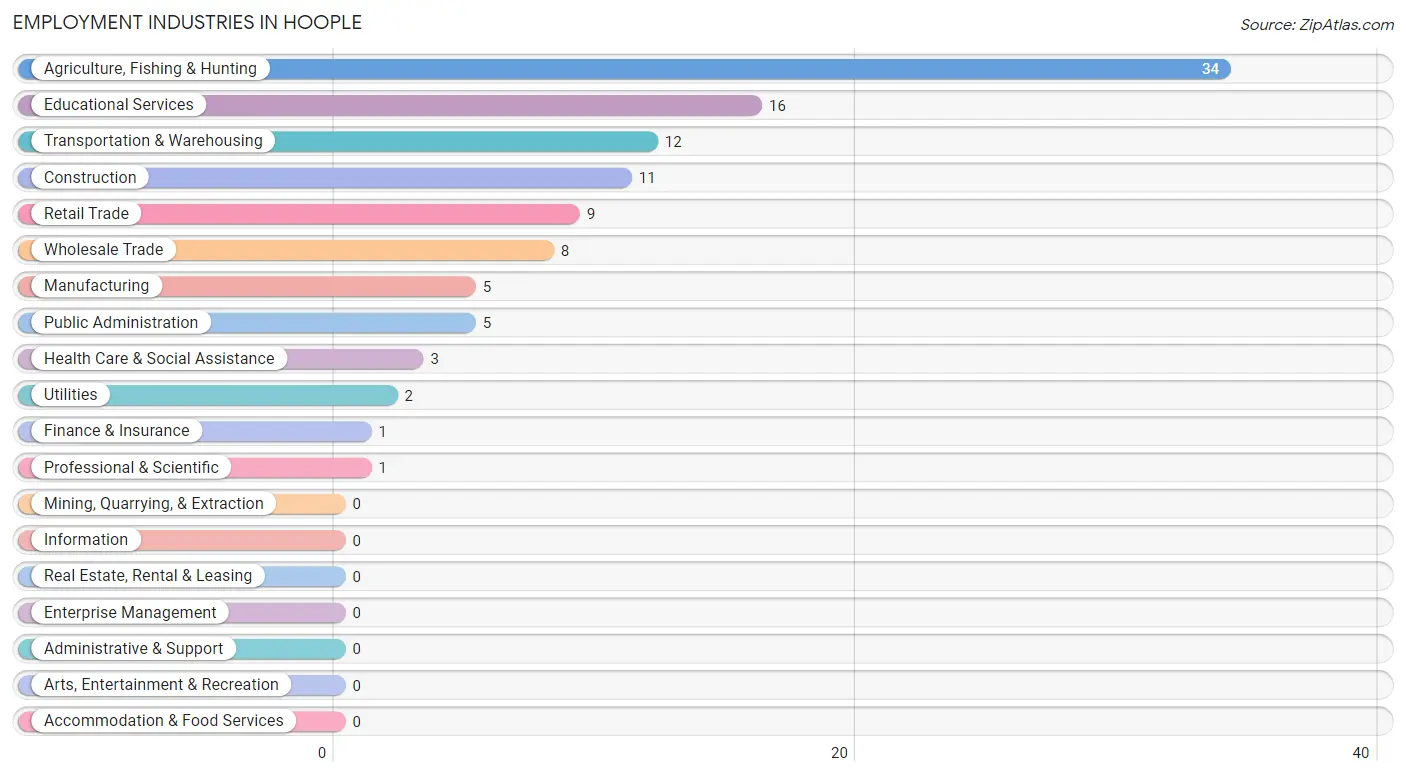
Employment Industries in Hoople
The major employment industries in Hoople include Agriculture, Fishing & Hunting (34 | 30.9%), Educational Services (16 | 14.5%), Transportation & Warehousing (12 | 10.9%), Construction (11 | 10.0%), and Retail Trade (9 | 8.2%).
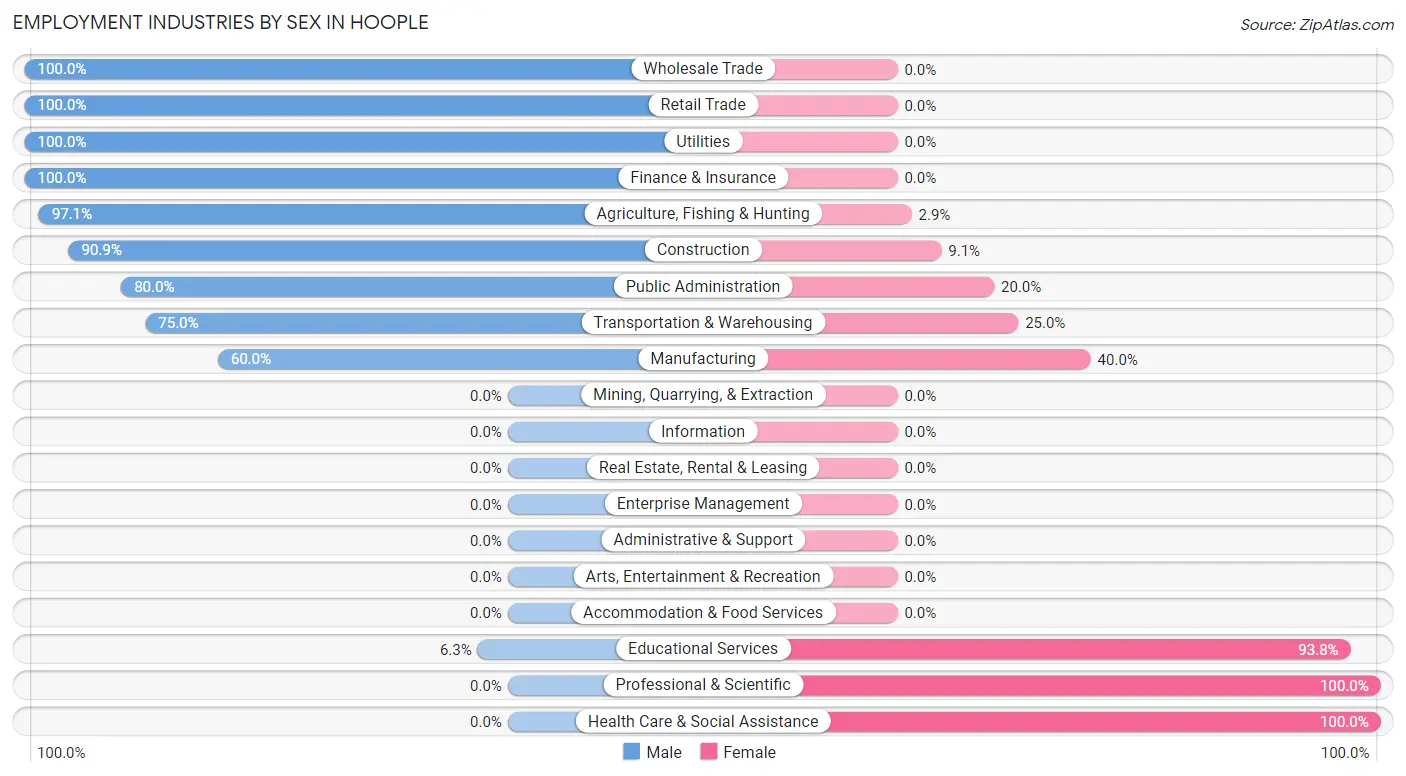
Employment Industries by Sex in Hoople
The Hoople industries that see more men than women are Wholesale Trade (100.0%), Retail Trade (100.0%), and Utilities (100.0%), whereas the industries that tend to have a higher number of women are Professional & Scientific (100.0%), Health Care & Social Assistance (100.0%), and Educational Services (93.8%).
| Industry | Male | Female |
| Agriculture, Fishing & Hunting | 33 (97.1%) | 1 (2.9%) |
| Mining, Quarrying, & Extraction | 0 (0.0%) | 0 (0.0%) |
| Construction | 10 (90.9%) | 1 (9.1%) |
| Manufacturing | 3 (60.0%) | 2 (40.0%) |
| Wholesale Trade | 8 (100.0%) | 0 (0.0%) |
| Retail Trade | 9 (100.0%) | 0 (0.0%) |
| Transportation & Warehousing | 9 (75.0%) | 3 (25.0%) |
| Utilities | 2 (100.0%) | 0 (0.0%) |
| Information | 0 (0.0%) | 0 (0.0%) |
| Finance & Insurance | 1 (100.0%) | 0 (0.0%) |
| Real Estate, Rental & Leasing | 0 (0.0%) | 0 (0.0%) |
| Professional & Scientific | 0 (0.0%) | 1 (100.0%) |
| Enterprise Management | 0 (0.0%) | 0 (0.0%) |
| Administrative & Support | 0 (0.0%) | 0 (0.0%) |
| Educational Services | 1 (6.2%) | 15 (93.8%) |
| Health Care & Social Assistance | 0 (0.0%) | 3 (100.0%) |
| Arts, Entertainment & Recreation | 0 (0.0%) | 0 (0.0%) |
| Accommodation & Food Services | 0 (0.0%) | 0 (0.0%) |
| Public Administration | 4 (80.0%) | 1 (20.0%) |
| Total | 80 (72.7%) | 30 (27.3%) |
Education in Hoople
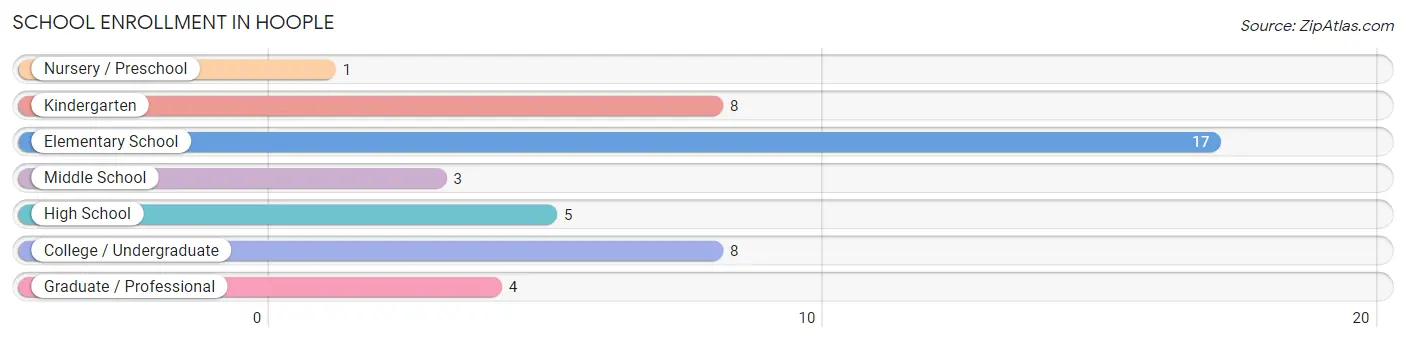
School Enrollment in Hoople
The most common levels of schooling among the 46 students in Hoople are elementary school (17 | 37.0%), kindergarten (8 | 17.4%), and college / undergraduate (8 | 17.4%).
| School Level | # Students | % Students |
| Nursery / Preschool | 1 | 2.2% |
| Kindergarten | 8 | 17.4% |
| Elementary School | 17 | 37.0% |
| Middle School | 3 | 6.5% |
| High School | 5 | 10.9% |
| College / Undergraduate | 8 | 17.4% |
| Graduate / Professional | 4 | 8.7% |
| Total | 46 | 100.0% |
School Enrollment by Age by Funding Source in Hoople
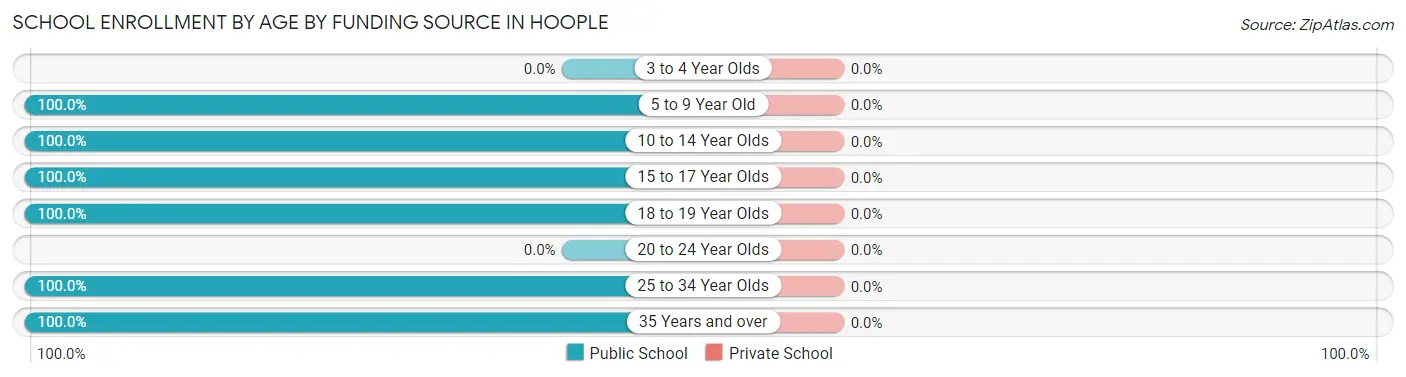
| Age Bracket | Public School | Private School |
| 3 to 4 Year Olds | 0 (0.0%) | 0 (0.0%) |
| 5 to 9 Year Old | 19 (100.0%) | 0 (0.0%) |
| 10 to 14 Year Olds | 12 (100.0%) | 0 (0.0%) |
| 15 to 17 Year Olds | 2 (100.0%) | 0 (0.0%) |
| 18 to 19 Year Olds | 1 (100.0%) | 0 (0.0%) |
| 20 to 24 Year Olds | 0 (0.0%) | 0 (0.0%) |
| 25 to 34 Year Olds | 2 (100.0%) | 0 (0.0%) |
| 35 Years and over | 10 (100.0%) | 0 (0.0%) |
| Total | 46 (100.0%) | 0 (0.0%) |
Educational Attainment by Field of Study in Hoople
Bio, nature & agricultural (10 | 28.6%), education (10 | 28.6%), science & technology (8 | 22.9%), psychology (2 | 5.7%), and social sciences (2 | 5.7%) are the most common fields of study among 35 individuals in Hoople who have obtained a bachelor's degree or higher.
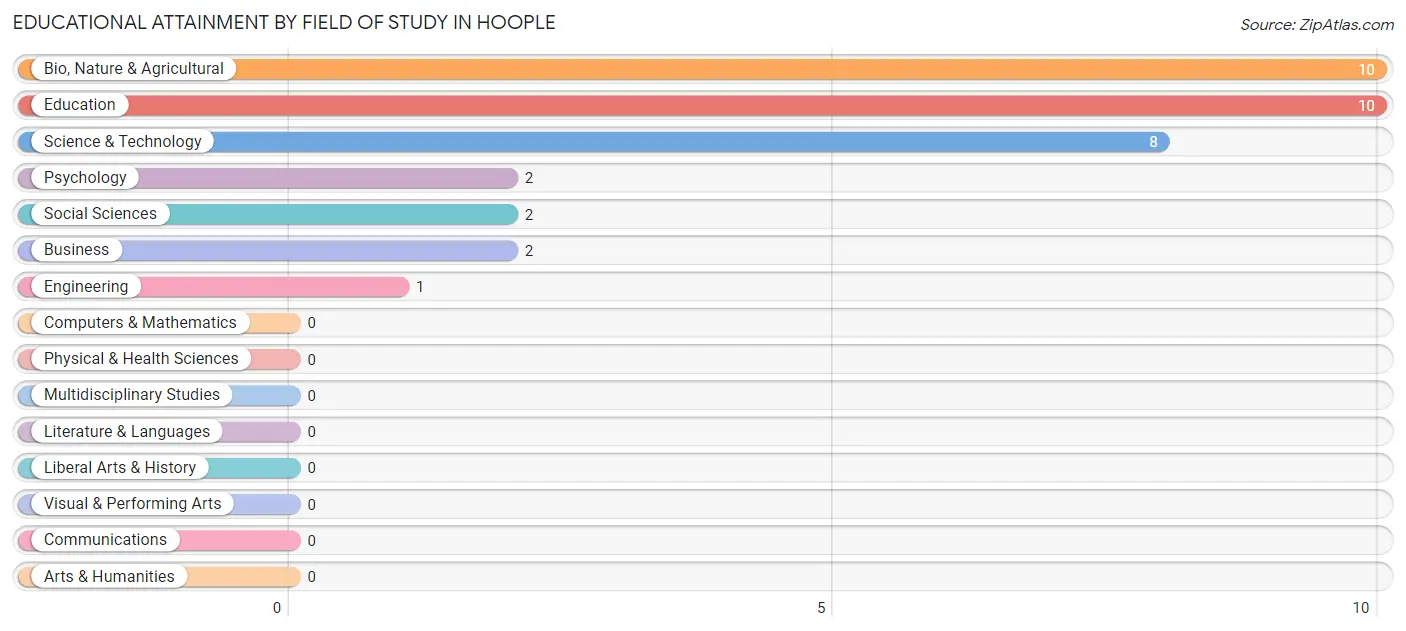
| Field of Study | # Graduates | % Graduates |
| Computers & Mathematics | 0 | 0.0% |
| Bio, Nature & Agricultural | 10 | 28.6% |
| Physical & Health Sciences | 0 | 0.0% |
| Psychology | 2 | 5.7% |
| Social Sciences | 2 | 5.7% |
| Engineering | 1 | 2.9% |
| Multidisciplinary Studies | 0 | 0.0% |
| Science & Technology | 8 | 22.9% |
| Business | 2 | 5.7% |
| Education | 10 | 28.6% |
| Literature & Languages | 0 | 0.0% |
| Liberal Arts & History | 0 | 0.0% |
| Visual & Performing Arts | 0 | 0.0% |
| Communications | 0 | 0.0% |
| Arts & Humanities | 0 | 0.0% |
| Total | 35 | 100.0% |
Transportation & Commute in Hoople
Vehicle Availability by Sex in Hoople
The most prevalent vehicle ownership categories in Hoople are males with 2 vehicles (35, accounting for 43.8%) and females with 2 vehicles (19, making up 116.7%).
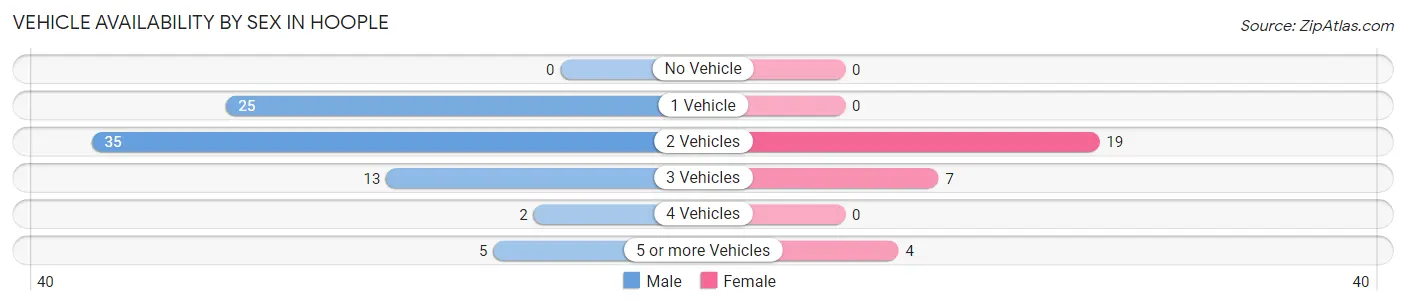
| Vehicles Available | Male | Female |
| No Vehicle | 0 (0.0%) | 0 (0.0%) |
| 1 Vehicle | 25 (31.2%) | 0 (0.0%) |
| 2 Vehicles | 35 (43.8%) | 19 (63.3%) |
| 3 Vehicles | 13 (16.3%) | 7 (23.3%) |
| 4 Vehicles | 2 (2.5%) | 0 (0.0%) |
| 5 or more Vehicles | 5 (6.2%) | 4 (13.3%) |
| Total | 80 (100.0%) | 30 (100.0%) |
Commute Time in Hoople
The most frequently occuring commute durations in Hoople are less than 5 minutes (29 commuters, 26.4%), 10 to 14 minutes (23 commuters, 20.9%), and 5 to 9 minutes (16 commuters, 14.5%).
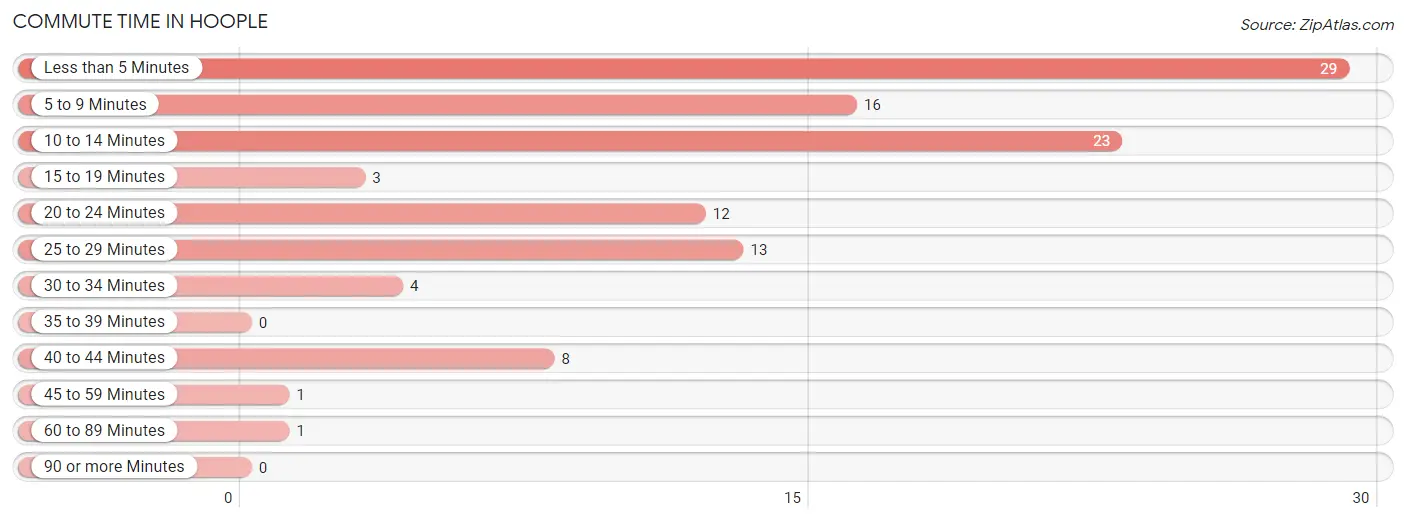
| Commute Time | # Commuters | % Commuters |
| Less than 5 Minutes | 29 | 26.4% |
| 5 to 9 Minutes | 16 | 14.5% |
| 10 to 14 Minutes | 23 | 20.9% |
| 15 to 19 Minutes | 3 | 2.7% |
| 20 to 24 Minutes | 12 | 10.9% |
| 25 to 29 Minutes | 13 | 11.8% |
| 30 to 34 Minutes | 4 | 3.6% |
| 35 to 39 Minutes | 0 | 0.0% |
| 40 to 44 Minutes | 8 | 7.3% |
| 45 to 59 Minutes | 1 | 0.9% |
| 60 to 89 Minutes | 1 | 0.9% |
| 90 or more Minutes | 0 | 0.0% |
Commute Time by Sex in Hoople
The most common commute times in Hoople are less than 5 minutes (21 commuters, 26.3%) for males and less than 5 minutes (8 commuters, 26.7%) for females.
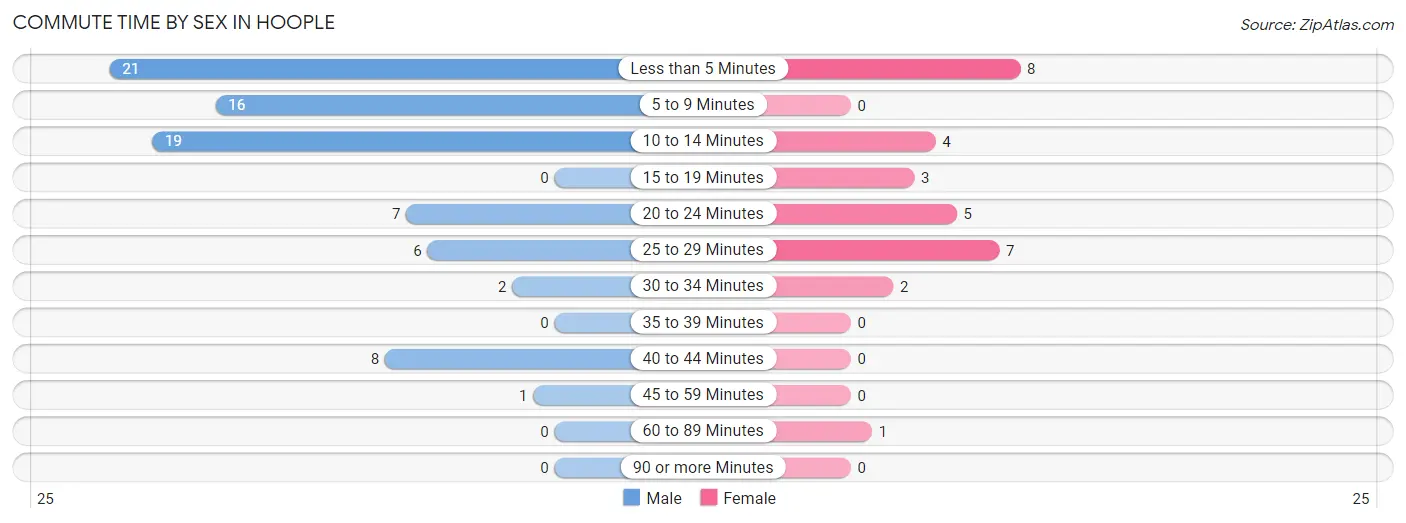
| Commute Time | Male | Female |
| Less than 5 Minutes | 21 (26.3%) | 8 (26.7%) |
| 5 to 9 Minutes | 16 (20.0%) | 0 (0.0%) |
| 10 to 14 Minutes | 19 (23.7%) | 4 (13.3%) |
| 15 to 19 Minutes | 0 (0.0%) | 3 (10.0%) |
| 20 to 24 Minutes | 7 (8.7%) | 5 (16.7%) |
| 25 to 29 Minutes | 6 (7.5%) | 7 (23.3%) |
| 30 to 34 Minutes | 2 (2.5%) | 2 (6.7%) |
| 35 to 39 Minutes | 0 (0.0%) | 0 (0.0%) |
| 40 to 44 Minutes | 8 (10.0%) | 0 (0.0%) |
| 45 to 59 Minutes | 1 (1.3%) | 0 (0.0%) |
| 60 to 89 Minutes | 0 (0.0%) | 1 (3.3%) |
| 90 or more Minutes | 0 (0.0%) | 0 (0.0%) |
Time of Departure to Work by Sex in Hoople
The most frequent times of departure to work in Hoople are 7:00 AM to 7:29 AM (23, 28.7%) for males and 7:30 AM to 7:59 AM (17, 56.7%) for females.
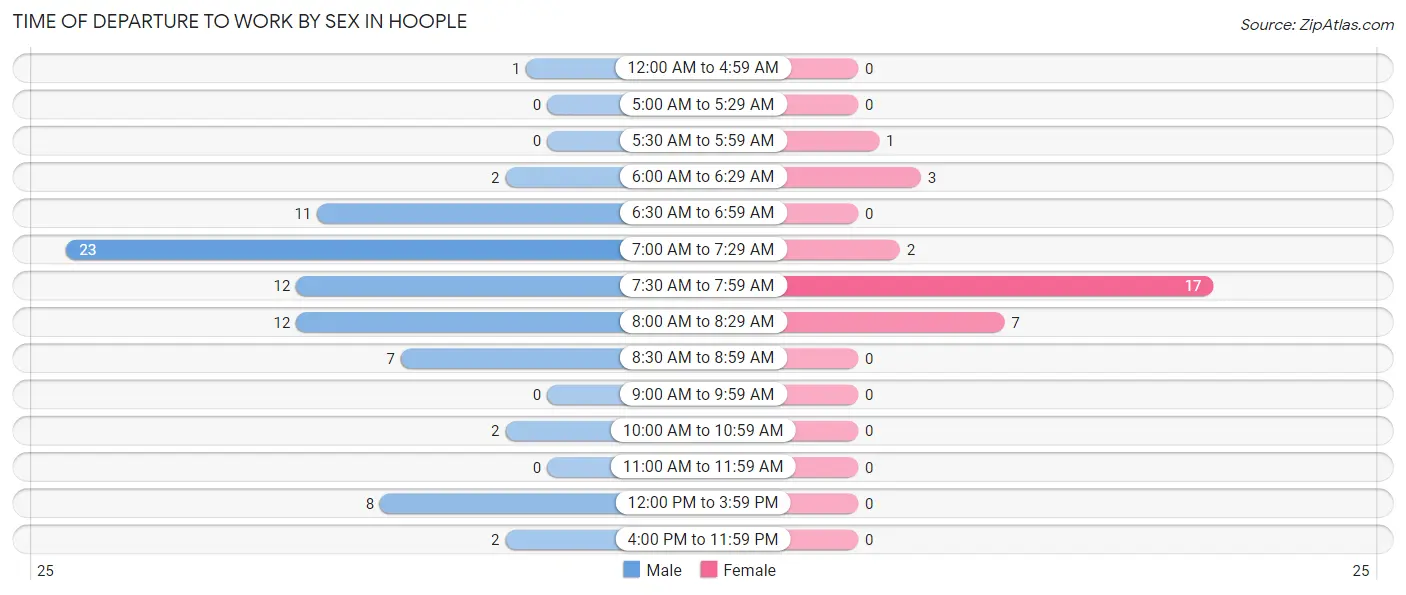
| Time of Departure | Male | Female |
| 12:00 AM to 4:59 AM | 1 (1.3%) | 0 (0.0%) |
| 5:00 AM to 5:29 AM | 0 (0.0%) | 0 (0.0%) |
| 5:30 AM to 5:59 AM | 0 (0.0%) | 1 (3.3%) |
| 6:00 AM to 6:29 AM | 2 (2.5%) | 3 (10.0%) |
| 6:30 AM to 6:59 AM | 11 (13.8%) | 0 (0.0%) |
| 7:00 AM to 7:29 AM | 23 (28.7%) | 2 (6.7%) |
| 7:30 AM to 7:59 AM | 12 (15.0%) | 17 (56.7%) |
| 8:00 AM to 8:29 AM | 12 (15.0%) | 7 (23.3%) |
| 8:30 AM to 8:59 AM | 7 (8.7%) | 0 (0.0%) |
| 9:00 AM to 9:59 AM | 0 (0.0%) | 0 (0.0%) |
| 10:00 AM to 10:59 AM | 2 (2.5%) | 0 (0.0%) |
| 11:00 AM to 11:59 AM | 0 (0.0%) | 0 (0.0%) |
| 12:00 PM to 3:59 PM | 8 (10.0%) | 0 (0.0%) |
| 4:00 PM to 11:59 PM | 2 (2.5%) | 0 (0.0%) |
| Total | 80 (100.0%) | 30 (100.0%) |
Housing Occupancy in Hoople
Occupancy by Ownership in Hoople
Of the total 93 dwellings in Hoople, owner-occupied units account for 84 (90.3%), while renter-occupied units make up 9 (9.7%).
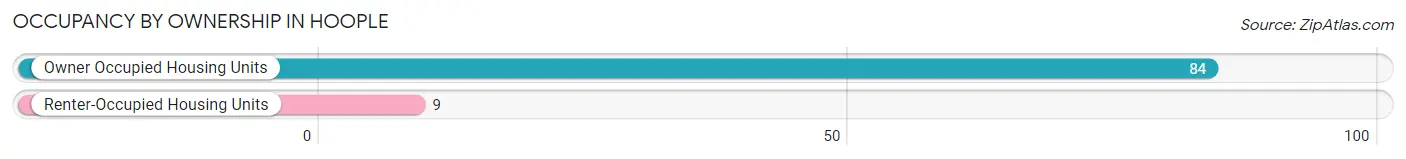
| Occupancy | # Housing Units | % Housing Units |
| Owner Occupied Housing Units | 84 | 90.3% |
| Renter-Occupied Housing Units | 9 | 9.7% |
| Total Occupied Housing Units | 93 | 100.0% |
Occupancy by Household Size in Hoople
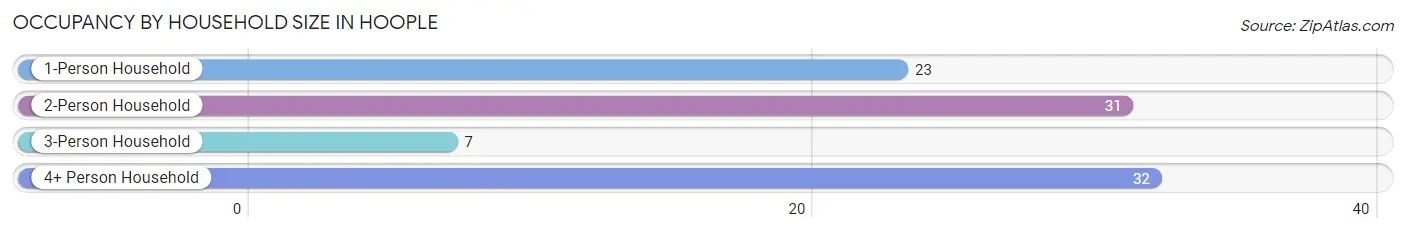
| Household Size | # Housing Units | % Housing Units |
| 1-Person Household | 23 | 24.7% |
| 2-Person Household | 31 | 33.3% |
| 3-Person Household | 7 | 7.5% |
| 4+ Person Household | 32 | 34.4% |
| Total Housing Units | 93 | 100.0% |
Occupancy by Ownership by Household Size in Hoople
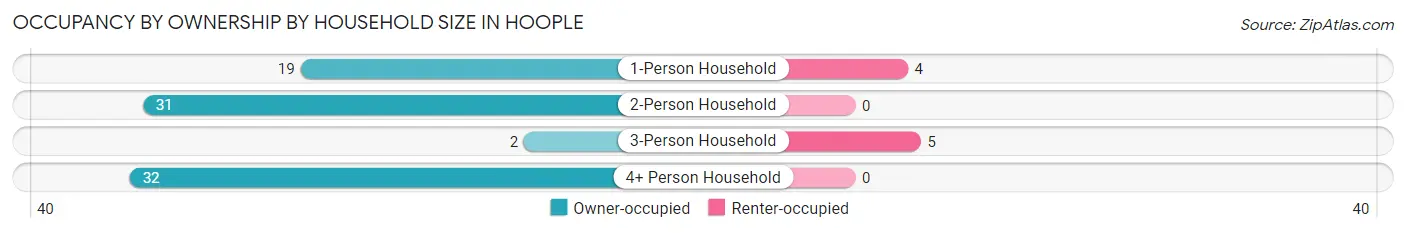
| Household Size | Owner-occupied | Renter-occupied |
| 1-Person Household | 19 (82.6%) | 4 (17.4%) |
| 2-Person Household | 31 (100.0%) | 0 (0.0%) |
| 3-Person Household | 2 (28.6%) | 5 (71.4%) |
| 4+ Person Household | 32 (100.0%) | 0 (0.0%) |
| Total Housing Units | 84 (90.3%) | 9 (9.7%) |
Occupancy by Educational Attainment in Hoople
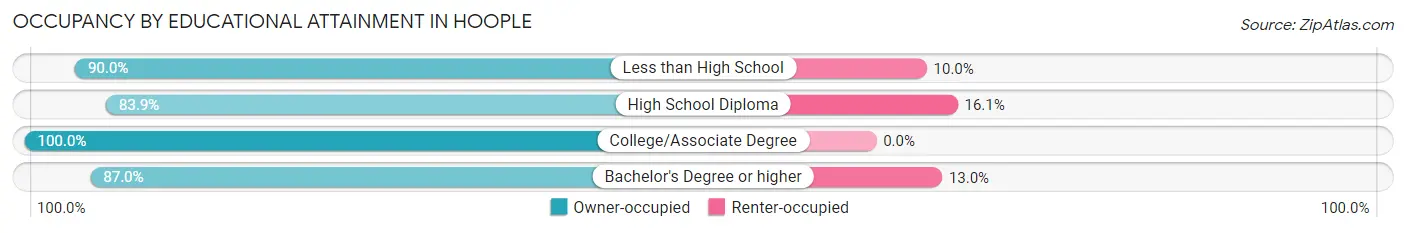
| Household Size | Owner-occupied | Renter-occupied |
| Less than High School | 9 (90.0%) | 1 (10.0%) |
| High School Diploma | 26 (83.9%) | 5 (16.1%) |
| College/Associate Degree | 29 (100.0%) | 0 (0.0%) |
| Bachelor's Degree or higher | 20 (87.0%) | 3 (13.0%) |
Occupancy by Age of Householder in Hoople
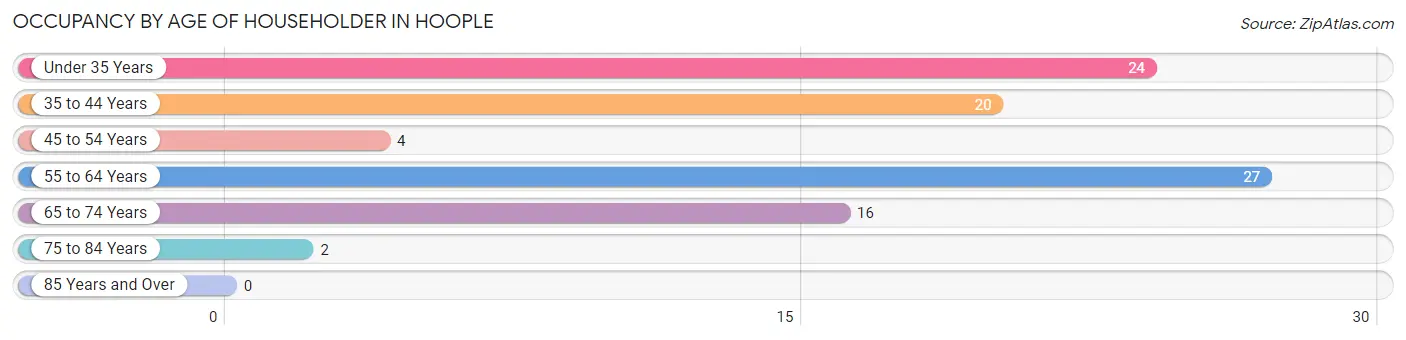
| Age Bracket | # Households | % Households |
| Under 35 Years | 24 | 25.8% |
| 35 to 44 Years | 20 | 21.5% |
| 45 to 54 Years | 4 | 4.3% |
| 55 to 64 Years | 27 | 29.0% |
| 65 to 74 Years | 16 | 17.2% |
| 75 to 84 Years | 2 | 2.1% |
| 85 Years and Over | 0 | 0.0% |
| Total | 93 | 100.0% |
Housing Finances in Hoople
Median Income by Occupancy in Hoople
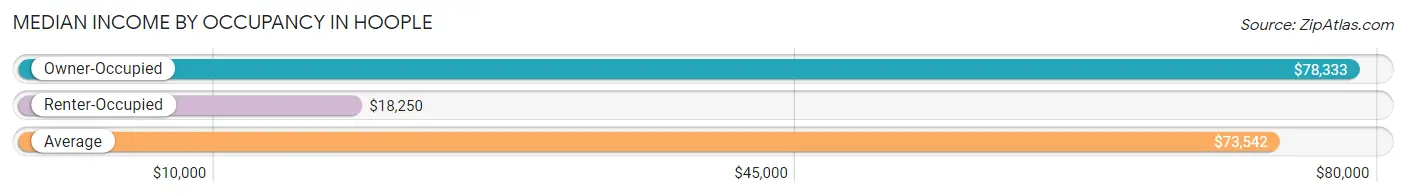
| Occupancy Type | # Households | Median Income |
| Owner-Occupied | 84 (90.3%) | $78,333 |
| Renter-Occupied | 9 (9.7%) | $18,250 |
| Average | 93 (100.0%) | $73,542 |
Occupancy by Householder Income Bracket in Hoople
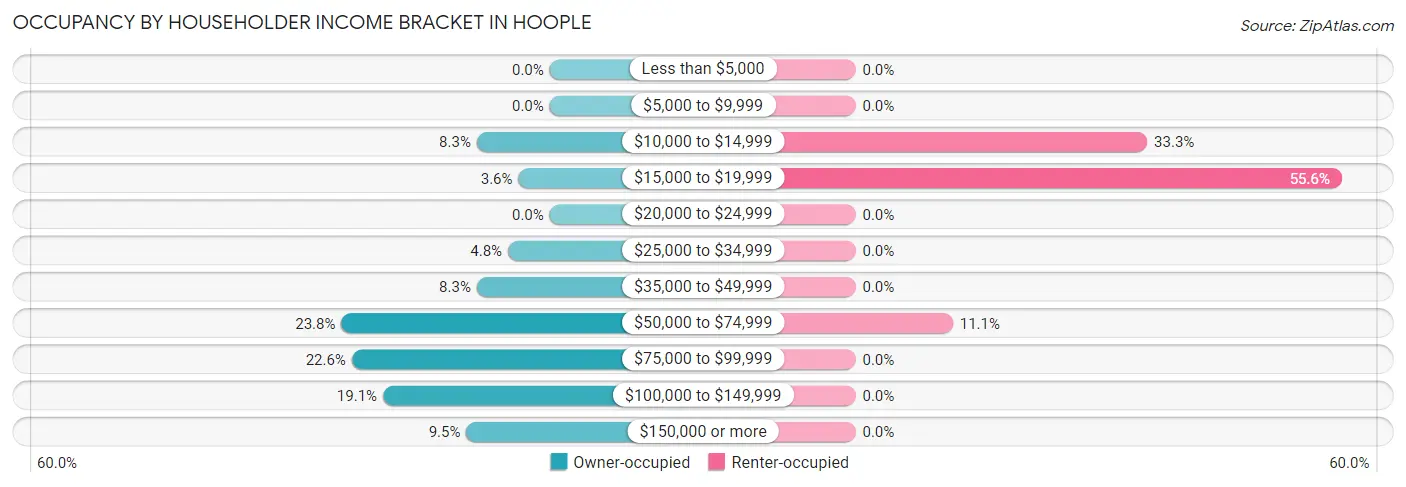
| Income Bracket | Owner-occupied | Renter-occupied |
| Less than $5,000 | 0 (0.0%) | 0 (0.0%) |
| $5,000 to $9,999 | 0 (0.0%) | 0 (0.0%) |
| $10,000 to $14,999 | 7 (8.3%) | 3 (33.3%) |
| $15,000 to $19,999 | 3 (3.6%) | 5 (55.6%) |
| $20,000 to $24,999 | 0 (0.0%) | 0 (0.0%) |
| $25,000 to $34,999 | 4 (4.8%) | 0 (0.0%) |
| $35,000 to $49,999 | 7 (8.3%) | 0 (0.0%) |
| $50,000 to $74,999 | 20 (23.8%) | 1 (11.1%) |
| $75,000 to $99,999 | 19 (22.6%) | 0 (0.0%) |
| $100,000 to $149,999 | 16 (19.1%) | 0 (0.0%) |
| $150,000 or more | 8 (9.5%) | 0 (0.0%) |
| Total | 84 (100.0%) | 9 (100.0%) |
Monthly Housing Cost Tiers in Hoople
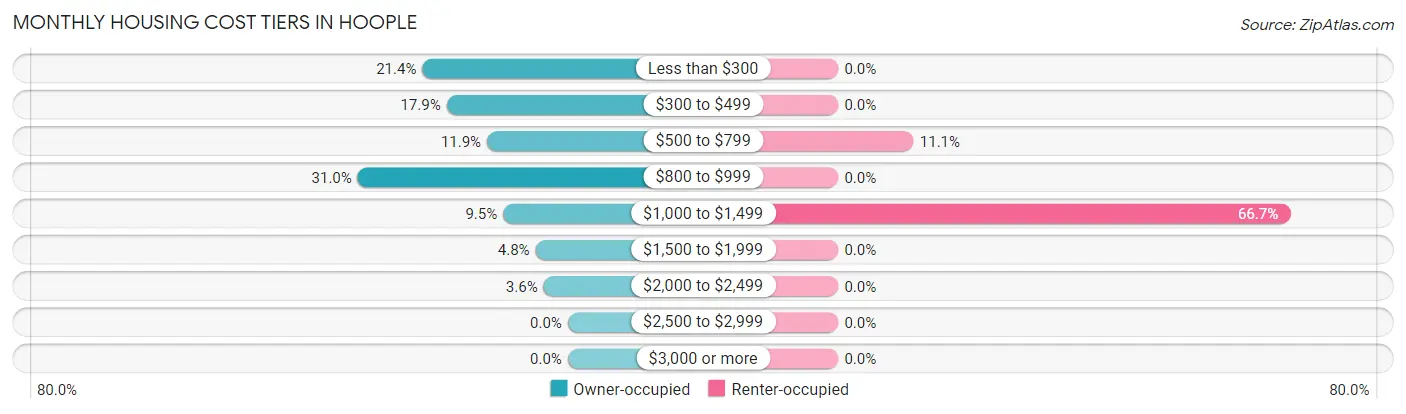
| Monthly Cost | Owner-occupied | Renter-occupied |
| Less than $300 | 18 (21.4%) | 0 (0.0%) |
| $300 to $499 | 15 (17.9%) | 0 (0.0%) |
| $500 to $799 | 10 (11.9%) | 1 (11.1%) |
| $800 to $999 | 26 (30.9%) | 0 (0.0%) |
| $1,000 to $1,499 | 8 (9.5%) | 6 (66.7%) |
| $1,500 to $1,999 | 4 (4.8%) | 0 (0.0%) |
| $2,000 to $2,499 | 3 (3.6%) | 0 (0.0%) |
| $2,500 to $2,999 | 0 (0.0%) | 0 (0.0%) |
| $3,000 or more | 0 (0.0%) | 0 (0.0%) |
| Total | 84 (100.0%) | 9 (100.0%) |
Physical Housing Characteristics in Hoople
Housing Structures in Hoople
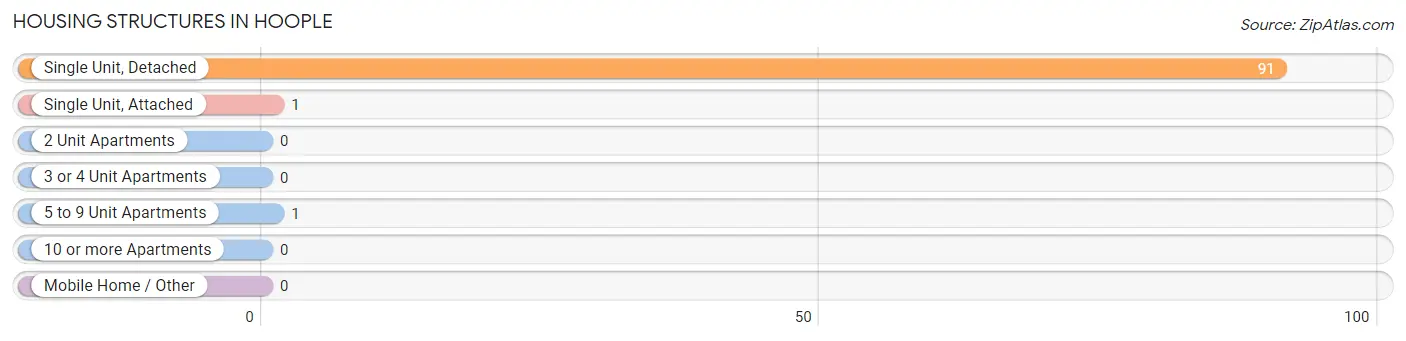
| Structure Type | # Housing Units | % Housing Units |
| Single Unit, Detached | 91 | 97.9% |
| Single Unit, Attached | 1 | 1.1% |
| 2 Unit Apartments | 0 | 0.0% |
| 3 or 4 Unit Apartments | 0 | 0.0% |
| 5 to 9 Unit Apartments | 1 | 1.1% |
| 10 or more Apartments | 0 | 0.0% |
| Mobile Home / Other | 0 | 0.0% |
| Total | 93 | 100.0% |
Housing Structures by Occupancy in Hoople
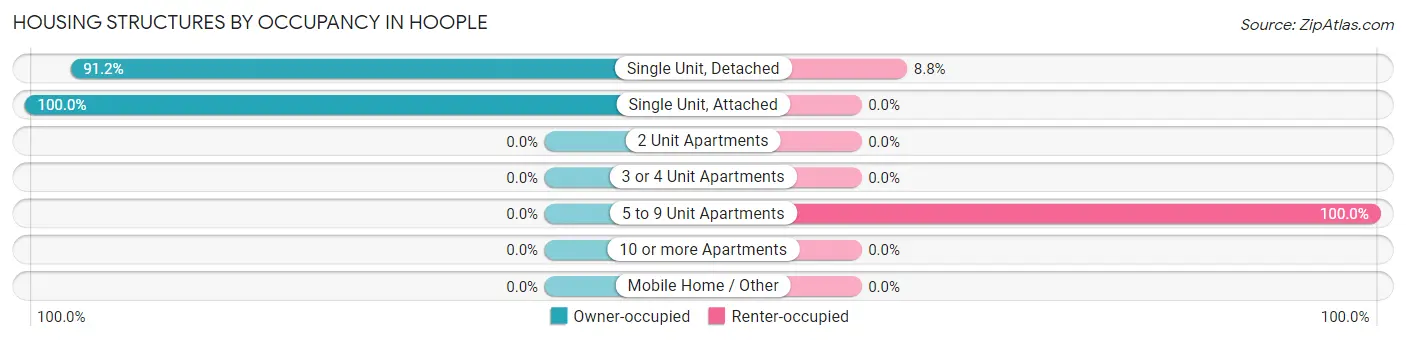
| Structure Type | Owner-occupied | Renter-occupied |
| Single Unit, Detached | 83 (91.2%) | 8 (8.8%) |
| Single Unit, Attached | 1 (100.0%) | 0 (0.0%) |
| 2 Unit Apartments | 0 (0.0%) | 0 (0.0%) |
| 3 or 4 Unit Apartments | 0 (0.0%) | 0 (0.0%) |
| 5 to 9 Unit Apartments | 0 (0.0%) | 1 (100.0%) |
| 10 or more Apartments | 0 (0.0%) | 0 (0.0%) |
| Mobile Home / Other | 0 (0.0%) | 0 (0.0%) |
| Total | 84 (90.3%) | 9 (9.7%) |
Housing Structures by Number of Rooms in Hoople
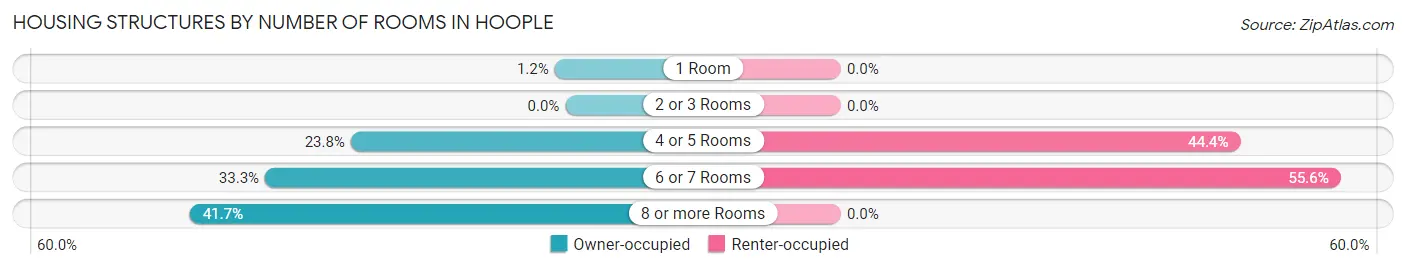
| Number of Rooms | Owner-occupied | Renter-occupied |
| 1 Room | 1 (1.2%) | 0 (0.0%) |
| 2 or 3 Rooms | 0 (0.0%) | 0 (0.0%) |
| 4 or 5 Rooms | 20 (23.8%) | 4 (44.4%) |
| 6 or 7 Rooms | 28 (33.3%) | 5 (55.6%) |
| 8 or more Rooms | 35 (41.7%) | 0 (0.0%) |
| Total | 84 (100.0%) | 9 (100.0%) |
Housing Structure by Heating Type in Hoople
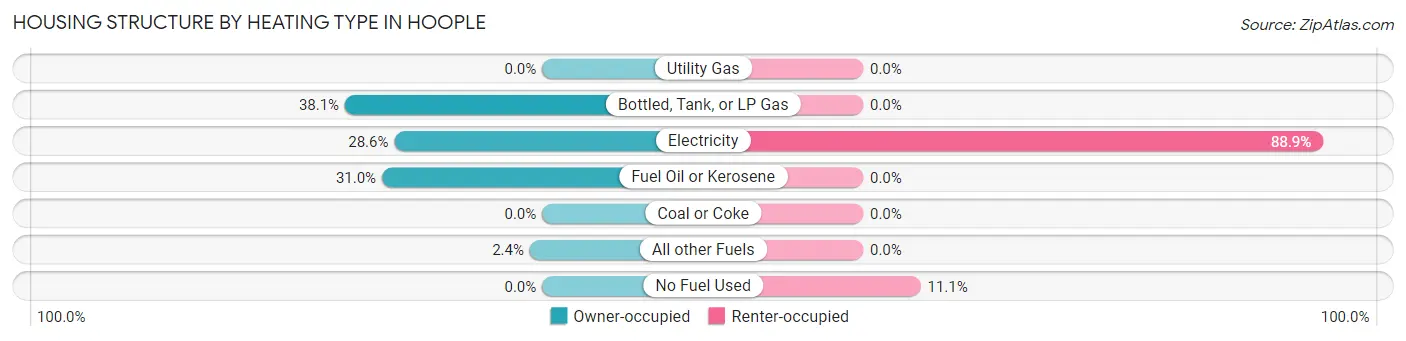
| Heating Type | Owner-occupied | Renter-occupied |
| Utility Gas | 0 (0.0%) | 0 (0.0%) |
| Bottled, Tank, or LP Gas | 32 (38.1%) | 0 (0.0%) |
| Electricity | 24 (28.6%) | 8 (88.9%) |
| Fuel Oil or Kerosene | 26 (30.9%) | 0 (0.0%) |
| Coal or Coke | 0 (0.0%) | 0 (0.0%) |
| All other Fuels | 2 (2.4%) | 0 (0.0%) |
| No Fuel Used | 0 (0.0%) | 1 (11.1%) |
| Total | 84 (100.0%) | 9 (100.0%) |
Household Vehicle Usage in Hoople
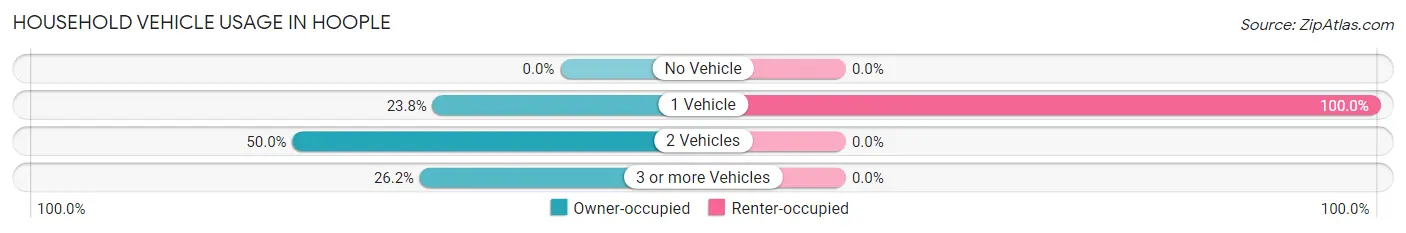
| Vehicles per Household | Owner-occupied | Renter-occupied |
| No Vehicle | 0 (0.0%) | 0 (0.0%) |
| 1 Vehicle | 20 (23.8%) | 9 (100.0%) |
| 2 Vehicles | 42 (50.0%) | 0 (0.0%) |
| 3 or more Vehicles | 22 (26.2%) | 0 (0.0%) |
| Total | 84 (100.0%) | 9 (100.0%) |
Real Estate & Mortgages in Hoople
Real Estate and Mortgage Overview in Hoople
| Characteristic | Without Mortgage | With Mortgage |
| Housing Units | 56 | 28 |
| Median Property Value | $95,000 | $0 |
| Median Household Income | $71,250 | $3 |
| Monthly Housing Costs | $444 | $0 |
| Real Estate Taxes | $925 | $0 |
Property Value by Mortgage Status in Hoople
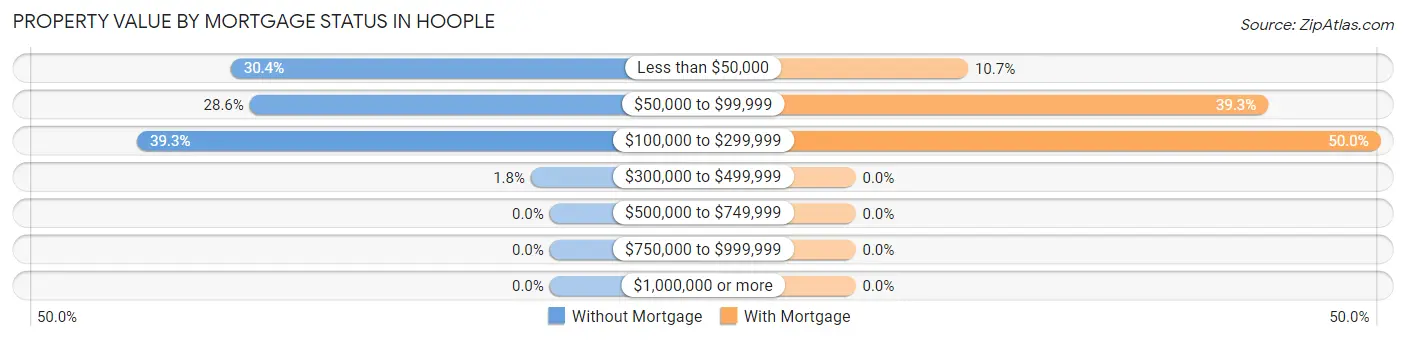
| Property Value | Without Mortgage | With Mortgage |
| Less than $50,000 | 17 (30.4%) | 3 (10.7%) |
| $50,000 to $99,999 | 16 (28.6%) | 11 (39.3%) |
| $100,000 to $299,999 | 22 (39.3%) | 14 (50.0%) |
| $300,000 to $499,999 | 1 (1.8%) | 0 (0.0%) |
| $500,000 to $749,999 | 0 (0.0%) | 0 (0.0%) |
| $750,000 to $999,999 | 0 (0.0%) | 0 (0.0%) |
| $1,000,000 or more | 0 (0.0%) | 0 (0.0%) |
| Total | 56 (100.0%) | 28 (100.0%) |
Household Income by Mortgage Status in Hoople
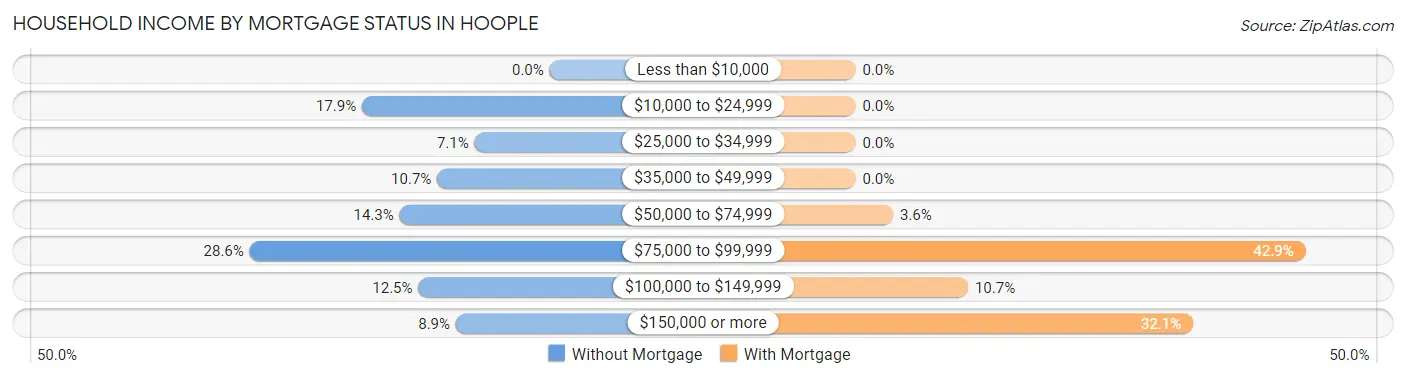
| Household Income | Without Mortgage | With Mortgage |
| Less than $10,000 | 0 (0.0%) | 0 (0.0%) |
| $10,000 to $24,999 | 10 (17.9%) | 0 (0.0%) |
| $25,000 to $34,999 | 4 (7.1%) | 0 (0.0%) |
| $35,000 to $49,999 | 6 (10.7%) | 0 (0.0%) |
| $50,000 to $74,999 | 8 (14.3%) | 1 (3.6%) |
| $75,000 to $99,999 | 16 (28.6%) | 12 (42.9%) |
| $100,000 to $149,999 | 7 (12.5%) | 3 (10.7%) |
| $150,000 or more | 5 (8.9%) | 9 (32.1%) |
| Total | 56 (100.0%) | 28 (100.0%) |
Property Value to Household Income Ratio in Hoople
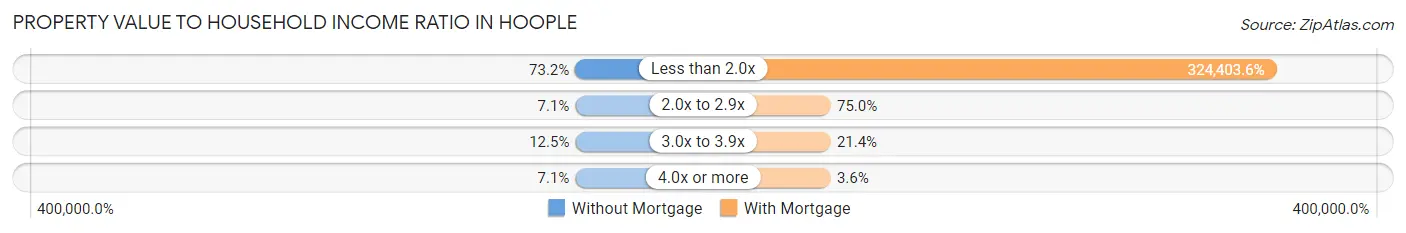
| Value-to-Income Ratio | Without Mortgage | With Mortgage |
| Less than 2.0x | 41 (73.2%) | 90,833 (324,403.6%) |
| 2.0x to 2.9x | 4 (7.1%) | 21 (75.0%) |
| 3.0x to 3.9x | 7 (12.5%) | 6 (21.4%) |
| 4.0x or more | 4 (7.1%) | 1 (3.6%) |
| Total | 56 (100.0%) | 28 (100.0%) |
Real Estate Taxes by Mortgage Status in Hoople
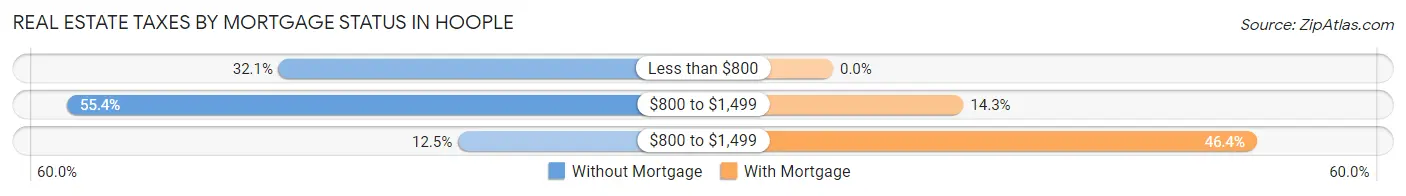
| Property Taxes | Without Mortgage | With Mortgage |
| Less than $800 | 18 (32.1%) | 0 (0.0%) |
| $800 to $1,499 | 31 (55.4%) | 4 (14.3%) |
| $800 to $1,499 | 7 (12.5%) | 13 (46.4%) |
| Total | 56 (100.0%) | 28 (100.0%) |
Health & Disability in Hoople
Health Insurance Coverage by Age in Hoople
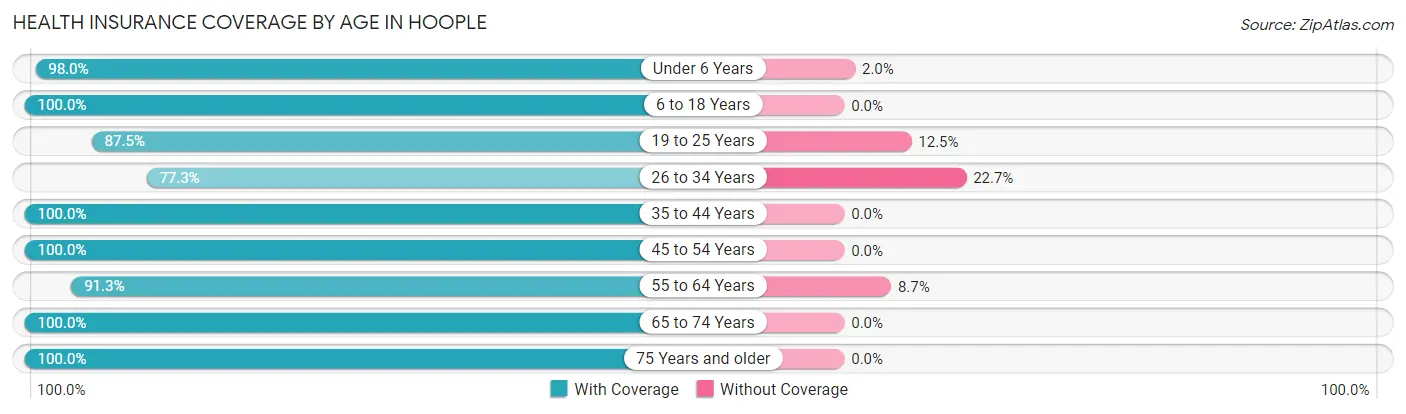
| Age Bracket | With Coverage | Without Coverage |
| Under 6 Years | 49 (98.0%) | 1 (2.0%) |
| 6 to 18 Years | 27 (100.0%) | 0 (0.0%) |
| 19 to 25 Years | 14 (87.5%) | 2 (12.5%) |
| 26 to 34 Years | 17 (77.3%) | 5 (22.7%) |
| 35 to 44 Years | 38 (100.0%) | 0 (0.0%) |
| 45 to 54 Years | 10 (100.0%) | 0 (0.0%) |
| 55 to 64 Years | 42 (91.3%) | 4 (8.7%) |
| 65 to 74 Years | 25 (100.0%) | 0 (0.0%) |
| 75 Years and older | 5 (100.0%) | 0 (0.0%) |
| Total | 227 (95.0%) | 12 (5.0%) |
Health Insurance Coverage by Citizenship Status in Hoople
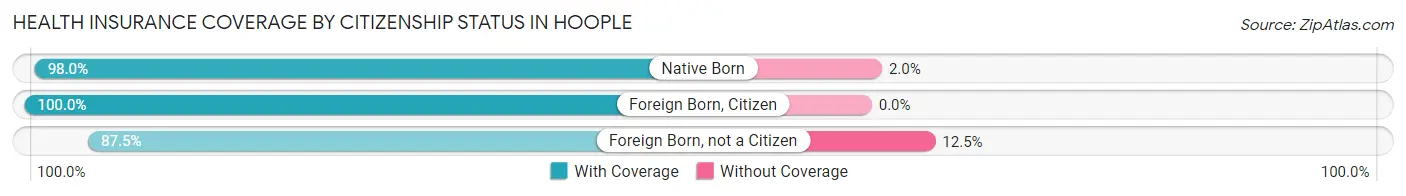
| Citizenship Status | With Coverage | Without Coverage |
| Native Born | 49 (98.0%) | 1 (2.0%) |
| Foreign Born, Citizen | 27 (100.0%) | 0 (0.0%) |
| Foreign Born, not a Citizen | 14 (87.5%) | 2 (12.5%) |
Health Insurance Coverage by Household Income in Hoople
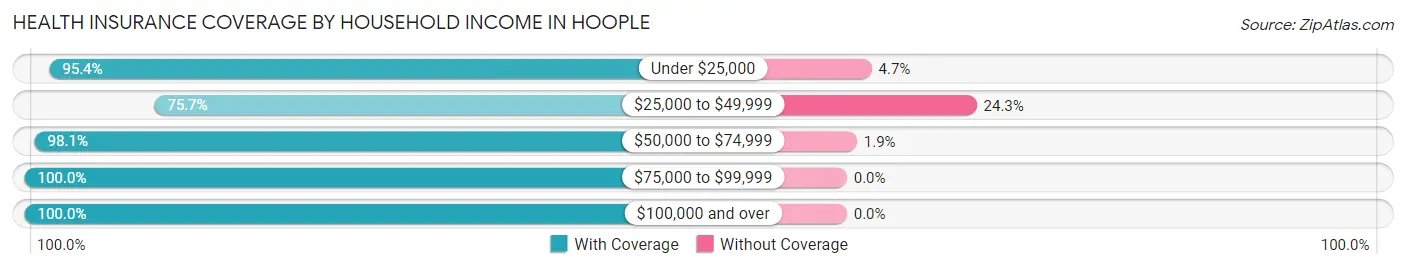
| Household Income | With Coverage | Without Coverage |
| Under $25,000 | 41 (95.4%) | 2 (4.6%) |
| $25,000 to $49,999 | 28 (75.7%) | 9 (24.3%) |
| $50,000 to $74,999 | 52 (98.1%) | 1 (1.9%) |
| $75,000 to $99,999 | 32 (100.0%) | 0 (0.0%) |
| $100,000 and over | 74 (100.0%) | 0 (0.0%) |
Public vs Private Health Insurance Coverage by Age in Hoople
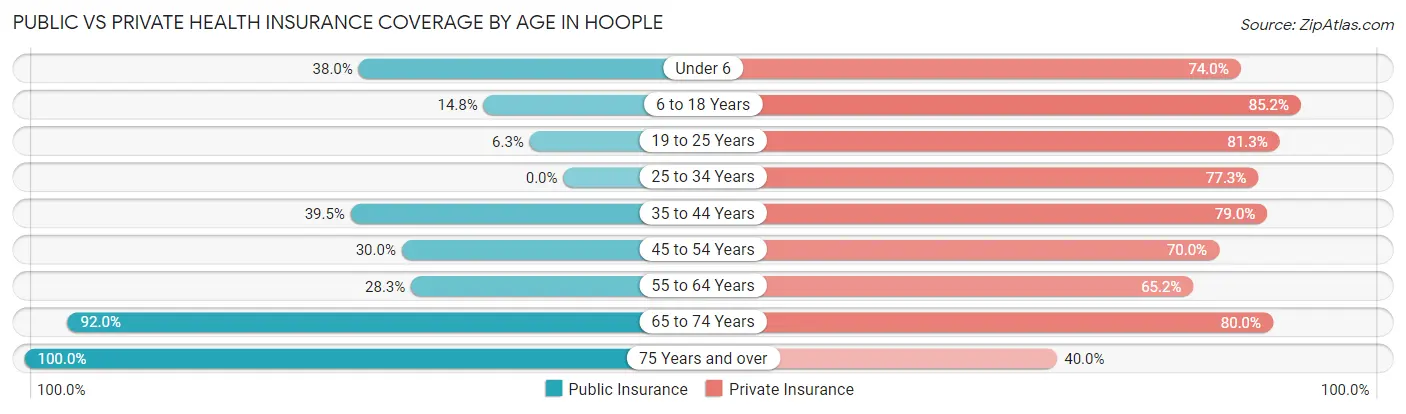
| Age Bracket | Public Insurance | Private Insurance |
| Under 6 | 19 (38.0%) | 37 (74.0%) |
| 6 to 18 Years | 4 (14.8%) | 23 (85.2%) |
| 19 to 25 Years | 1 (6.2%) | 13 (81.2%) |
| 25 to 34 Years | 0 (0.0%) | 17 (77.3%) |
| 35 to 44 Years | 15 (39.5%) | 30 (78.9%) |
| 45 to 54 Years | 3 (30.0%) | 7 (70.0%) |
| 55 to 64 Years | 13 (28.3%) | 30 (65.2%) |
| 65 to 74 Years | 23 (92.0%) | 20 (80.0%) |
| 75 Years and over | 5 (100.0%) | 2 (40.0%) |
| Total | 83 (34.7%) | 179 (74.9%) |
Disability Status by Sex by Age in Hoople
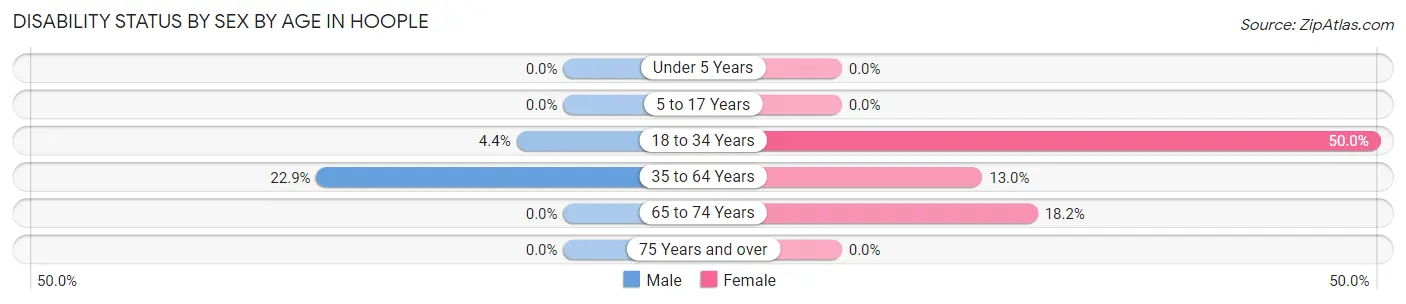
| Age Bracket | Male | Female |
| Under 5 Years | 0 (0.0%) | 0 (0.0%) |
| 5 to 17 Years | 0 (0.0%) | 0 (0.0%) |
| 18 to 34 Years | 1 (4.3%) | 8 (50.0%) |
| 35 to 64 Years | 11 (22.9%) | 6 (13.0%) |
| 65 to 74 Years | 0 (0.0%) | 2 (18.2%) |
| 75 Years and over | 0 (0.0%) | 0 (0.0%) |
Disability Class by Sex by Age in Hoople
Disability Class: Hearing Difficulty
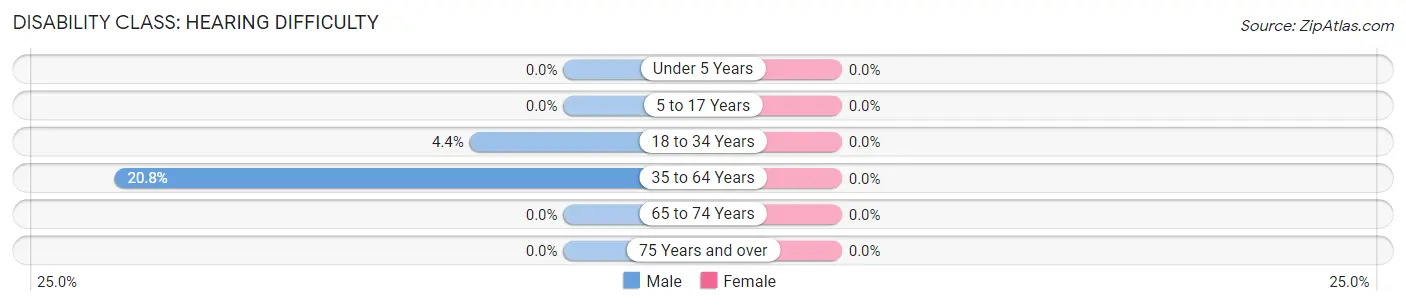
| Age Bracket | Male | Female |
| Under 5 Years | 0 (0.0%) | 0 (0.0%) |
| 5 to 17 Years | 0 (0.0%) | 0 (0.0%) |
| 18 to 34 Years | 1 (4.3%) | 0 (0.0%) |
| 35 to 64 Years | 10 (20.8%) | 0 (0.0%) |
| 65 to 74 Years | 0 (0.0%) | 0 (0.0%) |
| 75 Years and over | 0 (0.0%) | 0 (0.0%) |
Disability Class: Vision Difficulty
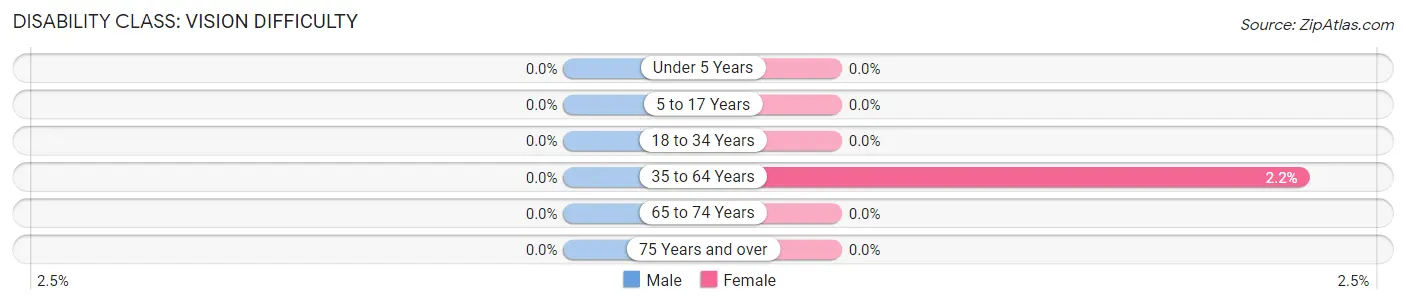
| Age Bracket | Male | Female |
| Under 5 Years | 0 (0.0%) | 0 (0.0%) |
| 5 to 17 Years | 0 (0.0%) | 0 (0.0%) |
| 18 to 34 Years | 0 (0.0%) | 0 (0.0%) |
| 35 to 64 Years | 0 (0.0%) | 1 (2.2%) |
| 65 to 74 Years | 0 (0.0%) | 0 (0.0%) |
| 75 Years and over | 0 (0.0%) | 0 (0.0%) |
Disability Class: Cognitive Difficulty
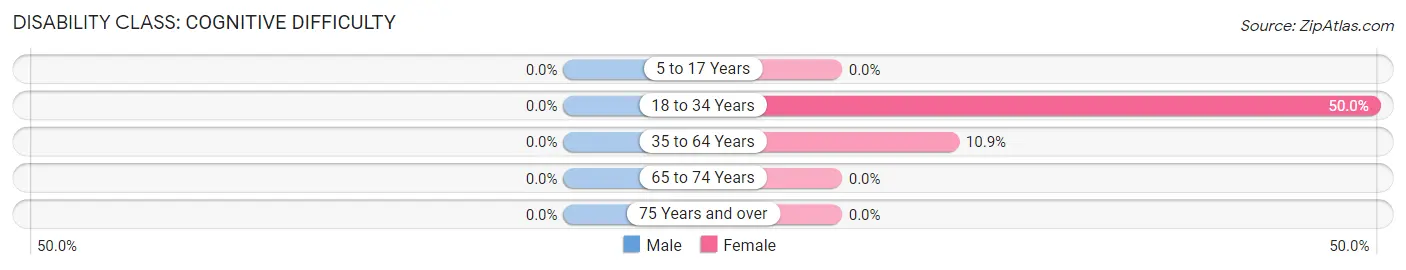
| Age Bracket | Male | Female |
| 5 to 17 Years | 0 (0.0%) | 0 (0.0%) |
| 18 to 34 Years | 0 (0.0%) | 8 (50.0%) |
| 35 to 64 Years | 0 (0.0%) | 5 (10.9%) |
| 65 to 74 Years | 0 (0.0%) | 0 (0.0%) |
| 75 Years and over | 0 (0.0%) | 0 (0.0%) |
Disability Class: Ambulatory Difficulty
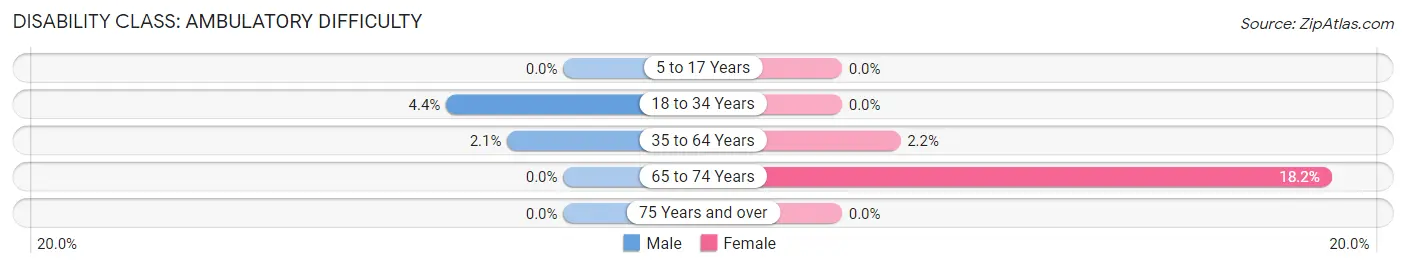
| Age Bracket | Male | Female |
| 5 to 17 Years | 0 (0.0%) | 0 (0.0%) |
| 18 to 34 Years | 1 (4.3%) | 0 (0.0%) |
| 35 to 64 Years | 1 (2.1%) | 1 (2.2%) |
| 65 to 74 Years | 0 (0.0%) | 2 (18.2%) |
| 75 Years and over | 0 (0.0%) | 0 (0.0%) |
Disability Class: Self-Care Difficulty
| Age Bracket | Male | Female |
| 5 to 17 Years | 0 (0.0%) | 0 (0.0%) |
| 18 to 34 Years | 0 (0.0%) | 0 (0.0%) |
| 35 to 64 Years | 0 (0.0%) | 0 (0.0%) |
| 65 to 74 Years | 0 (0.0%) | 0 (0.0%) |
| 75 Years and over | 0 (0.0%) | 0 (0.0%) |
Technology Access in Hoople
Computing Device Access in Hoople
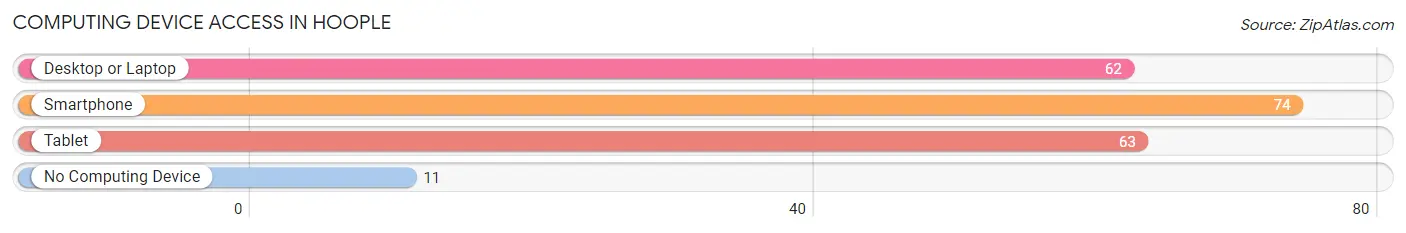
| Device Type | # Households | % Households |
| Desktop or Laptop | 62 | 66.7% |
| Smartphone | 74 | 79.6% |
| Tablet | 63 | 67.7% |
| No Computing Device | 11 | 11.8% |
| Total | 93 | 100.0% |
Internet Access in Hoople
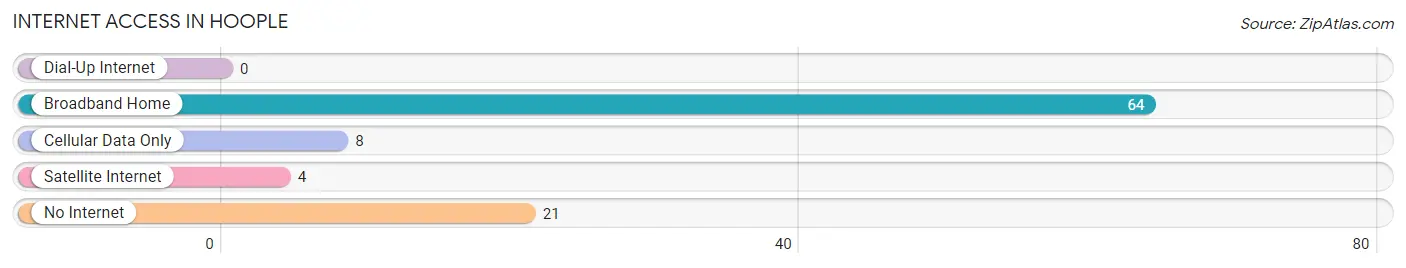
| Internet Type | # Households | % Households |
| Dial-Up Internet | 0 | 0.0% |
| Broadband Home | 64 | 68.8% |
| Cellular Data Only | 8 | 8.6% |
| Satellite Internet | 4 | 4.3% |
| No Internet | 21 | 22.6% |
| Total | 93 | 100.0% |
Hoople Summary
Hoople, North Dakota is a small city located in the northeastern corner of the state. It is situated in the Red River Valley, a flat, fertile region of the Great Plains. The city is home to a population of approximately 1,500 people, and is the county seat of Walsh County.
History
Hoople was founded in 1882 by a group of settlers from Norway. The city was named after a Norwegian immigrant, Ole Hoople, who was the first to settle in the area. The city was incorporated in 1883, and the first post office was established in 1884.
In the early years, Hoople was a farming community, with the main crops being wheat, oats, and barley. The city also had a thriving lumber industry, with several sawmills located in the area.
In the early 1900s, Hoople began to experience a period of growth and development. The city was connected to the Great Northern Railway in 1906, and the first bank was established in 1907. The city also had a number of businesses, including a hotel, a general store, and a blacksmith shop.
Geography
Hoople is located in the Red River Valley, a flat, fertile region of the Great Plains. The city is situated on the banks of the Red River, which forms the border between North Dakota and Minnesota. The city is surrounded by rolling hills and farmland, and is located approximately 30 miles from the Canadian border.
The climate in Hoople is continental, with cold winters and hot summers. The average annual temperature is 45 degrees Fahrenheit, and the average annual precipitation is 17 inches.
Economy
The economy of Hoople is largely based on agriculture. The main crops grown in the area are wheat, oats, and barley. The city also has a number of businesses, including a hotel, a general store, and a blacksmith shop.
The city is also home to a number of manufacturing companies, including a furniture factory, a grain elevator, and a dairy processing plant. The city also has a number of retail stores, including a grocery store, a hardware store, and a clothing store.
Demographics
As of the 2010 census, the population of Hoople was 1,500. The racial makeup of the city was 97.3% White, 0.7% Native American, 0.3% Asian, and 1.7% from other races. The median household income was $37,500, and the median age was 37.
Hoople is a small, close-knit community, and the residents take pride in their city and its history. The city is home to a number of churches, and the residents are very active in their local government. The city also has a number of parks and recreational facilities, including a golf course, a swimming pool, and a skate park.
Common Questions
What is Per Capita Income in Hoople?
Per Capita income in Hoople is $30,274.
What is the Median Family Income in Hoople?
Median Family Income in Hoople is $77,917.
What is the Median Household income in Hoople?
Median Household Income in Hoople is $73,542.
What is Income or Wage Gap in Hoople?
Income or Wage Gap in Hoople is 38.5%.
Women in Hoople earn 61.5 cents for every dollar earned by a man.
What is Inequality or Gini Index in Hoople?
Inequality or Gini Index in Hoople is 0.39.
What is the Total Population of Hoople?
Total Population of Hoople is 239.
What is the Total Male Population of Hoople?
Total Male Population of Hoople is 118.
What is the Total Female Population of Hoople?
Total Female Population of Hoople is 121.
What is the Ratio of Males per 100 Females in Hoople?
There are 97.52 Males per 100 Females in Hoople.
What is the Ratio of Females per 100 Males in Hoople?
There are 102.54 Females per 100 Males in Hoople.
What is the Median Population Age in Hoople?
Median Population Age in Hoople is 35.6 Years.
What is the Average Family Size in Hoople
Average Family Size in Hoople is 3.0 People.
What is the Average Household Size in Hoople
Average Household Size in Hoople is 2.6 People.
How Large is the Labor Force in Hoople?
There are 118 People in the Labor Forcein in Hoople.
What is the Percentage of People in the Labor Force in Hoople?
71.5% of People are in the Labor Force in Hoople.
What is the Unemployment Rate in Hoople?
Unemployment Rate in Hoople is 6.8%.