Wing, ND Map & Demographics
Wing Map
Wing Overview
$27,602
PER CAPITA INCOME
$84,091
AVG FAMILY INCOME
$82,946
AVG HOUSEHOLD INCOME
60.5%
WAGE / INCOME GAP [ % ]
39.5¢/ $1
WAGE / INCOME GAP [ $ ]
0.33
INEQUALITY / GINI INDEX
221
TOTAL POPULATION
110
MALE POPULATION
111
FEMALE POPULATION
99.10
MALES / 100 FEMALES
100.91
FEMALES / 100 MALES
30.9
MEDIAN AGE
3.9
AVG FAMILY SIZE
3.3
AVG HOUSEHOLD SIZE
116
LABOR FORCE [ PEOPLE ]
87.9%
PERCENT IN LABOR FORCE
Wing Zip Codes
Wing Area Codes
Income in Wing
Income Overview in Wing
Per Capita Income in Wing is $27,602, while median incomes of families and households are $84,091 and $82,946 respectively.
| Characteristic | Number | Measure |
| Per Capita Income | 221 | $27,602 |
| Median Family Income | 52 | $84,091 |
| Mean Family Income | 52 | $97,296 |
| Median Household Income | 67 | $82,946 |
| Mean Household Income | 67 | $86,252 |
| Income Deficit | 52 | $0 |
| Wage / Income Gap (%) | 221 | 60.51% |
| Wage / Income Gap ($) | 221 | 39.49¢ per $1 |
| Gini / Inequality Index | 221 | 0.33 |
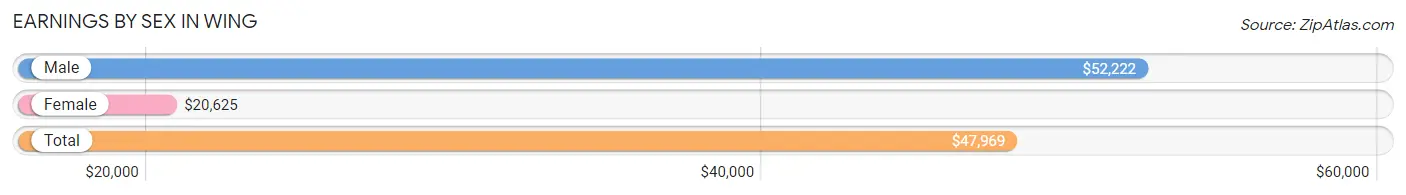
Earnings by Sex in Wing
Average Earnings in Wing are $47,969, $52,222 for men and $20,625 for women, a difference of 60.5%.
| Sex | Number | Average Earnings |
| Male | 68 (57.1%) | $52,222 |
| Female | 51 (42.9%) | $20,625 |
| Total | 119 (100.0%) | $47,969 |
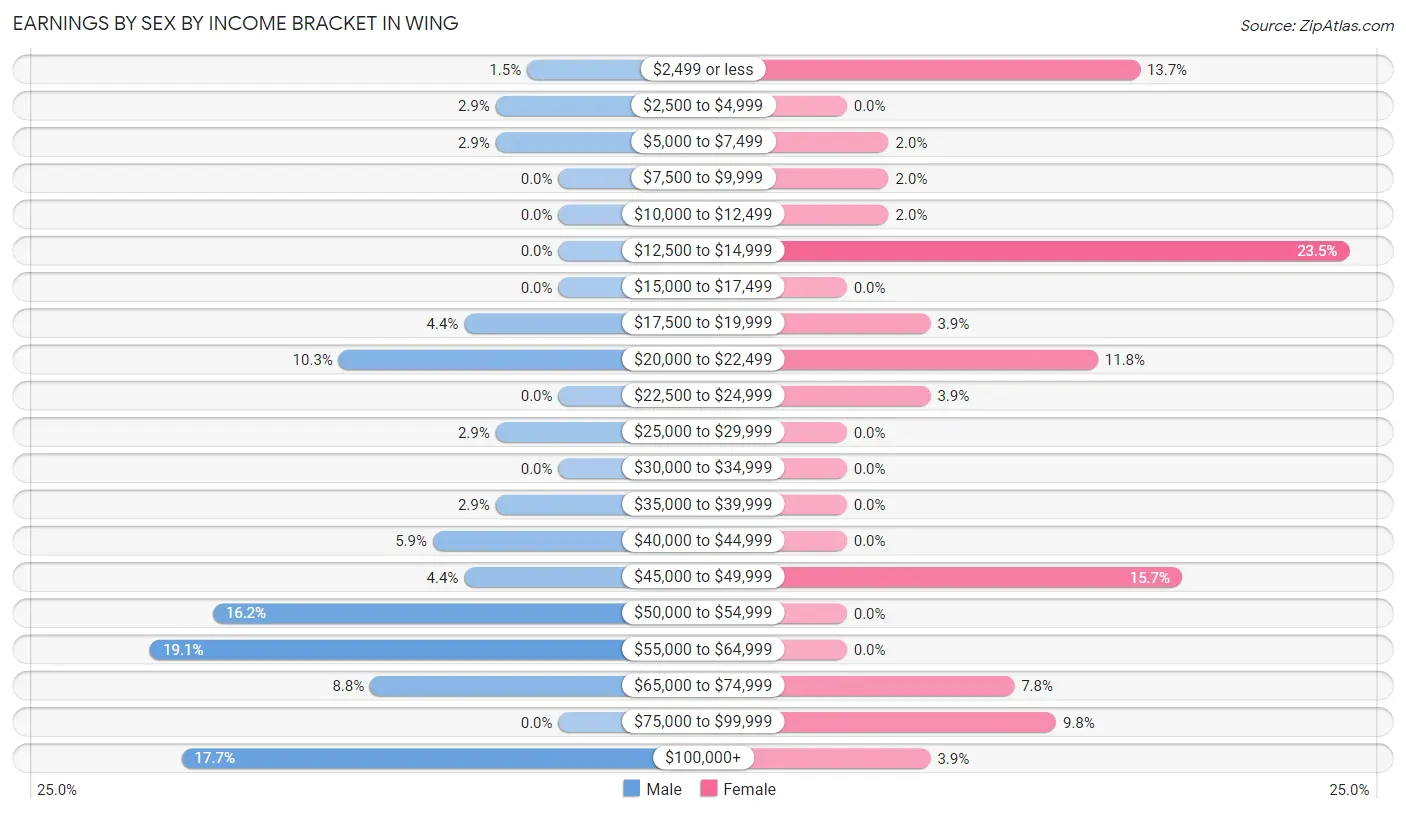
Earnings by Sex by Income Bracket in Wing
The most common earnings brackets in Wing are $55,000 to $64,999 for men (13 | 19.1%) and $12,500 to $14,999 for women (12 | 23.5%).
| Income | Male | Female |
| $2,499 or less | 1 (1.5%) | 7 (13.7%) |
| $2,500 to $4,999 | 2 (2.9%) | 0 (0.0%) |
| $5,000 to $7,499 | 2 (2.9%) | 1 (2.0%) |
| $7,500 to $9,999 | 0 (0.0%) | 1 (2.0%) |
| $10,000 to $12,499 | 0 (0.0%) | 1 (2.0%) |
| $12,500 to $14,999 | 0 (0.0%) | 12 (23.5%) |
| $15,000 to $17,499 | 0 (0.0%) | 0 (0.0%) |
| $17,500 to $19,999 | 3 (4.4%) | 2 (3.9%) |
| $20,000 to $22,499 | 7 (10.3%) | 6 (11.8%) |
| $22,500 to $24,999 | 0 (0.0%) | 2 (3.9%) |
| $25,000 to $29,999 | 2 (2.9%) | 0 (0.0%) |
| $30,000 to $34,999 | 0 (0.0%) | 0 (0.0%) |
| $35,000 to $39,999 | 2 (2.9%) | 0 (0.0%) |
| $40,000 to $44,999 | 4 (5.9%) | 0 (0.0%) |
| $45,000 to $49,999 | 3 (4.4%) | 8 (15.7%) |
| $50,000 to $54,999 | 11 (16.2%) | 0 (0.0%) |
| $55,000 to $64,999 | 13 (19.1%) | 0 (0.0%) |
| $65,000 to $74,999 | 6 (8.8%) | 4 (7.8%) |
| $75,000 to $99,999 | 0 (0.0%) | 5 (9.8%) |
| $100,000+ | 12 (17.6%) | 2 (3.9%) |
| Total | 68 (100.0%) | 51 (100.0%) |
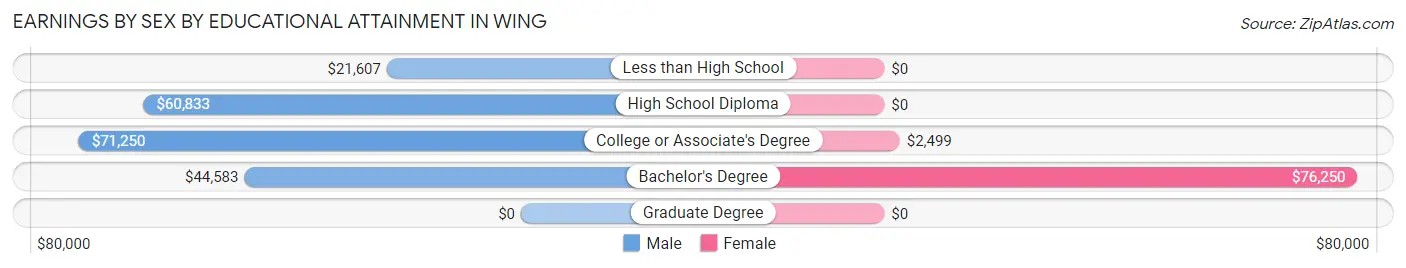
Earnings by Sex by Educational Attainment in Wing
Average earnings in Wing are $54,375 for men and $20,625 for women, a difference of 62.1%. Men with an educational attainment of college or associate's degree enjoy the highest average annual earnings of $71,250, while those with less than high school education earn the least with $21,607. Women with an educational attainment of bachelor's degree earn the most with the average annual earnings of $76,250, while those with college or associate's degree education have the smallest earnings of $2,499.
| Educational Attainment | Male Income | Female Income |
| Less than High School | $21,607 | $0 |
| High School Diploma | $60,833 | $0 |
| College or Associate's Degree | $71,250 | $2,499 |
| Bachelor's Degree | $44,583 | $76,250 |
| Graduate Degree | - | - |
| Total | $54,375 | $20,625 |
Family Income in Wing
Family Income Brackets in Wing
According to the Wing family income data, there are 13 families falling into the $75,000 to $99,999 income range, which is the most common income bracket and makes up 25.0% of all families.
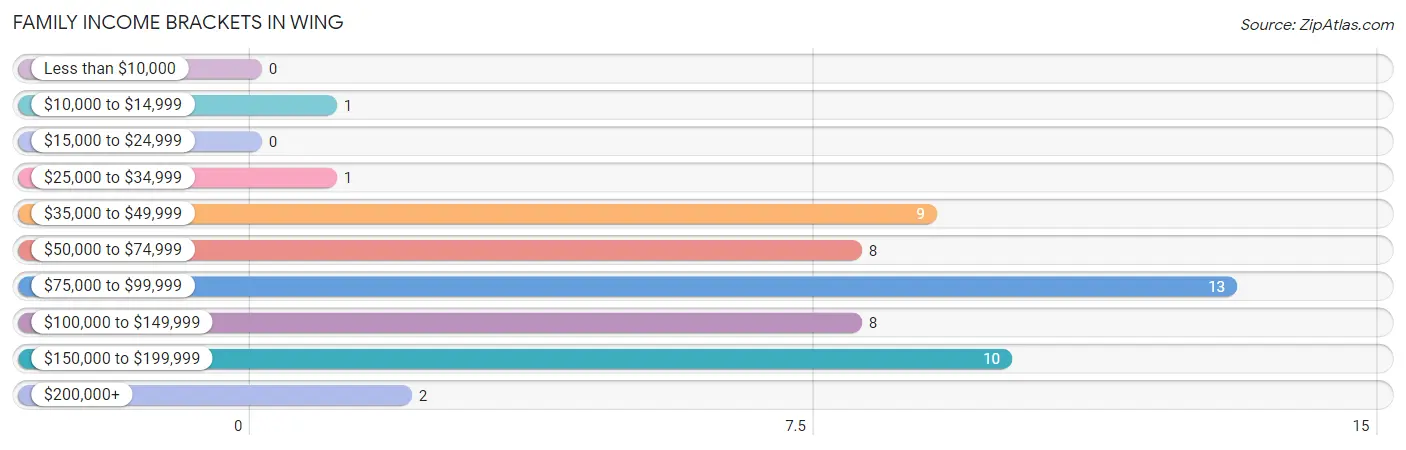
| Income Bracket | # Families | % Families |
| Less than $10,000 | 0 | 0.0% |
| $10,000 to $14,999 | 1 | 1.9% |
| $15,000 to $24,999 | 0 | 0.0% |
| $25,000 to $34,999 | 1 | 1.9% |
| $35,000 to $49,999 | 9 | 17.3% |
| $50,000 to $74,999 | 8 | 15.4% |
| $75,000 to $99,999 | 13 | 25.0% |
| $100,000 to $149,999 | 8 | 15.4% |
| $150,000 to $199,999 | 10 | 19.2% |
| $200,000+ | 2 | 3.8% |
Family Income by Famaliy Size in Wing
2-person families (18 | 34.6%) account for the highest median family income in Wing with $150,417 per family, while 2-person families (18 | 34.6%) have the highest median income of $75,208 per family member.
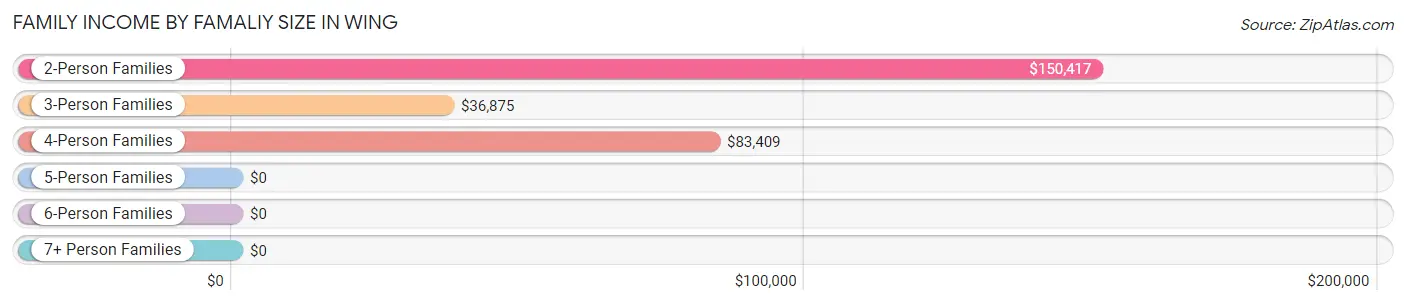
| Income Bracket | # Families | Median Income |
| 2-Person Families | 18 (34.6%) | $150,417 |
| 3-Person Families | 5 (9.6%) | $36,875 |
| 4-Person Families | 18 (34.6%) | $83,409 |
| 5-Person Families | 4 (7.7%) | $0 |
| 6-Person Families | 6 (11.5%) | $0 |
| 7+ Person Families | 1 (1.9%) | $0 |
| Total | 52 (100.0%) | $84,091 |
Family Income by Number of Earners in Wing
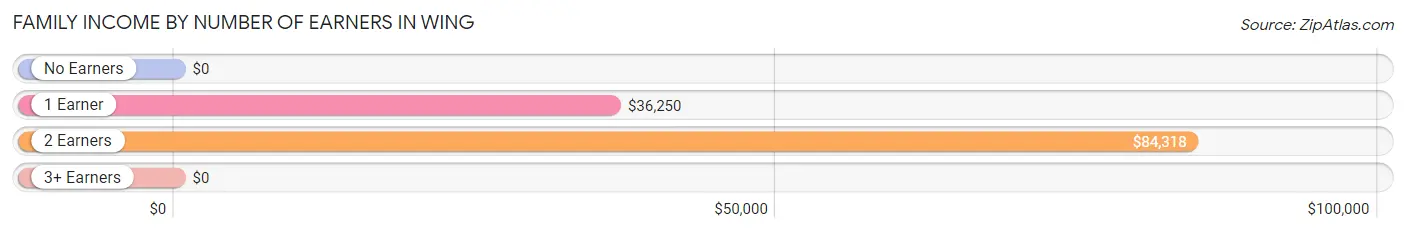
| Number of Earners | # Families | Median Income |
| No Earners | 1 (1.9%) | $0 |
| 1 Earner | 4 (7.7%) | $36,250 |
| 2 Earners | 44 (84.6%) | $84,318 |
| 3+ Earners | 3 (5.8%) | $0 |
| Total | 52 (100.0%) | $84,091 |
Household Income in Wing
Household Income Brackets in Wing
With 18 households falling in the category, the $75,000 to $99,999 income range is the most frequent in Wing, accounting for 26.9% of all households.
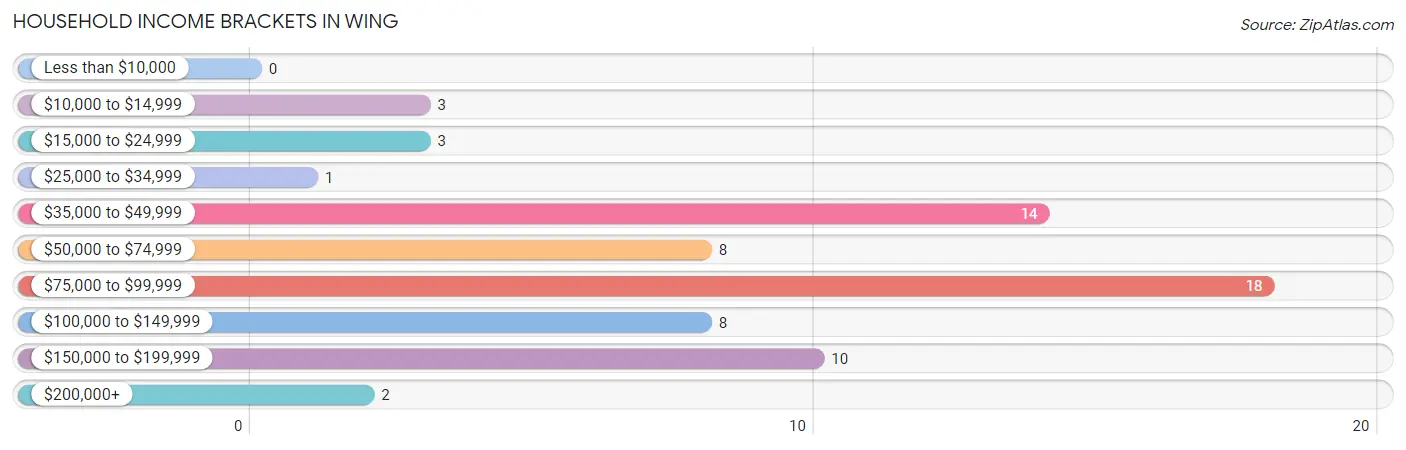
| Income Bracket | # Households | % Households |
| Less than $10,000 | 0 | 0.0% |
| $10,000 to $14,999 | 3 | 4.5% |
| $15,000 to $24,999 | 3 | 4.5% |
| $25,000 to $34,999 | 1 | 1.5% |
| $35,000 to $49,999 | 14 | 20.9% |
| $50,000 to $74,999 | 8 | 11.9% |
| $75,000 to $99,999 | 18 | 26.9% |
| $100,000 to $149,999 | 8 | 11.9% |
| $150,000 to $199,999 | 10 | 14.9% |
| $200,000+ | 2 | 3.0% |
Household Income by Householder Age in Wing
The median household income in Wing is $82,946, with the highest median household income of $120,625 found in the 45 to 64 years age bracket for the primary householder. A total of 11 households (16.4%) fall into this category. Meanwhile, the 15 to 24 years age bracket for the primary householder has the lowest median household income of $0, with 1 households (1.5%) in this group.
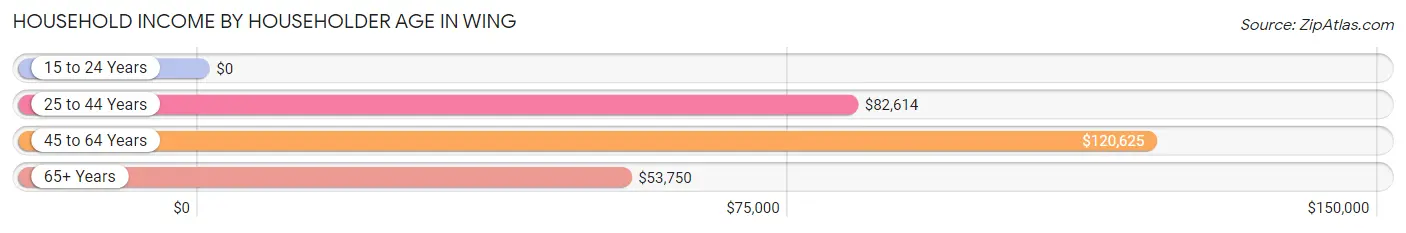
| Income Bracket | # Households | Median Income |
| 15 to 24 Years | 1 (1.5%) | $0 |
| 25 to 44 Years | 43 (64.2%) | $82,614 |
| 45 to 64 Years | 11 (16.4%) | $120,625 |
| 65+ Years | 12 (17.9%) | $53,750 |
| Total | 67 (100.0%) | $82,946 |
Poverty in Wing
Income Below Poverty by Sex and Age in Wing
With 0.9% poverty level for males and 3.6% for females among the residents of Wing, 6 to 11 year old males and 55 to 64 year old females are the most vulnerable to poverty, with 1 males (5.6%) and 1 females (33.3%) in their respective age groups living below the poverty level.
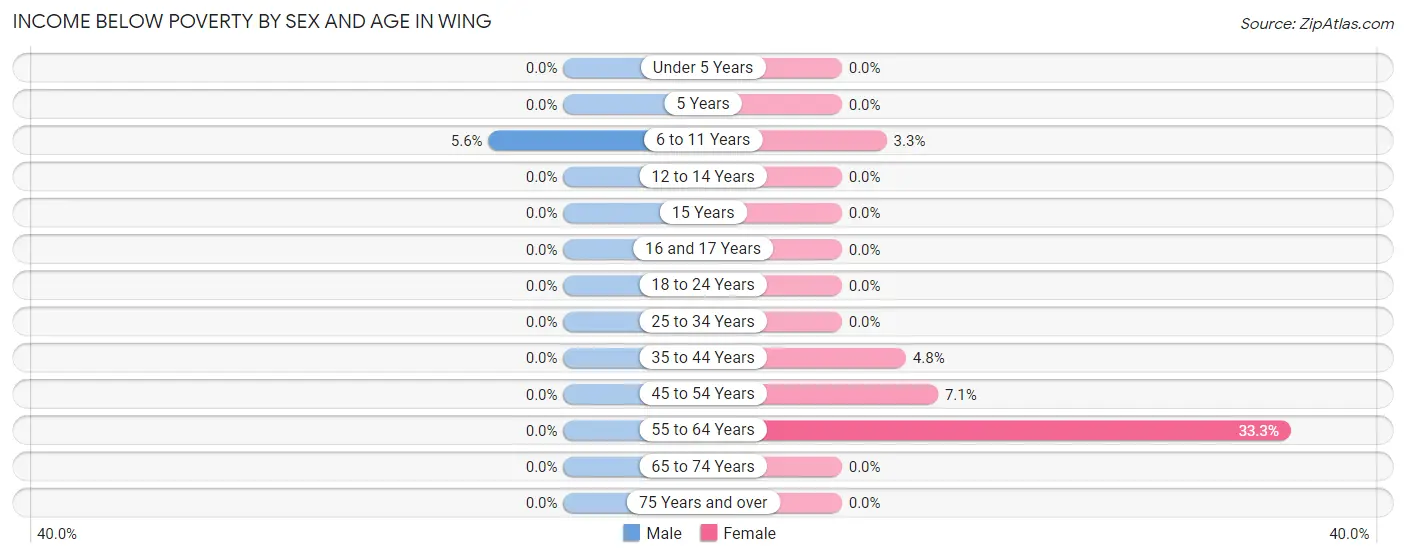
| Age Bracket | Male | Female |
| Under 5 Years | 0 (0.0%) | 0 (0.0%) |
| 5 Years | 0 (0.0%) | 0 (0.0%) |
| 6 to 11 Years | 1 (5.6%) | 1 (3.3%) |
| 12 to 14 Years | 0 (0.0%) | 0 (0.0%) |
| 15 Years | 0 (0.0%) | 0 (0.0%) |
| 16 and 17 Years | 0 (0.0%) | 0 (0.0%) |
| 18 to 24 Years | 0 (0.0%) | 0 (0.0%) |
| 25 to 34 Years | 0 (0.0%) | 0 (0.0%) |
| 35 to 44 Years | 0 (0.0%) | 1 (4.8%) |
| 45 to 54 Years | 0 (0.0%) | 1 (7.1%) |
| 55 to 64 Years | 0 (0.0%) | 1 (33.3%) |
| 65 to 74 Years | 0 (0.0%) | 0 (0.0%) |
| 75 Years and over | 0 (0.0%) | 0 (0.0%) |
| Total | 1 (0.9%) | 4 (3.6%) |
Income Above Poverty by Sex and Age in Wing
According to the poverty statistics in Wing, males aged under 5 years and females aged under 5 years are the age groups that are most secure financially, with 100.0% of males and 100.0% of females in these age groups living above the poverty line.
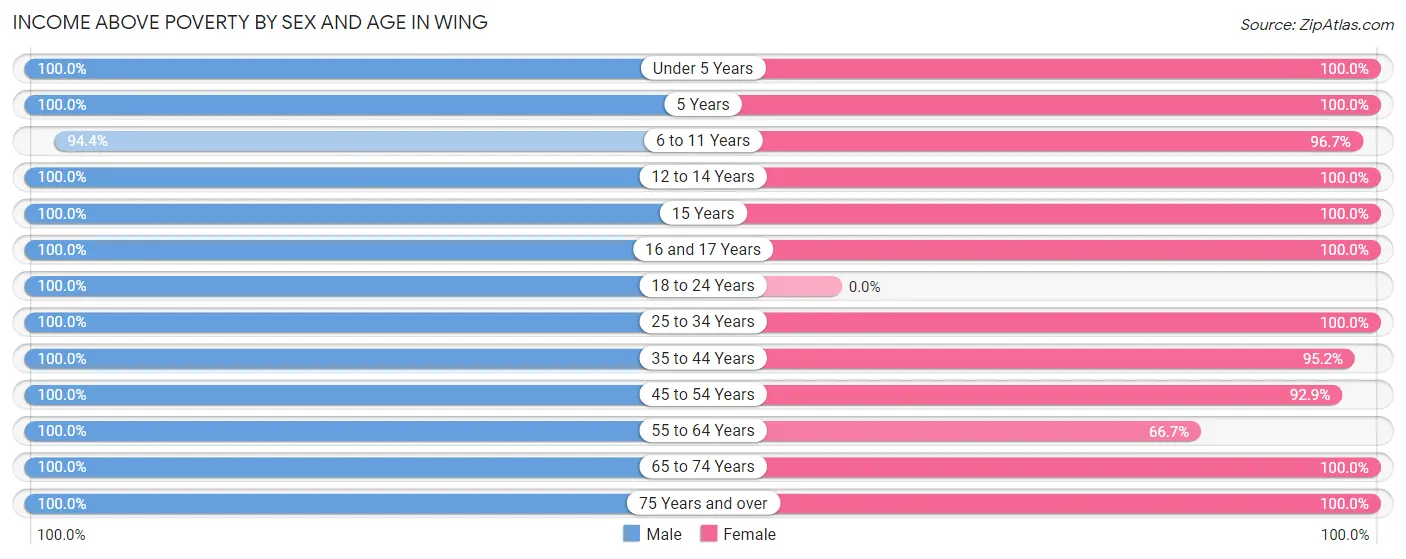
| Age Bracket | Male | Female |
| Under 5 Years | 6 (100.0%) | 2 (100.0%) |
| 5 Years | 2 (100.0%) | 2 (100.0%) |
| 6 to 11 Years | 17 (94.4%) | 29 (96.7%) |
| 12 to 14 Years | 2 (100.0%) | 14 (100.0%) |
| 15 Years | 11 (100.0%) | 2 (100.0%) |
| 16 and 17 Years | 3 (100.0%) | 1 (100.0%) |
| 18 to 24 Years | 3 (100.0%) | 0 (0.0%) |
| 25 to 34 Years | 32 (100.0%) | 14 (100.0%) |
| 35 to 44 Years | 10 (100.0%) | 20 (95.2%) |
| 45 to 54 Years | 14 (100.0%) | 13 (92.9%) |
| 55 to 64 Years | 1 (100.0%) | 2 (66.7%) |
| 65 to 74 Years | 3 (100.0%) | 5 (100.0%) |
| 75 Years and over | 5 (100.0%) | 3 (100.0%) |
| Total | 109 (99.1%) | 107 (96.4%) |
Income Below Poverty Among Married-Couple Families in Wing
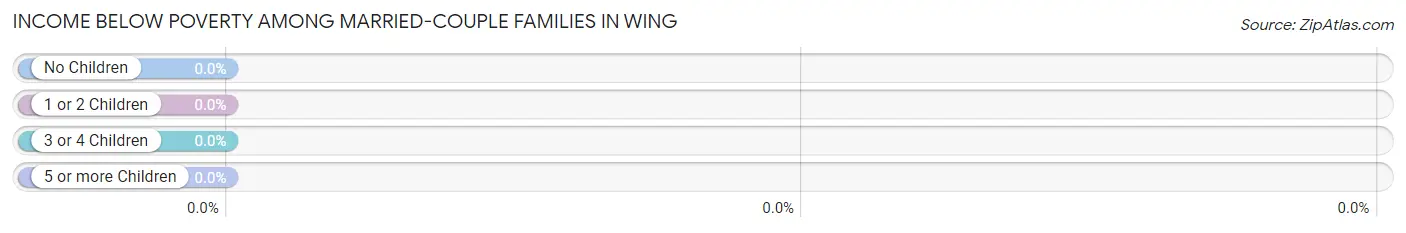
| Children | Above Poverty | Below Poverty |
| No Children | 14 (100.0%) | 0 (0.0%) |
| 1 or 2 Children | 21 (100.0%) | 0 (0.0%) |
| 3 or 4 Children | 10 (100.0%) | 0 (0.0%) |
| 5 or more Children | 1 (100.0%) | 0 (0.0%) |
| Total | 46 (100.0%) | 0 (0.0%) |
Income Below Poverty Among Single-Parent Households in Wing
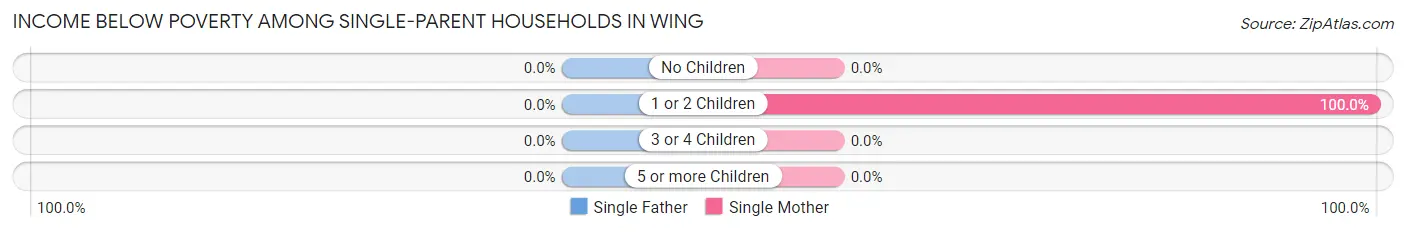
| Children | Single Father | Single Mother |
| No Children | 0 (0.0%) | 0 (0.0%) |
| 1 or 2 Children | 0 (0.0%) | 1 (100.0%) |
| 3 or 4 Children | 0 (0.0%) | 0 (0.0%) |
| 5 or more Children | 0 (0.0%) | 0 (0.0%) |
| Total | 0 (0.0%) | 1 (50.0%) |
Income Below Poverty Among Married-Couple vs Single-Parent Households in Wing
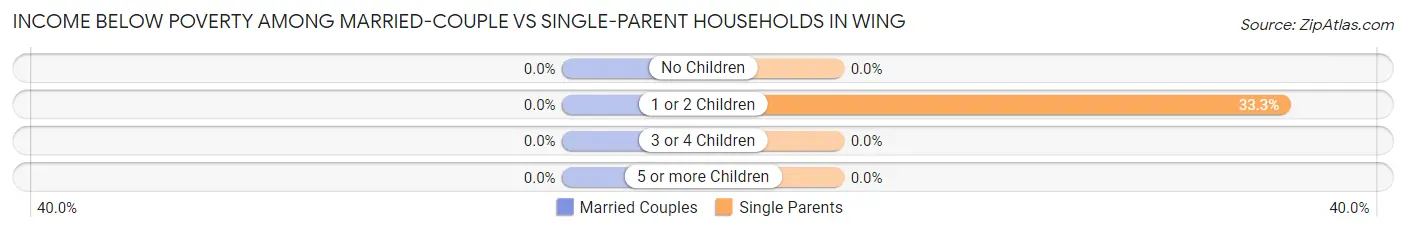
| Children | Married-Couple Families | Single-Parent Households |
| No Children | 0 (0.0%) | 0 (0.0%) |
| 1 or 2 Children | 0 (0.0%) | 1 (33.3%) |
| 3 or 4 Children | 0 (0.0%) | 0 (0.0%) |
| 5 or more Children | 0 (0.0%) | 0 (0.0%) |
| Total | 0 (0.0%) | 1 (16.7%) |
Race in Wing
The most populous races in Wing are White / Caucasian (202 | 91.4%), Two or more Races (17 | 7.7%), and Some other Race (2 | 0.9%).
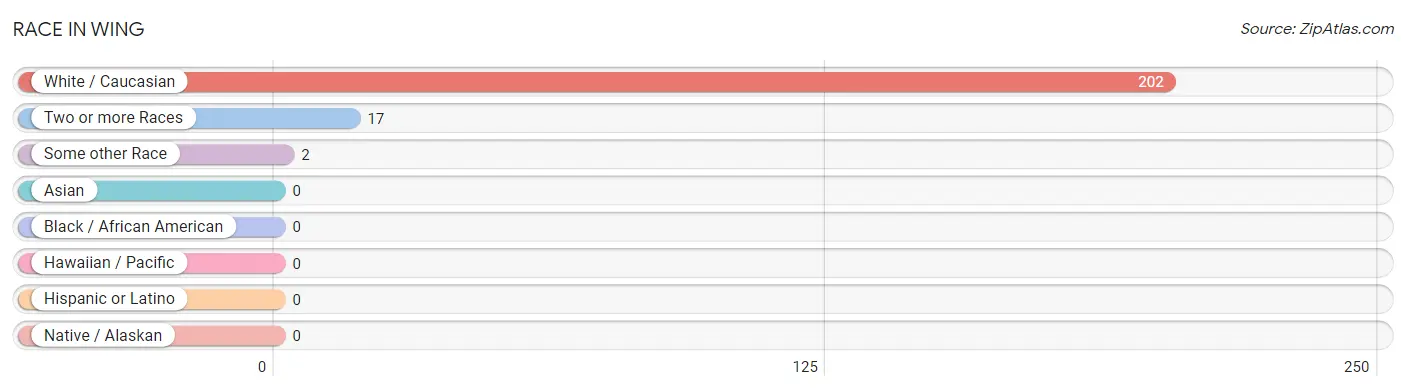
| Race | # Population | % Population |
| Asian | 0 | 0.0% |
| Black / African American | 0 | 0.0% |
| Hawaiian / Pacific | 0 | 0.0% |
| Hispanic or Latino | 0 | 0.0% |
| Native / Alaskan | 0 | 0.0% |
| White / Caucasian | 202 | 91.4% |
| Two or more Races | 17 | 7.7% |
| Some other Race | 2 | 0.9% |
| Total | 221 | 100.0% |
Ancestry in Wing
The most populous ancestries reported in Wing are German (123 | 55.7%), Irish (37 | 16.7%), Polish (32 | 14.5%), English (17 | 7.7%), and Norwegian (13 | 5.9%), together accounting for 100.4% of all Wing residents.
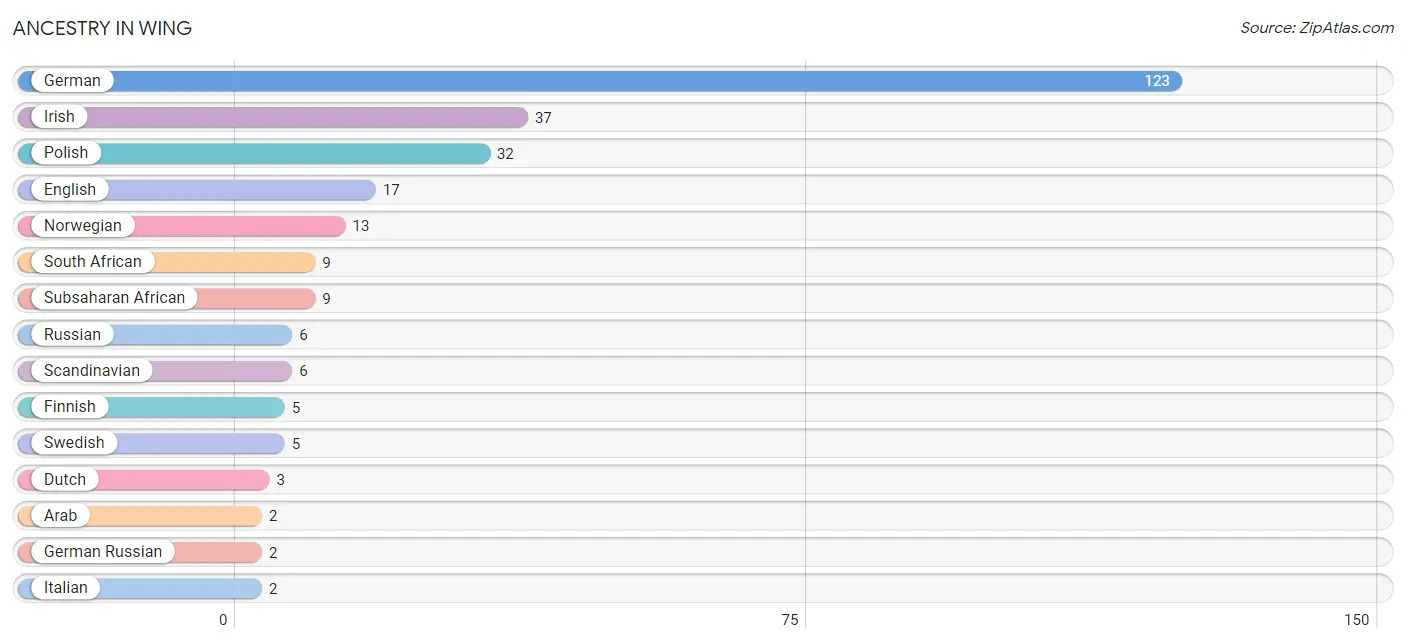
| Ancestry | # Population | % Population |
| American | 1 | 0.4% |
| Arab | 2 | 0.9% |
| Dutch | 3 | 1.4% |
| English | 17 | 7.7% |
| Finnish | 5 | 2.3% |
| German | 123 | 55.7% |
| German Russian | 2 | 0.9% |
| Hungarian | 1 | 0.4% |
| Irish | 37 | 16.7% |
| Italian | 2 | 0.9% |
| Lebanese | 2 | 0.9% |
| Norwegian | 13 | 5.9% |
| Polish | 32 | 14.5% |
| Russian | 6 | 2.7% |
| Scandinavian | 6 | 2.7% |
| South African | 9 | 4.1% |
| Subsaharan African | 9 | 4.1% |
| Swedish | 5 | 2.3% |
| Ukrainian | 1 | 0.4% | View All 19 Rows |
Immigrants in Wing
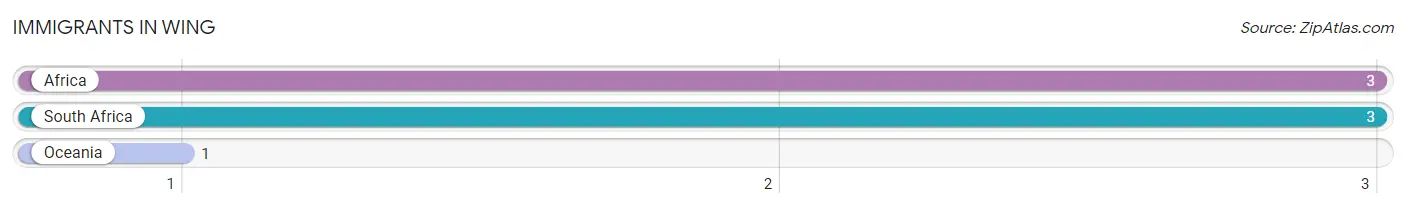
The most numerous immigrant groups reported in Wing came from Africa (3 | 1.4%), South Africa (3 | 1.4%), and Oceania (1 | 0.4%), together accounting for 3.2% of all Wing residents.
| Immigration Origin | # Population | % Population |
| Africa | 3 | 1.4% |
| Oceania | 1 | 0.4% |
| South Africa | 3 | 1.4% | View All 3 Rows |
Sex and Age in Wing
Sex and Age in Wing
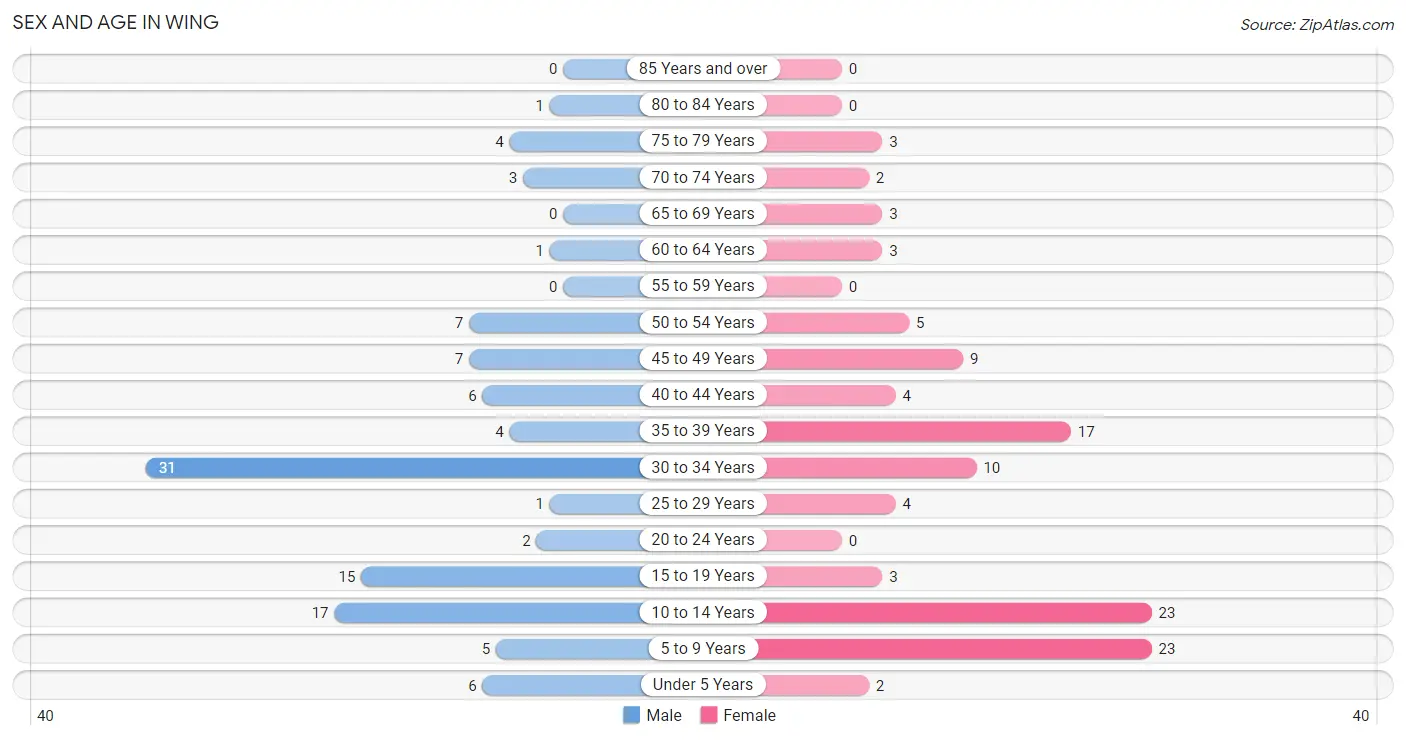
The most populous age groups in Wing are 30 to 34 Years (31 | 28.2%) for men and 5 to 9 Years (23 | 20.7%) for women.
| Age Bracket | Male | Female |
| Under 5 Years | 6 (5.4%) | 2 (1.8%) |
| 5 to 9 Years | 5 (4.5%) | 23 (20.7%) |
| 10 to 14 Years | 17 (15.4%) | 23 (20.7%) |
| 15 to 19 Years | 15 (13.6%) | 3 (2.7%) |
| 20 to 24 Years | 2 (1.8%) | 0 (0.0%) |
| 25 to 29 Years | 1 (0.9%) | 4 (3.6%) |
| 30 to 34 Years | 31 (28.2%) | 10 (9.0%) |
| 35 to 39 Years | 4 (3.6%) | 17 (15.3%) |
| 40 to 44 Years | 6 (5.4%) | 4 (3.6%) |
| 45 to 49 Years | 7 (6.4%) | 9 (8.1%) |
| 50 to 54 Years | 7 (6.4%) | 5 (4.5%) |
| 55 to 59 Years | 0 (0.0%) | 0 (0.0%) |
| 60 to 64 Years | 1 (0.9%) | 3 (2.7%) |
| 65 to 69 Years | 0 (0.0%) | 3 (2.7%) |
| 70 to 74 Years | 3 (2.7%) | 2 (1.8%) |
| 75 to 79 Years | 4 (3.6%) | 3 (2.7%) |
| 80 to 84 Years | 1 (0.9%) | 0 (0.0%) |
| 85 Years and over | 0 (0.0%) | 0 (0.0%) |
| Total | 110 (100.0%) | 111 (100.0%) |
Families and Households in Wing
Median Family Size in Wing
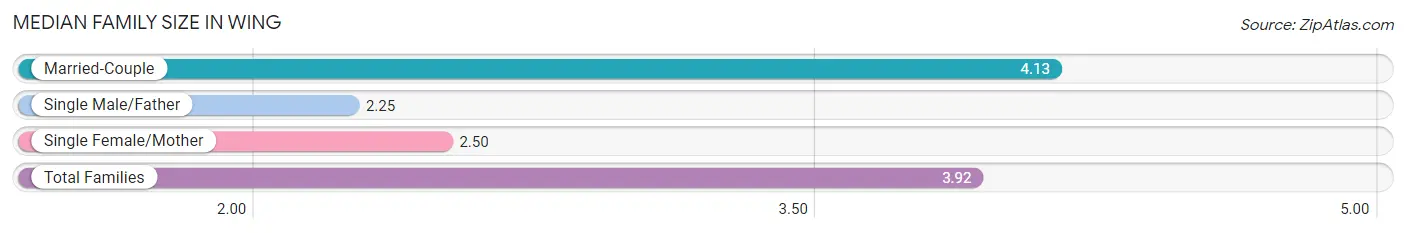
The median family size in Wing is 3.92 persons per family, with married-couple families (46 | 88.5%) accounting for the largest median family size of 4.13 persons per family. On the other hand, single male/father families (4 | 7.7%) represent the smallest median family size with 2.25 persons per family.
| Family Type | # Families | Family Size |
| Married-Couple | 46 (88.5%) | 4.13 |
| Single Male/Father | 4 (7.7%) | 2.25 |
| Single Female/Mother | 2 (3.8%) | 2.50 |
| Total Families | 52 (100.0%) | 3.92 |
Median Household Size in Wing
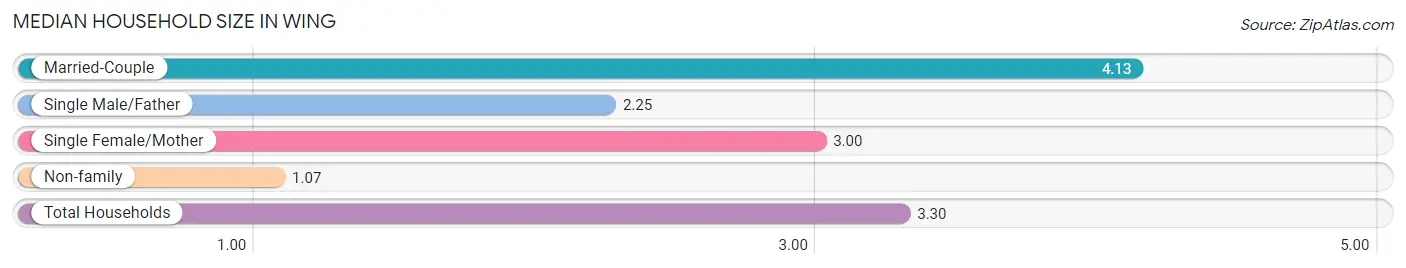
The median household size in Wing is 3.30 persons per household, with married-couple households (46 | 68.7%) accounting for the largest median household size of 4.13 persons per household. non-family households (15 | 22.4%) represent the smallest median household size with 1.07 persons per household.
| Household Type | # Households | Household Size |
| Married-Couple | 46 (68.7%) | 4.13 |
| Single Male/Father | 4 (6.0%) | 2.25 |
| Single Female/Mother | 2 (3.0%) | 3.00 |
| Non-family | 15 (22.4%) | 1.07 |
| Total Households | 67 (100.0%) | 3.30 |
Household Size by Marriage Status in Wing
Out of a total of 67 households in Wing, 52 (77.6%) are family households, while 15 (22.4%) are nonfamily households. The most numerous type of family households are 4-person households, comprising 18, and the most common type of nonfamily households are 1-person households, comprising 13.
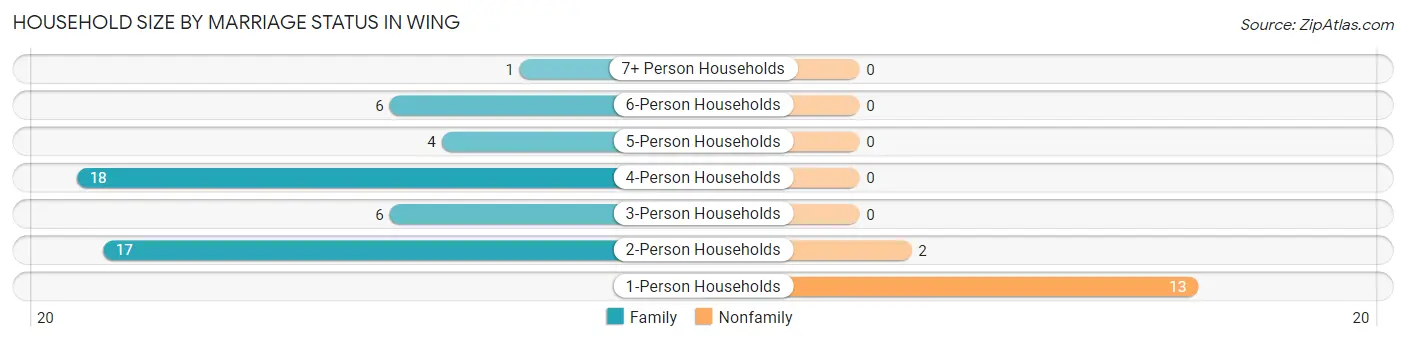
| Household Size | Family Households | Nonfamily Households |
| 1-Person Households | - | 13 (19.4%) |
| 2-Person Households | 17 (25.4%) | 2 (3.0%) |
| 3-Person Households | 6 (9.0%) | 0 (0.0%) |
| 4-Person Households | 18 (26.9%) | 0 (0.0%) |
| 5-Person Households | 4 (6.0%) | 0 (0.0%) |
| 6-Person Households | 6 (9.0%) | 0 (0.0%) |
| 7+ Person Households | 1 (1.5%) | 0 (0.0%) |
| Total | 52 (77.6%) | 15 (22.4%) |
Female Fertility in Wing
Fertility by Age in Wing
Average fertility rate in Wing is 42.0 births per 1,000 women. Women in the age bracket of 35 to 50 years have the highest fertility rate with 65.0 births per 1,000 women. Women in the age bracket of 35 to 50 years acount for 100.0% of all women with births.
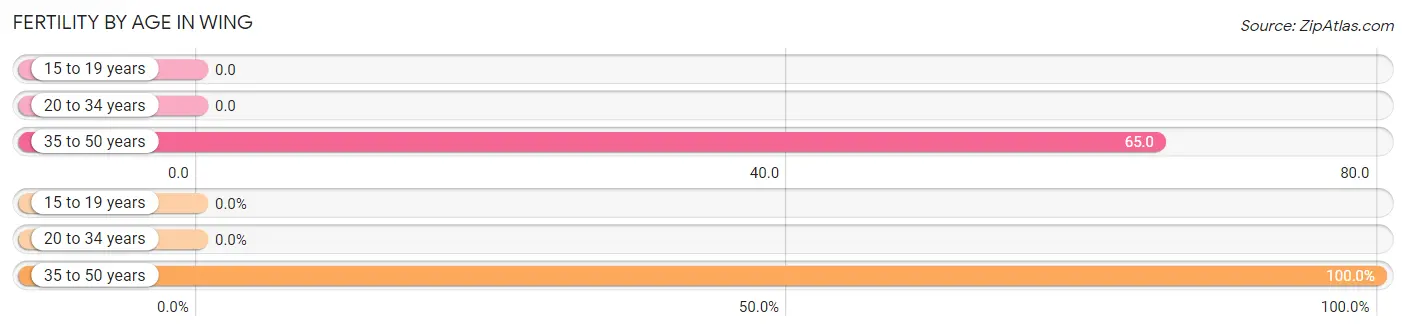
| Age Bracket | Women with Births | Births / 1,000 Women |
| 15 to 19 years | 0 (0.0%) | 0.0 |
| 20 to 34 years | 0 (0.0%) | 0.0 |
| 35 to 50 years | 2 (100.0%) | 65.0 |
| Total | 2 (100.0%) | 42.0 |
Fertility by Age by Marriage Status in Wing
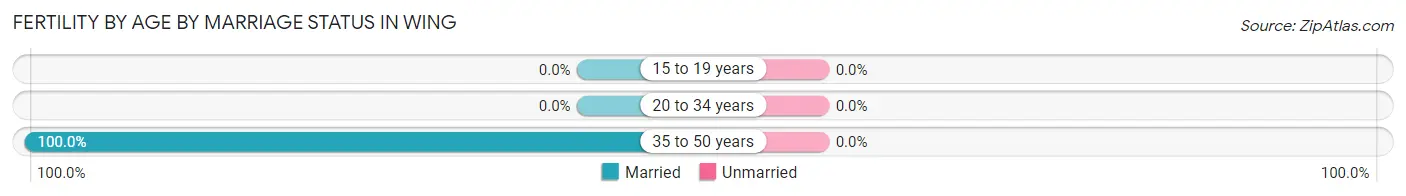
| Age Bracket | Married | Unmarried |
| 15 to 19 years | 0 (0.0%) | 0 (0.0%) |
| 20 to 34 years | 0 (0.0%) | 0 (0.0%) |
| 35 to 50 years | 2 (100.0%) | 0 (0.0%) |
| Total | 2 (100.0%) | 0 (0.0%) |
Fertility by Education in Wing
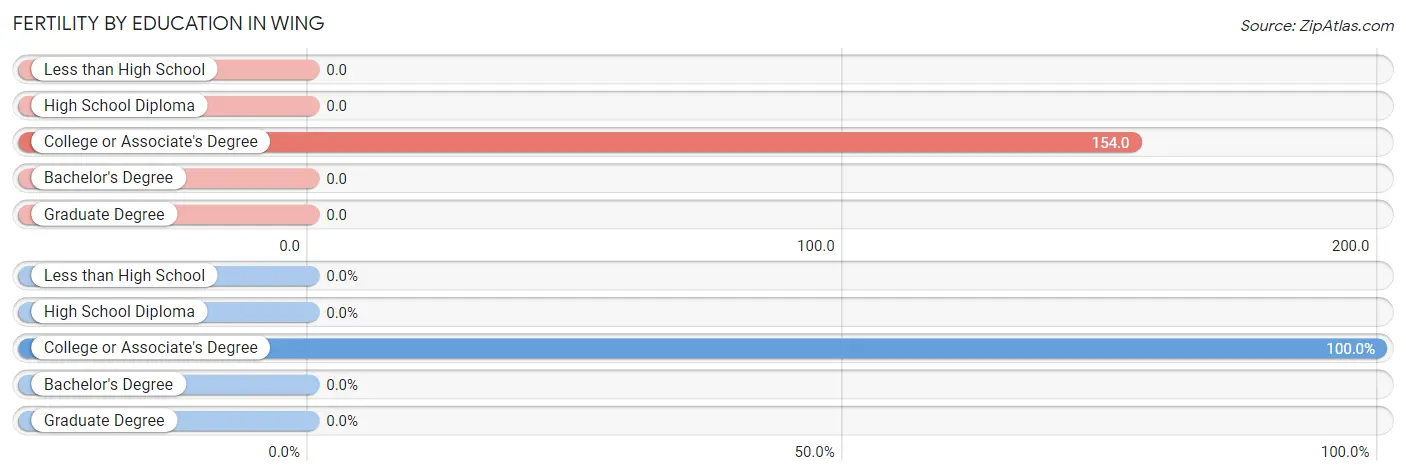
| Educational Attainment | Women with Births | Births / 1,000 Women |
| Less than High School | 0 (0.0%) | 0.0 |
| High School Diploma | 0 (0.0%) | 0.0 |
| College or Associate's Degree | 2 (100.0%) | 154.0 |
| Bachelor's Degree | 0 (0.0%) | 0.0 |
| Graduate Degree | 0 (0.0%) | 0.0 |
| Total | 2 (100.0%) | 42.0 |
Fertility by Education by Marriage Status in Wing
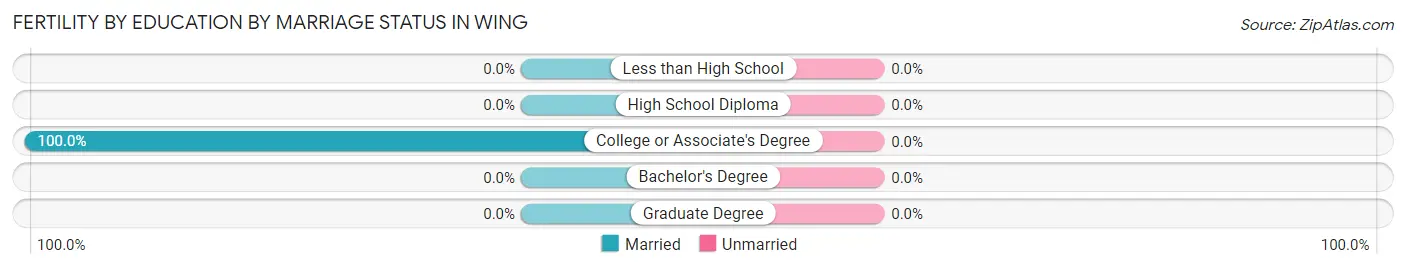
| Educational Attainment | Married | Unmarried |
| Less than High School | 0 (0.0%) | 0 (0.0%) |
| High School Diploma | 0 (0.0%) | 0 (0.0%) |
| College or Associate's Degree | 2 (100.0%) | 0 (0.0%) |
| Bachelor's Degree | 0 (0.0%) | 0 (0.0%) |
| Graduate Degree | 0 (0.0%) | 0 (0.0%) |
| Total | 2 (100.0%) | 0 (0.0%) |
Employment Characteristics in Wing
Employment by Class of Employer in Wing
Among the 116 employed individuals in Wing, private company employees (77 | 66.4%), federal government employees (10 | 8.6%), and local government employees (9 | 7.8%) make up the most common classes of employment.
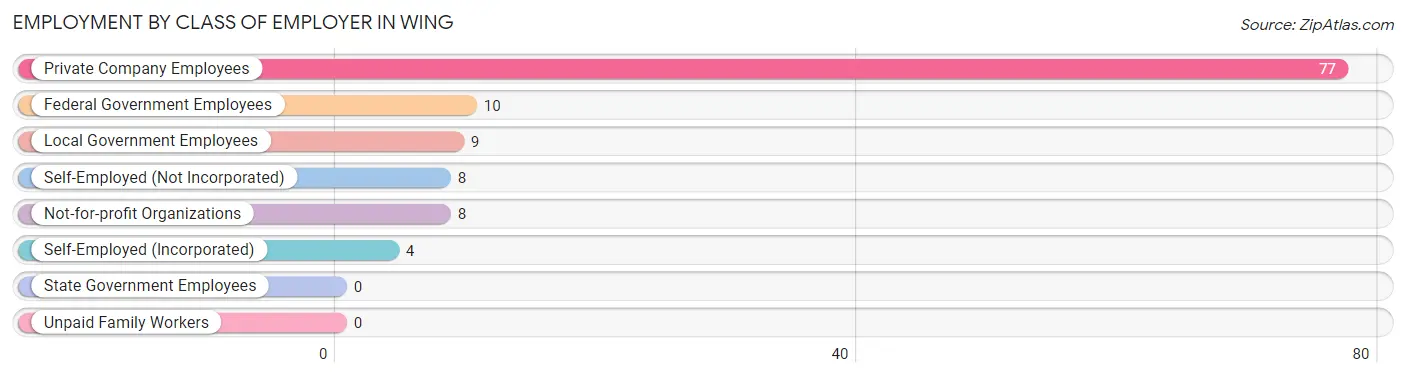
| Employer Class | # Employees | % Employees |
| Private Company Employees | 77 | 66.4% |
| Self-Employed (Incorporated) | 4 | 3.5% |
| Self-Employed (Not Incorporated) | 8 | 6.9% |
| Not-for-profit Organizations | 8 | 6.9% |
| Local Government Employees | 9 | 7.8% |
| State Government Employees | 0 | 0.0% |
| Federal Government Employees | 10 | 8.6% |
| Unpaid Family Workers | 0 | 0.0% |
| Total | 116 | 100.0% |
Employment Status by Age in Wing
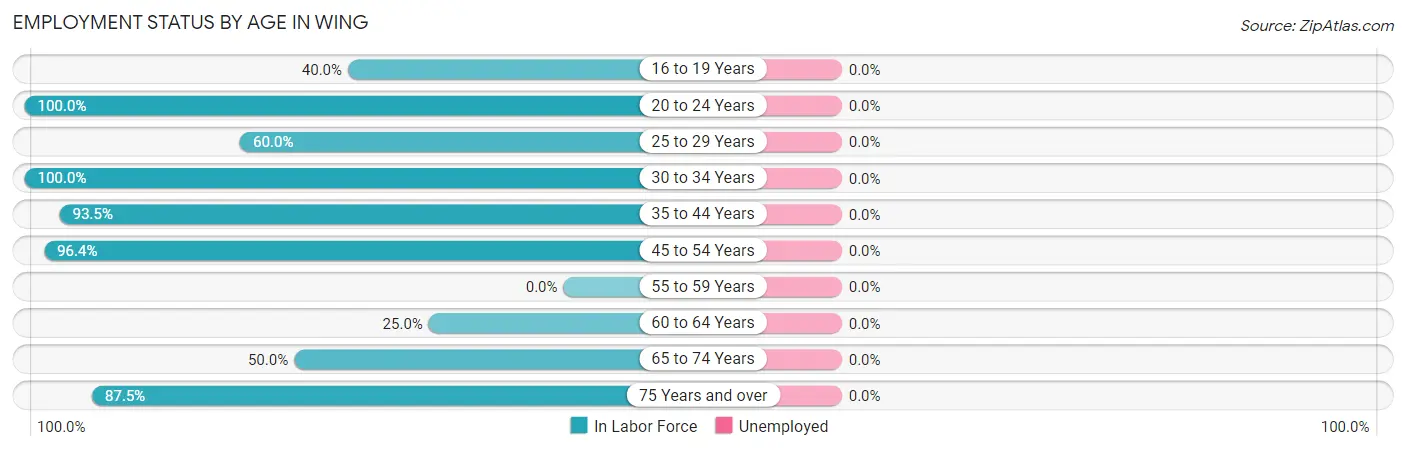
| Age Bracket | In Labor Force | Unemployed |
| 16 to 19 Years | 2 (40.0%) | 0 (0.0%) |
| 20 to 24 Years | 2 (100.0%) | 0 (0.0%) |
| 25 to 29 Years | 3 (60.0%) | 0 (0.0%) |
| 30 to 34 Years | 41 (100.0%) | 0 (0.0%) |
| 35 to 44 Years | 29 (93.5%) | 0 (0.0%) |
| 45 to 54 Years | 27 (96.4%) | 0 (0.0%) |
| 55 to 59 Years | 0 (0.0%) | 0 (0.0%) |
| 60 to 64 Years | 1 (25.0%) | 0 (0.0%) |
| 65 to 74 Years | 4 (50.0%) | 0 (0.0%) |
| 75 Years and over | 7 (87.5%) | 0 (0.0%) |
| Total | 116 (87.9%) | 0 (0.0%) |
Employment Status by Educational Attainment in Wing
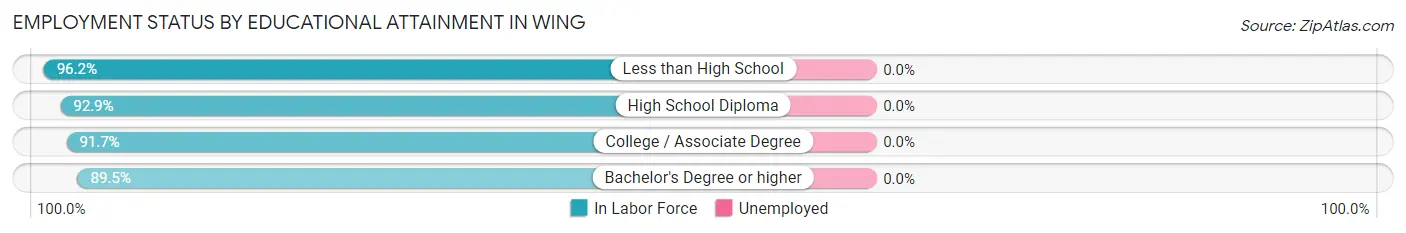
| Educational Attainment | In Labor Force | Unemployed |
| Less than High School | 25 (96.2%) | 0 (0.0%) |
| High School Diploma | 26 (92.9%) | 0 (0.0%) |
| College / Associate Degree | 33 (91.7%) | 0 (0.0%) |
| Bachelor's Degree or higher | 17 (89.5%) | 0 (0.0%) |
| Total | 101 (92.7%) | 0 (0.0%) |
Employment Occupations by Sex in Wing
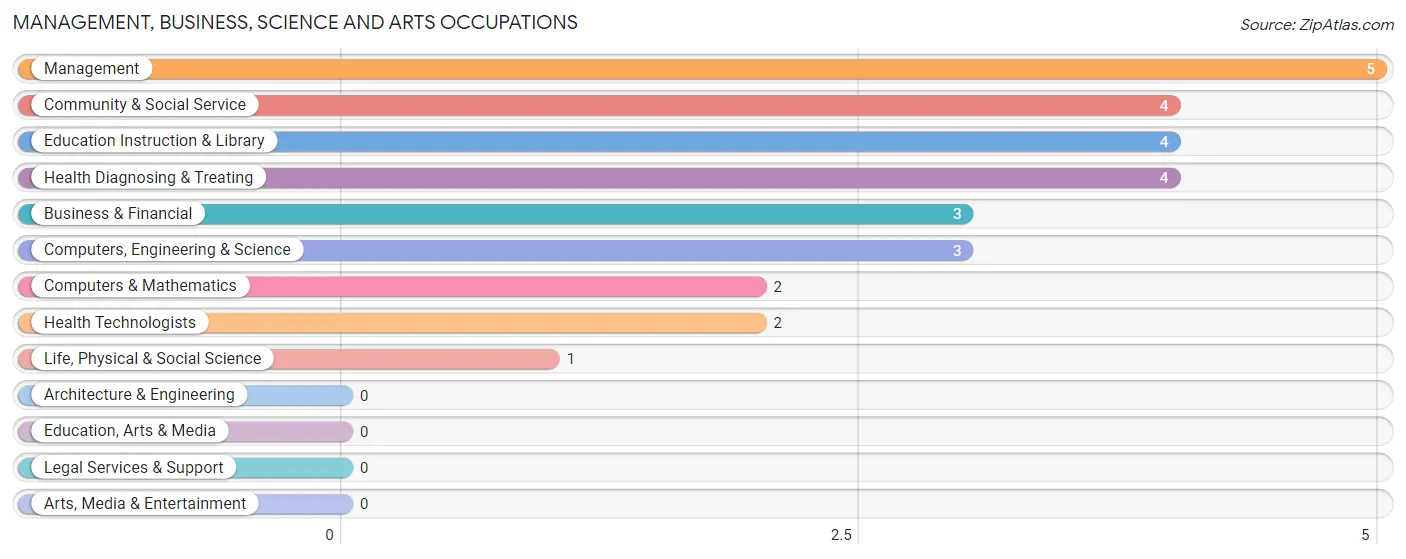
Management, Business, Science and Arts Occupations
The most common Management, Business, Science and Arts occupations in Wing are Management (5 | 4.3%), Community & Social Service (4 | 3.5%), Education Instruction & Library (4 | 3.5%), Health Diagnosing & Treating (4 | 3.5%), and Business & Financial (3 | 2.6%).
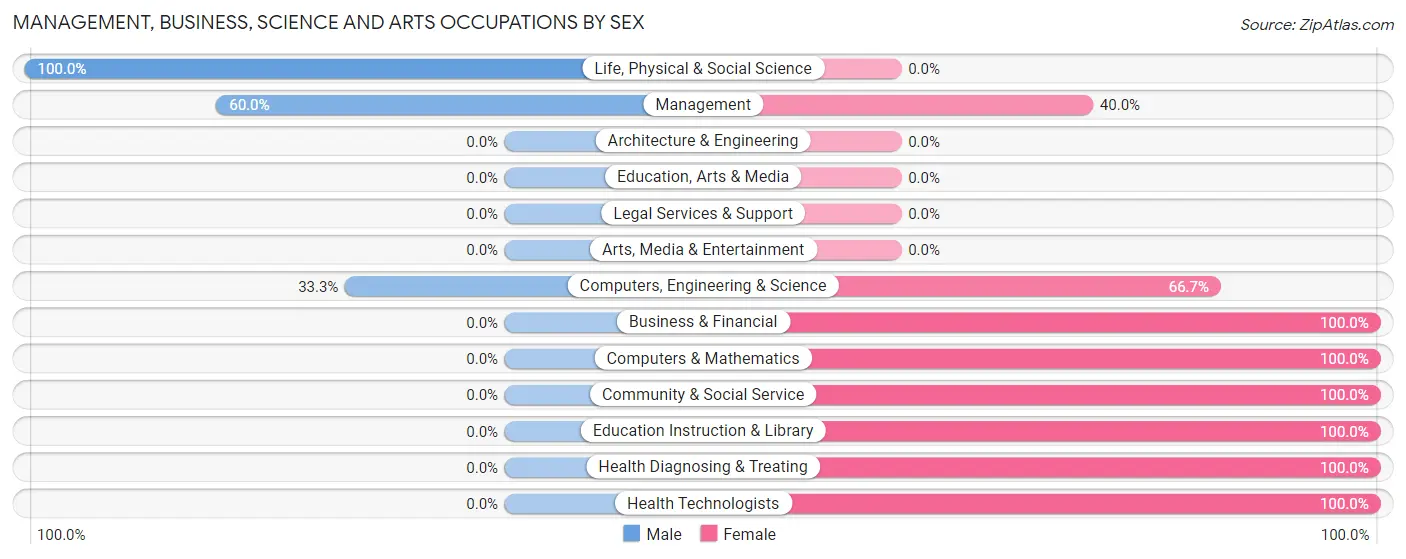
Management, Business, Science and Arts Occupations by Sex
Within the Management, Business, Science and Arts occupations in Wing, the most male-oriented occupations are Life, Physical & Social Science (100.0%), Management (60.0%), and Computers, Engineering & Science (33.3%), while the most female-oriented occupations are Business & Financial (100.0%), Computers & Mathematics (100.0%), and Community & Social Service (100.0%).
| Occupation | Male | Female |
| Management | 3 (60.0%) | 2 (40.0%) |
| Business & Financial | 0 (0.0%) | 3 (100.0%) |
| Computers, Engineering & Science | 1 (33.3%) | 2 (66.7%) |
| Computers & Mathematics | 0 (0.0%) | 2 (100.0%) |
| Architecture & Engineering | 0 (0.0%) | 0 (0.0%) |
| Life, Physical & Social Science | 1 (100.0%) | 0 (0.0%) |
| Community & Social Service | 0 (0.0%) | 4 (100.0%) |
| Education, Arts & Media | 0 (0.0%) | 0 (0.0%) |
| Legal Services & Support | 0 (0.0%) | 0 (0.0%) |
| Education Instruction & Library | 0 (0.0%) | 4 (100.0%) |
| Arts, Media & Entertainment | 0 (0.0%) | 0 (0.0%) |
| Health Diagnosing & Treating | 0 (0.0%) | 4 (100.0%) |
| Health Technologists | 0 (0.0%) | 2 (100.0%) |
| Total (Category) | 4 (21.0%) | 15 (78.9%) |
| Total (Overall) | 65 (56.0%) | 51 (44.0%) |
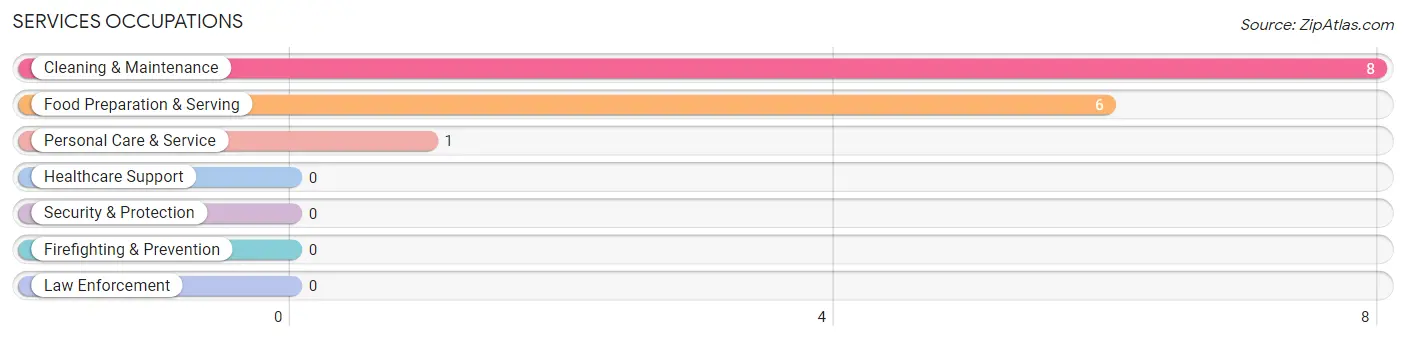
Services Occupations
The most common Services occupations in Wing are Cleaning & Maintenance (8 | 6.9%), Food Preparation & Serving (6 | 5.2%), and Personal Care & Service (1 | 0.9%).
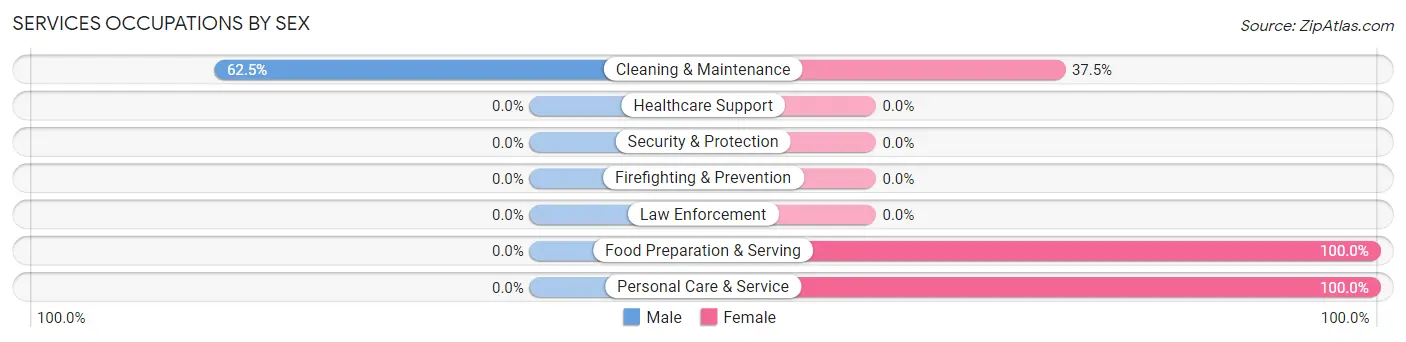
Services Occupations by Sex
| Occupation | Male | Female |
| Healthcare Support | 0 (0.0%) | 0 (0.0%) |
| Security & Protection | 0 (0.0%) | 0 (0.0%) |
| Firefighting & Prevention | 0 (0.0%) | 0 (0.0%) |
| Law Enforcement | 0 (0.0%) | 0 (0.0%) |
| Food Preparation & Serving | 0 (0.0%) | 6 (100.0%) |
| Cleaning & Maintenance | 5 (62.5%) | 3 (37.5%) |
| Personal Care & Service | 0 (0.0%) | 1 (100.0%) |
| Total (Category) | 5 (33.3%) | 10 (66.7%) |
| Total (Overall) | 65 (56.0%) | 51 (44.0%) |
Sales and Office Occupations
The most common Sales and Office occupations in Wing are Sales & Related (21 | 18.1%), and Office & Administration (9 | 7.8%).
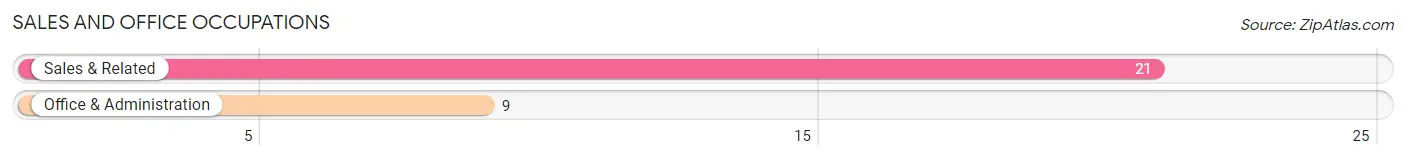
Sales and Office Occupations by Sex
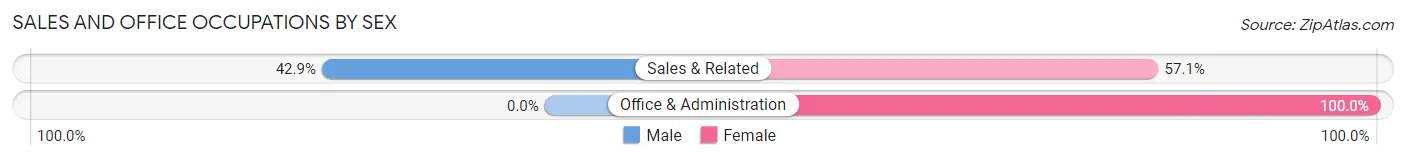
| Occupation | Male | Female |
| Sales & Related | 9 (42.9%) | 12 (57.1%) |
| Office & Administration | 0 (0.0%) | 9 (100.0%) |
| Total (Category) | 9 (30.0%) | 21 (70.0%) |
| Total (Overall) | 65 (56.0%) | 51 (44.0%) |
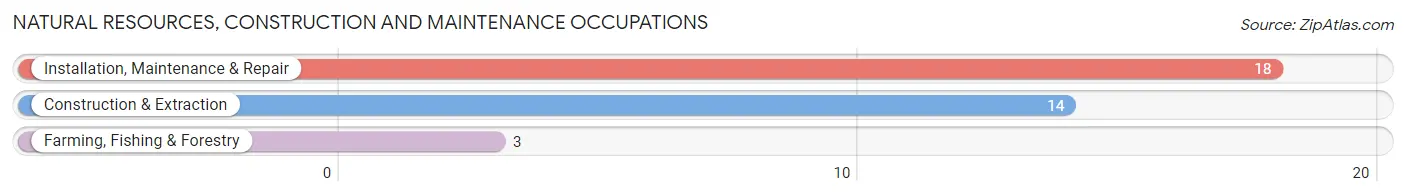
Natural Resources, Construction and Maintenance Occupations
The most common Natural Resources, Construction and Maintenance occupations in Wing are Installation, Maintenance & Repair (18 | 15.5%), Construction & Extraction (14 | 12.1%), and Farming, Fishing & Forestry (3 | 2.6%).
Natural Resources, Construction and Maintenance Occupations by Sex
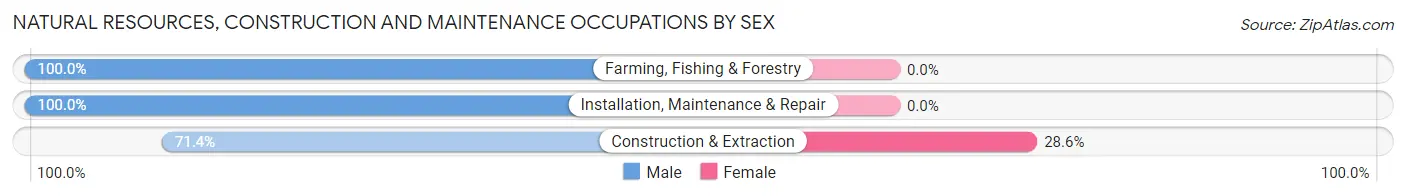
| Occupation | Male | Female |
| Farming, Fishing & Forestry | 3 (100.0%) | 0 (0.0%) |
| Construction & Extraction | 10 (71.4%) | 4 (28.6%) |
| Installation, Maintenance & Repair | 18 (100.0%) | 0 (0.0%) |
| Total (Category) | 31 (88.6%) | 4 (11.4%) |
| Total (Overall) | 65 (56.0%) | 51 (44.0%) |
Production, Transportation and Moving Occupations
The most common Production, Transportation and Moving occupations in Wing are Production (10 | 8.6%), and Transportation (7 | 6.0%).
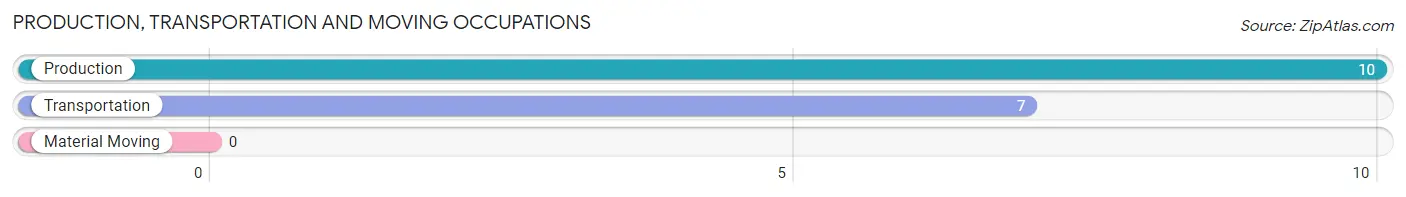
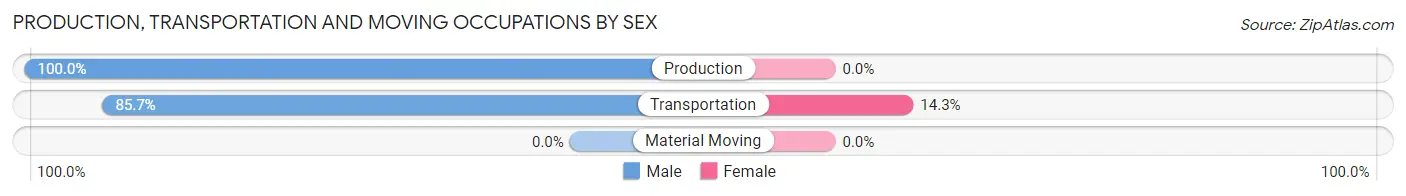
Production, Transportation and Moving Occupations by Sex
| Occupation | Male | Female |
| Production | 10 (100.0%) | 0 (0.0%) |
| Transportation | 6 (85.7%) | 1 (14.3%) |
| Material Moving | 0 (0.0%) | 0 (0.0%) |
| Total (Category) | 16 (94.1%) | 1 (5.9%) |
| Total (Overall) | 65 (56.0%) | 51 (44.0%) |
Employment Industries by Sex in Wing
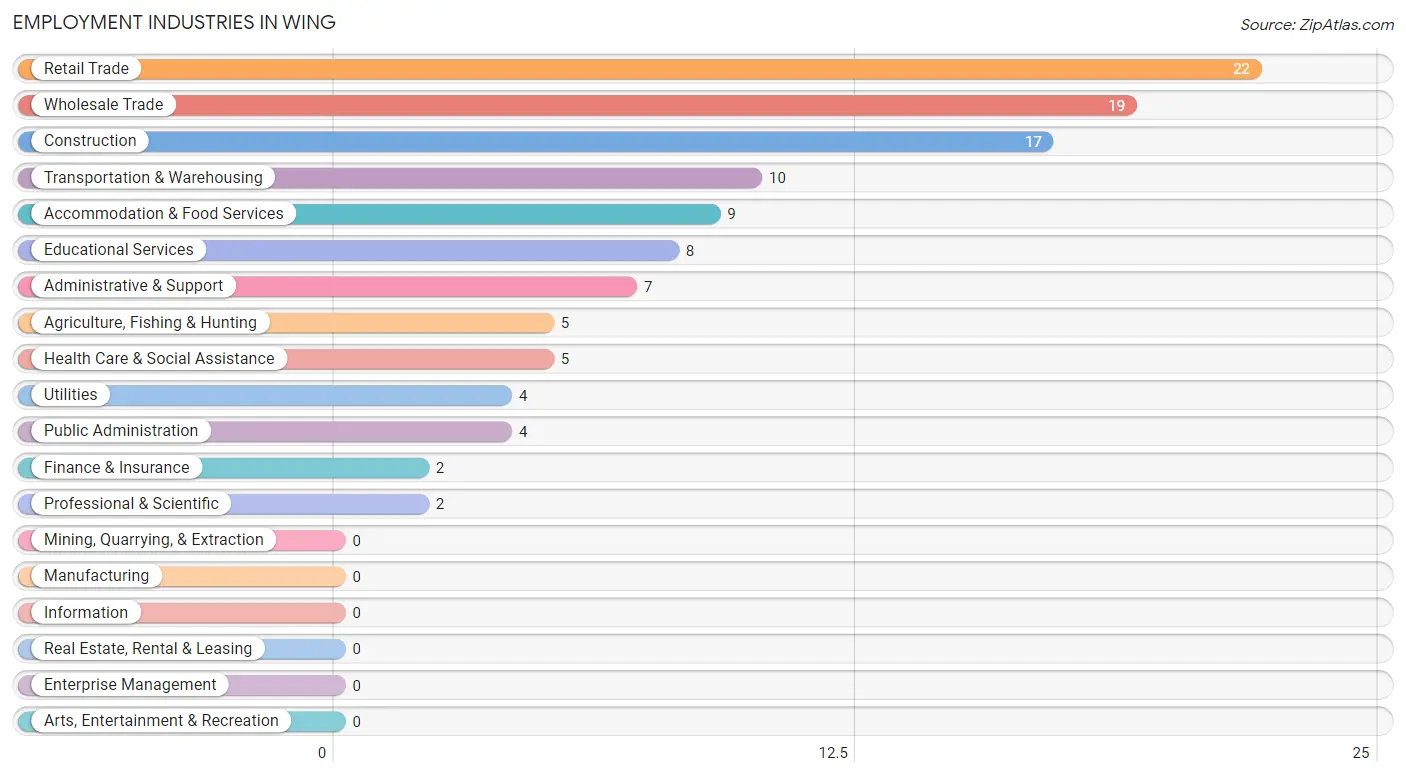
Employment Industries in Wing
The major employment industries in Wing include Retail Trade (22 | 19.0%), Wholesale Trade (19 | 16.4%), Construction (17 | 14.7%), Transportation & Warehousing (10 | 8.6%), and Accommodation & Food Services (9 | 7.8%).
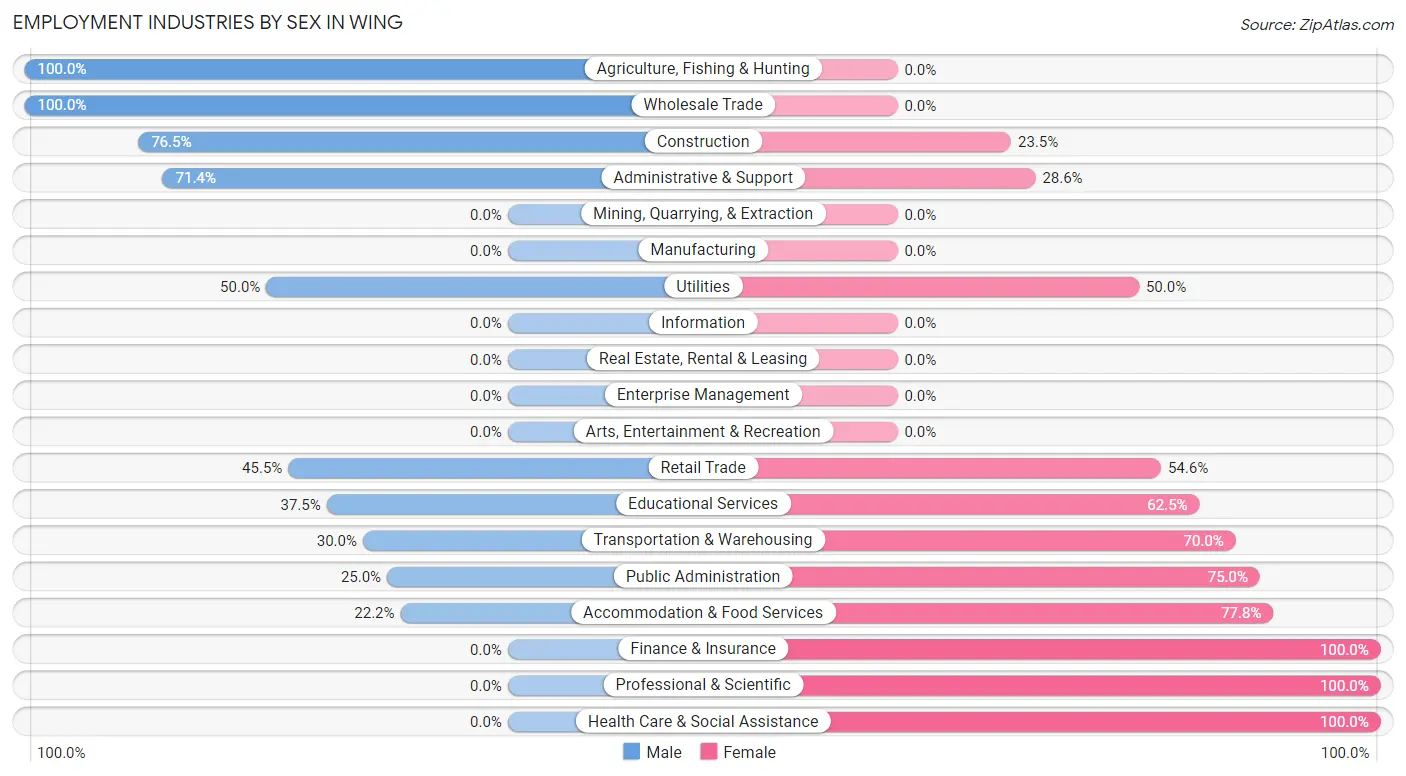
Employment Industries by Sex in Wing
The Wing industries that see more men than women are Agriculture, Fishing & Hunting (100.0%), Wholesale Trade (100.0%), and Construction (76.5%), whereas the industries that tend to have a higher number of women are Finance & Insurance (100.0%), Professional & Scientific (100.0%), and Health Care & Social Assistance (100.0%).
| Industry | Male | Female |
| Agriculture, Fishing & Hunting | 5 (100.0%) | 0 (0.0%) |
| Mining, Quarrying, & Extraction | 0 (0.0%) | 0 (0.0%) |
| Construction | 13 (76.5%) | 4 (23.5%) |
| Manufacturing | 0 (0.0%) | 0 (0.0%) |
| Wholesale Trade | 19 (100.0%) | 0 (0.0%) |
| Retail Trade | 10 (45.5%) | 12 (54.5%) |
| Transportation & Warehousing | 3 (30.0%) | 7 (70.0%) |
| Utilities | 2 (50.0%) | 2 (50.0%) |
| Information | 0 (0.0%) | 0 (0.0%) |
| Finance & Insurance | 0 (0.0%) | 2 (100.0%) |
| Real Estate, Rental & Leasing | 0 (0.0%) | 0 (0.0%) |
| Professional & Scientific | 0 (0.0%) | 2 (100.0%) |
| Enterprise Management | 0 (0.0%) | 0 (0.0%) |
| Administrative & Support | 5 (71.4%) | 2 (28.6%) |
| Educational Services | 3 (37.5%) | 5 (62.5%) |
| Health Care & Social Assistance | 0 (0.0%) | 5 (100.0%) |
| Arts, Entertainment & Recreation | 0 (0.0%) | 0 (0.0%) |
| Accommodation & Food Services | 2 (22.2%) | 7 (77.8%) |
| Public Administration | 1 (25.0%) | 3 (75.0%) |
| Total | 65 (56.0%) | 51 (44.0%) |
Education in Wing
School Enrollment in Wing
The most common levels of schooling among the 86 students in Wing are elementary school (42 | 48.8%), high school (18 | 20.9%), and middle school (15 | 17.4%).
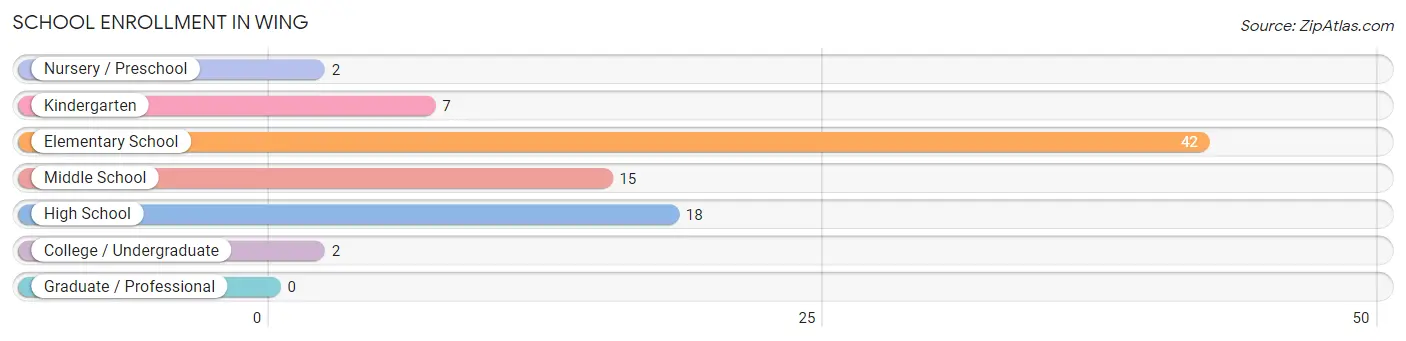
| School Level | # Students | % Students |
| Nursery / Preschool | 2 | 2.3% |
| Kindergarten | 7 | 8.1% |
| Elementary School | 42 | 48.8% |
| Middle School | 15 | 17.4% |
| High School | 18 | 20.9% |
| College / Undergraduate | 2 | 2.3% |
| Graduate / Professional | 0 | 0.0% |
| Total | 86 | 100.0% |
School Enrollment by Age by Funding Source in Wing
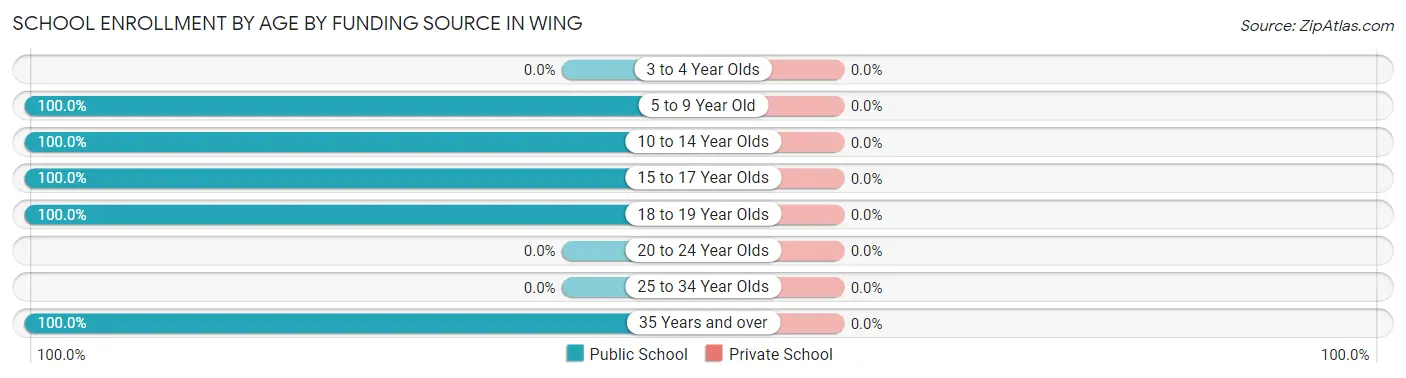
| Age Bracket | Public School | Private School |
| 3 to 4 Year Olds | 0 (0.0%) | 0 (0.0%) |
| 5 to 9 Year Old | 28 (100.0%) | 0 (0.0%) |
| 10 to 14 Year Olds | 38 (100.0%) | 0 (0.0%) |
| 15 to 17 Year Olds | 17 (100.0%) | 0 (0.0%) |
| 18 to 19 Year Olds | 1 (100.0%) | 0 (0.0%) |
| 20 to 24 Year Olds | 0 (0.0%) | 0 (0.0%) |
| 25 to 34 Year Olds | 0 (0.0%) | 0 (0.0%) |
| 35 Years and over | 2 (100.0%) | 0 (0.0%) |
| Total | 86 (100.0%) | 0 (0.0%) |
Educational Attainment by Field of Study in Wing
Science & technology (5 | 26.3%), business (3 | 15.8%), liberal arts & history (3 | 15.8%), social sciences (2 | 10.5%), and literature & languages (2 | 10.5%) are the most common fields of study among 19 individuals in Wing who have obtained a bachelor's degree or higher.
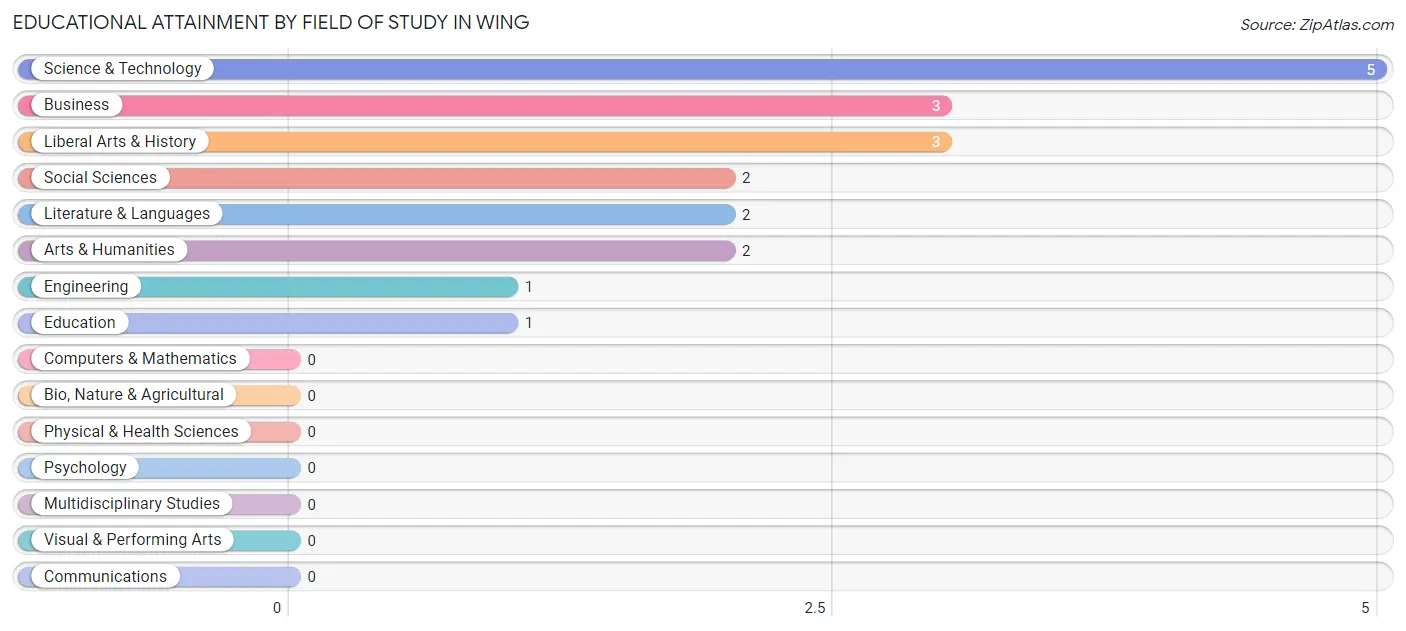
| Field of Study | # Graduates | % Graduates |
| Computers & Mathematics | 0 | 0.0% |
| Bio, Nature & Agricultural | 0 | 0.0% |
| Physical & Health Sciences | 0 | 0.0% |
| Psychology | 0 | 0.0% |
| Social Sciences | 2 | 10.5% |
| Engineering | 1 | 5.3% |
| Multidisciplinary Studies | 0 | 0.0% |
| Science & Technology | 5 | 26.3% |
| Business | 3 | 15.8% |
| Education | 1 | 5.3% |
| Literature & Languages | 2 | 10.5% |
| Liberal Arts & History | 3 | 15.8% |
| Visual & Performing Arts | 0 | 0.0% |
| Communications | 0 | 0.0% |
| Arts & Humanities | 2 | 10.5% |
| Total | 19 | 100.0% |
Transportation & Commute in Wing
Vehicle Availability by Sex in Wing
The most prevalent vehicle ownership categories in Wing are males with 3 vehicles (29, accounting for 44.6%) and females with 3 vehicles (25, making up 56.9%).
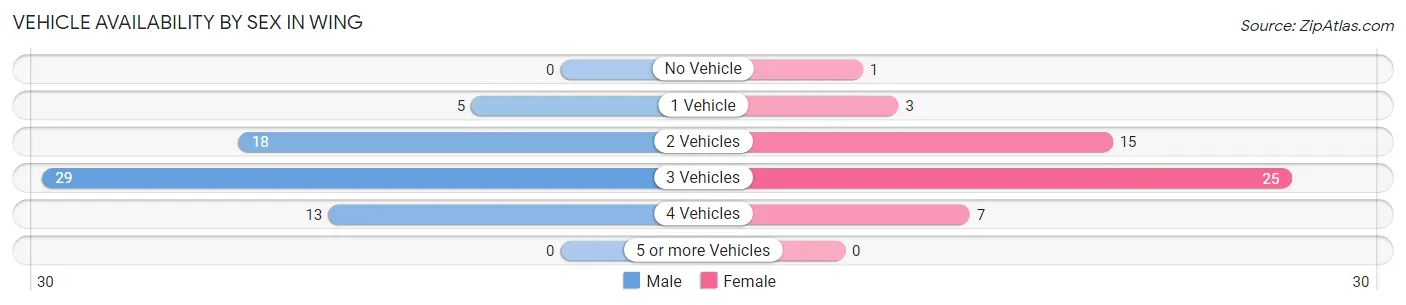
| Vehicles Available | Male | Female |
| No Vehicle | 0 (0.0%) | 1 (2.0%) |
| 1 Vehicle | 5 (7.7%) | 3 (5.9%) |
| 2 Vehicles | 18 (27.7%) | 15 (29.4%) |
| 3 Vehicles | 29 (44.6%) | 25 (49.0%) |
| 4 Vehicles | 13 (20.0%) | 7 (13.7%) |
| 5 or more Vehicles | 0 (0.0%) | 0 (0.0%) |
| Total | 65 (100.0%) | 51 (100.0%) |
Commute Time in Wing
The most frequently occuring commute durations in Wing are 45 to 59 minutes (41 commuters, 36.9%), less than 5 minutes (26 commuters, 23.4%), and 5 to 9 minutes (26 commuters, 23.4%).
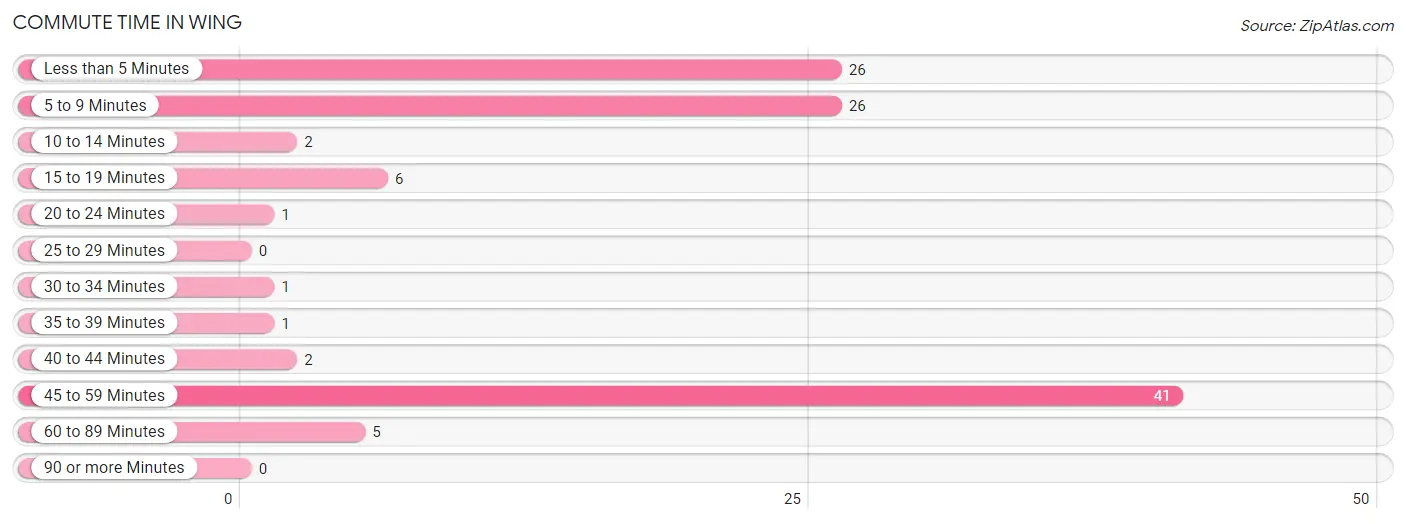
| Commute Time | # Commuters | % Commuters |
| Less than 5 Minutes | 26 | 23.4% |
| 5 to 9 Minutes | 26 | 23.4% |
| 10 to 14 Minutes | 2 | 1.8% |
| 15 to 19 Minutes | 6 | 5.4% |
| 20 to 24 Minutes | 1 | 0.9% |
| 25 to 29 Minutes | 0 | 0.0% |
| 30 to 34 Minutes | 1 | 0.9% |
| 35 to 39 Minutes | 1 | 0.9% |
| 40 to 44 Minutes | 2 | 1.8% |
| 45 to 59 Minutes | 41 | 36.9% |
| 60 to 89 Minutes | 5 | 4.5% |
| 90 or more Minutes | 0 | 0.0% |
Commute Time by Sex in Wing
The most common commute times in Wing are 45 to 59 minutes (31 commuters, 49.2%) for males and less than 5 minutes (15 commuters, 31.2%) for females.
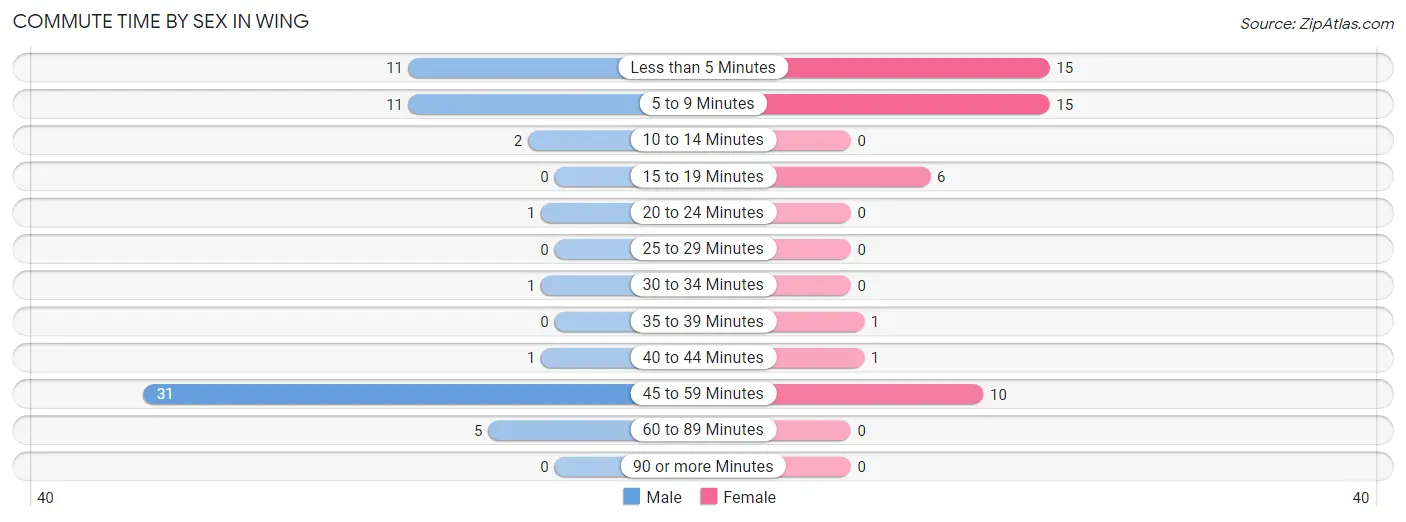
| Commute Time | Male | Female |
| Less than 5 Minutes | 11 (17.5%) | 15 (31.2%) |
| 5 to 9 Minutes | 11 (17.5%) | 15 (31.2%) |
| 10 to 14 Minutes | 2 (3.2%) | 0 (0.0%) |
| 15 to 19 Minutes | 0 (0.0%) | 6 (12.5%) |
| 20 to 24 Minutes | 1 (1.6%) | 0 (0.0%) |
| 25 to 29 Minutes | 0 (0.0%) | 0 (0.0%) |
| 30 to 34 Minutes | 1 (1.6%) | 0 (0.0%) |
| 35 to 39 Minutes | 0 (0.0%) | 1 (2.1%) |
| 40 to 44 Minutes | 1 (1.6%) | 1 (2.1%) |
| 45 to 59 Minutes | 31 (49.2%) | 10 (20.8%) |
| 60 to 89 Minutes | 5 (7.9%) | 0 (0.0%) |
| 90 or more Minutes | 0 (0.0%) | 0 (0.0%) |
Time of Departure to Work by Sex in Wing
The most frequent times of departure to work in Wing are 8:00 AM to 8:29 AM (13, 20.6%) for males and 11:00 AM to 11:59 AM (11, 22.9%) for females.
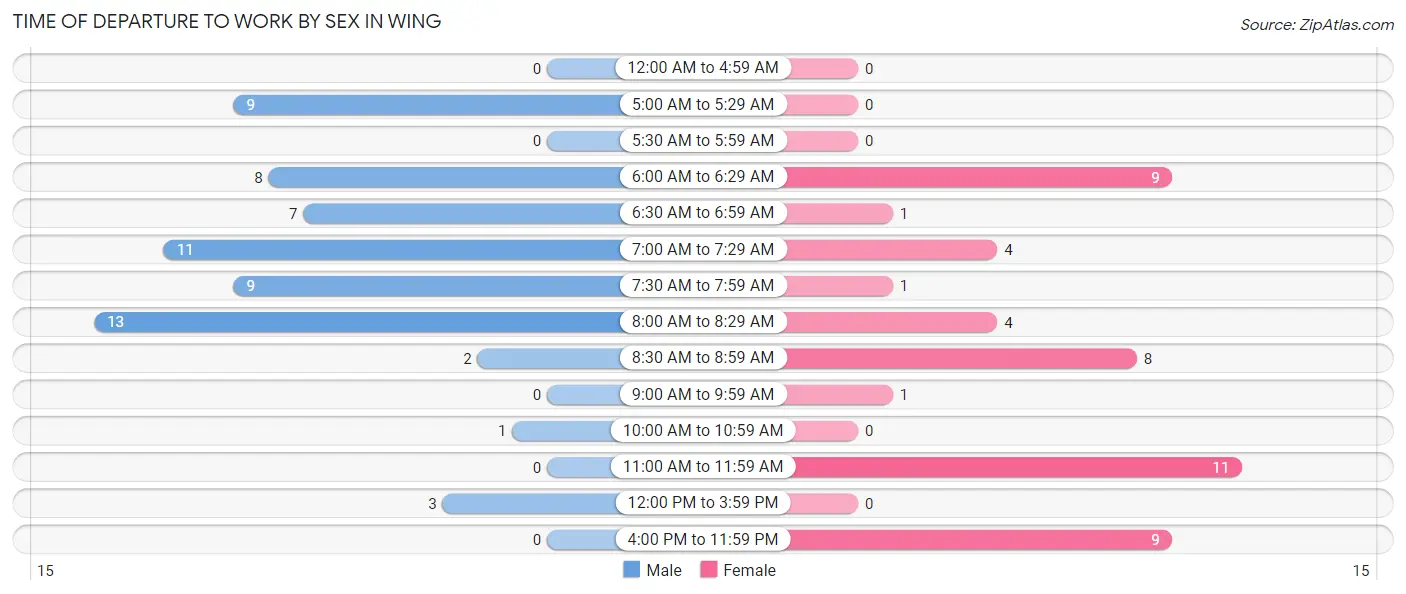
| Time of Departure | Male | Female |
| 12:00 AM to 4:59 AM | 0 (0.0%) | 0 (0.0%) |
| 5:00 AM to 5:29 AM | 9 (14.3%) | 0 (0.0%) |
| 5:30 AM to 5:59 AM | 0 (0.0%) | 0 (0.0%) |
| 6:00 AM to 6:29 AM | 8 (12.7%) | 9 (18.8%) |
| 6:30 AM to 6:59 AM | 7 (11.1%) | 1 (2.1%) |
| 7:00 AM to 7:29 AM | 11 (17.5%) | 4 (8.3%) |
| 7:30 AM to 7:59 AM | 9 (14.3%) | 1 (2.1%) |
| 8:00 AM to 8:29 AM | 13 (20.6%) | 4 (8.3%) |
| 8:30 AM to 8:59 AM | 2 (3.2%) | 8 (16.7%) |
| 9:00 AM to 9:59 AM | 0 (0.0%) | 1 (2.1%) |
| 10:00 AM to 10:59 AM | 1 (1.6%) | 0 (0.0%) |
| 11:00 AM to 11:59 AM | 0 (0.0%) | 11 (22.9%) |
| 12:00 PM to 3:59 PM | 3 (4.8%) | 0 (0.0%) |
| 4:00 PM to 11:59 PM | 0 (0.0%) | 9 (18.8%) |
| Total | 63 (100.0%) | 48 (100.0%) |
Housing Occupancy in Wing
Occupancy by Ownership in Wing
Of the total 67 dwellings in Wing, owner-occupied units account for 57 (85.1%), while renter-occupied units make up 10 (14.9%).
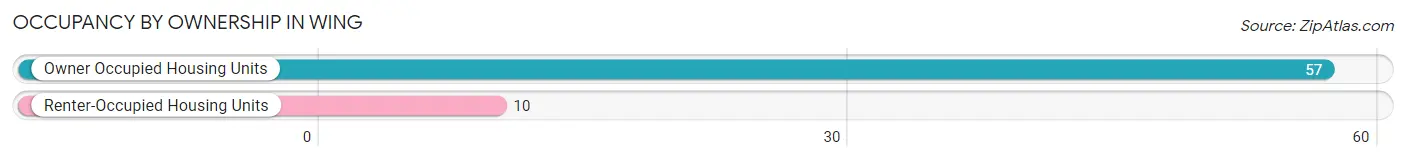
| Occupancy | # Housing Units | % Housing Units |
| Owner Occupied Housing Units | 57 | 85.1% |
| Renter-Occupied Housing Units | 10 | 14.9% |
| Total Occupied Housing Units | 67 | 100.0% |
Occupancy by Household Size in Wing
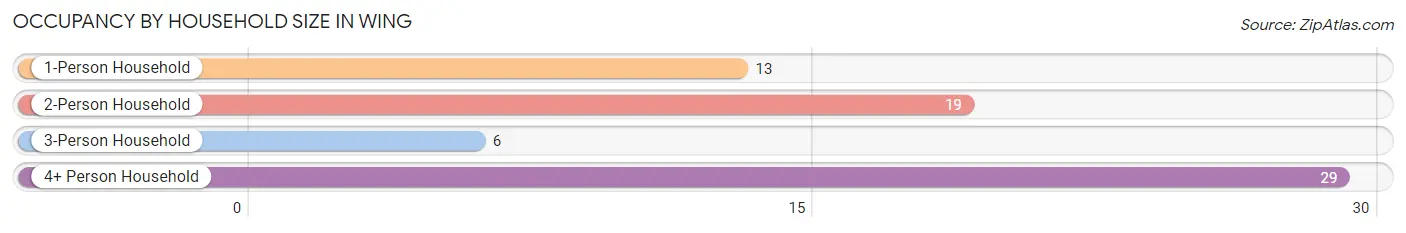
| Household Size | # Housing Units | % Housing Units |
| 1-Person Household | 13 | 19.4% |
| 2-Person Household | 19 | 28.4% |
| 3-Person Household | 6 | 9.0% |
| 4+ Person Household | 29 | 43.3% |
| Total Housing Units | 67 | 100.0% |
Occupancy by Ownership by Household Size in Wing
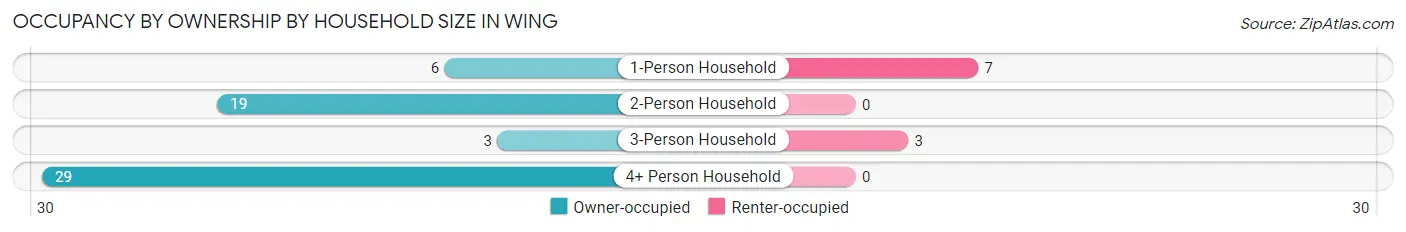
| Household Size | Owner-occupied | Renter-occupied |
| 1-Person Household | 6 (46.2%) | 7 (53.8%) |
| 2-Person Household | 19 (100.0%) | 0 (0.0%) |
| 3-Person Household | 3 (50.0%) | 3 (50.0%) |
| 4+ Person Household | 29 (100.0%) | 0 (0.0%) |
| Total Housing Units | 57 (85.1%) | 10 (14.9%) |
Occupancy by Educational Attainment in Wing
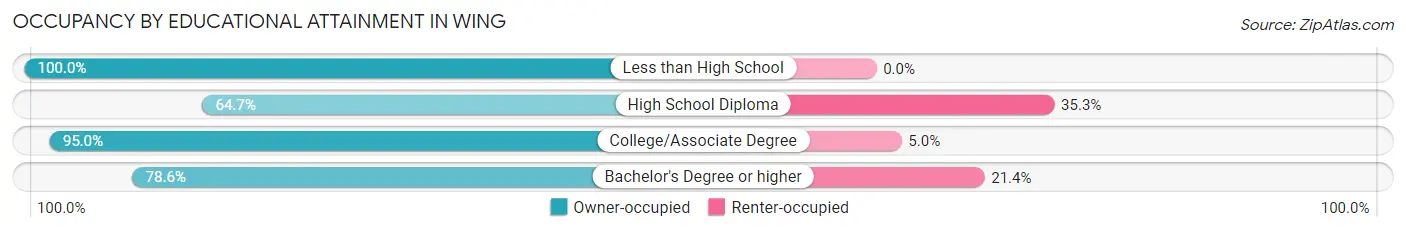
| Household Size | Owner-occupied | Renter-occupied |
| Less than High School | 16 (100.0%) | 0 (0.0%) |
| High School Diploma | 11 (64.7%) | 6 (35.3%) |
| College/Associate Degree | 19 (95.0%) | 1 (5.0%) |
| Bachelor's Degree or higher | 11 (78.6%) | 3 (21.4%) |
Occupancy by Age of Householder in Wing
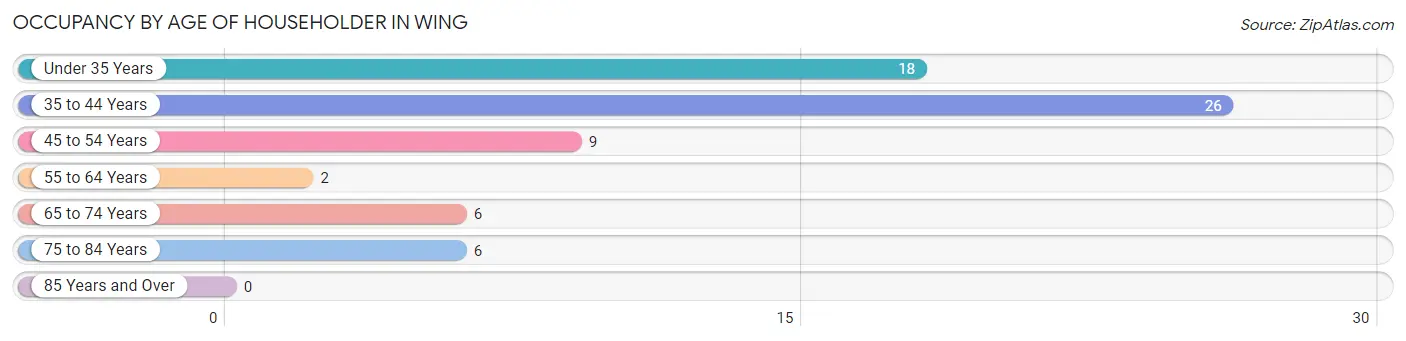
| Age Bracket | # Households | % Households |
| Under 35 Years | 18 | 26.9% |
| 35 to 44 Years | 26 | 38.8% |
| 45 to 54 Years | 9 | 13.4% |
| 55 to 64 Years | 2 | 3.0% |
| 65 to 74 Years | 6 | 9.0% |
| 75 to 84 Years | 6 | 9.0% |
| 85 Years and Over | 0 | 0.0% |
| Total | 67 | 100.0% |
Housing Finances in Wing
Median Income by Occupancy in Wing
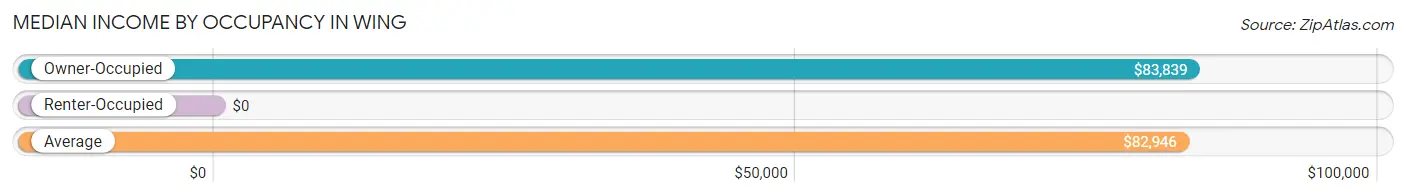
| Occupancy Type | # Households | Median Income |
| Owner-Occupied | 57 (85.1%) | $83,839 |
| Renter-Occupied | 10 (14.9%) | $0 |
| Average | 67 (100.0%) | $82,946 |
Occupancy by Householder Income Bracket in Wing
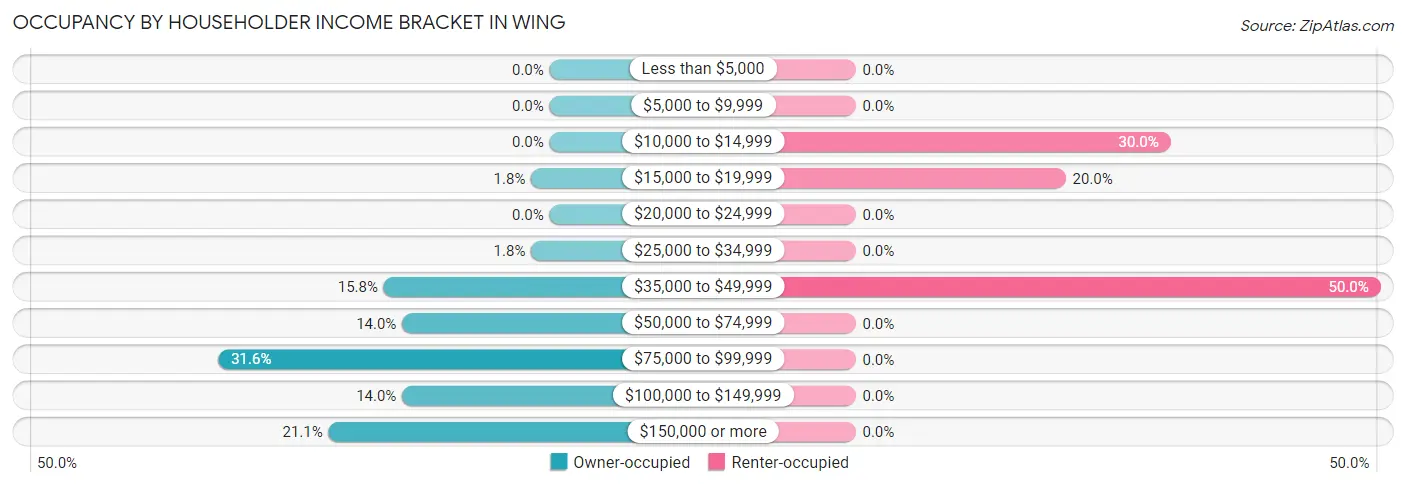
| Income Bracket | Owner-occupied | Renter-occupied |
| Less than $5,000 | 0 (0.0%) | 0 (0.0%) |
| $5,000 to $9,999 | 0 (0.0%) | 0 (0.0%) |
| $10,000 to $14,999 | 0 (0.0%) | 3 (30.0%) |
| $15,000 to $19,999 | 1 (1.8%) | 2 (20.0%) |
| $20,000 to $24,999 | 0 (0.0%) | 0 (0.0%) |
| $25,000 to $34,999 | 1 (1.8%) | 0 (0.0%) |
| $35,000 to $49,999 | 9 (15.8%) | 5 (50.0%) |
| $50,000 to $74,999 | 8 (14.0%) | 0 (0.0%) |
| $75,000 to $99,999 | 18 (31.6%) | 0 (0.0%) |
| $100,000 to $149,999 | 8 (14.0%) | 0 (0.0%) |
| $150,000 or more | 12 (21.0%) | 0 (0.0%) |
| Total | 57 (100.0%) | 10 (100.0%) |
Monthly Housing Cost Tiers in Wing
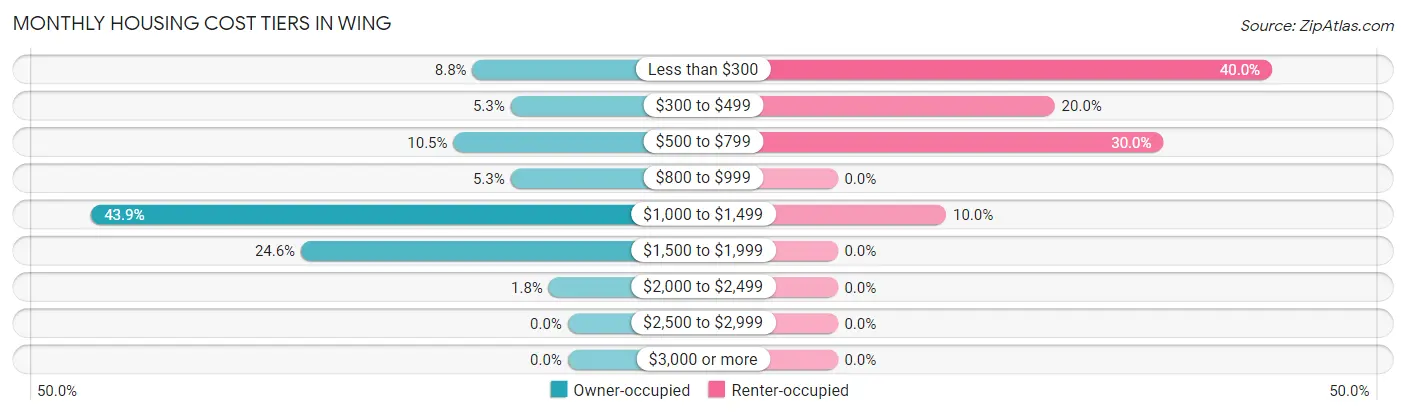
| Monthly Cost | Owner-occupied | Renter-occupied |
| Less than $300 | 5 (8.8%) | 4 (40.0%) |
| $300 to $499 | 3 (5.3%) | 2 (20.0%) |
| $500 to $799 | 6 (10.5%) | 3 (30.0%) |
| $800 to $999 | 3 (5.3%) | 0 (0.0%) |
| $1,000 to $1,499 | 25 (43.9%) | 1 (10.0%) |
| $1,500 to $1,999 | 14 (24.6%) | 0 (0.0%) |
| $2,000 to $2,499 | 1 (1.8%) | 0 (0.0%) |
| $2,500 to $2,999 | 0 (0.0%) | 0 (0.0%) |
| $3,000 or more | 0 (0.0%) | 0 (0.0%) |
| Total | 57 (100.0%) | 10 (100.0%) |
Physical Housing Characteristics in Wing
Housing Structures in Wing
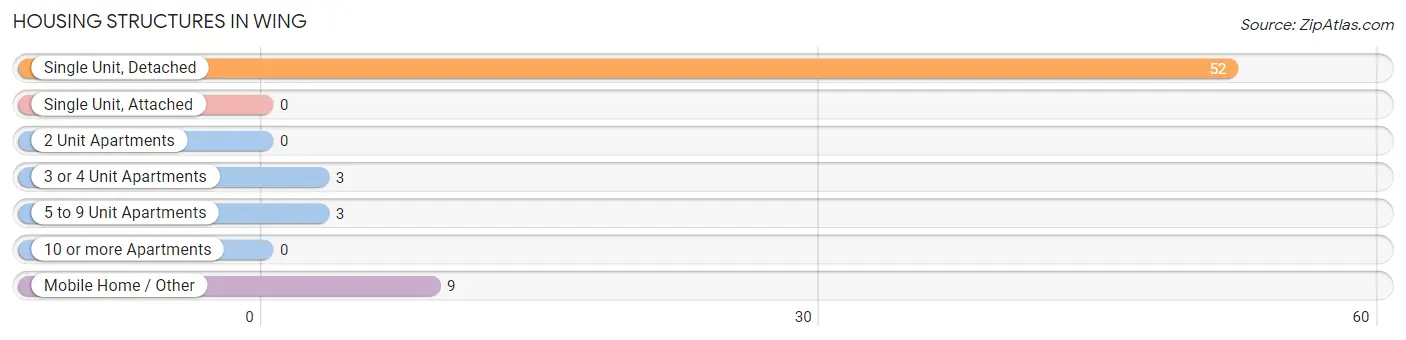
| Structure Type | # Housing Units | % Housing Units |
| Single Unit, Detached | 52 | 77.6% |
| Single Unit, Attached | 0 | 0.0% |
| 2 Unit Apartments | 0 | 0.0% |
| 3 or 4 Unit Apartments | 3 | 4.5% |
| 5 to 9 Unit Apartments | 3 | 4.5% |
| 10 or more Apartments | 0 | 0.0% |
| Mobile Home / Other | 9 | 13.4% |
| Total | 67 | 100.0% |
Housing Structures by Occupancy in Wing
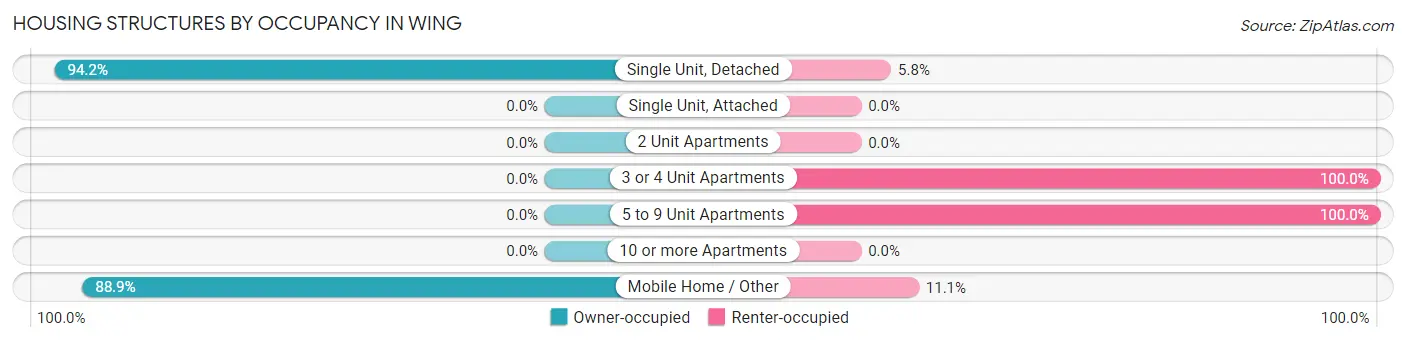
| Structure Type | Owner-occupied | Renter-occupied |
| Single Unit, Detached | 49 (94.2%) | 3 (5.8%) |
| Single Unit, Attached | 0 (0.0%) | 0 (0.0%) |
| 2 Unit Apartments | 0 (0.0%) | 0 (0.0%) |
| 3 or 4 Unit Apartments | 0 (0.0%) | 3 (100.0%) |
| 5 to 9 Unit Apartments | 0 (0.0%) | 3 (100.0%) |
| 10 or more Apartments | 0 (0.0%) | 0 (0.0%) |
| Mobile Home / Other | 8 (88.9%) | 1 (11.1%) |
| Total | 57 (85.1%) | 10 (14.9%) |
Housing Structures by Number of Rooms in Wing
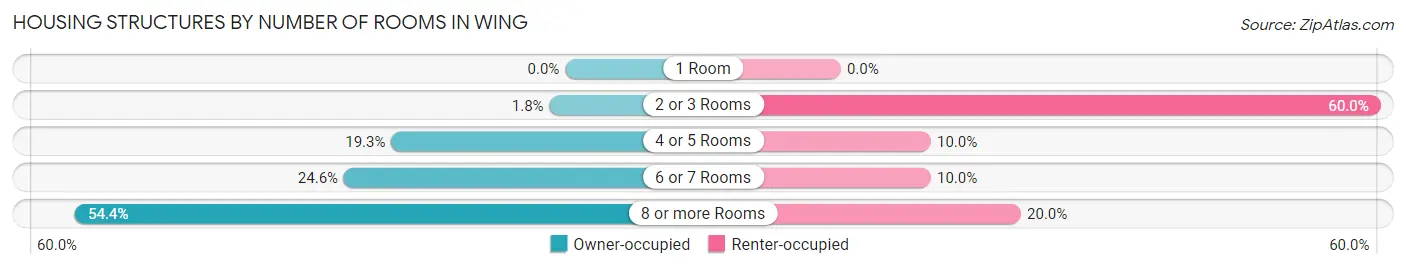
| Number of Rooms | Owner-occupied | Renter-occupied |
| 1 Room | 0 (0.0%) | 0 (0.0%) |
| 2 or 3 Rooms | 1 (1.8%) | 6 (60.0%) |
| 4 or 5 Rooms | 11 (19.3%) | 1 (10.0%) |
| 6 or 7 Rooms | 14 (24.6%) | 1 (10.0%) |
| 8 or more Rooms | 31 (54.4%) | 2 (20.0%) |
| Total | 57 (100.0%) | 10 (100.0%) |
Housing Structure by Heating Type in Wing
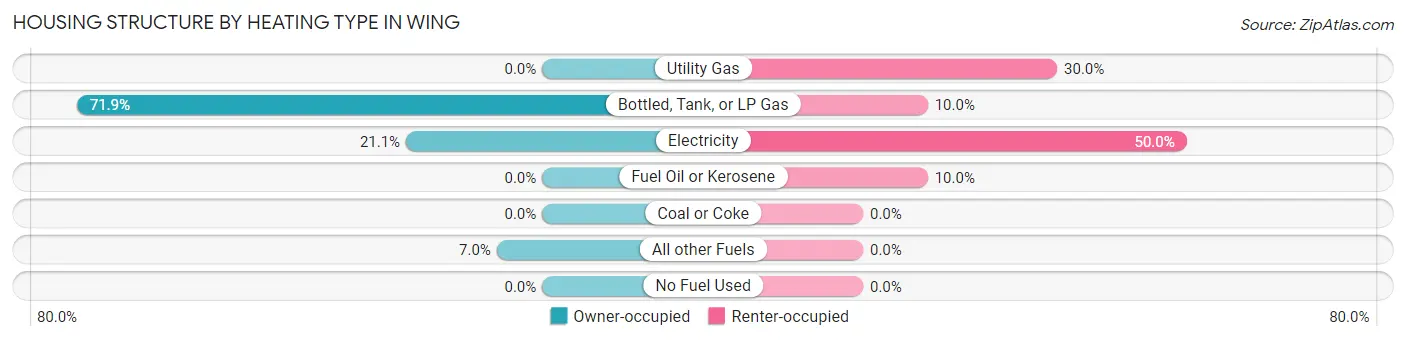
| Heating Type | Owner-occupied | Renter-occupied |
| Utility Gas | 0 (0.0%) | 3 (30.0%) |
| Bottled, Tank, or LP Gas | 41 (71.9%) | 1 (10.0%) |
| Electricity | 12 (21.0%) | 5 (50.0%) |
| Fuel Oil or Kerosene | 0 (0.0%) | 1 (10.0%) |
| Coal or Coke | 0 (0.0%) | 0 (0.0%) |
| All other Fuels | 4 (7.0%) | 0 (0.0%) |
| No Fuel Used | 0 (0.0%) | 0 (0.0%) |
| Total | 57 (100.0%) | 10 (100.0%) |
Household Vehicle Usage in Wing
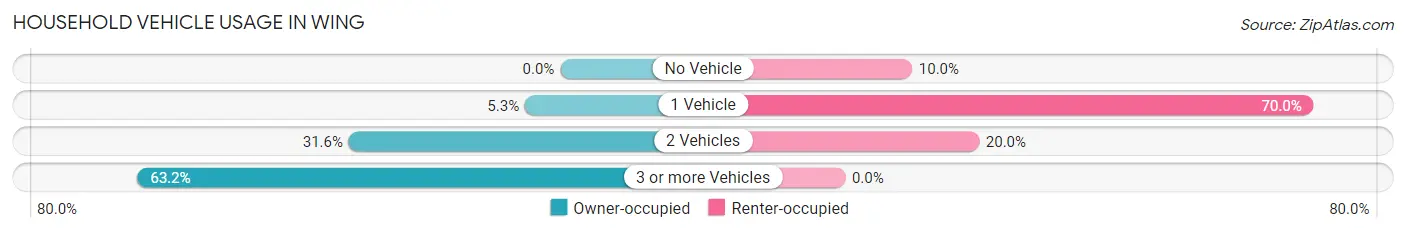
| Vehicles per Household | Owner-occupied | Renter-occupied |
| No Vehicle | 0 (0.0%) | 1 (10.0%) |
| 1 Vehicle | 3 (5.3%) | 7 (70.0%) |
| 2 Vehicles | 18 (31.6%) | 2 (20.0%) |
| 3 or more Vehicles | 36 (63.2%) | 0 (0.0%) |
| Total | 57 (100.0%) | 10 (100.0%) |
Real Estate & Mortgages in Wing
Real Estate and Mortgage Overview in Wing
| Characteristic | Without Mortgage | With Mortgage |
| Housing Units | 14 | 43 |
| Median Property Value | $70,000 | $76,400 |
| Median Household Income | - | - |
| Monthly Housing Costs | $450 | $0 |
| Real Estate Taxes | $460 | $4 |
Property Value by Mortgage Status in Wing
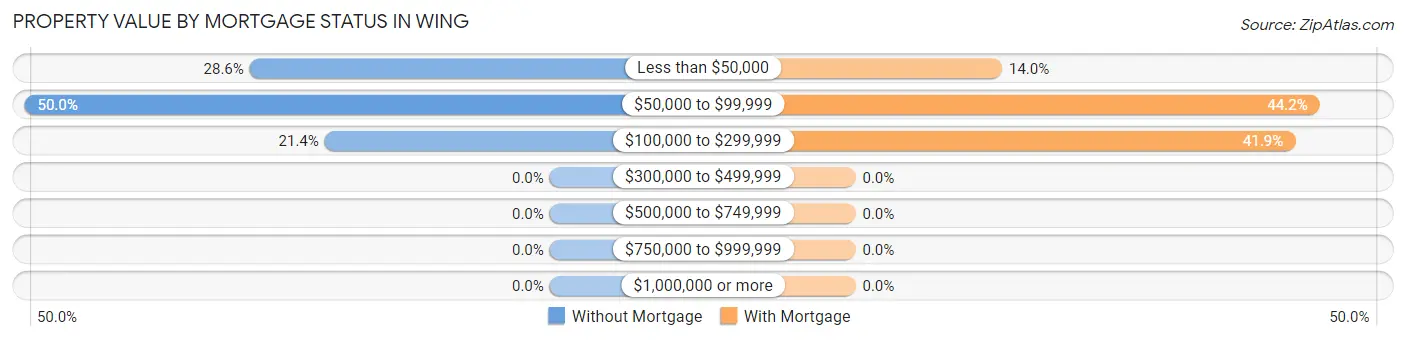
| Property Value | Without Mortgage | With Mortgage |
| Less than $50,000 | 4 (28.6%) | 6 (14.0%) |
| $50,000 to $99,999 | 7 (50.0%) | 19 (44.2%) |
| $100,000 to $299,999 | 3 (21.4%) | 18 (41.9%) |
| $300,000 to $499,999 | 0 (0.0%) | 0 (0.0%) |
| $500,000 to $749,999 | 0 (0.0%) | 0 (0.0%) |
| $750,000 to $999,999 | 0 (0.0%) | 0 (0.0%) |
| $1,000,000 or more | 0 (0.0%) | 0 (0.0%) |
| Total | 14 (100.0%) | 43 (100.0%) |
Household Income by Mortgage Status in Wing
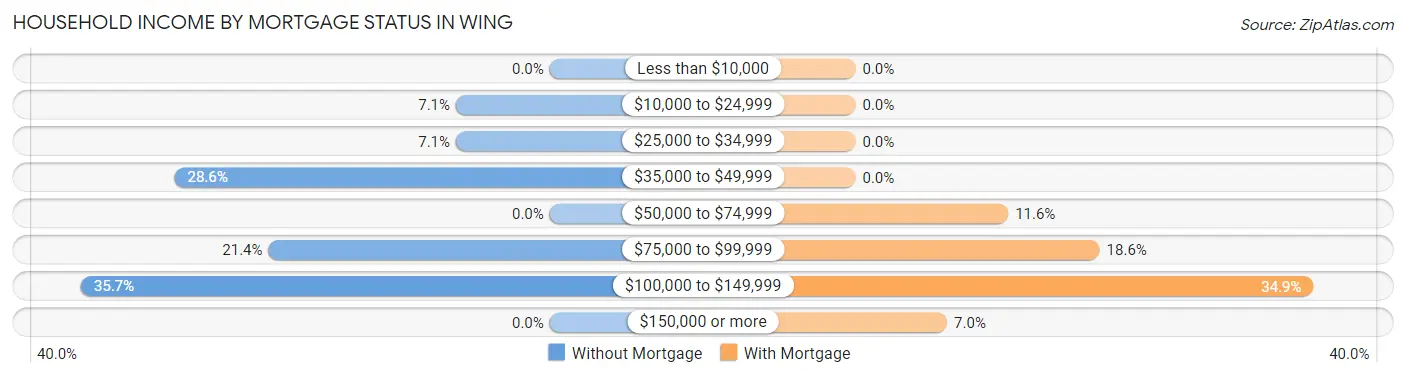
| Household Income | Without Mortgage | With Mortgage |
| Less than $10,000 | 0 (0.0%) | 0 (0.0%) |
| $10,000 to $24,999 | 1 (7.1%) | 0 (0.0%) |
| $25,000 to $34,999 | 1 (7.1%) | 0 (0.0%) |
| $35,000 to $49,999 | 4 (28.6%) | 0 (0.0%) |
| $50,000 to $74,999 | 0 (0.0%) | 5 (11.6%) |
| $75,000 to $99,999 | 3 (21.4%) | 8 (18.6%) |
| $100,000 to $149,999 | 5 (35.7%) | 15 (34.9%) |
| $150,000 or more | 0 (0.0%) | 3 (7.0%) |
| Total | 14 (100.0%) | 43 (100.0%) |
Property Value to Household Income Ratio in Wing
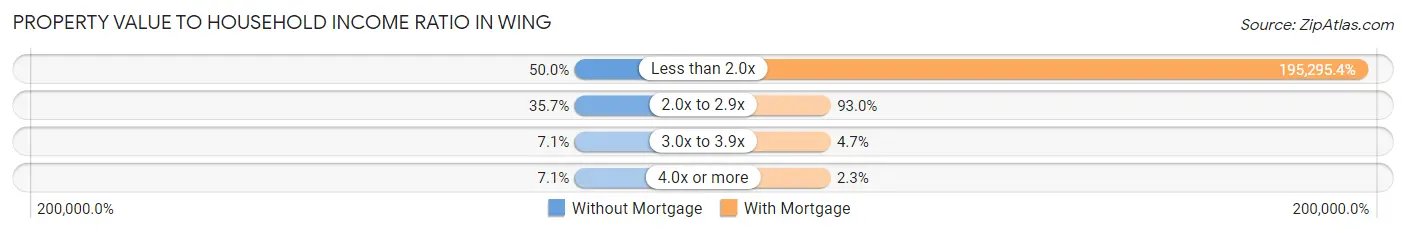
| Value-to-Income Ratio | Without Mortgage | With Mortgage |
| Less than 2.0x | 7 (50.0%) | 83,977 (195,295.4%) |
| 2.0x to 2.9x | 5 (35.7%) | 40 (93.0%) |
| 3.0x to 3.9x | 1 (7.1%) | 2 (4.6%) |
| 4.0x or more | 1 (7.1%) | 1 (2.3%) |
| Total | 14 (100.0%) | 43 (100.0%) |
Real Estate Taxes by Mortgage Status in Wing
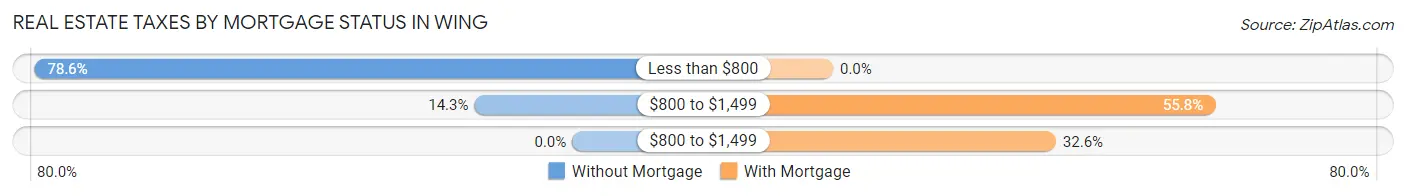
| Property Taxes | Without Mortgage | With Mortgage |
| Less than $800 | 11 (78.6%) | 0 (0.0%) |
| $800 to $1,499 | 2 (14.3%) | 24 (55.8%) |
| $800 to $1,499 | 0 (0.0%) | 14 (32.6%) |
| Total | 14 (100.0%) | 43 (100.0%) |
Health & Disability in Wing
Health Insurance Coverage by Age in Wing
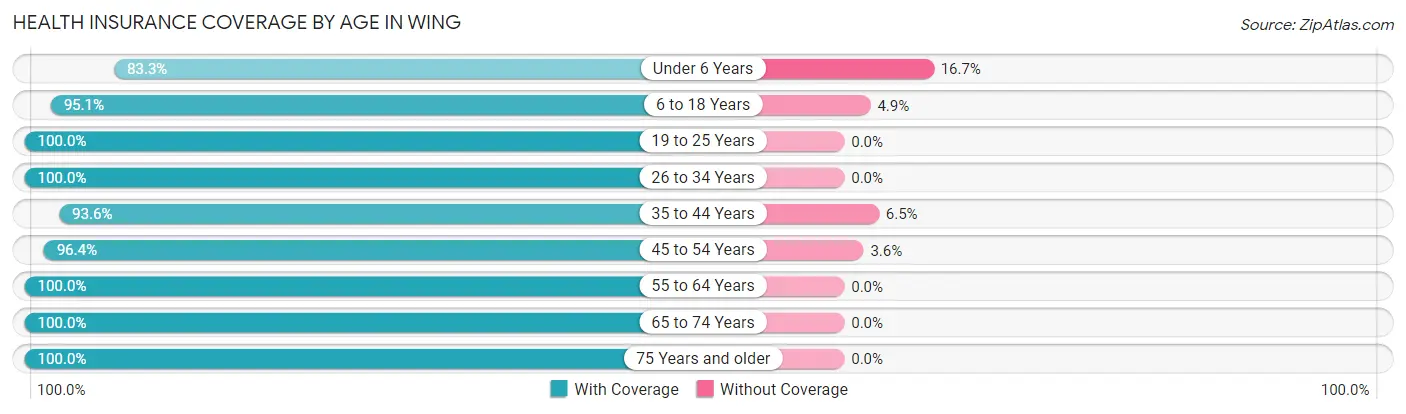
| Age Bracket | With Coverage | Without Coverage |
| Under 6 Years | 10 (83.3%) | 2 (16.7%) |
| 6 to 18 Years | 78 (95.1%) | 4 (4.9%) |
| 19 to 25 Years | 4 (100.0%) | 0 (0.0%) |
| 26 to 34 Years | 44 (100.0%) | 0 (0.0%) |
| 35 to 44 Years | 29 (93.5%) | 2 (6.5%) |
| 45 to 54 Years | 27 (96.4%) | 1 (3.6%) |
| 55 to 64 Years | 4 (100.0%) | 0 (0.0%) |
| 65 to 74 Years | 8 (100.0%) | 0 (0.0%) |
| 75 Years and older | 8 (100.0%) | 0 (0.0%) |
| Total | 212 (95.9%) | 9 (4.1%) |
Health Insurance Coverage by Citizenship Status in Wing
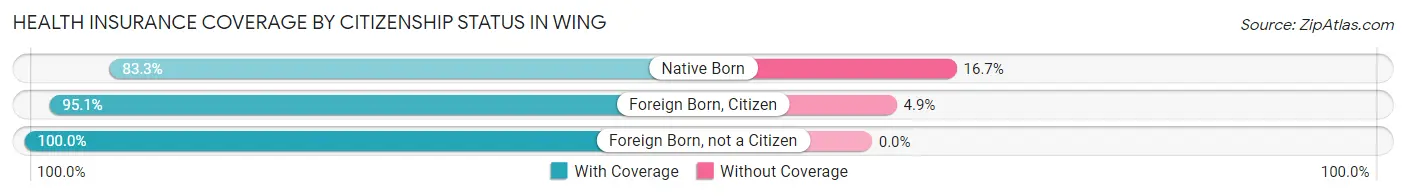
| Citizenship Status | With Coverage | Without Coverage |
| Native Born | 10 (83.3%) | 2 (16.7%) |
| Foreign Born, Citizen | 78 (95.1%) | 4 (4.9%) |
| Foreign Born, not a Citizen | 4 (100.0%) | 0 (0.0%) |
Health Insurance Coverage by Household Income in Wing
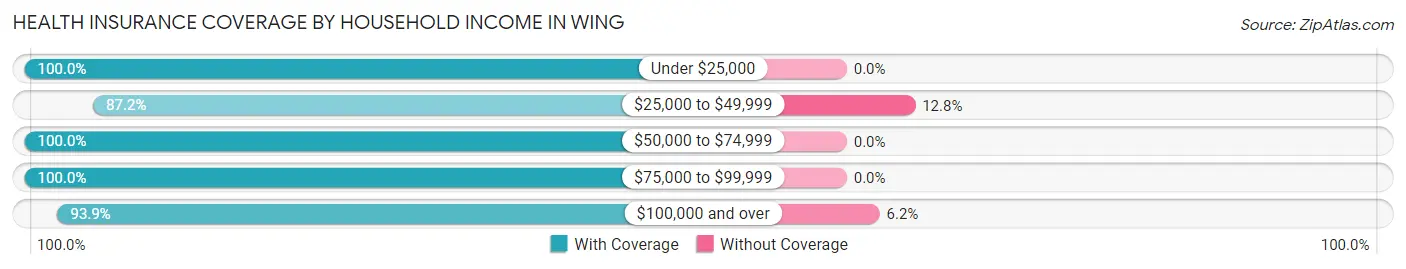
| Household Income | With Coverage | Without Coverage |
| Under $25,000 | 8 (100.0%) | 0 (0.0%) |
| $25,000 to $49,999 | 34 (87.2%) | 5 (12.8%) |
| $50,000 to $74,999 | 51 (100.0%) | 0 (0.0%) |
| $75,000 to $99,999 | 58 (100.0%) | 0 (0.0%) |
| $100,000 and over | 61 (93.9%) | 4 (6.1%) |
Public vs Private Health Insurance Coverage by Age in Wing
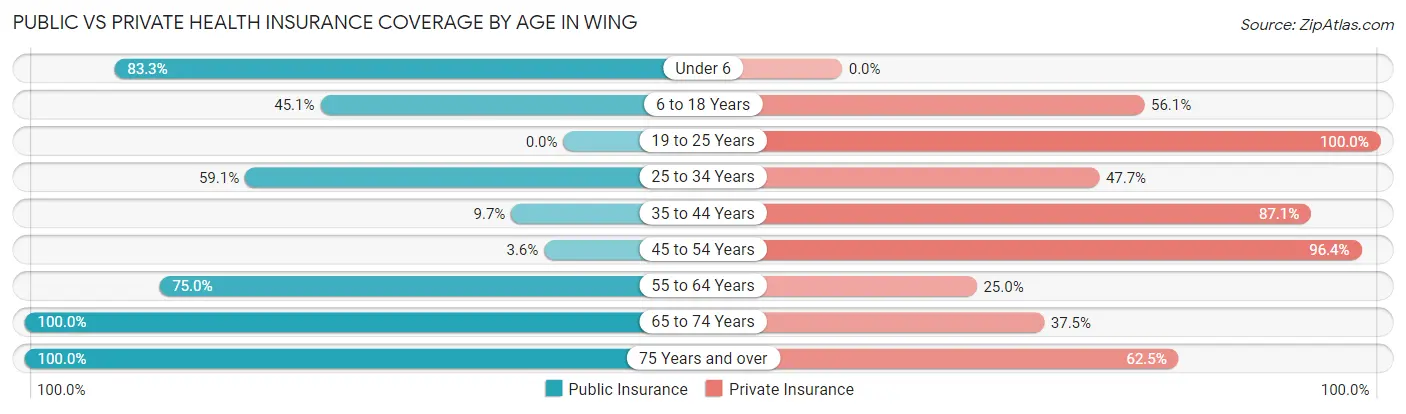
| Age Bracket | Public Insurance | Private Insurance |
| Under 6 | 10 (83.3%) | 0 (0.0%) |
| 6 to 18 Years | 37 (45.1%) | 46 (56.1%) |
| 19 to 25 Years | 0 (0.0%) | 4 (100.0%) |
| 25 to 34 Years | 26 (59.1%) | 21 (47.7%) |
| 35 to 44 Years | 3 (9.7%) | 27 (87.1%) |
| 45 to 54 Years | 1 (3.6%) | 27 (96.4%) |
| 55 to 64 Years | 3 (75.0%) | 1 (25.0%) |
| 65 to 74 Years | 8 (100.0%) | 3 (37.5%) |
| 75 Years and over | 8 (100.0%) | 5 (62.5%) |
| Total | 96 (43.4%) | 134 (60.6%) |
Disability Status by Sex by Age in Wing
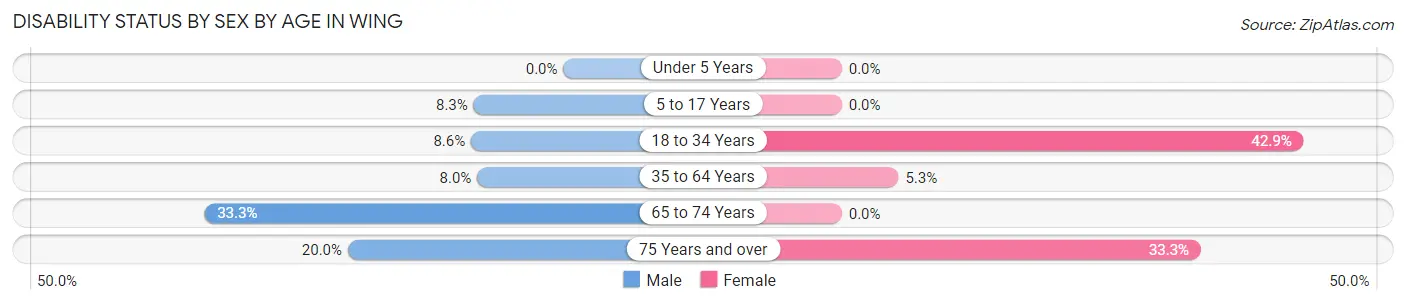
| Age Bracket | Male | Female |
| Under 5 Years | 0 (0.0%) | 0 (0.0%) |
| 5 to 17 Years | 3 (8.3%) | 0 (0.0%) |
| 18 to 34 Years | 3 (8.6%) | 6 (42.9%) |
| 35 to 64 Years | 2 (8.0%) | 2 (5.3%) |
| 65 to 74 Years | 1 (33.3%) | 0 (0.0%) |
| 75 Years and over | 1 (20.0%) | 1 (33.3%) |
Disability Class by Sex by Age in Wing
Disability Class: Hearing Difficulty
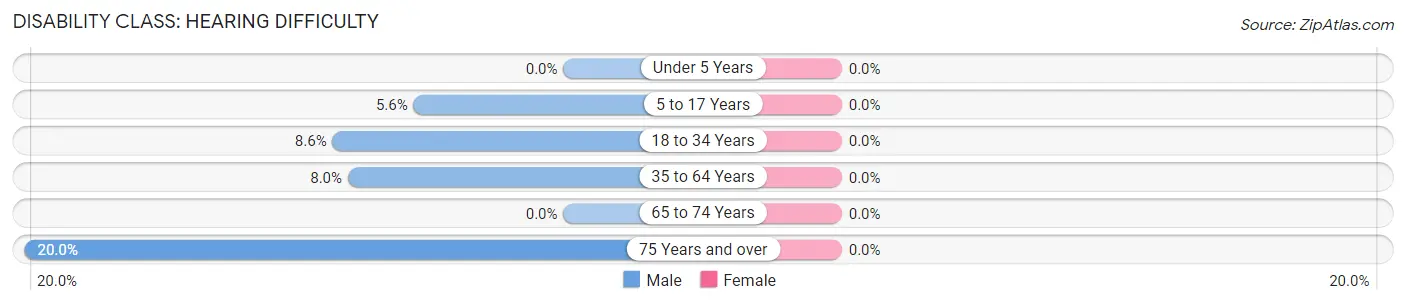
| Age Bracket | Male | Female |
| Under 5 Years | 0 (0.0%) | 0 (0.0%) |
| 5 to 17 Years | 2 (5.6%) | 0 (0.0%) |
| 18 to 34 Years | 3 (8.6%) | 0 (0.0%) |
| 35 to 64 Years | 2 (8.0%) | 0 (0.0%) |
| 65 to 74 Years | 0 (0.0%) | 0 (0.0%) |
| 75 Years and over | 1 (20.0%) | 0 (0.0%) |
Disability Class: Vision Difficulty
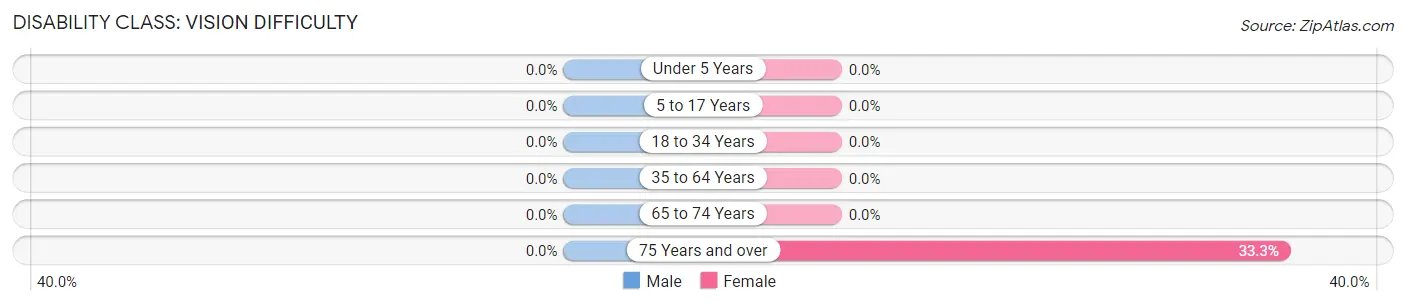
| Age Bracket | Male | Female |
| Under 5 Years | 0 (0.0%) | 0 (0.0%) |
| 5 to 17 Years | 0 (0.0%) | 0 (0.0%) |
| 18 to 34 Years | 0 (0.0%) | 0 (0.0%) |
| 35 to 64 Years | 0 (0.0%) | 0 (0.0%) |
| 65 to 74 Years | 0 (0.0%) | 0 (0.0%) |
| 75 Years and over | 0 (0.0%) | 1 (33.3%) |
Disability Class: Cognitive Difficulty
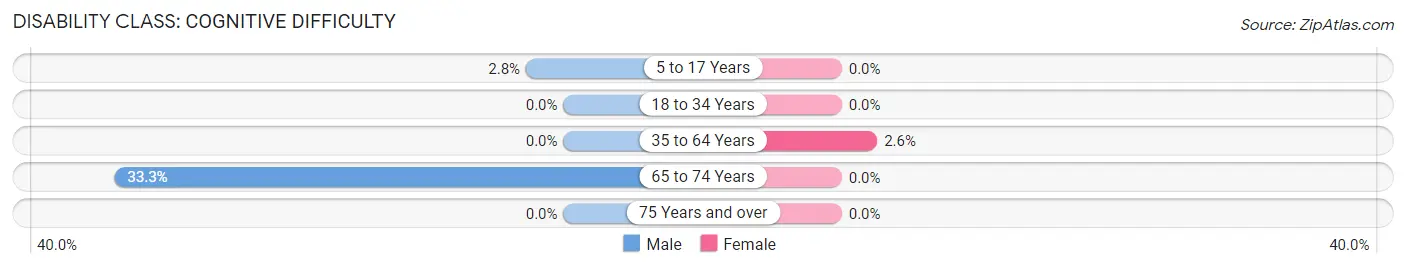
| Age Bracket | Male | Female |
| 5 to 17 Years | 1 (2.8%) | 0 (0.0%) |
| 18 to 34 Years | 0 (0.0%) | 0 (0.0%) |
| 35 to 64 Years | 0 (0.0%) | 1 (2.6%) |
| 65 to 74 Years | 1 (33.3%) | 0 (0.0%) |
| 75 Years and over | 0 (0.0%) | 0 (0.0%) |
Disability Class: Ambulatory Difficulty
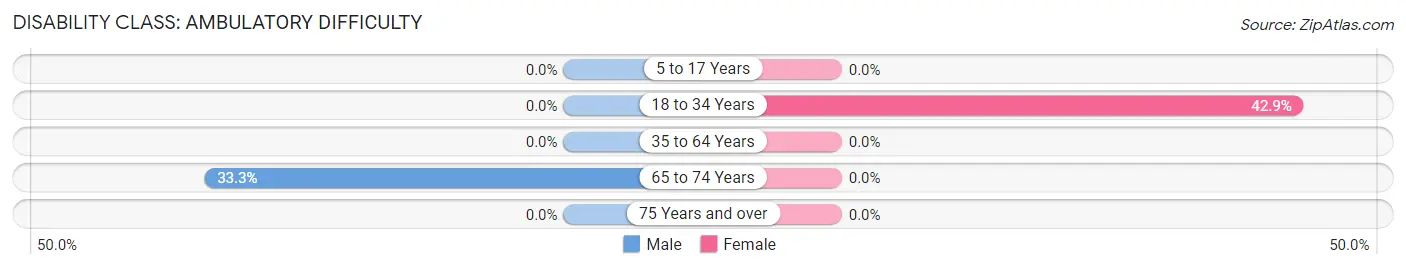
| Age Bracket | Male | Female |
| 5 to 17 Years | 0 (0.0%) | 0 (0.0%) |
| 18 to 34 Years | 0 (0.0%) | 6 (42.9%) |
| 35 to 64 Years | 0 (0.0%) | 0 (0.0%) |
| 65 to 74 Years | 1 (33.3%) | 0 (0.0%) |
| 75 Years and over | 0 (0.0%) | 0 (0.0%) |
Disability Class: Self-Care Difficulty

| Age Bracket | Male | Female |
| 5 to 17 Years | 0 (0.0%) | 0 (0.0%) |
| 18 to 34 Years | 0 (0.0%) | 0 (0.0%) |
| 35 to 64 Years | 0 (0.0%) | 1 (2.6%) |
| 65 to 74 Years | 1 (33.3%) | 0 (0.0%) |
| 75 Years and over | 0 (0.0%) | 0 (0.0%) |
Technology Access in Wing
Computing Device Access in Wing
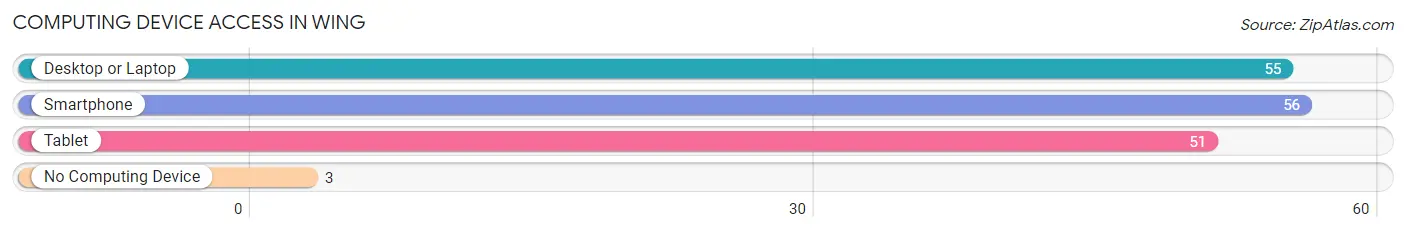
| Device Type | # Households | % Households |
| Desktop or Laptop | 55 | 82.1% |
| Smartphone | 56 | 83.6% |
| Tablet | 51 | 76.1% |
| No Computing Device | 3 | 4.5% |
| Total | 67 | 100.0% |
Internet Access in Wing
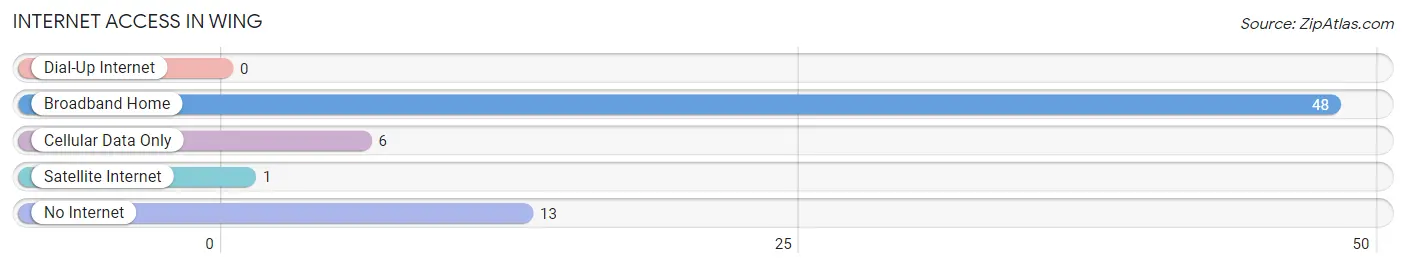
| Internet Type | # Households | % Households |
| Dial-Up Internet | 0 | 0.0% |
| Broadband Home | 48 | 71.6% |
| Cellular Data Only | 6 | 9.0% |
| Satellite Internet | 1 | 1.5% |
| No Internet | 13 | 19.4% |
| Total | 67 | 100.0% |
Wing Summary
North Dakota is a state located in the Midwestern and Great Plains regions of the United States. It is the 19th largest state by area, and the third least populous state in the country. North Dakota is bordered by the Canadian provinces of Saskatchewan and Manitoba to the north, Minnesota to the east, South Dakota to the south, and Montana to the west. The state capital is Bismarck, and the largest city is Fargo.
History
The area that is now North Dakota has been inhabited for thousands of years by various Native American tribes. The first Europeans to explore the area were French fur traders, who arrived in the late 17th century. The area was part of the Louisiana Purchase in 1803, and was organized as part of the Dakota Territory in 1861. North Dakota became a state in 1889, along with South Dakota.
Geography
North Dakota is located in the northern Great Plains region of the United States. It is bordered by the Canadian provinces of Saskatchewan and Manitoba to the north, Minnesota to the east, South Dakota to the south, and Montana to the west. The state has an area of 70,700 square miles, making it the 19th largest state in the country.
The landscape of North Dakota is mostly flat, with rolling hills in the east and west. The state is divided into three distinct geographic regions: the Red River Valley in the east, the Missouri Plateau in the west, and the Drift Prairie in the central part of the state. The Red River Valley is a flat, fertile region that is home to the Red River of the North, which forms the border between North Dakota and Minnesota. The Missouri Plateau is a hilly region that is home to the Missouri River, which forms the border between North Dakota and Montana. The Drift Prairie is a flat, grassy region that is home to the Missouri River and its tributaries.
Economy
North Dakota has a diversified economy that is largely based on agriculture, energy production, and services. Agriculture is the largest sector of the state’s economy, accounting for about one-third of the state’s total economic output. The state is a major producer of wheat, barley, oats, corn, and other grains. Livestock production is also important, with cattle, hogs, and sheep being the most important species.
Energy production is the second largest sector of the state’s economy, accounting for about one-quarter of the state’s total economic output. North Dakota is the second largest producer of crude oil in the United States, and is also a major producer of natural gas, coal, and renewable energy sources such as wind and solar.
The services sector is the third largest sector of the state’s economy, accounting for about one-fifth of the state’s total economic output. This sector includes a variety of industries, such as finance, insurance, real estate, health care, and retail trade.
Demographics
As of the 2020 census, North Dakota had a population of 762,062. The state has a population density of 10.7 people per square mile, making it the third least populous state in the country. The racial makeup of the state is 87.2% White, 5.3% Native American, 2.2% Black, 1.7% Asian, and 3.6% from other races.
The largest ancestry groups in North Dakota are German (37.2%), Norwegian (17.2%), Irish (13.2%), and English (10.2%). The state is also home to a large population of Native Americans, with the largest tribes being the Sioux, Mandan, and Hidatsa.
The median household income in North Dakota is $58,945, and the median home value is $179,400. The state has a poverty rate of 11.2%, and the unemployment rate is 3.2%. The largest cities in North Dakota are Fargo, Bismarck, Grand Forks, Minot, and West Fargo.
Common Questions
What is Per Capita Income in Wing?
Per Capita income in Wing is $27,602.
What is the Median Family Income in Wing?
Median Family Income in Wing is $84,091.
What is the Median Household income in Wing?
Median Household Income in Wing is $82,946.
What is Income or Wage Gap in Wing?
Income or Wage Gap in Wing is 60.5%.
Women in Wing earn 39.5 cents for every dollar earned by a man.
What is Inequality or Gini Index in Wing?
Inequality or Gini Index in Wing is 0.33.
What is the Total Population of Wing?
Total Population of Wing is 221.
What is the Total Male Population of Wing?
Total Male Population of Wing is 110.
What is the Total Female Population of Wing?
Total Female Population of Wing is 111.
What is the Ratio of Males per 100 Females in Wing?
There are 99.10 Males per 100 Females in Wing.
What is the Ratio of Females per 100 Males in Wing?
There are 100.91 Females per 100 Males in Wing.
What is the Median Population Age in Wing?
Median Population Age in Wing is 30.9 Years.
What is the Average Family Size in Wing
Average Family Size in Wing is 3.9 People.
What is the Average Household Size in Wing
Average Household Size in Wing is 3.3 People.
How Large is the Labor Force in Wing?
There are 116 People in the Labor Forcein in Wing.
What is the Percentage of People in the Labor Force in Wing?
87.9% of People are in the Labor Force in Wing.