Mantador, ND Map & Demographics
Mantador Map
Mantador Overview
$41,621
PER CAPITA INCOME
$51,667
AVG FAMILY INCOME
$48,750
AVG HOUSEHOLD INCOME
0.31
INEQUALITY / GINI INDEX
34
TOTAL POPULATION
13
MALE POPULATION
21
FEMALE POPULATION
61.90
MALES / 100 FEMALES
161.54
FEMALES / 100 MALES
42.6
MEDIAN AGE
2.2
AVG FAMILY SIZE
1.4
AVG HOUSEHOLD SIZE
22
LABOR FORCE [ PEOPLE ]
84.6%
PERCENT IN LABOR FORCE
Mantador Zip Codes
Mantador Area Codes
Income in Mantador
Income Overview in Mantador
Per Capita Income in Mantador is $41,621, while median incomes of families and households are $51,667 and $48,750 respectively.
| Characteristic | Number | Measure |
| Per Capita Income | 34 | $41,621 |
| Median Family Income | 8 | $51,667 |
| Mean Family Income | 8 | $86,150 |
| Median Household Income | 24 | $48,750 |
| Mean Household Income | 24 | $59,458 |
| Income Deficit | 8 | $0 |
| Wage / Income Gap (%) | 34 | 0.00% |
| Wage / Income Gap ($) | 34 | 100.00¢ per $1 |
| Gini / Inequality Index | 34 | 0.31 |
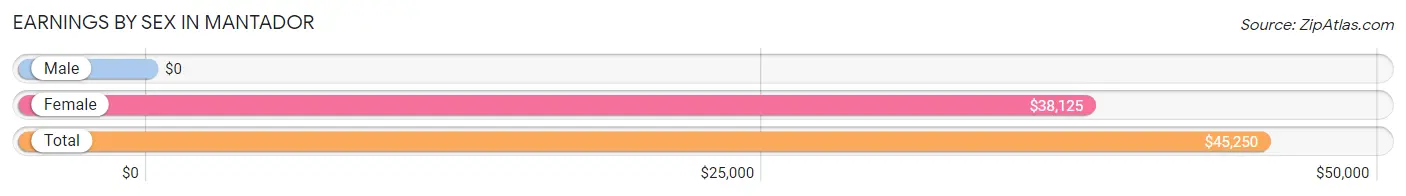
Earnings by Sex in Mantador
| Sex | Number | Average Earnings |
| Male | 9 (39.1%) | $0 |
| Female | 14 (60.9%) | $38,125 |
| Total | 23 (100.0%) | $45,250 |
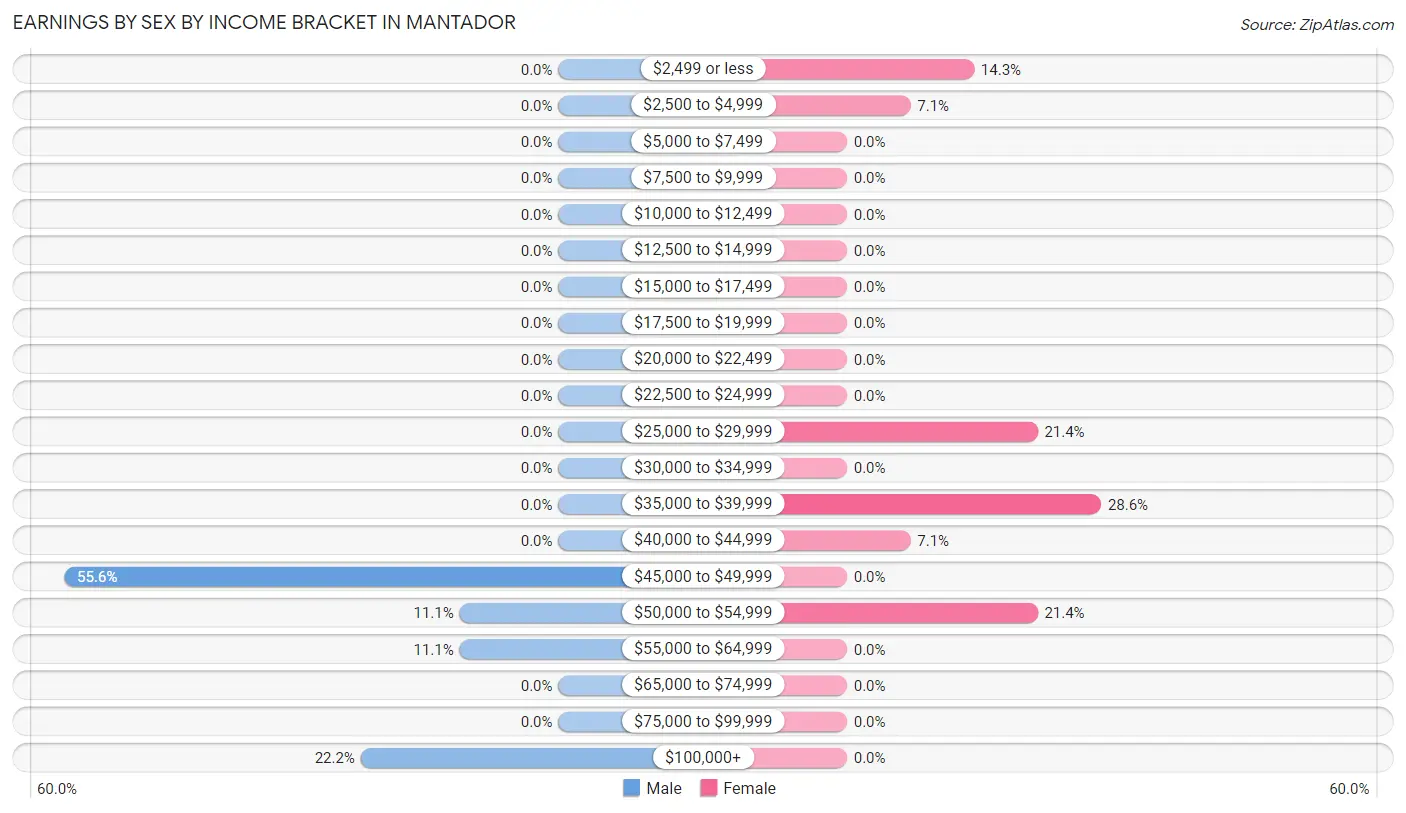
Earnings by Sex by Income Bracket in Mantador
The most common earnings brackets in Mantador are $45,000 to $49,999 for men (5 | 55.6%) and $35,000 to $39,999 for women (4 | 28.6%).
| Income | Male | Female |
| $2,499 or less | 0 (0.0%) | 2 (14.3%) |
| $2,500 to $4,999 | 0 (0.0%) | 1 (7.1%) |
| $5,000 to $7,499 | 0 (0.0%) | 0 (0.0%) |
| $7,500 to $9,999 | 0 (0.0%) | 0 (0.0%) |
| $10,000 to $12,499 | 0 (0.0%) | 0 (0.0%) |
| $12,500 to $14,999 | 0 (0.0%) | 0 (0.0%) |
| $15,000 to $17,499 | 0 (0.0%) | 0 (0.0%) |
| $17,500 to $19,999 | 0 (0.0%) | 0 (0.0%) |
| $20,000 to $22,499 | 0 (0.0%) | 0 (0.0%) |
| $22,500 to $24,999 | 0 (0.0%) | 0 (0.0%) |
| $25,000 to $29,999 | 0 (0.0%) | 3 (21.4%) |
| $30,000 to $34,999 | 0 (0.0%) | 0 (0.0%) |
| $35,000 to $39,999 | 0 (0.0%) | 4 (28.6%) |
| $40,000 to $44,999 | 0 (0.0%) | 1 (7.1%) |
| $45,000 to $49,999 | 5 (55.6%) | 0 (0.0%) |
| $50,000 to $54,999 | 1 (11.1%) | 3 (21.4%) |
| $55,000 to $64,999 | 1 (11.1%) | 0 (0.0%) |
| $65,000 to $74,999 | 0 (0.0%) | 0 (0.0%) |
| $75,000 to $99,999 | 0 (0.0%) | 0 (0.0%) |
| $100,000+ | 2 (22.2%) | 0 (0.0%) |
| Total | 9 (100.0%) | 14 (100.0%) |
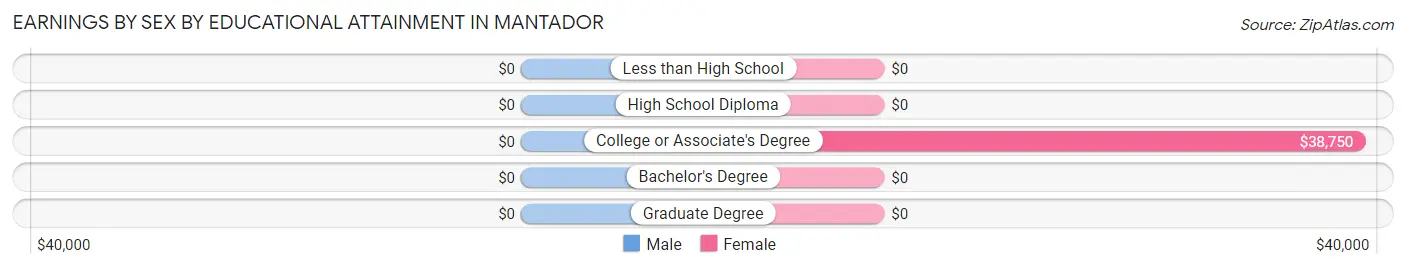
Earnings by Sex by Educational Attainment in Mantador
| Educational Attainment | Male Income | Female Income |
| Less than High School | - | - |
| High School Diploma | - | - |
| College or Associate's Degree | - | - |
| Bachelor's Degree | - | - |
| Graduate Degree | - | - |
| Total | - | - |
Family Income in Mantador
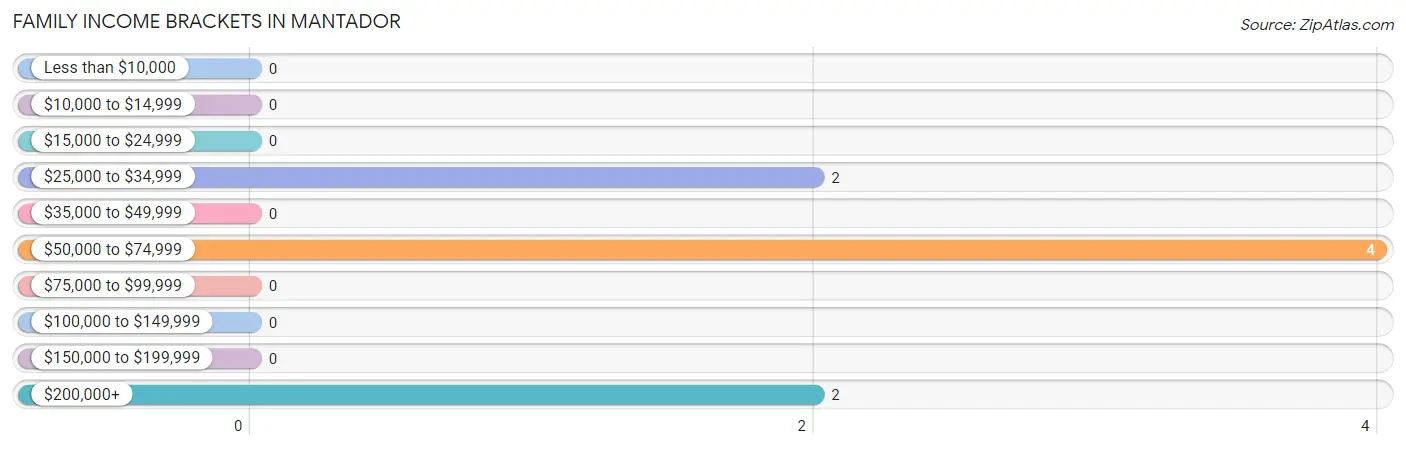
Family Income Brackets in Mantador
According to the Mantador family income data, there are 4 families falling into the $50,000 to $74,999 income range, which is the most common income bracket and makes up 50.0% of all families.
| Income Bracket | # Families | % Families |
| Less than $10,000 | 0 | 0.0% |
| $10,000 to $14,999 | 0 | 0.0% |
| $15,000 to $24,999 | 0 | 0.0% |
| $25,000 to $34,999 | 2 | 25.0% |
| $35,000 to $49,999 | 0 | 0.0% |
| $50,000 to $74,999 | 4 | 50.0% |
| $75,000 to $99,999 | 0 | 0.0% |
| $100,000 to $149,999 | 0 | 0.0% |
| $150,000 to $199,999 | 0 | 0.0% |
| $200,000+ | 2 | 25.0% |
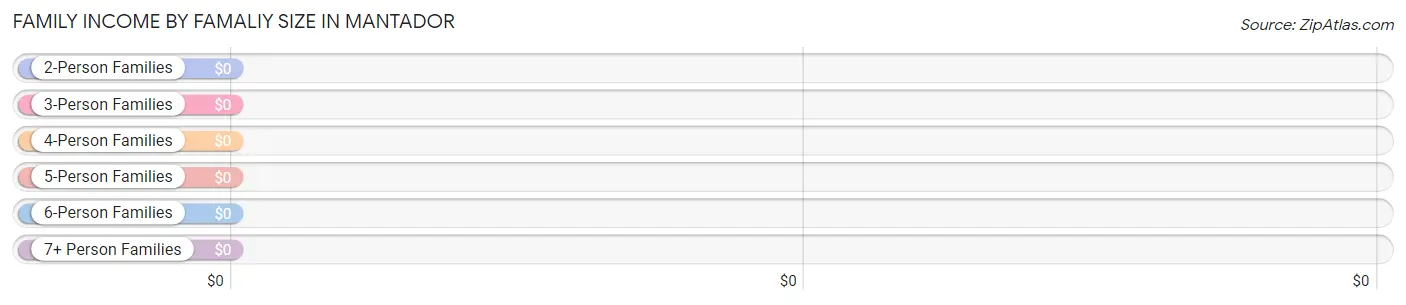
Family Income by Famaliy Size in Mantador
| Income Bracket | # Families | Median Income |
| 2-Person Families | 5 (62.5%) | $0 |
| 3-Person Families | 3 (37.5%) | $0 |
| 4-Person Families | 0 (0.0%) | $0 |
| 5-Person Families | 0 (0.0%) | $0 |
| 6-Person Families | 0 (0.0%) | $0 |
| 7+ Person Families | 0 (0.0%) | $0 |
| Total | 8 (100.0%) | $51,667 |
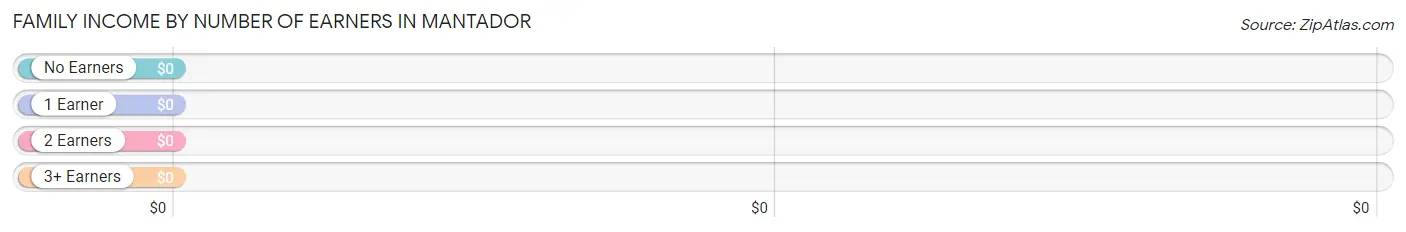
Family Income by Number of Earners in Mantador
| Number of Earners | # Families | Median Income |
| No Earners | 2 (25.0%) | $0 |
| 1 Earner | 5 (62.5%) | $0 |
| 2 Earners | 1 (12.5%) | $0 |
| 3+ Earners | 0 (0.0%) | $0 |
| Total | 8 (100.0%) | $51,667 |
Household Income in Mantador
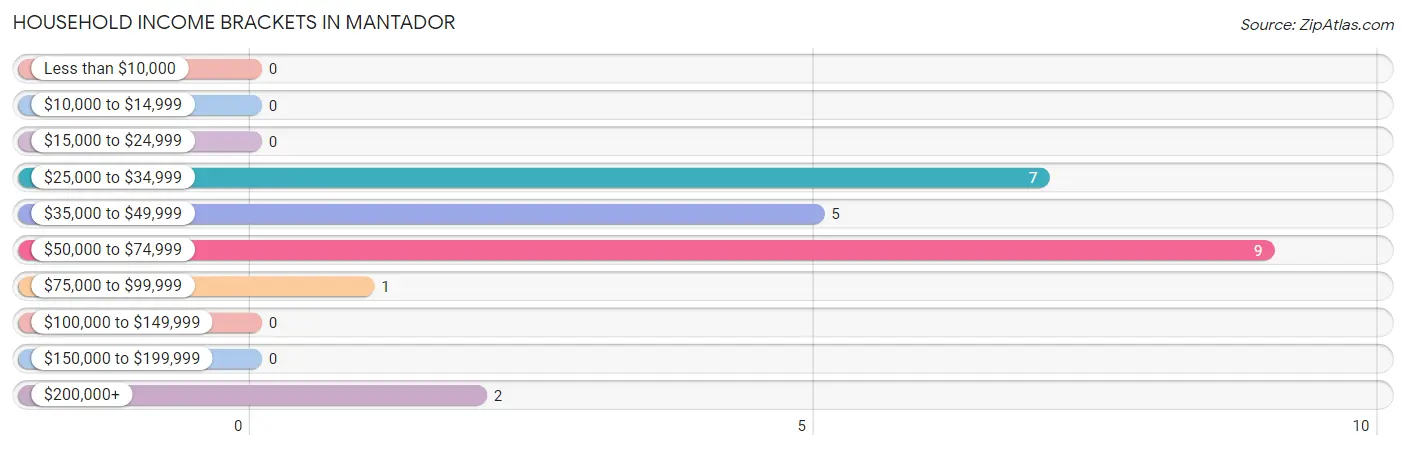
Household Income Brackets in Mantador
With 9 households falling in the category, the $50,000 to $74,999 income range is the most frequent in Mantador, accounting for 37.5% of all households.
| Income Bracket | # Households | % Households |
| Less than $10,000 | 0 | 0.0% |
| $10,000 to $14,999 | 0 | 0.0% |
| $15,000 to $24,999 | 0 | 0.0% |
| $25,000 to $34,999 | 7 | 29.2% |
| $35,000 to $49,999 | 5 | 20.8% |
| $50,000 to $74,999 | 9 | 37.5% |
| $75,000 to $99,999 | 1 | 4.2% |
| $100,000 to $149,999 | 0 | 0.0% |
| $150,000 to $199,999 | 0 | 0.0% |
| $200,000+ | 2 | 8.3% |
Household Income by Householder Age in Mantador
The median household income in Mantador is $48,750, with the highest median household income of $50,417 found in the 25 to 44 years age bracket for the primary householder. A total of 11 households (45.8%) fall into this category.
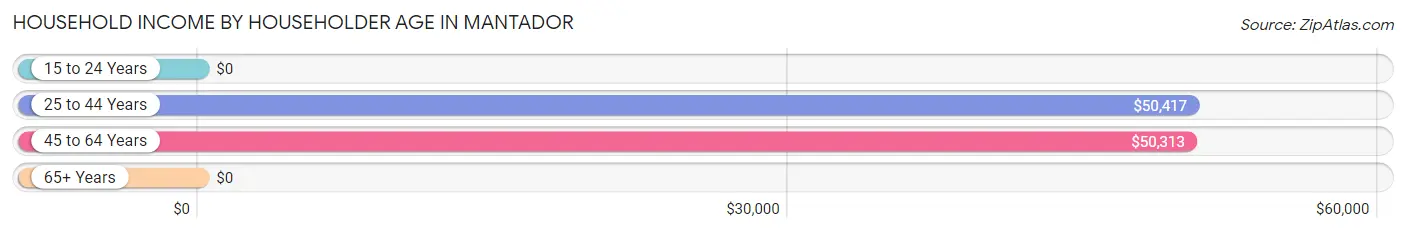
| Income Bracket | # Households | Median Income |
| 15 to 24 Years | 0 (0.0%) | $0 |
| 25 to 44 Years | 11 (45.8%) | $50,417 |
| 45 to 64 Years | 11 (45.8%) | $50,313 |
| 65+ Years | 2 (8.3%) | $0 |
| Total | 24 (100.0%) | $48,750 |
Poverty in Mantador
Income Below Poverty by Sex and Age in Mantador
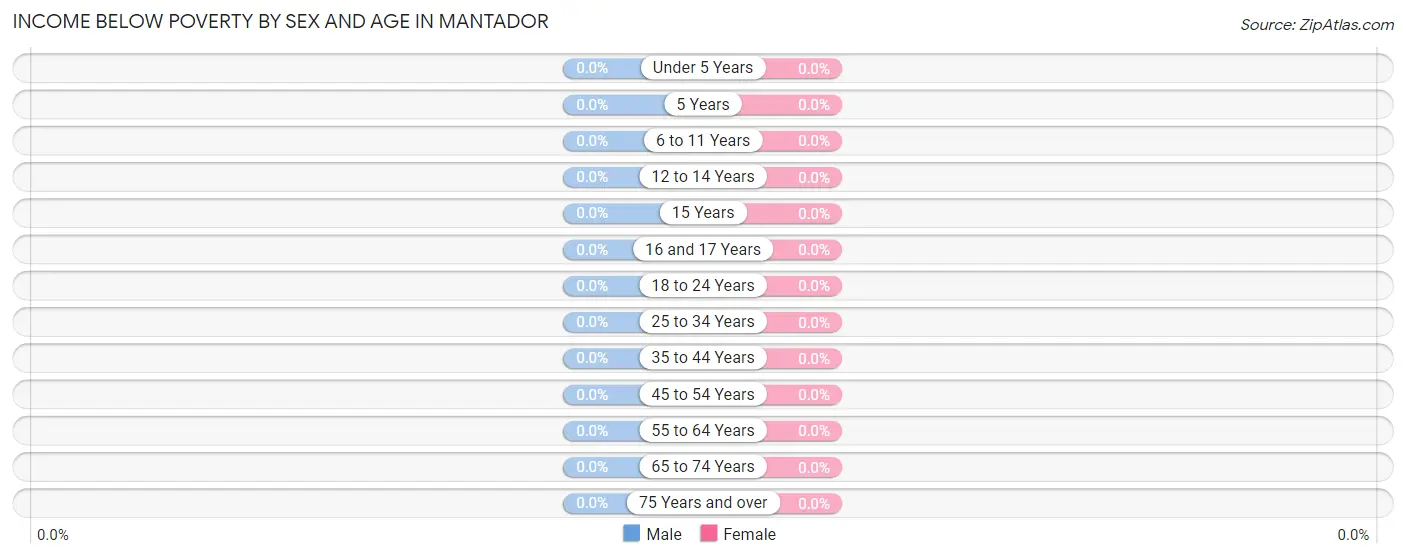
| Age Bracket | Male | Female |
| Under 5 Years | 0 (0.0%) | 0 (0.0%) |
| 5 Years | 0 (0.0%) | 0 (0.0%) |
| 6 to 11 Years | 0 (0.0%) | 0 (0.0%) |
| 12 to 14 Years | 0 (0.0%) | 0 (0.0%) |
| 15 Years | 0 (0.0%) | 0 (0.0%) |
| 16 and 17 Years | 0 (0.0%) | 0 (0.0%) |
| 18 to 24 Years | 0 (0.0%) | 0 (0.0%) |
| 25 to 34 Years | 0 (0.0%) | 0 (0.0%) |
| 35 to 44 Years | 0 (0.0%) | 0 (0.0%) |
| 45 to 54 Years | 0 (0.0%) | 0 (0.0%) |
| 55 to 64 Years | 0 (0.0%) | 0 (0.0%) |
| 65 to 74 Years | 0 (0.0%) | 0 (0.0%) |
| 75 Years and over | 0 (0.0%) | 0 (0.0%) |
| Total | 0 (0.0%) | 0 (0.0%) |
Income Above Poverty by Sex and Age in Mantador
According to the poverty statistics in Mantador, males aged 6 to 11 years and females aged 12 to 14 years are the age groups that are most secure financially, with 100.0% of males and 100.0% of females in these age groups living above the poverty line.
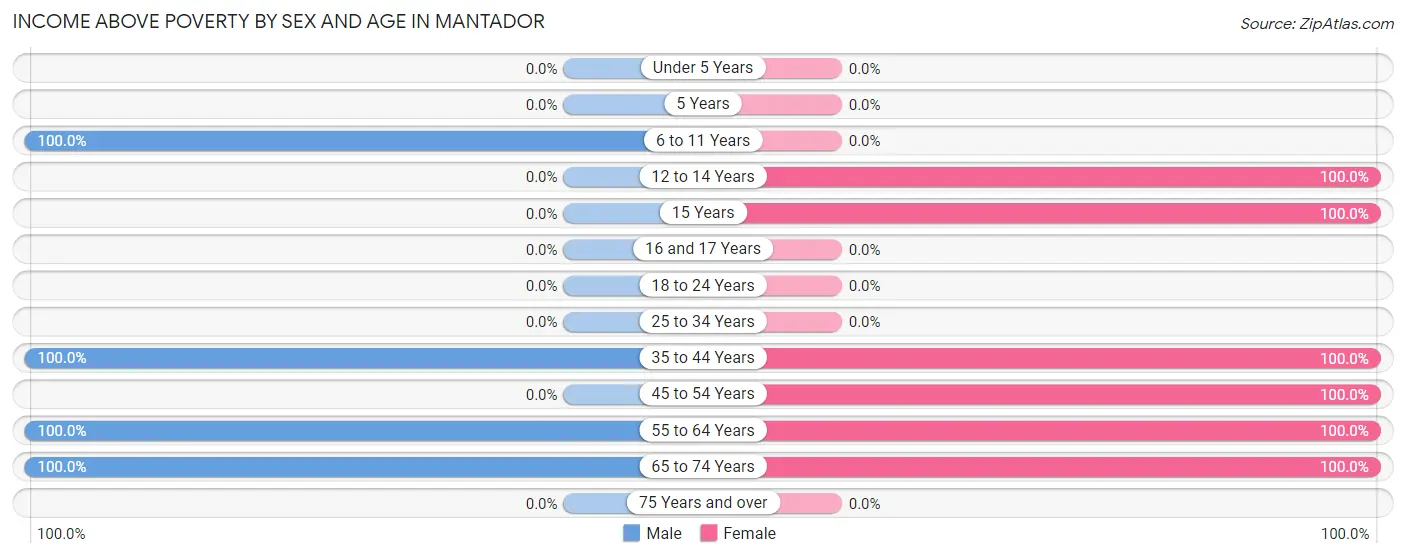
| Age Bracket | Male | Female |
| Under 5 Years | 0 (0.0%) | 0 (0.0%) |
| 5 Years | 0 (0.0%) | 0 (0.0%) |
| 6 to 11 Years | 2 (100.0%) | 0 (0.0%) |
| 12 to 14 Years | 0 (0.0%) | 3 (100.0%) |
| 15 Years | 0 (0.0%) | 3 (100.0%) |
| 16 and 17 Years | 0 (0.0%) | 0 (0.0%) |
| 18 to 24 Years | 0 (0.0%) | 0 (0.0%) |
| 25 to 34 Years | 0 (0.0%) | 0 (0.0%) |
| 35 to 44 Years | 8 (100.0%) | 3 (100.0%) |
| 45 to 54 Years | 0 (0.0%) | 4 (100.0%) |
| 55 to 64 Years | 1 (100.0%) | 7 (100.0%) |
| 65 to 74 Years | 2 (100.0%) | 1 (100.0%) |
| 75 Years and over | 0 (0.0%) | 0 (0.0%) |
| Total | 13 (100.0%) | 21 (100.0%) |
Income Below Poverty Among Married-Couple Families in Mantador
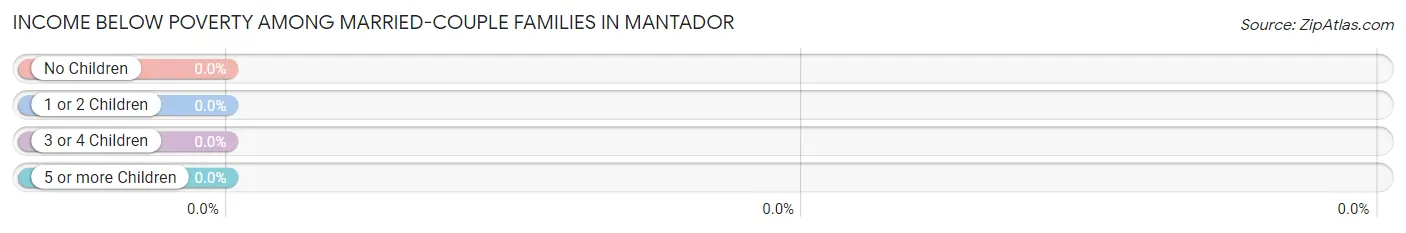
| Children | Above Poverty | Below Poverty |
| No Children | 3 (100.0%) | 0 (0.0%) |
| 1 or 2 Children | 0 (0.0%) | 0 (0.0%) |
| 3 or 4 Children | 0 (0.0%) | 0 (0.0%) |
| 5 or more Children | 0 (0.0%) | 0 (0.0%) |
| Total | 3 (100.0%) | 0 (0.0%) |
Income Below Poverty Among Single-Parent Households in Mantador
| Children | Single Father | Single Mother |
| No Children | 0 (0.0%) | 0 (0.0%) |
| 1 or 2 Children | 0 (0.0%) | 0 (0.0%) |
| 3 or 4 Children | 0 (0.0%) | 0 (0.0%) |
| 5 or more Children | 0 (0.0%) | 0 (0.0%) |
| Total | 0 (0.0%) | 0 (0.0%) |
Income Below Poverty Among Married-Couple vs Single-Parent Households in Mantador
| Children | Married-Couple Families | Single-Parent Households |
| No Children | 0 (0.0%) | 0 (0.0%) |
| 1 or 2 Children | 0 (0.0%) | 0 (0.0%) |
| 3 or 4 Children | 0 (0.0%) | 0 (0.0%) |
| 5 or more Children | 0 (0.0%) | 0 (0.0%) |
| Total | 0 (0.0%) | 0 (0.0%) |
Race in Mantador
The most populous races in Mantador are , and White / Caucasian (34 | 100.0%).
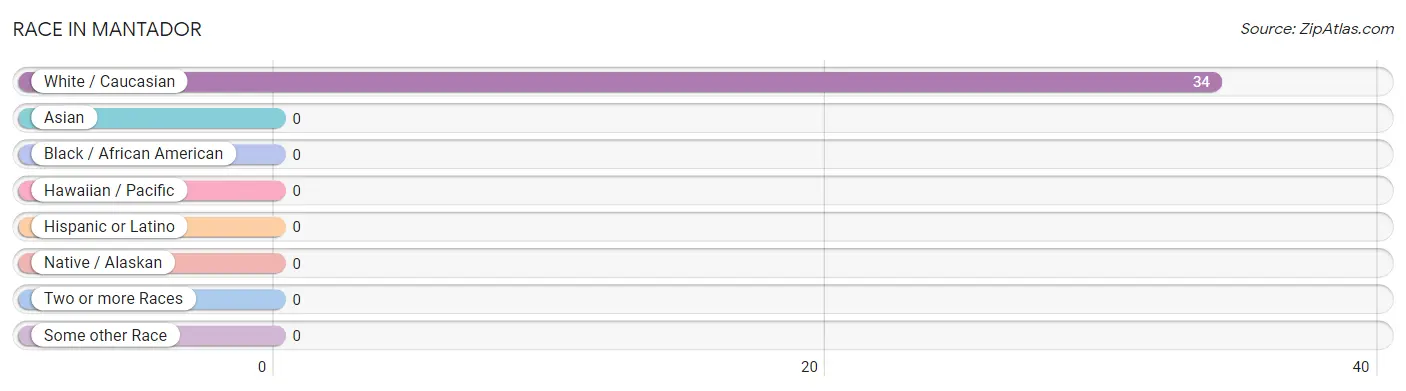
| Race | # Population | % Population |
| Asian | 0 | 0.0% |
| Black / African American | 0 | 0.0% |
| Hawaiian / Pacific | 0 | 0.0% |
| Hispanic or Latino | 0 | 0.0% |
| Native / Alaskan | 0 | 0.0% |
| White / Caucasian | 34 | 100.0% |
| Two or more Races | 0 | 0.0% |
| Some other Race | 0 | 0.0% |
| Total | 34 | 100.0% |
Ancestry in Mantador
The most populous ancestries reported in Mantador are German (21 | 61.8%), Norwegian (17 | 50.0%), Irish (7 | 20.6%), French Canadian (6 | 17.6%), and Swedish (2 | 5.9%), together accounting for 155.9% of all Mantador residents.
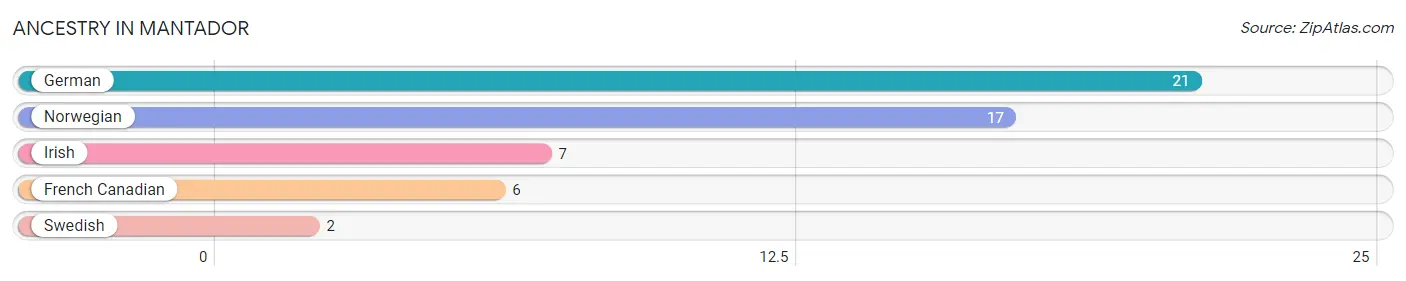
| Ancestry | # Population | % Population |
| French Canadian | 6 | 17.6% |
| German | 21 | 61.8% |
| Irish | 7 | 20.6% |
| Norwegian | 17 | 50.0% |
| Swedish | 2 | 5.9% | View All 5 Rows |
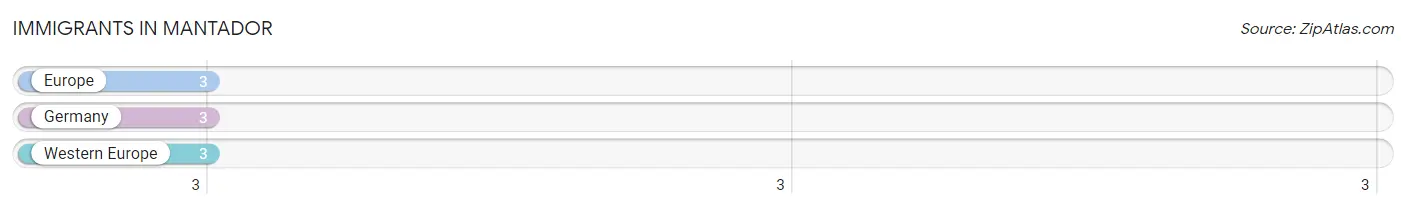
Immigrants in Mantador
The most numerous immigrant groups reported in Mantador came from Europe (3 | 8.8%), Germany (3 | 8.8%), and Western Europe (3 | 8.8%), together accounting for 26.5% of all Mantador residents.
| Immigration Origin | # Population | % Population |
| Europe | 3 | 8.8% |
| Germany | 3 | 8.8% |
| Western Europe | 3 | 8.8% | View All 3 Rows |
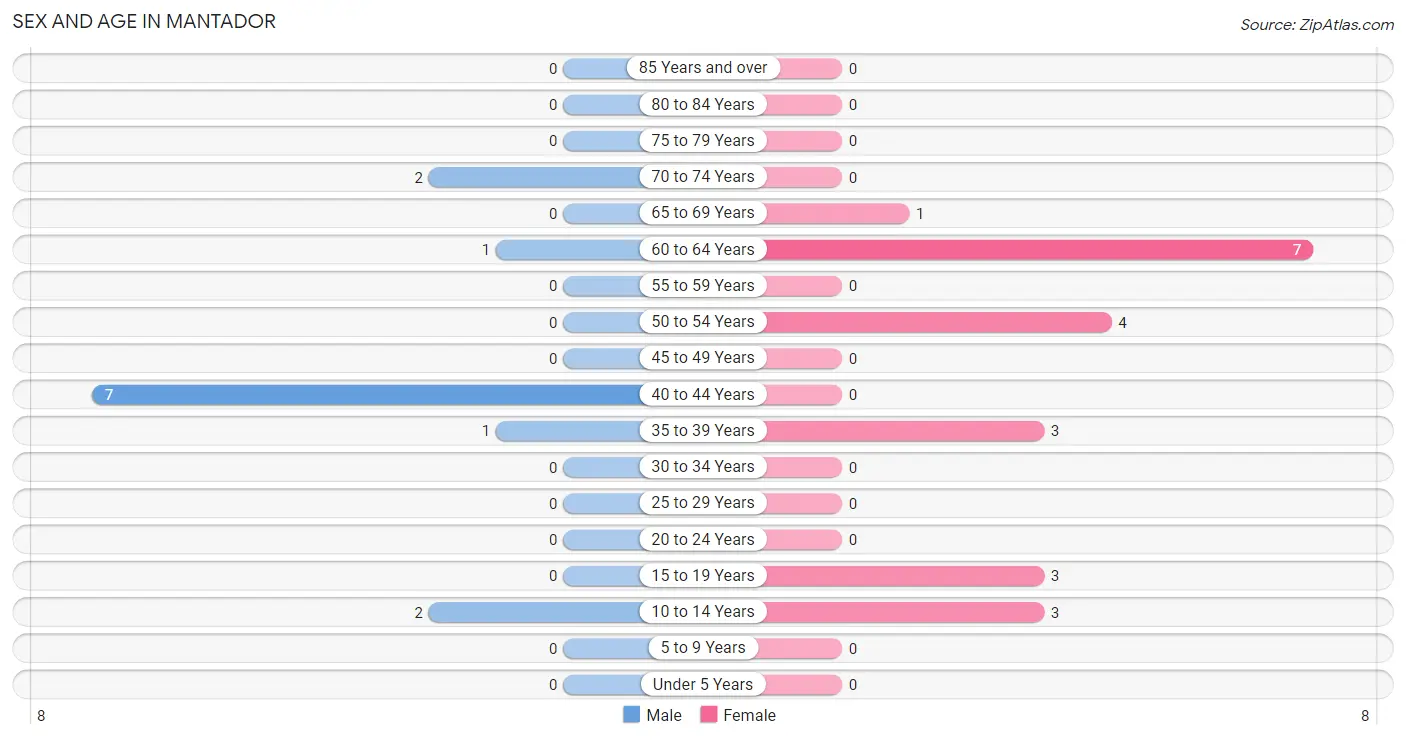
Sex and Age in Mantador
Sex and Age in Mantador
The most populous age groups in Mantador are 40 to 44 Years (7 | 53.8%) for men and 60 to 64 Years (7 | 33.3%) for women.
| Age Bracket | Male | Female |
| Under 5 Years | 0 (0.0%) | 0 (0.0%) |
| 5 to 9 Years | 0 (0.0%) | 0 (0.0%) |
| 10 to 14 Years | 2 (15.4%) | 3 (14.3%) |
| 15 to 19 Years | 0 (0.0%) | 3 (14.3%) |
| 20 to 24 Years | 0 (0.0%) | 0 (0.0%) |
| 25 to 29 Years | 0 (0.0%) | 0 (0.0%) |
| 30 to 34 Years | 0 (0.0%) | 0 (0.0%) |
| 35 to 39 Years | 1 (7.7%) | 3 (14.3%) |
| 40 to 44 Years | 7 (53.8%) | 0 (0.0%) |
| 45 to 49 Years | 0 (0.0%) | 0 (0.0%) |
| 50 to 54 Years | 0 (0.0%) | 4 (19.1%) |
| 55 to 59 Years | 0 (0.0%) | 0 (0.0%) |
| 60 to 64 Years | 1 (7.7%) | 7 (33.3%) |
| 65 to 69 Years | 0 (0.0%) | 1 (4.8%) |
| 70 to 74 Years | 2 (15.4%) | 0 (0.0%) |
| 75 to 79 Years | 0 (0.0%) | 0 (0.0%) |
| 80 to 84 Years | 0 (0.0%) | 0 (0.0%) |
| 85 Years and over | 0 (0.0%) | 0 (0.0%) |
| Total | 13 (100.0%) | 21 (100.0%) |
Families and Households in Mantador
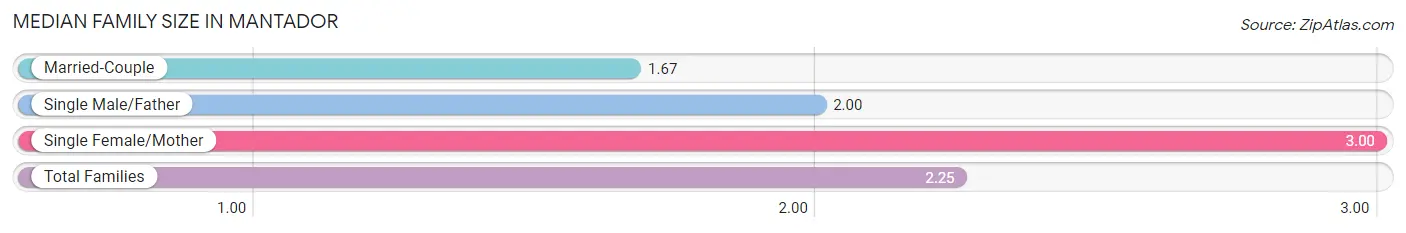
Median Family Size in Mantador
The median family size in Mantador is 2.25 persons per family, with single female/mother families (3 | 37.5%) accounting for the largest median family size of 3 persons per family. On the other hand, married-couple families (3 | 37.5%) represent the smallest median family size with 1.67 persons per family.
| Family Type | # Families | Family Size |
| Married-Couple | 3 (37.5%) | 1.67 |
| Single Male/Father | 2 (25.0%) | 2.00 |
| Single Female/Mother | 3 (37.5%) | 3.00 |
| Total Families | 8 (100.0%) | 2.25 |
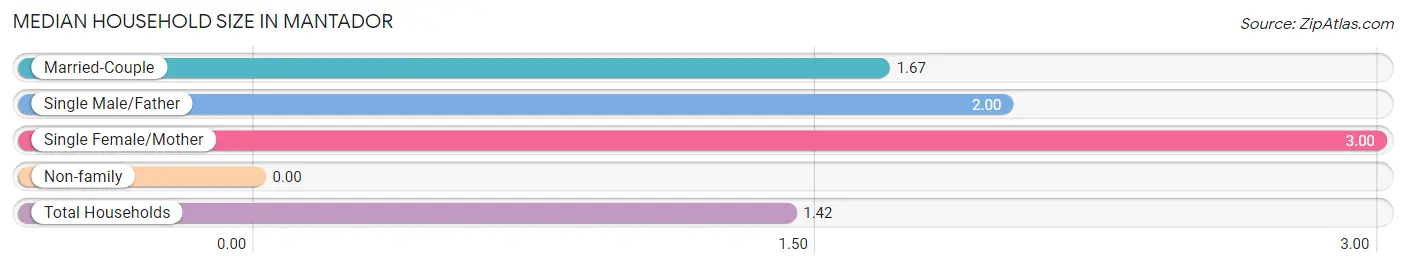
Median Household Size in Mantador
| Household Type | # Households | Household Size |
| Married-Couple | 3 (12.5%) | 1.67 |
| Single Male/Father | 2 (8.3%) | 2.00 |
| Single Female/Mother | 3 (12.5%) | 3.00 |
| Non-family | 16 (66.7%) | - |
| Total Households | 24 (100.0%) | 1.42 |
Household Size by Marriage Status in Mantador
Out of a total of 24 households in Mantador, 8 (33.3%) are family households, while 16 (66.7%) are nonfamily households. The most numerous type of family households are 2-person households, comprising 5, and the most common type of nonfamily households are 1-person households, comprising 16.
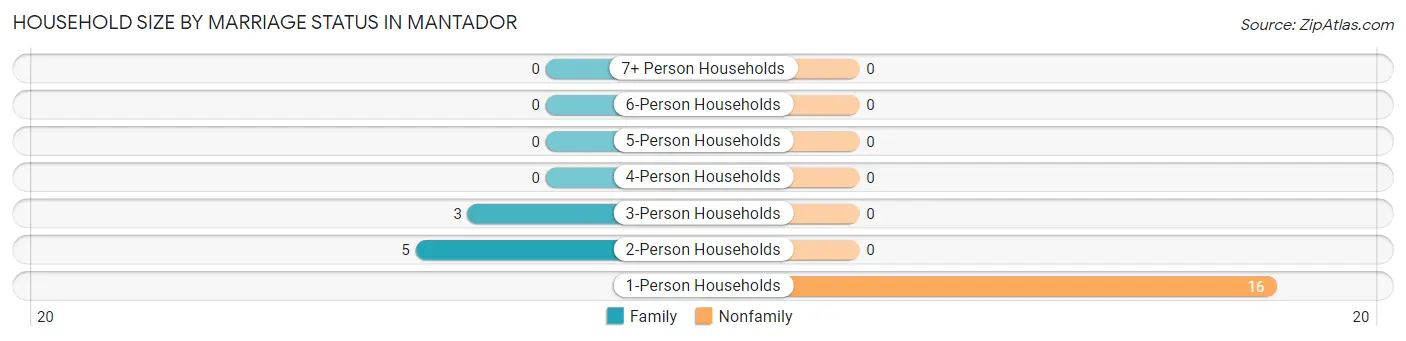
| Household Size | Family Households | Nonfamily Households |
| 1-Person Households | - | 16 (66.7%) |
| 2-Person Households | 5 (20.8%) | 0 (0.0%) |
| 3-Person Households | 3 (12.5%) | 0 (0.0%) |
| 4-Person Households | 0 (0.0%) | 0 (0.0%) |
| 5-Person Households | 0 (0.0%) | 0 (0.0%) |
| 6-Person Households | 0 (0.0%) | 0 (0.0%) |
| 7+ Person Households | 0 (0.0%) | 0 (0.0%) |
| Total | 8 (33.3%) | 16 (66.7%) |
Female Fertility in Mantador
Fertility by Age in Mantador
| Age Bracket | Women with Births | Births / 1,000 Women |
| 15 to 19 years | 0 (0.0%) | 0.0 |
| 20 to 34 years | 0 (0.0%) | 0.0 |
| 35 to 50 years | 0 (0.0%) | 0.0 |
| Total | 0 (0.0%) | 0.0 |
Fertility by Age by Marriage Status in Mantador
| Age Bracket | Married | Unmarried |
| 15 to 19 years | 0 (0.0%) | 0 (0.0%) |
| 20 to 34 years | 0 (0.0%) | 0 (0.0%) |
| 35 to 50 years | 0 (0.0%) | 0 (0.0%) |
| Total | 0 (0.0%) | 0 (0.0%) |
Fertility by Education in Mantador
| Educational Attainment | Women with Births | Births / 1,000 Women |
| Less than High School | 0 (0.0%) | 0.0 |
| High School Diploma | 0 (0.0%) | 0.0 |
| College or Associate's Degree | 0 (0.0%) | 0.0 |
| Bachelor's Degree | 0 (0.0%) | 0.0 |
| Graduate Degree | 0 (0.0%) | 0.0 |
| Total | 0 (0.0%) | 0.0 |
Fertility by Education by Marriage Status in Mantador
| Educational Attainment | Married | Unmarried |
| Less than High School | 0 (0.0%) | 0 (0.0%) |
| High School Diploma | 0 (0.0%) | 0 (0.0%) |
| College or Associate's Degree | 0 (0.0%) | 0 (0.0%) |
| Bachelor's Degree | 0 (0.0%) | 0 (0.0%) |
| Graduate Degree | 0 (0.0%) | 0 (0.0%) |
| Total | 0 (0.0%) | 0 (0.0%) |
Employment Characteristics in Mantador
Employment by Class of Employer in Mantador
Among the 22 employed individuals in Mantador, self-employed (not incorporated) (8 | 36.4%), private company employees (6 | 27.3%), and not-for-profit organizations (4 | 18.2%) make up the most common classes of employment.
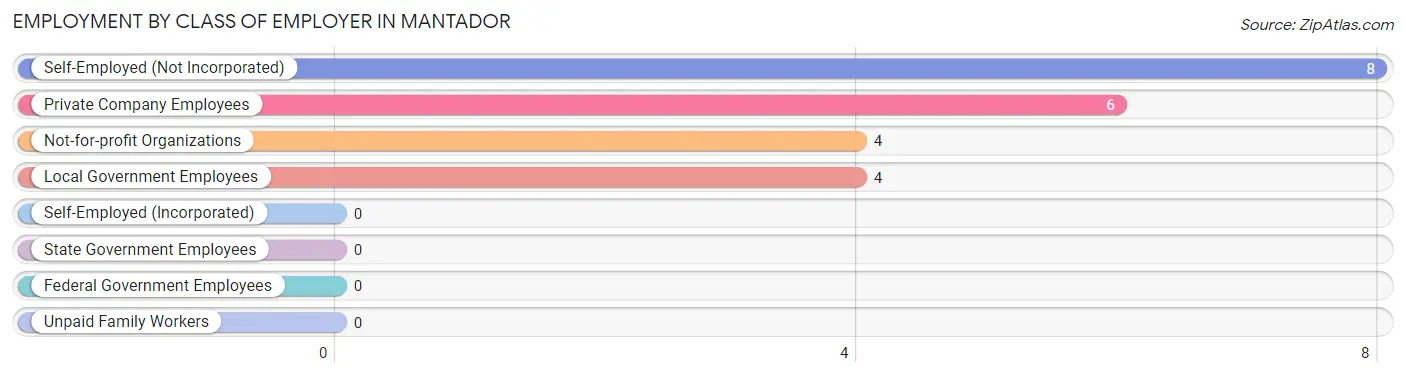
| Employer Class | # Employees | % Employees |
| Private Company Employees | 6 | 27.3% |
| Self-Employed (Incorporated) | 0 | 0.0% |
| Self-Employed (Not Incorporated) | 8 | 36.4% |
| Not-for-profit Organizations | 4 | 18.2% |
| Local Government Employees | 4 | 18.2% |
| State Government Employees | 0 | 0.0% |
| Federal Government Employees | 0 | 0.0% |
| Unpaid Family Workers | 0 | 0.0% |
| Total | 22 | 100.0% |
Employment Status by Age in Mantador
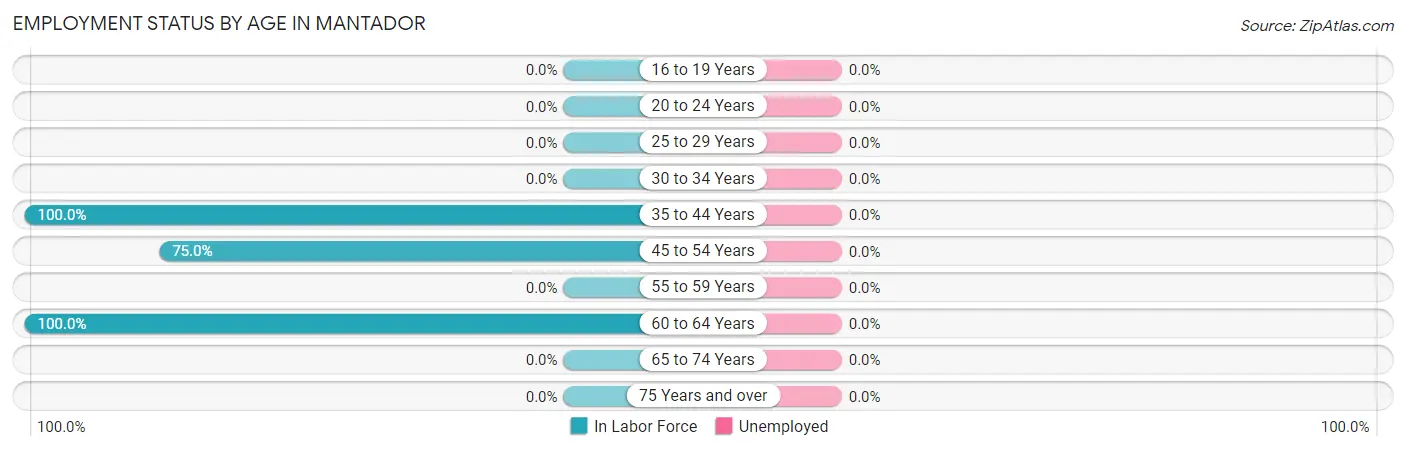
| Age Bracket | In Labor Force | Unemployed |
| 16 to 19 Years | 0 (0.0%) | 0 (0.0%) |
| 20 to 24 Years | 0 (0.0%) | 0 (0.0%) |
| 25 to 29 Years | 0 (0.0%) | 0 (0.0%) |
| 30 to 34 Years | 0 (0.0%) | 0 (0.0%) |
| 35 to 44 Years | 11 (100.0%) | 0 (0.0%) |
| 45 to 54 Years | 3 (75.0%) | 0 (0.0%) |
| 55 to 59 Years | 0 (0.0%) | 0 (0.0%) |
| 60 to 64 Years | 8 (100.0%) | 0 (0.0%) |
| 65 to 74 Years | 0 (0.0%) | 0 (0.0%) |
| 75 Years and over | 0 (0.0%) | 0 (0.0%) |
| Total | 22 (84.6%) | 0 (0.0%) |
Employment Status by Educational Attainment in Mantador
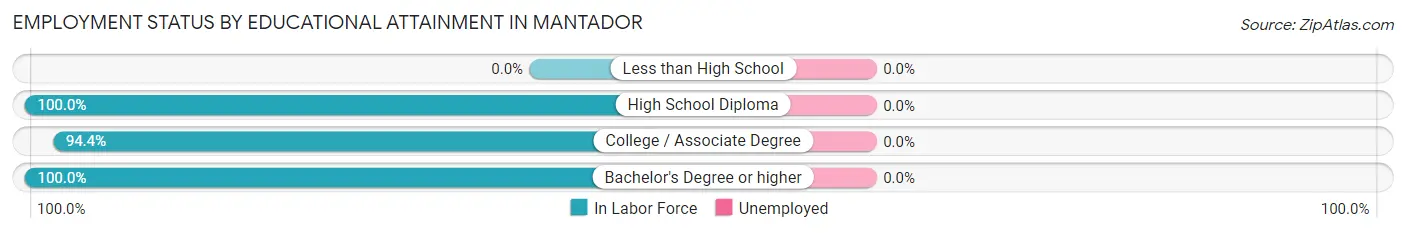
| Educational Attainment | In Labor Force | Unemployed |
| Less than High School | 0 (0.0%) | 0 (0.0%) |
| High School Diploma | 1 (100.0%) | 0 (0.0%) |
| College / Associate Degree | 17 (94.4%) | 0 (0.0%) |
| Bachelor's Degree or higher | 4 (100.0%) | 0 (0.0%) |
| Total | 22 (95.7%) | 0 (0.0%) |
Employment Occupations by Sex in Mantador
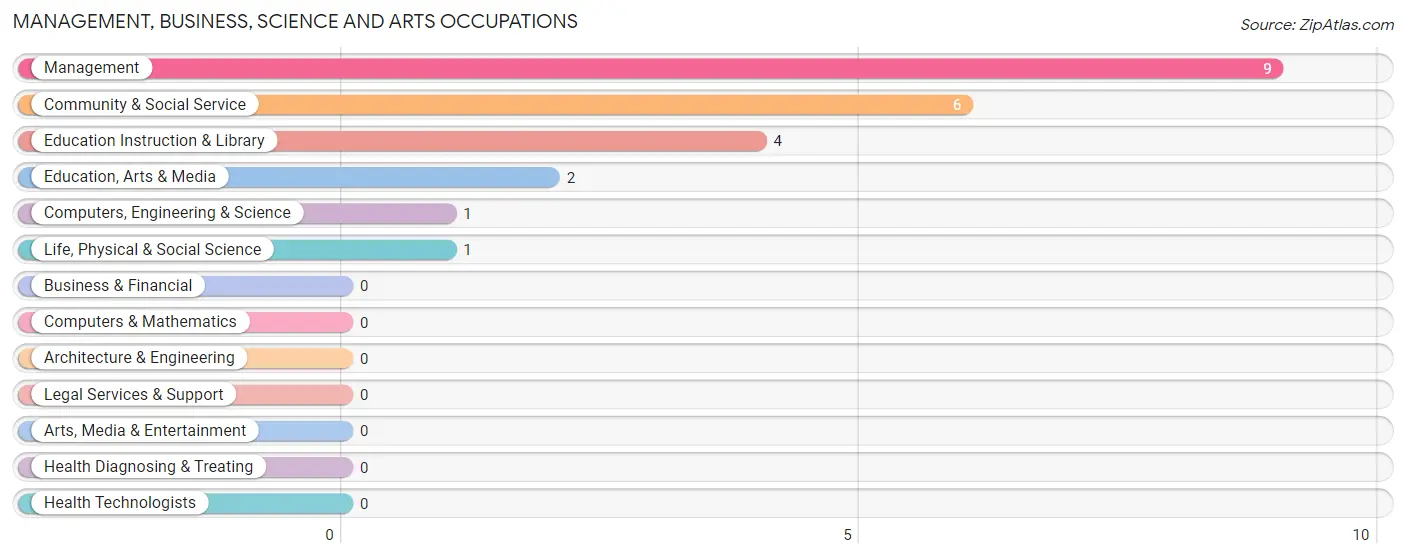
Management, Business, Science and Arts Occupations
The most common Management, Business, Science and Arts occupations in Mantador are Management (9 | 40.9%), Community & Social Service (6 | 27.3%), Education Instruction & Library (4 | 18.2%), Education, Arts & Media (2 | 9.1%), and Computers, Engineering & Science (1 | 4.5%).
Management, Business, Science and Arts Occupations by Sex
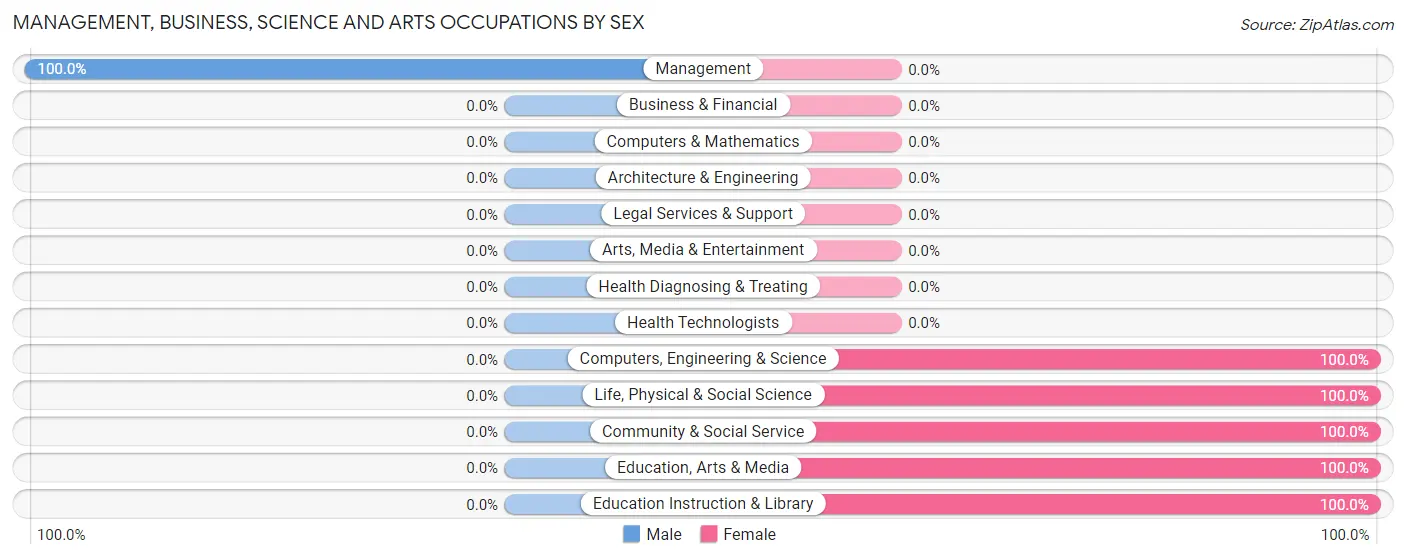
| Occupation | Male | Female |
| Management | 9 (100.0%) | 0 (0.0%) |
| Business & Financial | 0 (0.0%) | 0 (0.0%) |
| Computers, Engineering & Science | 0 (0.0%) | 1 (100.0%) |
| Computers & Mathematics | 0 (0.0%) | 0 (0.0%) |
| Architecture & Engineering | 0 (0.0%) | 0 (0.0%) |
| Life, Physical & Social Science | 0 (0.0%) | 1 (100.0%) |
| Community & Social Service | 0 (0.0%) | 6 (100.0%) |
| Education, Arts & Media | 0 (0.0%) | 2 (100.0%) |
| Legal Services & Support | 0 (0.0%) | 0 (0.0%) |
| Education Instruction & Library | 0 (0.0%) | 4 (100.0%) |
| Arts, Media & Entertainment | 0 (0.0%) | 0 (0.0%) |
| Health Diagnosing & Treating | 0 (0.0%) | 0 (0.0%) |
| Health Technologists | 0 (0.0%) | 0 (0.0%) |
| Total (Category) | 9 (56.2%) | 7 (43.8%) |
| Total (Overall) | 9 (40.9%) | 13 (59.1%) |
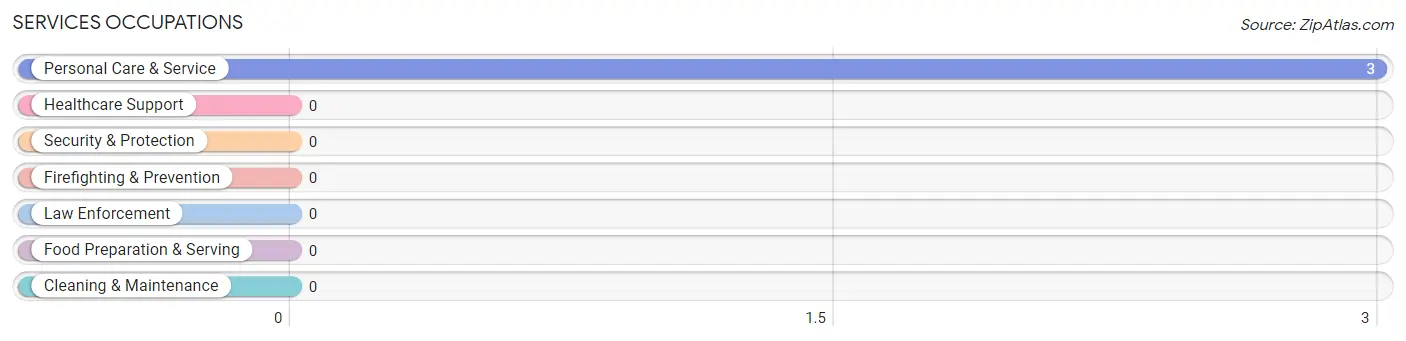
Services Occupations
The most common Services occupations in Mantador are , and Personal Care & Service (3 | 13.6%).
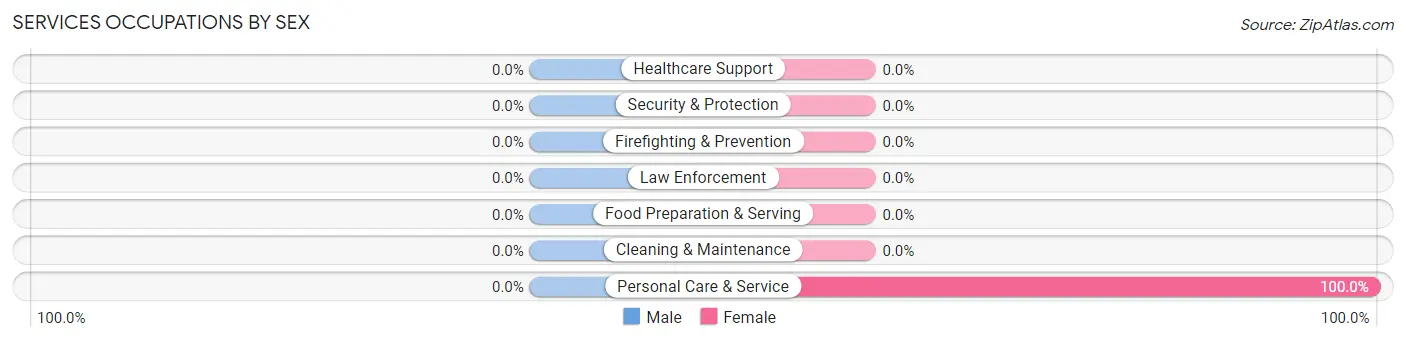
Services Occupations by Sex
| Occupation | Male | Female |
| Healthcare Support | 0 (0.0%) | 0 (0.0%) |
| Security & Protection | 0 (0.0%) | 0 (0.0%) |
| Firefighting & Prevention | 0 (0.0%) | 0 (0.0%) |
| Law Enforcement | 0 (0.0%) | 0 (0.0%) |
| Food Preparation & Serving | 0 (0.0%) | 0 (0.0%) |
| Cleaning & Maintenance | 0 (0.0%) | 0 (0.0%) |
| Personal Care & Service | 0 (0.0%) | 3 (100.0%) |
| Total (Category) | 0 (0.0%) | 3 (100.0%) |
| Total (Overall) | 9 (40.9%) | 13 (59.1%) |
Sales and Office Occupations
The most common Sales and Office occupations in Mantador are , and Sales & Related (3 | 13.6%).
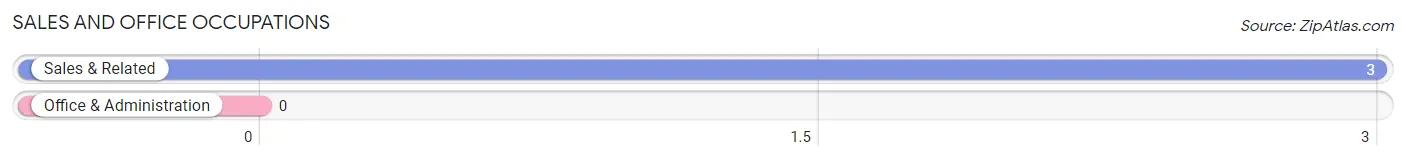
Sales and Office Occupations by Sex
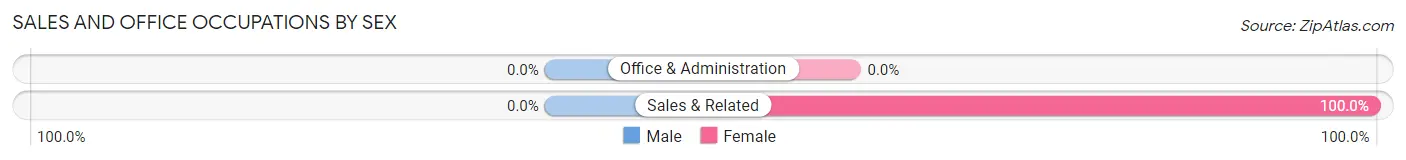
| Occupation | Male | Female |
| Sales & Related | 0 (0.0%) | 3 (100.0%) |
| Office & Administration | 0 (0.0%) | 0 (0.0%) |
| Total (Category) | 0 (0.0%) | 3 (100.0%) |
| Total (Overall) | 9 (40.9%) | 13 (59.1%) |
Natural Resources, Construction and Maintenance Occupations
Natural Resources, Construction and Maintenance Occupations by Sex
| Occupation | Male | Female |
| Farming, Fishing & Forestry | 0 (0.0%) | 0 (0.0%) |
| Construction & Extraction | 0 (0.0%) | 0 (0.0%) |
| Installation, Maintenance & Repair | 0 (0.0%) | 0 (0.0%) |
| Total (Category) | 0 (0.0%) | 0 (0.0%) |
| Total (Overall) | 9 (40.9%) | 13 (59.1%) |
Production, Transportation and Moving Occupations
Production, Transportation and Moving Occupations by Sex
| Occupation | Male | Female |
| Production | 0 (0.0%) | 0 (0.0%) |
| Transportation | 0 (0.0%) | 0 (0.0%) |
| Material Moving | 0 (0.0%) | 0 (0.0%) |
| Total (Category) | 0 (0.0%) | 0 (0.0%) |
| Total (Overall) | 9 (40.9%) | 13 (59.1%) |
Employment Industries by Sex in Mantador
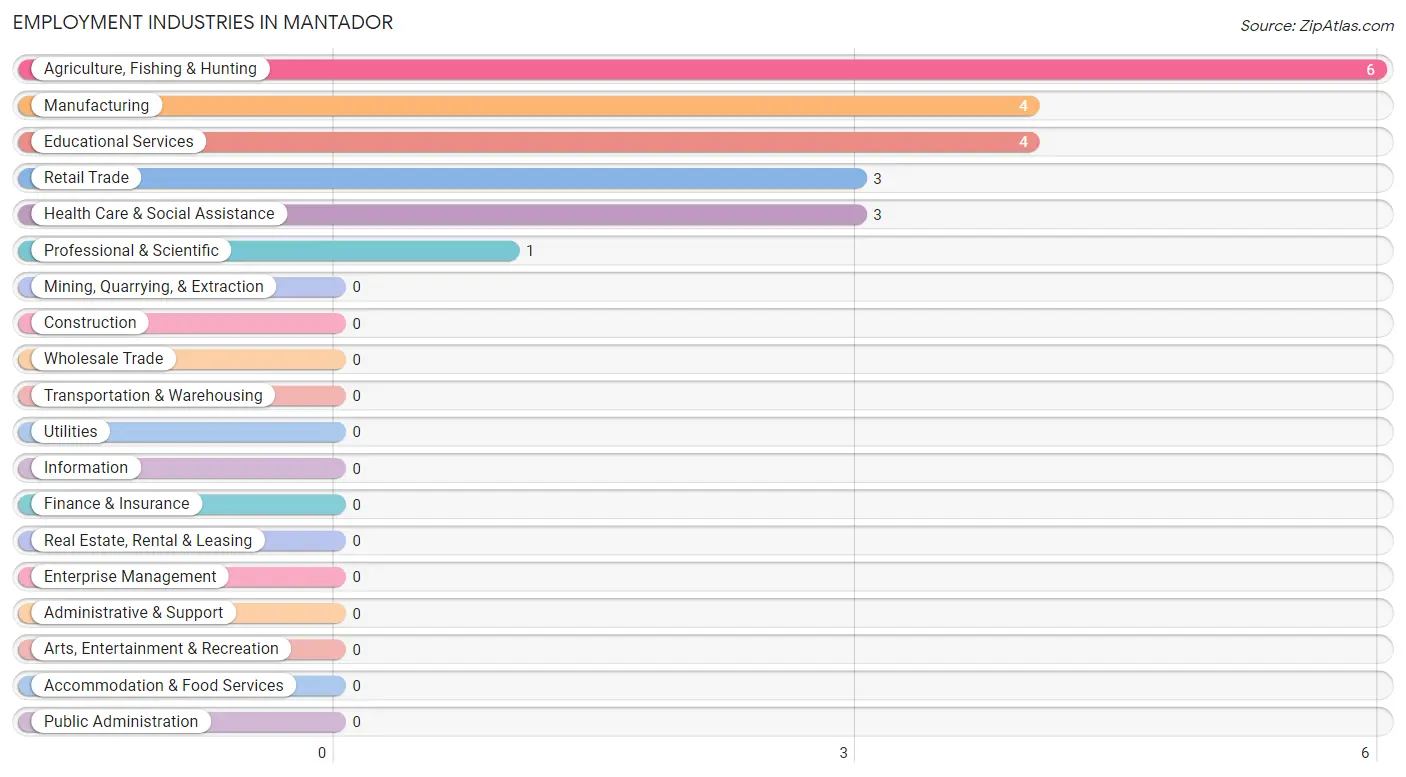
Employment Industries in Mantador
The major employment industries in Mantador include Agriculture, Fishing & Hunting (6 | 27.3%), Manufacturing (4 | 18.2%), Educational Services (4 | 18.2%), Retail Trade (3 | 13.6%), and Health Care & Social Assistance (3 | 13.6%).
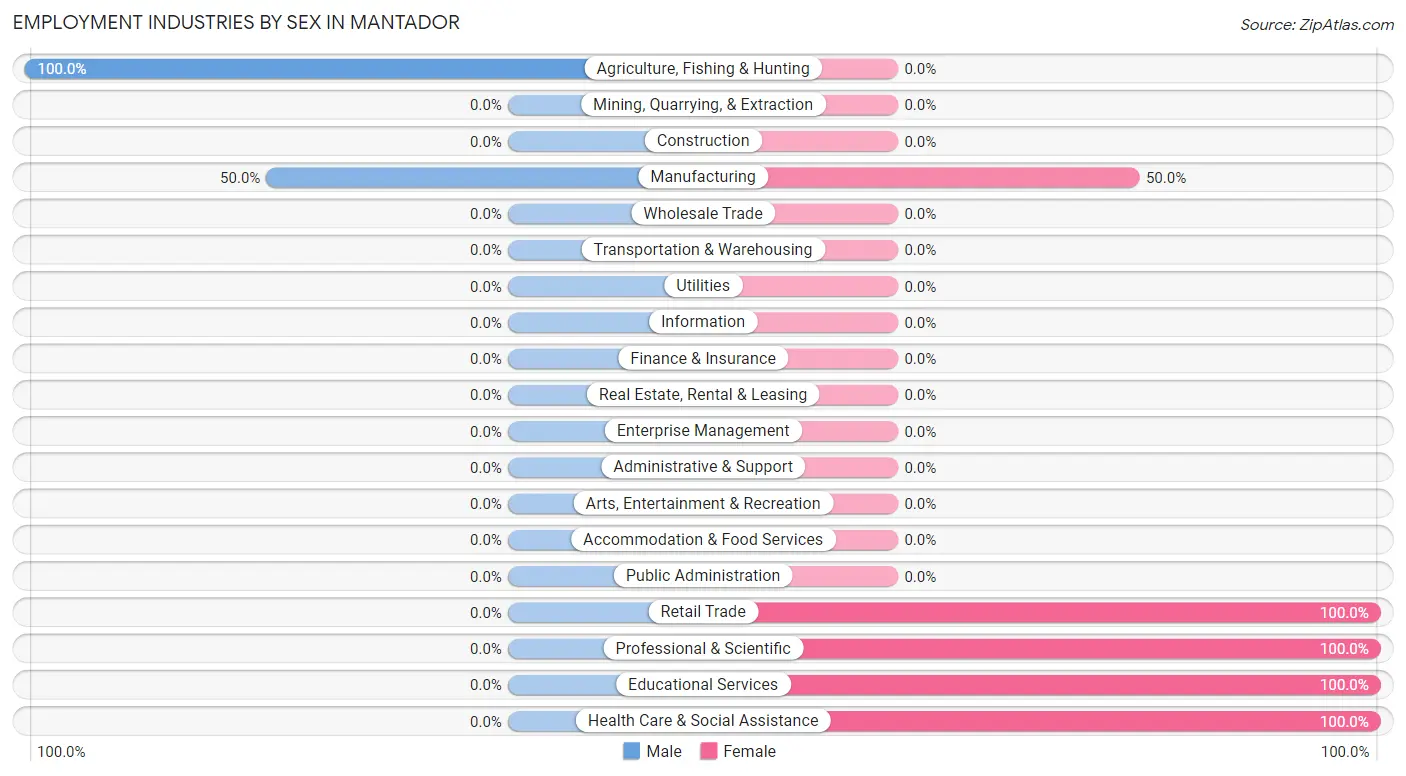
Employment Industries by Sex in Mantador
The Mantador industries that see more men than women are Agriculture, Fishing & Hunting (100.0%), and Manufacturing (50.0%), whereas the industries that tend to have a higher number of women are Retail Trade (100.0%), Professional & Scientific (100.0%), and Educational Services (100.0%).
| Industry | Male | Female |
| Agriculture, Fishing & Hunting | 6 (100.0%) | 0 (0.0%) |
| Mining, Quarrying, & Extraction | 0 (0.0%) | 0 (0.0%) |
| Construction | 0 (0.0%) | 0 (0.0%) |
| Manufacturing | 2 (50.0%) | 2 (50.0%) |
| Wholesale Trade | 0 (0.0%) | 0 (0.0%) |
| Retail Trade | 0 (0.0%) | 3 (100.0%) |
| Transportation & Warehousing | 0 (0.0%) | 0 (0.0%) |
| Utilities | 0 (0.0%) | 0 (0.0%) |
| Information | 0 (0.0%) | 0 (0.0%) |
| Finance & Insurance | 0 (0.0%) | 0 (0.0%) |
| Real Estate, Rental & Leasing | 0 (0.0%) | 0 (0.0%) |
| Professional & Scientific | 0 (0.0%) | 1 (100.0%) |
| Enterprise Management | 0 (0.0%) | 0 (0.0%) |
| Administrative & Support | 0 (0.0%) | 0 (0.0%) |
| Educational Services | 0 (0.0%) | 4 (100.0%) |
| Health Care & Social Assistance | 0 (0.0%) | 3 (100.0%) |
| Arts, Entertainment & Recreation | 0 (0.0%) | 0 (0.0%) |
| Accommodation & Food Services | 0 (0.0%) | 0 (0.0%) |
| Public Administration | 0 (0.0%) | 0 (0.0%) |
| Total | 9 (40.9%) | 13 (59.1%) |
Education in Mantador
School Enrollment in Mantador
The most common levels of schooling among the 8 students in Mantador are middle school (5 | 62.5%), and high school (3 | 37.5%).
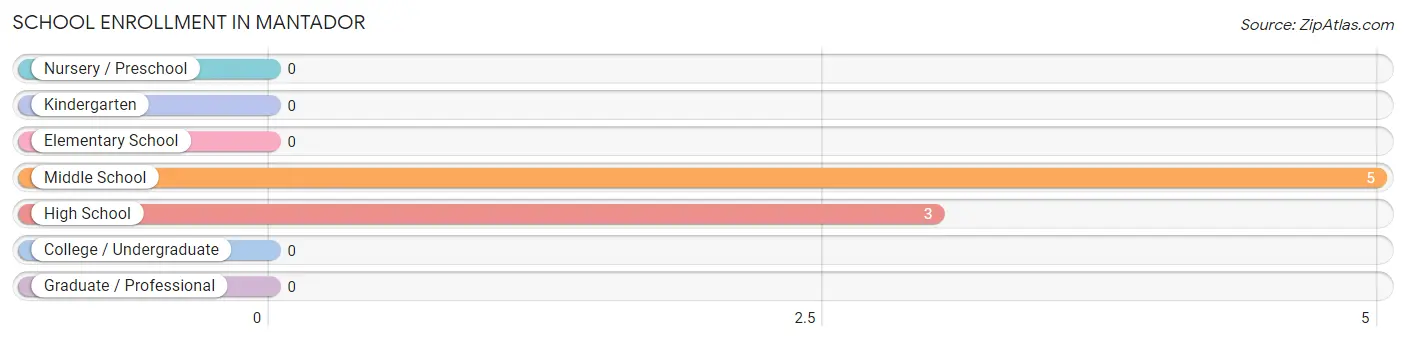
| School Level | # Students | % Students |
| Nursery / Preschool | 0 | 0.0% |
| Kindergarten | 0 | 0.0% |
| Elementary School | 0 | 0.0% |
| Middle School | 5 | 62.5% |
| High School | 3 | 37.5% |
| College / Undergraduate | 0 | 0.0% |
| Graduate / Professional | 0 | 0.0% |
| Total | 8 | 100.0% |
School Enrollment by Age by Funding Source in Mantador
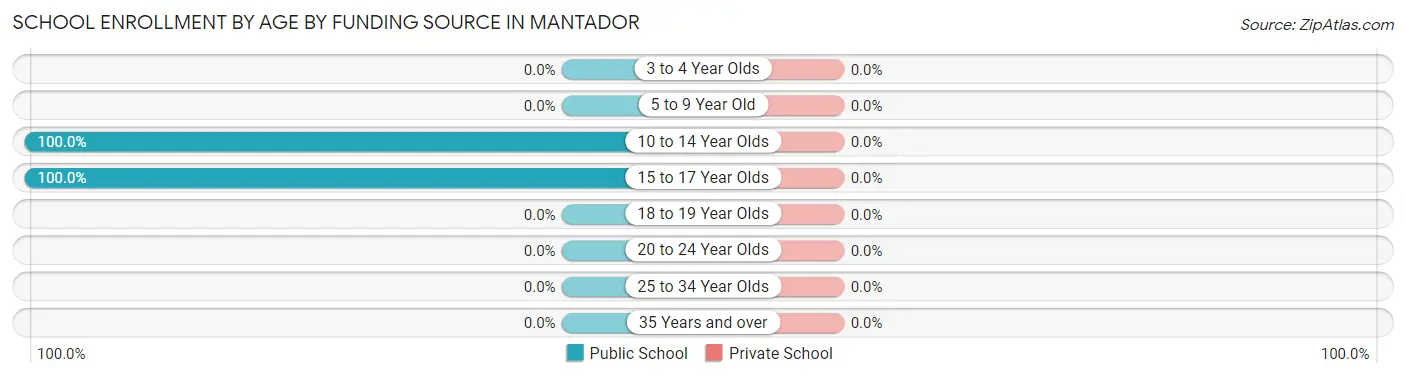
| Age Bracket | Public School | Private School |
| 3 to 4 Year Olds | 0 (0.0%) | 0 (0.0%) |
| 5 to 9 Year Old | 0 (0.0%) | 0 (0.0%) |
| 10 to 14 Year Olds | 5 (100.0%) | 0 (0.0%) |
| 15 to 17 Year Olds | 3 (100.0%) | 0 (0.0%) |
| 18 to 19 Year Olds | 0 (0.0%) | 0 (0.0%) |
| 20 to 24 Year Olds | 0 (0.0%) | 0 (0.0%) |
| 25 to 34 Year Olds | 0 (0.0%) | 0 (0.0%) |
| 35 Years and over | 0 (0.0%) | 0 (0.0%) |
| Total | 8 (100.0%) | 0 (0.0%) |
Educational Attainment by Field of Study in Mantador
Engineering (2 | 50.0%), and education (2 | 50.0%) are the most common fields of study among 4 individuals in Mantador who have obtained a bachelor's degree or higher.
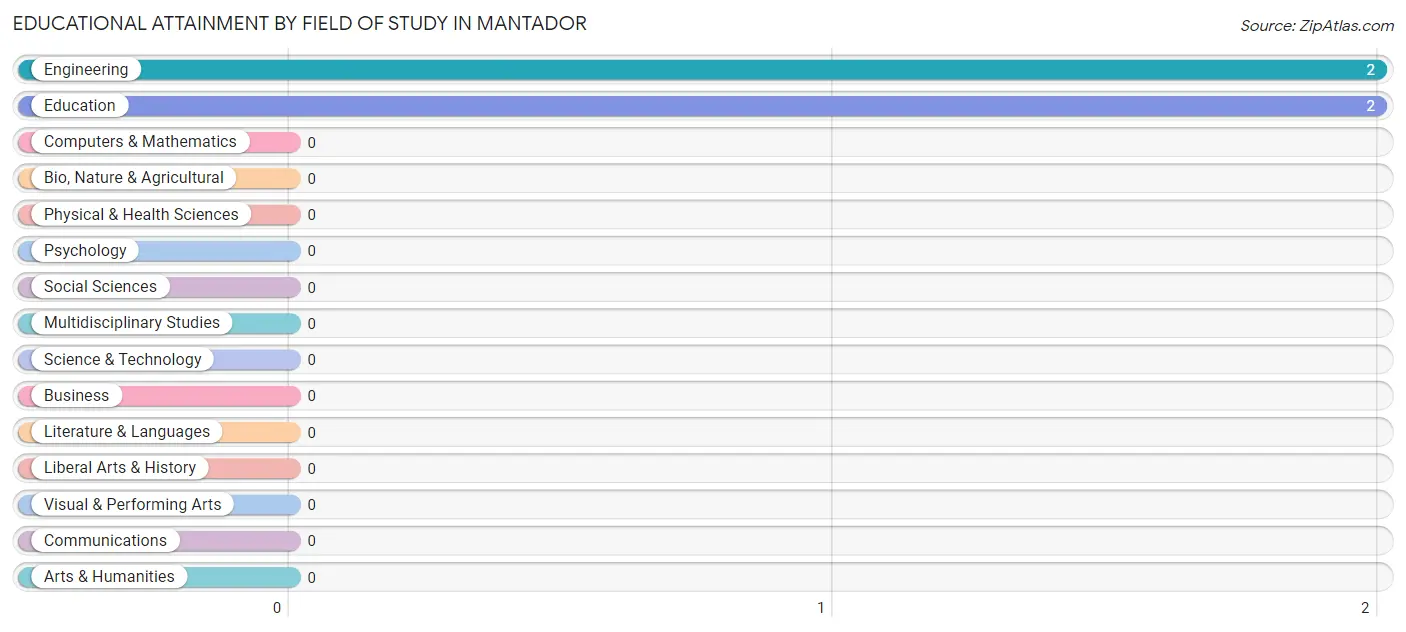
| Field of Study | # Graduates | % Graduates |
| Computers & Mathematics | 0 | 0.0% |
| Bio, Nature & Agricultural | 0 | 0.0% |
| Physical & Health Sciences | 0 | 0.0% |
| Psychology | 0 | 0.0% |
| Social Sciences | 0 | 0.0% |
| Engineering | 2 | 50.0% |
| Multidisciplinary Studies | 0 | 0.0% |
| Science & Technology | 0 | 0.0% |
| Business | 0 | 0.0% |
| Education | 2 | 50.0% |
| Literature & Languages | 0 | 0.0% |
| Liberal Arts & History | 0 | 0.0% |
| Visual & Performing Arts | 0 | 0.0% |
| Communications | 0 | 0.0% |
| Arts & Humanities | 0 | 0.0% |
| Total | 4 | 100.0% |
Transportation & Commute in Mantador
Vehicle Availability by Sex in Mantador
The most prevalent vehicle ownership categories in Mantador are males with 1 vehicle (5, accounting for 55.6%) and females with 1 vehicle (3, making up 38.5%).
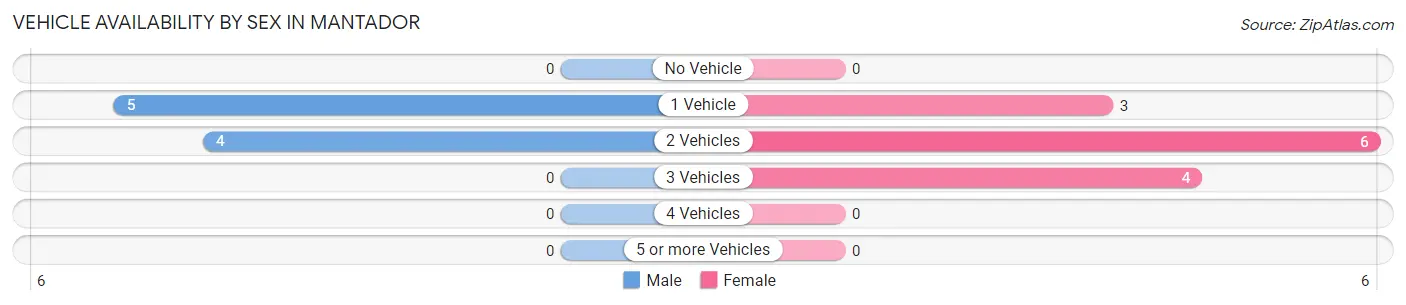
| Vehicles Available | Male | Female |
| No Vehicle | 0 (0.0%) | 0 (0.0%) |
| 1 Vehicle | 5 (55.6%) | 3 (23.1%) |
| 2 Vehicles | 4 (44.4%) | 6 (46.2%) |
| 3 Vehicles | 0 (0.0%) | 4 (30.8%) |
| 4 Vehicles | 0 (0.0%) | 0 (0.0%) |
| 5 or more Vehicles | 0 (0.0%) | 0 (0.0%) |
| Total | 9 (100.0%) | 13 (100.0%) |
Commute Time in Mantador
The most frequently occuring commute durations in Mantador are 20 to 24 minutes (10 commuters, 45.5%), 25 to 29 minutes (5 commuters, 22.7%), and 5 to 9 minutes (3 commuters, 13.6%).
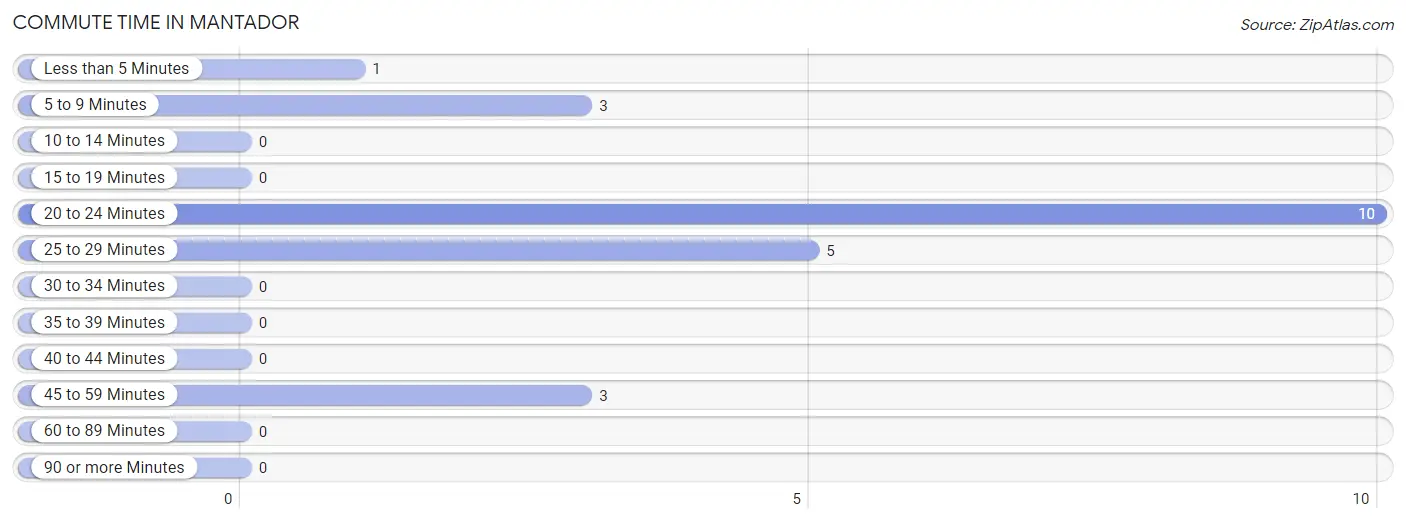
| Commute Time | # Commuters | % Commuters |
| Less than 5 Minutes | 1 | 4.5% |
| 5 to 9 Minutes | 3 | 13.6% |
| 10 to 14 Minutes | 0 | 0.0% |
| 15 to 19 Minutes | 0 | 0.0% |
| 20 to 24 Minutes | 10 | 45.5% |
| 25 to 29 Minutes | 5 | 22.7% |
| 30 to 34 Minutes | 0 | 0.0% |
| 35 to 39 Minutes | 0 | 0.0% |
| 40 to 44 Minutes | 0 | 0.0% |
| 45 to 59 Minutes | 3 | 13.6% |
| 60 to 89 Minutes | 0 | 0.0% |
| 90 or more Minutes | 0 | 0.0% |
Commute Time by Sex in Mantador
The most common commute times in Mantador are 20 to 24 minutes (7 commuters, 77.8%) for males and 25 to 29 minutes (5 commuters, 38.5%) for females.
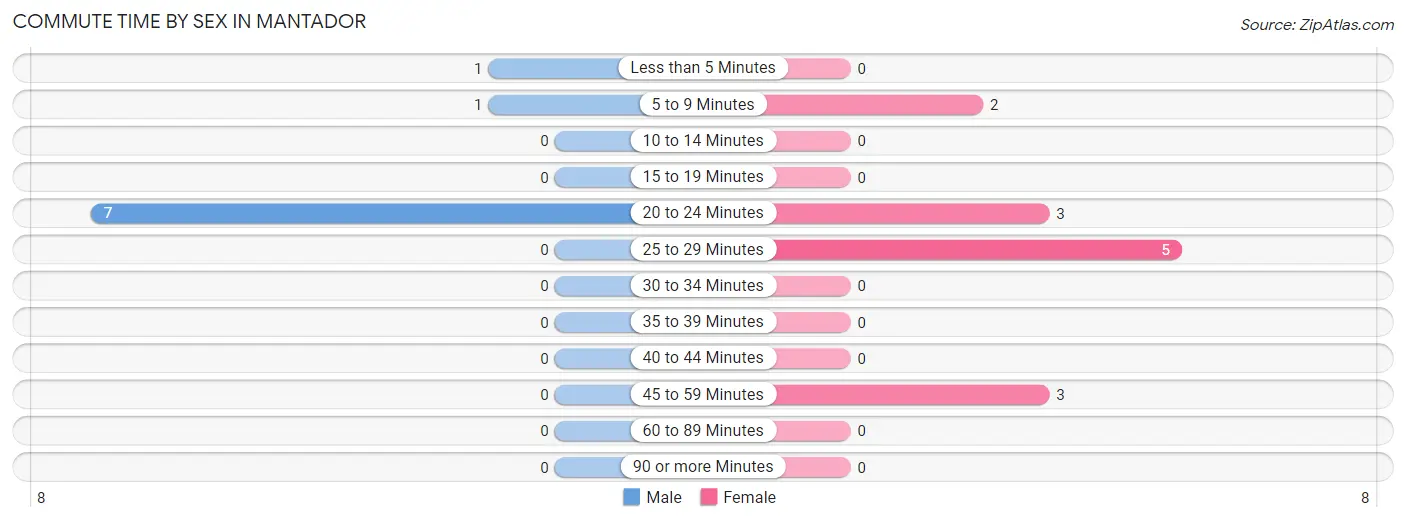
| Commute Time | Male | Female |
| Less than 5 Minutes | 1 (11.1%) | 0 (0.0%) |
| 5 to 9 Minutes | 1 (11.1%) | 2 (15.4%) |
| 10 to 14 Minutes | 0 (0.0%) | 0 (0.0%) |
| 15 to 19 Minutes | 0 (0.0%) | 0 (0.0%) |
| 20 to 24 Minutes | 7 (77.8%) | 3 (23.1%) |
| 25 to 29 Minutes | 0 (0.0%) | 5 (38.5%) |
| 30 to 34 Minutes | 0 (0.0%) | 0 (0.0%) |
| 35 to 39 Minutes | 0 (0.0%) | 0 (0.0%) |
| 40 to 44 Minutes | 0 (0.0%) | 0 (0.0%) |
| 45 to 59 Minutes | 0 (0.0%) | 3 (23.1%) |
| 60 to 89 Minutes | 0 (0.0%) | 0 (0.0%) |
| 90 or more Minutes | 0 (0.0%) | 0 (0.0%) |
Time of Departure to Work by Sex in Mantador
The most frequent times of departure to work in Mantador are 6:00 AM to 6:29 AM (8, 88.9%) for males and 5:30 AM to 5:59 AM (4, 30.8%) for females.
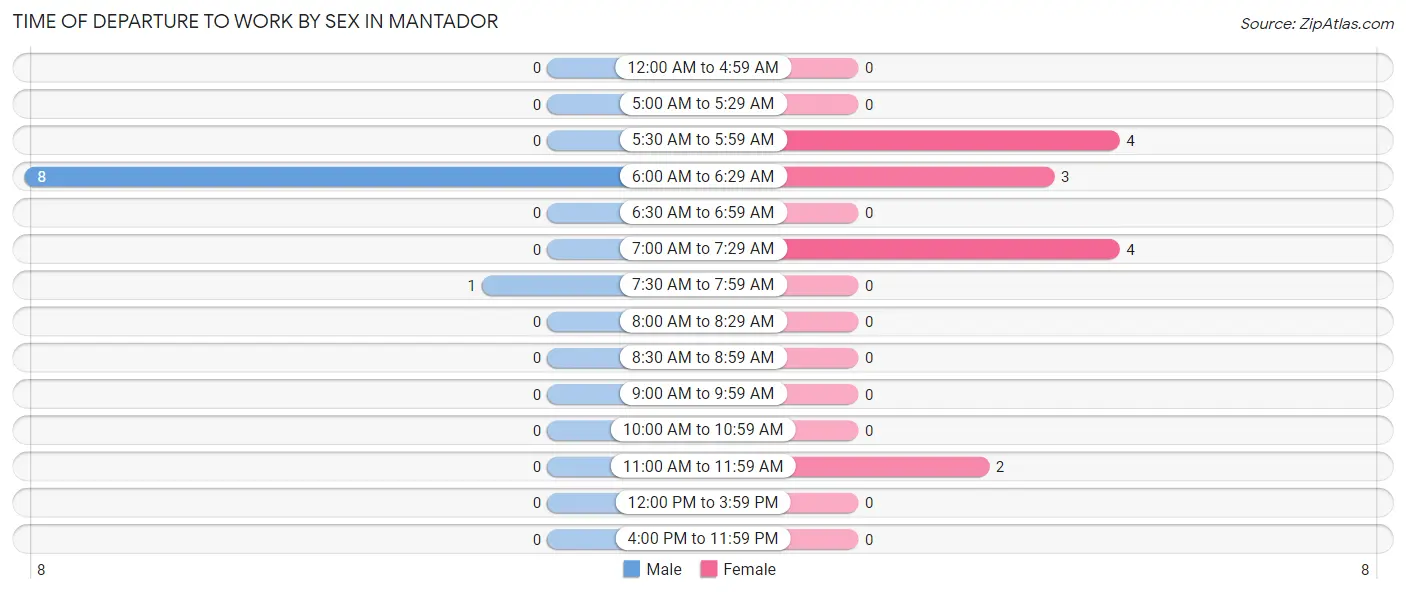
| Time of Departure | Male | Female |
| 12:00 AM to 4:59 AM | 0 (0.0%) | 0 (0.0%) |
| 5:00 AM to 5:29 AM | 0 (0.0%) | 0 (0.0%) |
| 5:30 AM to 5:59 AM | 0 (0.0%) | 4 (30.8%) |
| 6:00 AM to 6:29 AM | 8 (88.9%) | 3 (23.1%) |
| 6:30 AM to 6:59 AM | 0 (0.0%) | 0 (0.0%) |
| 7:00 AM to 7:29 AM | 0 (0.0%) | 4 (30.8%) |
| 7:30 AM to 7:59 AM | 1 (11.1%) | 0 (0.0%) |
| 8:00 AM to 8:29 AM | 0 (0.0%) | 0 (0.0%) |
| 8:30 AM to 8:59 AM | 0 (0.0%) | 0 (0.0%) |
| 9:00 AM to 9:59 AM | 0 (0.0%) | 0 (0.0%) |
| 10:00 AM to 10:59 AM | 0 (0.0%) | 0 (0.0%) |
| 11:00 AM to 11:59 AM | 0 (0.0%) | 2 (15.4%) |
| 12:00 PM to 3:59 PM | 0 (0.0%) | 0 (0.0%) |
| 4:00 PM to 11:59 PM | 0 (0.0%) | 0 (0.0%) |
| Total | 9 (100.0%) | 13 (100.0%) |
Housing Occupancy in Mantador
Occupancy by Ownership in Mantador
Of the total 24 dwellings in Mantador, owner-occupied units account for 24 (100.0%), while renter-occupied units make up 0 (0.0%).
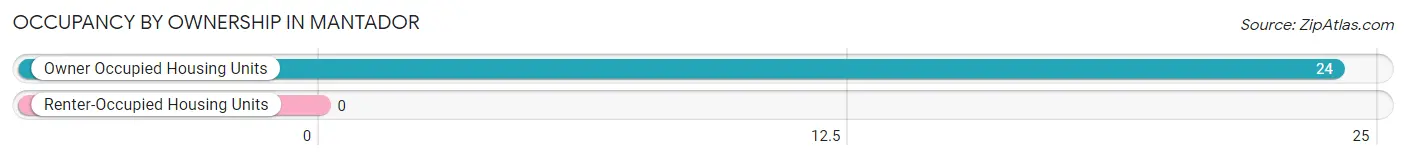
| Occupancy | # Housing Units | % Housing Units |
| Owner Occupied Housing Units | 24 | 100.0% |
| Renter-Occupied Housing Units | 0 | 0.0% |
| Total Occupied Housing Units | 24 | 100.0% |
Occupancy by Household Size in Mantador
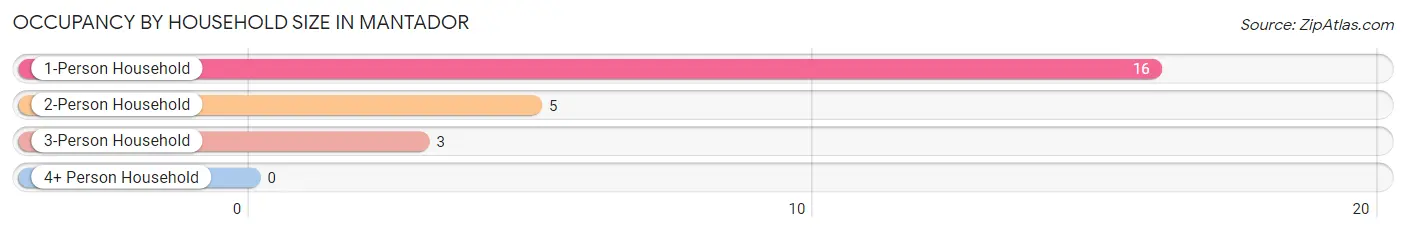
| Household Size | # Housing Units | % Housing Units |
| 1-Person Household | 16 | 66.7% |
| 2-Person Household | 5 | 20.8% |
| 3-Person Household | 3 | 12.5% |
| 4+ Person Household | 0 | 0.0% |
| Total Housing Units | 24 | 100.0% |
Occupancy by Ownership by Household Size in Mantador
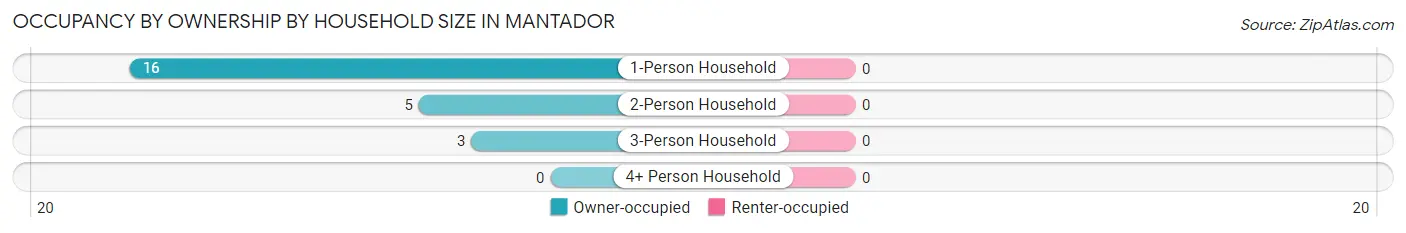
| Household Size | Owner-occupied | Renter-occupied |
| 1-Person Household | 16 (100.0%) | 0 (0.0%) |
| 2-Person Household | 5 (100.0%) | 0 (0.0%) |
| 3-Person Household | 3 (100.0%) | 0 (0.0%) |
| 4+ Person Household | 0 (0.0%) | 0 (0.0%) |
| Total Housing Units | 24 (100.0%) | 0 (0.0%) |
Occupancy by Educational Attainment in Mantador
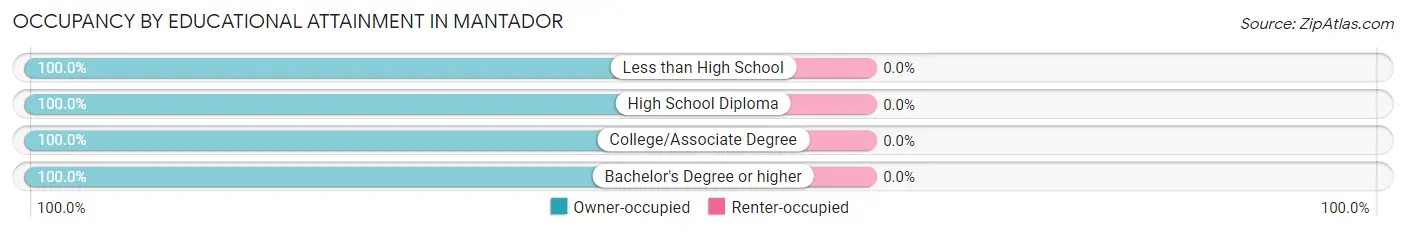
| Household Size | Owner-occupied | Renter-occupied |
| Less than High School | 2 (100.0%) | 0 (0.0%) |
| High School Diploma | 1 (100.0%) | 0 (0.0%) |
| College/Associate Degree | 17 (100.0%) | 0 (0.0%) |
| Bachelor's Degree or higher | 4 (100.0%) | 0 (0.0%) |
Occupancy by Age of Householder in Mantador
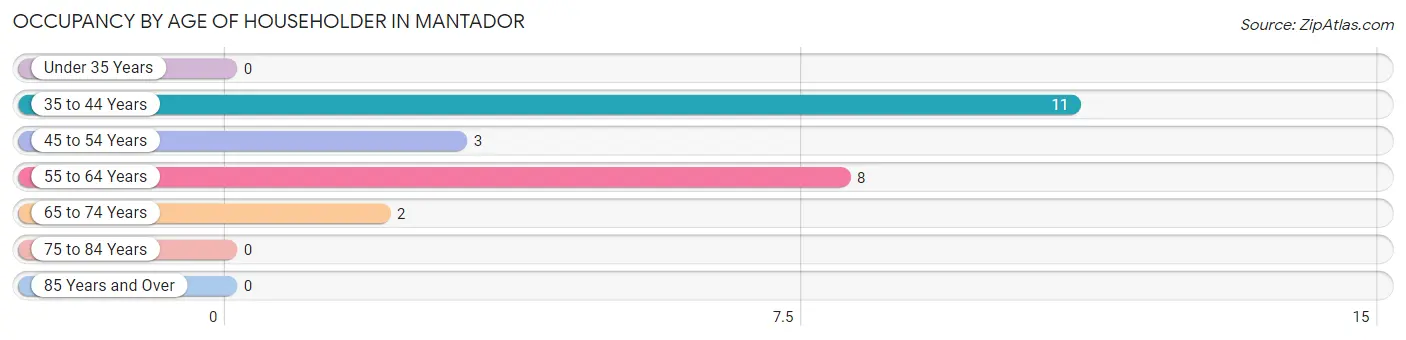
| Age Bracket | # Households | % Households |
| Under 35 Years | 0 | 0.0% |
| 35 to 44 Years | 11 | 45.8% |
| 45 to 54 Years | 3 | 12.5% |
| 55 to 64 Years | 8 | 33.3% |
| 65 to 74 Years | 2 | 8.3% |
| 75 to 84 Years | 0 | 0.0% |
| 85 Years and Over | 0 | 0.0% |
| Total | 24 | 100.0% |
Housing Finances in Mantador
Median Income by Occupancy in Mantador
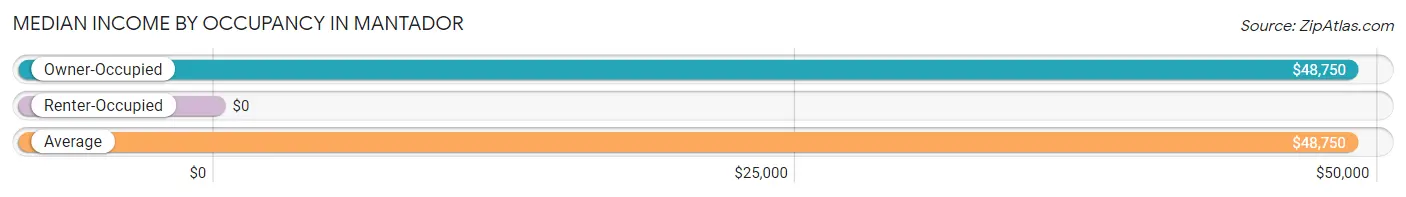
| Occupancy Type | # Households | Median Income |
| Owner-Occupied | 24 (100.0%) | $48,750 |
| Renter-Occupied | 0 (0.0%) | $0 |
| Average | 24 (100.0%) | $48,750 |
Occupancy by Householder Income Bracket in Mantador
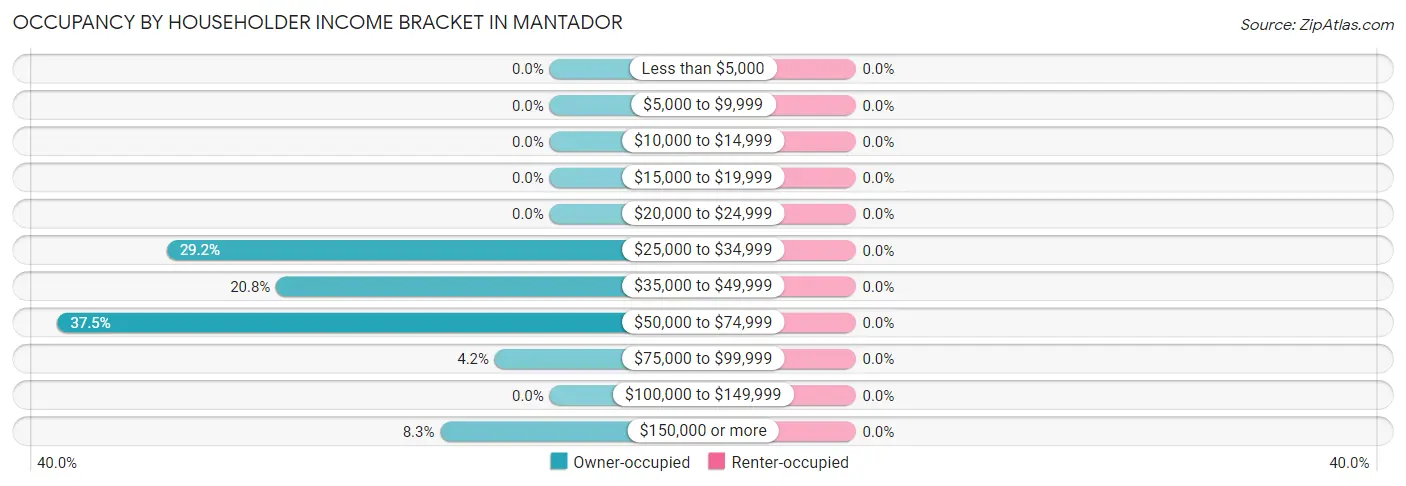
| Income Bracket | Owner-occupied | Renter-occupied |
| Less than $5,000 | 0 (0.0%) | 0 (0.0%) |
| $5,000 to $9,999 | 0 (0.0%) | 0 (0.0%) |
| $10,000 to $14,999 | 0 (0.0%) | 0 (0.0%) |
| $15,000 to $19,999 | 0 (0.0%) | 0 (0.0%) |
| $20,000 to $24,999 | 0 (0.0%) | 0 (0.0%) |
| $25,000 to $34,999 | 7 (29.2%) | 0 (0.0%) |
| $35,000 to $49,999 | 5 (20.8%) | 0 (0.0%) |
| $50,000 to $74,999 | 9 (37.5%) | 0 (0.0%) |
| $75,000 to $99,999 | 1 (4.2%) | 0 (0.0%) |
| $100,000 to $149,999 | 0 (0.0%) | 0 (0.0%) |
| $150,000 or more | 2 (8.3%) | 0 (0.0%) |
| Total | 24 (100.0%) | 0 (0.0%) |
Monthly Housing Cost Tiers in Mantador
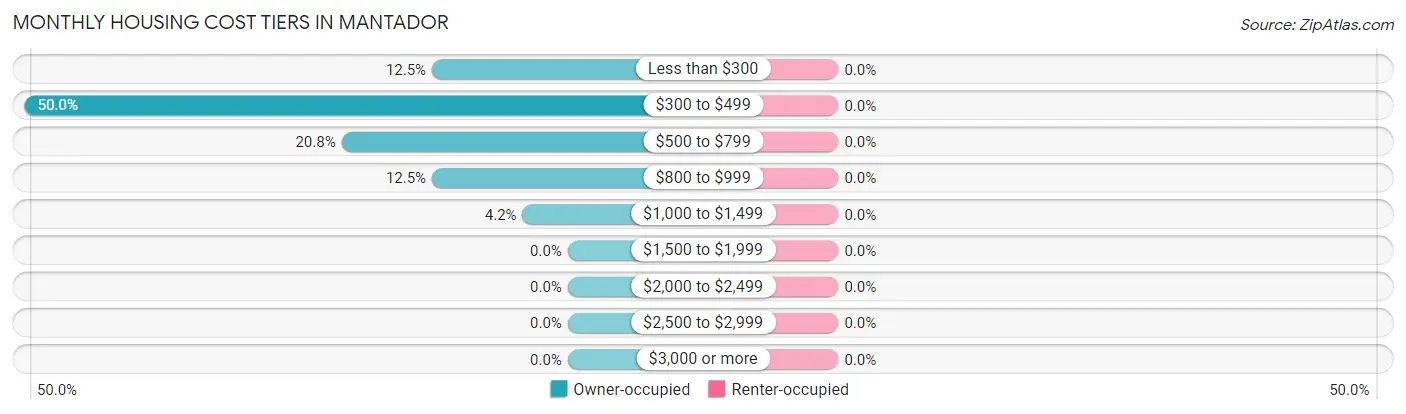
| Monthly Cost | Owner-occupied | Renter-occupied |
| Less than $300 | 3 (12.5%) | 0 (0.0%) |
| $300 to $499 | 12 (50.0%) | 0 (0.0%) |
| $500 to $799 | 5 (20.8%) | 0 (0.0%) |
| $800 to $999 | 3 (12.5%) | 0 (0.0%) |
| $1,000 to $1,499 | 1 (4.2%) | 0 (0.0%) |
| $1,500 to $1,999 | 0 (0.0%) | 0 (0.0%) |
| $2,000 to $2,499 | 0 (0.0%) | 0 (0.0%) |
| $2,500 to $2,999 | 0 (0.0%) | 0 (0.0%) |
| $3,000 or more | 0 (0.0%) | 0 (0.0%) |
| Total | 24 (100.0%) | 0 (0.0%) |
Physical Housing Characteristics in Mantador
Housing Structures in Mantador
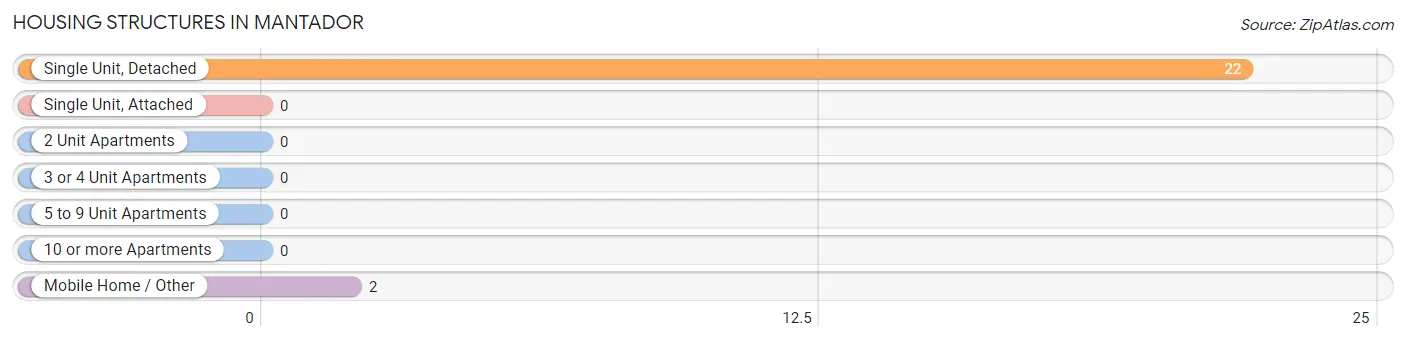
| Structure Type | # Housing Units | % Housing Units |
| Single Unit, Detached | 22 | 91.7% |
| Single Unit, Attached | 0 | 0.0% |
| 2 Unit Apartments | 0 | 0.0% |
| 3 or 4 Unit Apartments | 0 | 0.0% |
| 5 to 9 Unit Apartments | 0 | 0.0% |
| 10 or more Apartments | 0 | 0.0% |
| Mobile Home / Other | 2 | 8.3% |
| Total | 24 | 100.0% |
Housing Structures by Occupancy in Mantador
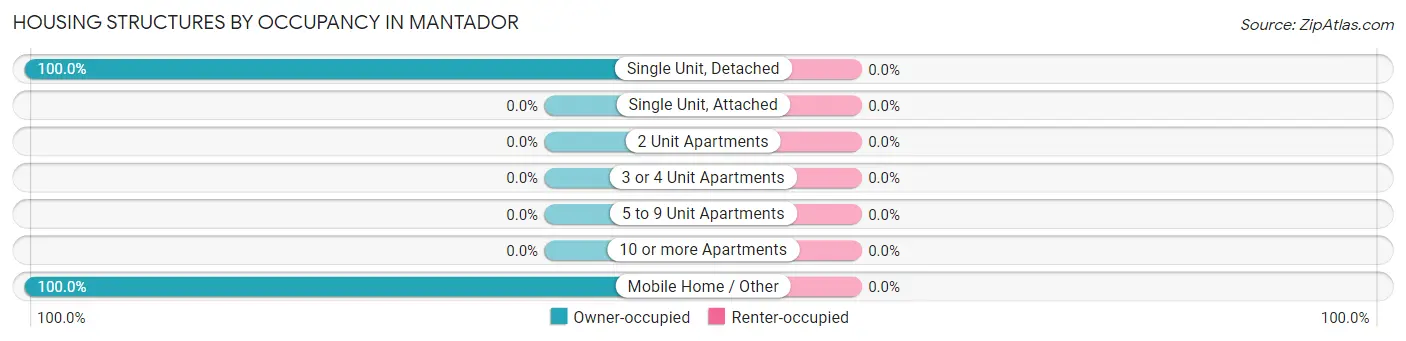
| Structure Type | Owner-occupied | Renter-occupied |
| Single Unit, Detached | 22 (100.0%) | 0 (0.0%) |
| Single Unit, Attached | 0 (0.0%) | 0 (0.0%) |
| 2 Unit Apartments | 0 (0.0%) | 0 (0.0%) |
| 3 or 4 Unit Apartments | 0 (0.0%) | 0 (0.0%) |
| 5 to 9 Unit Apartments | 0 (0.0%) | 0 (0.0%) |
| 10 or more Apartments | 0 (0.0%) | 0 (0.0%) |
| Mobile Home / Other | 2 (100.0%) | 0 (0.0%) |
| Total | 24 (100.0%) | 0 (0.0%) |
Housing Structures by Number of Rooms in Mantador
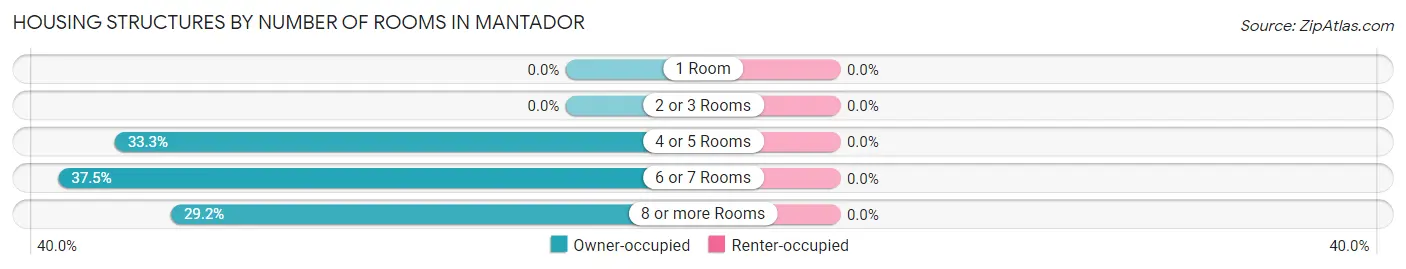
| Number of Rooms | Owner-occupied | Renter-occupied |
| 1 Room | 0 (0.0%) | 0 (0.0%) |
| 2 or 3 Rooms | 0 (0.0%) | 0 (0.0%) |
| 4 or 5 Rooms | 8 (33.3%) | 0 (0.0%) |
| 6 or 7 Rooms | 9 (37.5%) | 0 (0.0%) |
| 8 or more Rooms | 7 (29.2%) | 0 (0.0%) |
| Total | 24 (100.0%) | 0 (0.0%) |
Housing Structure by Heating Type in Mantador
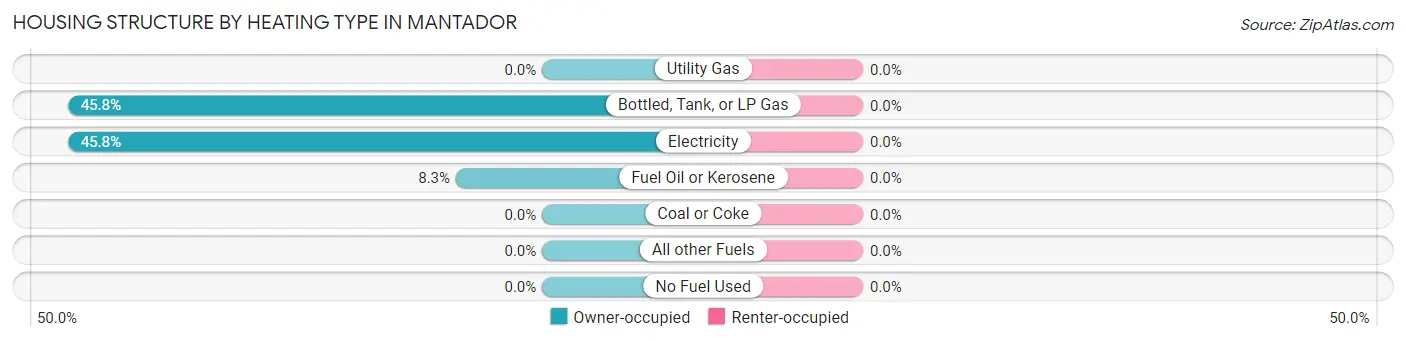
| Heating Type | Owner-occupied | Renter-occupied |
| Utility Gas | 0 (0.0%) | 0 (0.0%) |
| Bottled, Tank, or LP Gas | 11 (45.8%) | 0 (0.0%) |
| Electricity | 11 (45.8%) | 0 (0.0%) |
| Fuel Oil or Kerosene | 2 (8.3%) | 0 (0.0%) |
| Coal or Coke | 0 (0.0%) | 0 (0.0%) |
| All other Fuels | 0 (0.0%) | 0 (0.0%) |
| No Fuel Used | 0 (0.0%) | 0 (0.0%) |
| Total | 24 (100.0%) | 0 (0.0%) |
Household Vehicle Usage in Mantador
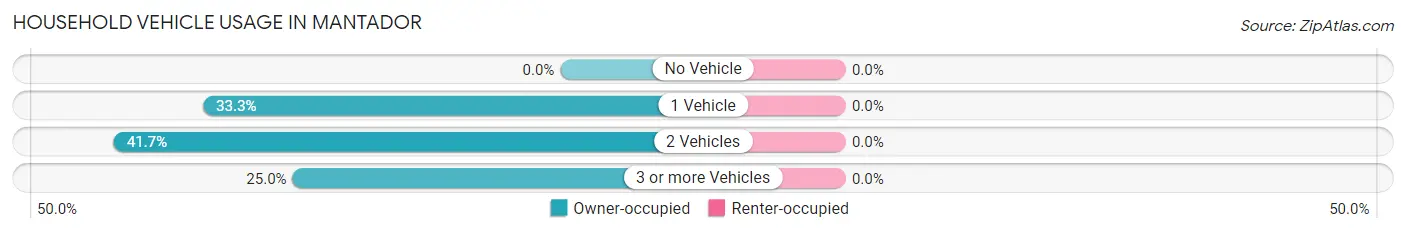
| Vehicles per Household | Owner-occupied | Renter-occupied |
| No Vehicle | 0 (0.0%) | 0 (0.0%) |
| 1 Vehicle | 8 (33.3%) | 0 (0.0%) |
| 2 Vehicles | 10 (41.7%) | 0 (0.0%) |
| 3 or more Vehicles | 6 (25.0%) | 0 (0.0%) |
| Total | 24 (100.0%) | 0 (0.0%) |
Real Estate & Mortgages in Mantador
Real Estate and Mortgage Overview in Mantador
| Characteristic | Without Mortgage | With Mortgage |
| Housing Units | 19 | 5 |
| Median Property Value | $32,500 | $85,000 |
| Median Household Income | $50,179 | $0 |
| Monthly Housing Costs | $395 | $0 |
| Real Estate Taxes | $475 | $0 |
Property Value by Mortgage Status in Mantador
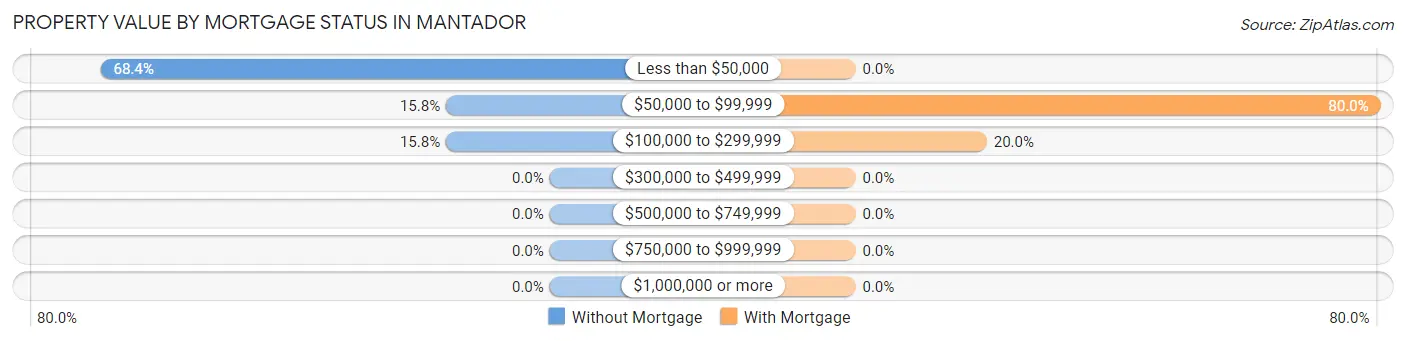
| Property Value | Without Mortgage | With Mortgage |
| Less than $50,000 | 13 (68.4%) | 0 (0.0%) |
| $50,000 to $99,999 | 3 (15.8%) | 4 (80.0%) |
| $100,000 to $299,999 | 3 (15.8%) | 1 (20.0%) |
| $300,000 to $499,999 | 0 (0.0%) | 0 (0.0%) |
| $500,000 to $749,999 | 0 (0.0%) | 0 (0.0%) |
| $750,000 to $999,999 | 0 (0.0%) | 0 (0.0%) |
| $1,000,000 or more | 0 (0.0%) | 0 (0.0%) |
| Total | 19 (100.0%) | 5 (100.0%) |
Household Income by Mortgage Status in Mantador
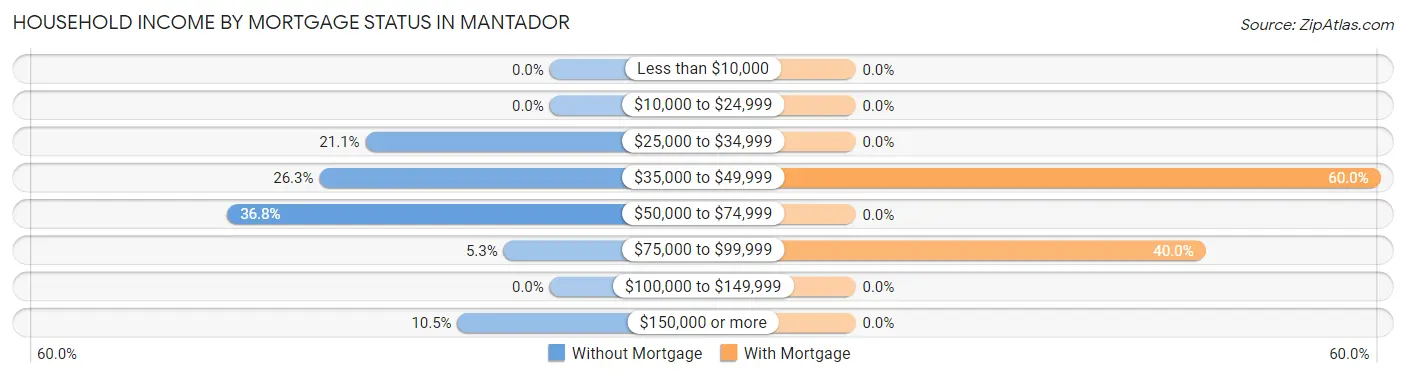
| Household Income | Without Mortgage | With Mortgage |
| Less than $10,000 | 0 (0.0%) | 0 (0.0%) |
| $10,000 to $24,999 | 0 (0.0%) | 0 (0.0%) |
| $25,000 to $34,999 | 4 (21.0%) | 0 (0.0%) |
| $35,000 to $49,999 | 5 (26.3%) | 3 (60.0%) |
| $50,000 to $74,999 | 7 (36.8%) | 0 (0.0%) |
| $75,000 to $99,999 | 1 (5.3%) | 2 (40.0%) |
| $100,000 to $149,999 | 0 (0.0%) | 0 (0.0%) |
| $150,000 or more | 2 (10.5%) | 0 (0.0%) |
| Total | 19 (100.0%) | 5 (100.0%) |
Property Value to Household Income Ratio in Mantador
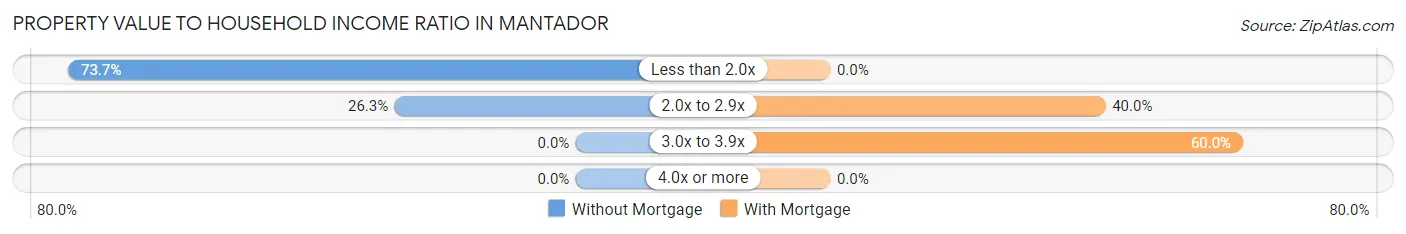
| Value-to-Income Ratio | Without Mortgage | With Mortgage |
| Less than 2.0x | 14 (73.7%) | 0 (0.0%) |
| 2.0x to 2.9x | 5 (26.3%) | 2 (40.0%) |
| 3.0x to 3.9x | 0 (0.0%) | 3 (60.0%) |
| 4.0x or more | 0 (0.0%) | 0 (0.0%) |
| Total | 19 (100.0%) | 5 (100.0%) |
Real Estate Taxes by Mortgage Status in Mantador
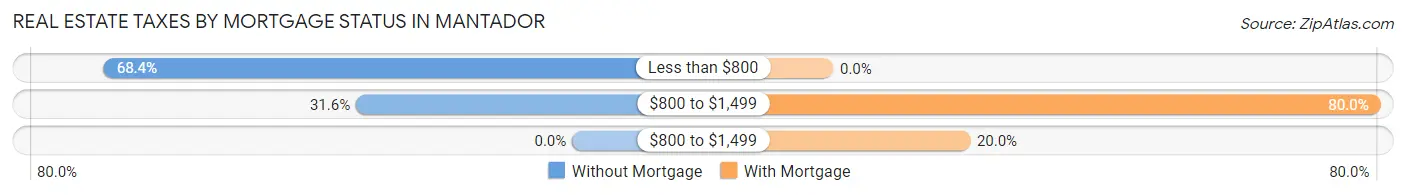
| Property Taxes | Without Mortgage | With Mortgage |
| Less than $800 | 13 (68.4%) | 0 (0.0%) |
| $800 to $1,499 | 6 (31.6%) | 4 (80.0%) |
| $800 to $1,499 | 0 (0.0%) | 1 (20.0%) |
| Total | 19 (100.0%) | 5 (100.0%) |
Health & Disability in Mantador
Health Insurance Coverage by Age in Mantador
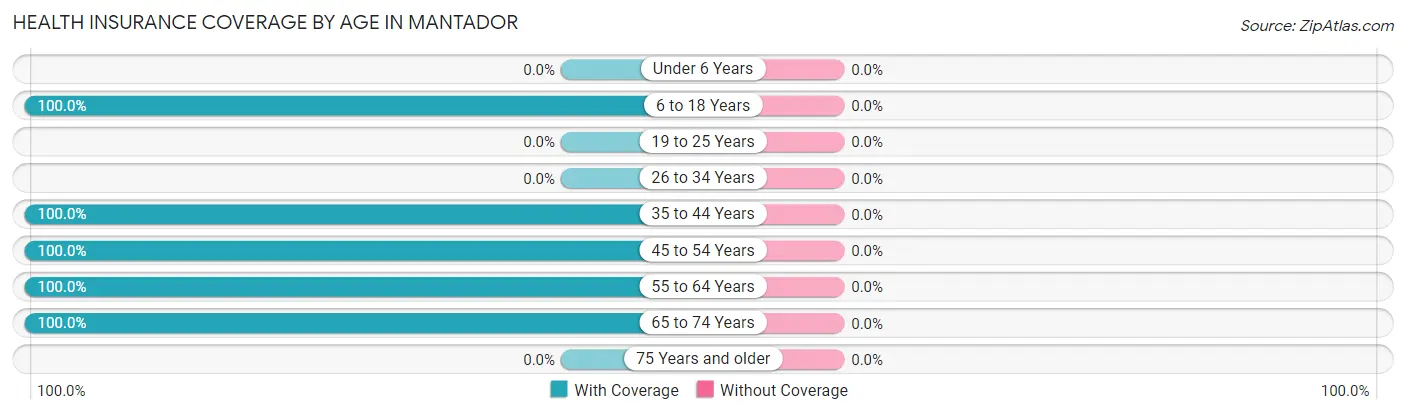
| Age Bracket | With Coverage | Without Coverage |
| Under 6 Years | 0 (0.0%) | 0 (0.0%) |
| 6 to 18 Years | 8 (100.0%) | 0 (0.0%) |
| 19 to 25 Years | 0 (0.0%) | 0 (0.0%) |
| 26 to 34 Years | 0 (0.0%) | 0 (0.0%) |
| 35 to 44 Years | 11 (100.0%) | 0 (0.0%) |
| 45 to 54 Years | 4 (100.0%) | 0 (0.0%) |
| 55 to 64 Years | 8 (100.0%) | 0 (0.0%) |
| 65 to 74 Years | 3 (100.0%) | 0 (0.0%) |
| 75 Years and older | 0 (0.0%) | 0 (0.0%) |
| Total | 34 (100.0%) | 0 (0.0%) |
Health Insurance Coverage by Citizenship Status in Mantador
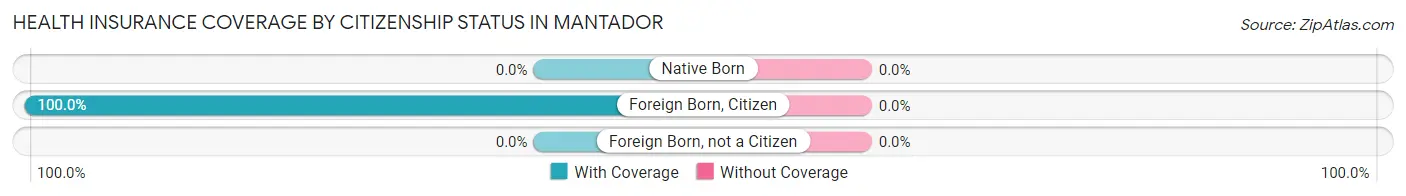
| Citizenship Status | With Coverage | Without Coverage |
| Native Born | 0 (0.0%) | 0 (0.0%) |
| Foreign Born, Citizen | 8 (100.0%) | 0 (0.0%) |
| Foreign Born, not a Citizen | 0 (0.0%) | 0 (0.0%) |
Health Insurance Coverage by Household Income in Mantador
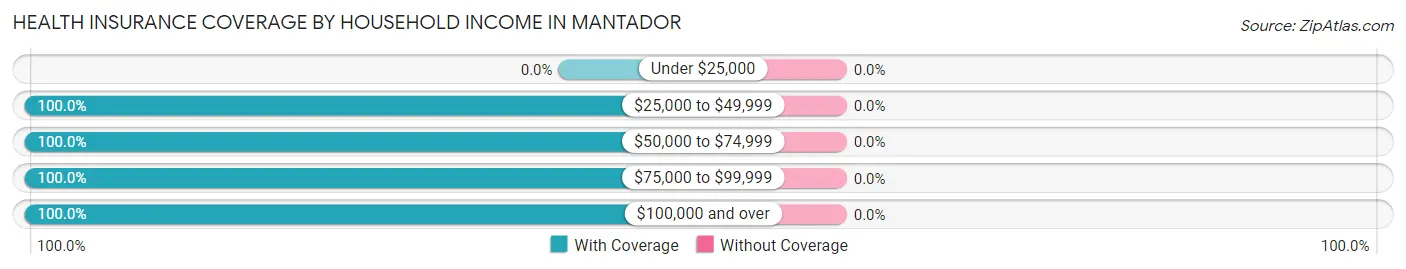
| Household Income | With Coverage | Without Coverage |
| Under $25,000 | 0 (0.0%) | 0 (0.0%) |
| $25,000 to $49,999 | 13 (100.0%) | 0 (0.0%) |
| $50,000 to $74,999 | 16 (100.0%) | 0 (0.0%) |
| $75,000 to $99,999 | 1 (100.0%) | 0 (0.0%) |
| $100,000 and over | 4 (100.0%) | 0 (0.0%) |
Public vs Private Health Insurance Coverage by Age in Mantador
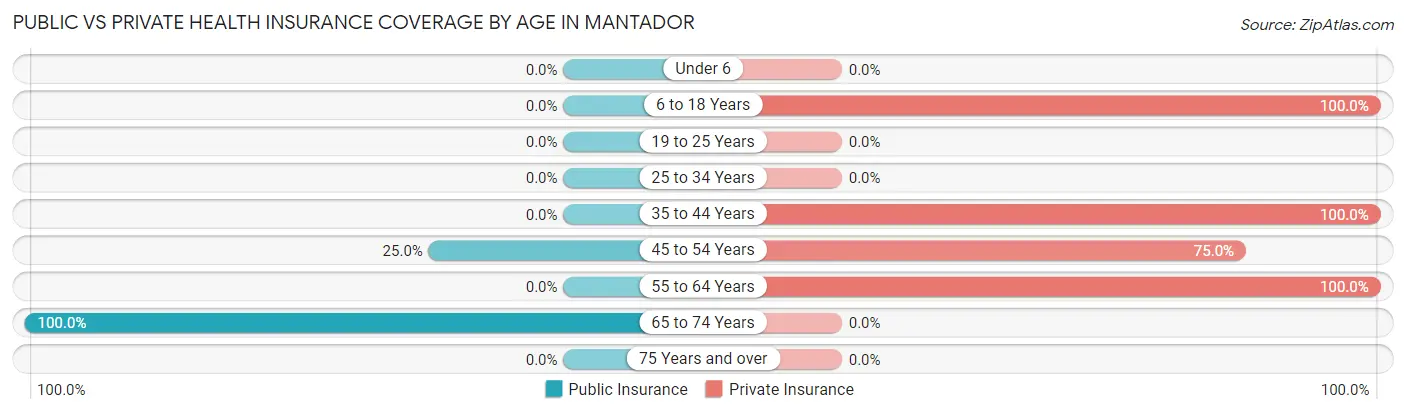
| Age Bracket | Public Insurance | Private Insurance |
| Under 6 | 0 (0.0%) | 0 (0.0%) |
| 6 to 18 Years | 0 (0.0%) | 8 (100.0%) |
| 19 to 25 Years | 0 (0.0%) | 0 (0.0%) |
| 25 to 34 Years | 0 (0.0%) | 0 (0.0%) |
| 35 to 44 Years | 0 (0.0%) | 11 (100.0%) |
| 45 to 54 Years | 1 (25.0%) | 3 (75.0%) |
| 55 to 64 Years | 0 (0.0%) | 8 (100.0%) |
| 65 to 74 Years | 3 (100.0%) | 0 (0.0%) |
| 75 Years and over | 0 (0.0%) | 0 (0.0%) |
| Total | 4 (11.8%) | 30 (88.2%) |
Disability Status by Sex by Age in Mantador
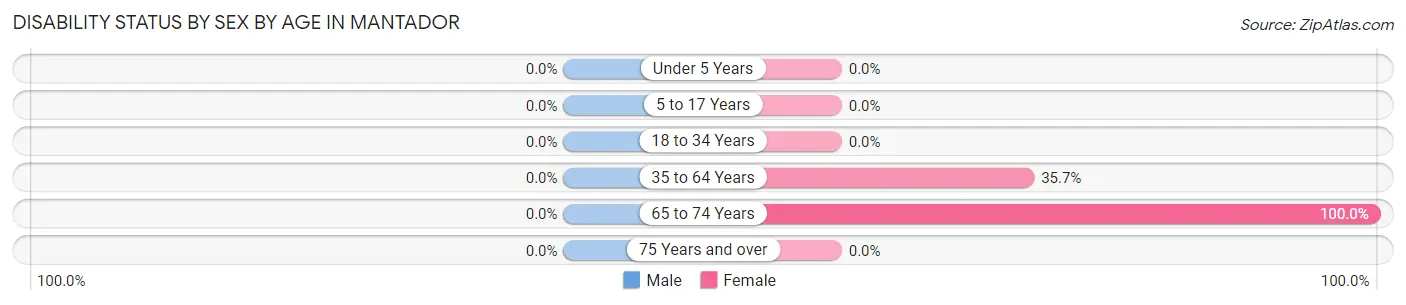
| Age Bracket | Male | Female |
| Under 5 Years | 0 (0.0%) | 0 (0.0%) |
| 5 to 17 Years | 0 (0.0%) | 0 (0.0%) |
| 18 to 34 Years | 0 (0.0%) | 0 (0.0%) |
| 35 to 64 Years | 0 (0.0%) | 5 (35.7%) |
| 65 to 74 Years | 0 (0.0%) | 1 (100.0%) |
| 75 Years and over | 0 (0.0%) | 0 (0.0%) |
Disability Class by Sex by Age in Mantador
Disability Class: Hearing Difficulty
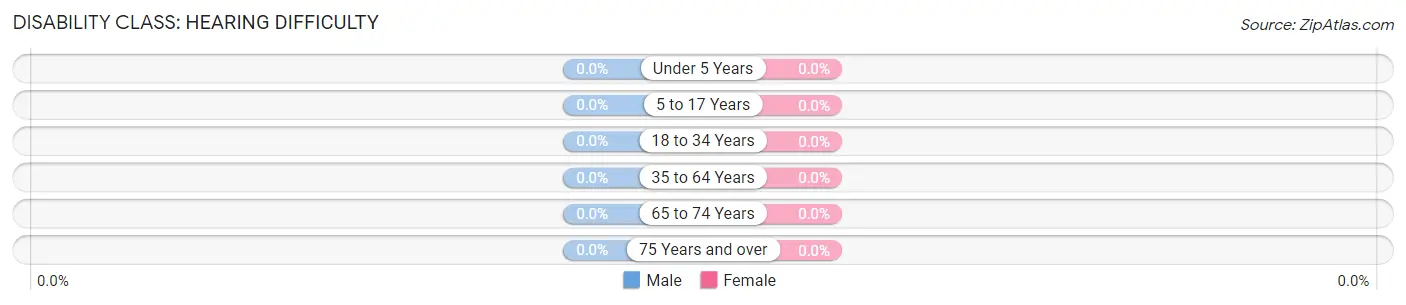
| Age Bracket | Male | Female |
| Under 5 Years | 0 (0.0%) | 0 (0.0%) |
| 5 to 17 Years | 0 (0.0%) | 0 (0.0%) |
| 18 to 34 Years | 0 (0.0%) | 0 (0.0%) |
| 35 to 64 Years | 0 (0.0%) | 0 (0.0%) |
| 65 to 74 Years | 0 (0.0%) | 0 (0.0%) |
| 75 Years and over | 0 (0.0%) | 0 (0.0%) |
Disability Class: Vision Difficulty
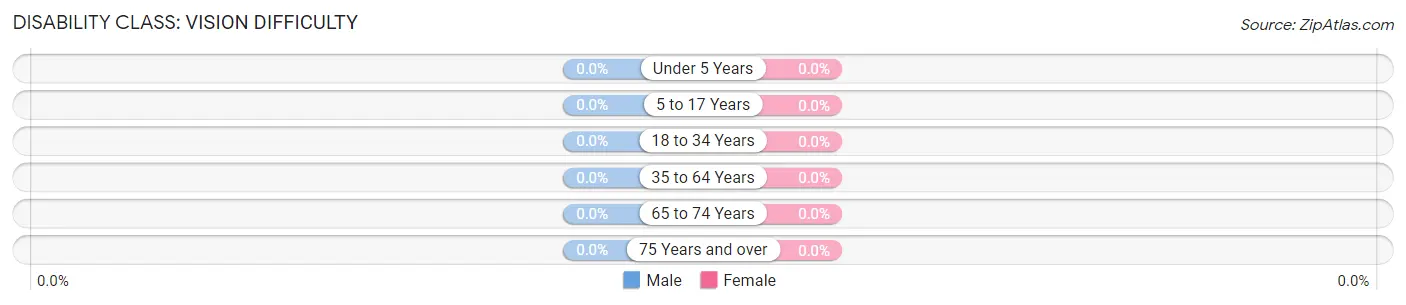
| Age Bracket | Male | Female |
| Under 5 Years | 0 (0.0%) | 0 (0.0%) |
| 5 to 17 Years | 0 (0.0%) | 0 (0.0%) |
| 18 to 34 Years | 0 (0.0%) | 0 (0.0%) |
| 35 to 64 Years | 0 (0.0%) | 0 (0.0%) |
| 65 to 74 Years | 0 (0.0%) | 0 (0.0%) |
| 75 Years and over | 0 (0.0%) | 0 (0.0%) |
Disability Class: Cognitive Difficulty
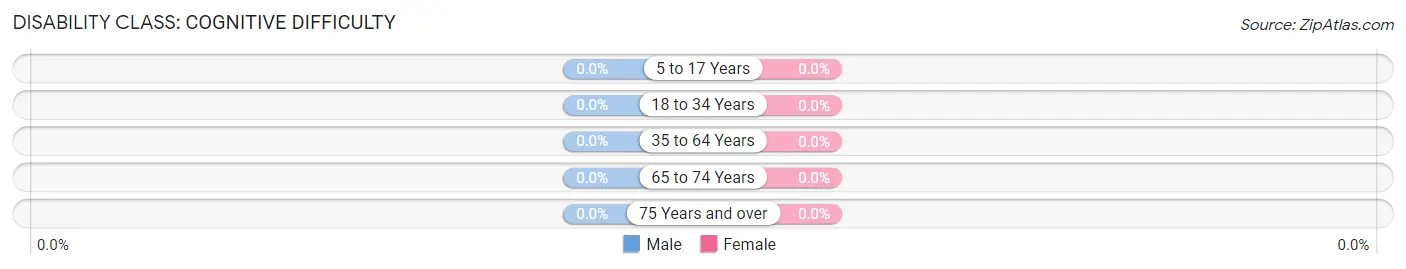
| Age Bracket | Male | Female |
| 5 to 17 Years | 0 (0.0%) | 0 (0.0%) |
| 18 to 34 Years | 0 (0.0%) | 0 (0.0%) |
| 35 to 64 Years | 0 (0.0%) | 0 (0.0%) |
| 65 to 74 Years | 0 (0.0%) | 0 (0.0%) |
| 75 Years and over | 0 (0.0%) | 0 (0.0%) |
Disability Class: Ambulatory Difficulty
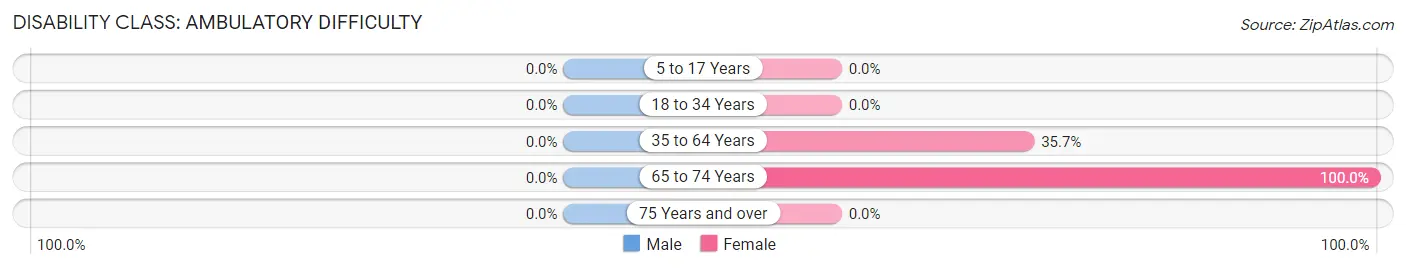
| Age Bracket | Male | Female |
| 5 to 17 Years | 0 (0.0%) | 0 (0.0%) |
| 18 to 34 Years | 0 (0.0%) | 0 (0.0%) |
| 35 to 64 Years | 0 (0.0%) | 5 (35.7%) |
| 65 to 74 Years | 0 (0.0%) | 1 (100.0%) |
| 75 Years and over | 0 (0.0%) | 0 (0.0%) |
Disability Class: Self-Care Difficulty
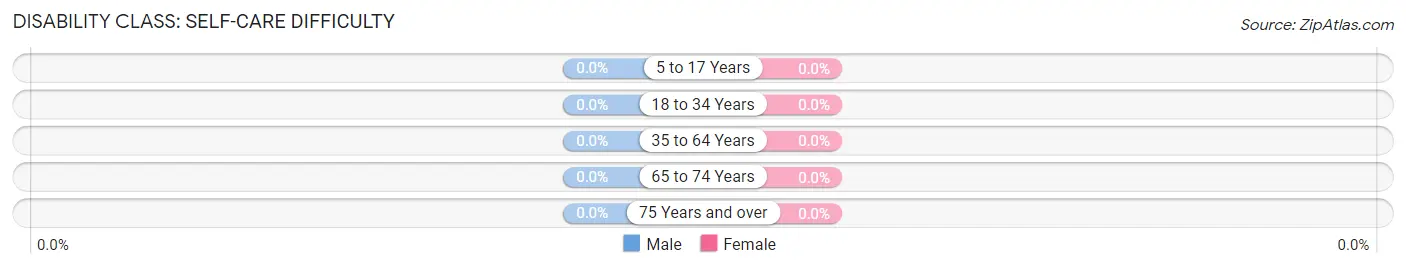
| Age Bracket | Male | Female |
| 5 to 17 Years | 0 (0.0%) | 0 (0.0%) |
| 18 to 34 Years | 0 (0.0%) | 0 (0.0%) |
| 35 to 64 Years | 0 (0.0%) | 0 (0.0%) |
| 65 to 74 Years | 0 (0.0%) | 0 (0.0%) |
| 75 Years and over | 0 (0.0%) | 0 (0.0%) |
Technology Access in Mantador
Computing Device Access in Mantador
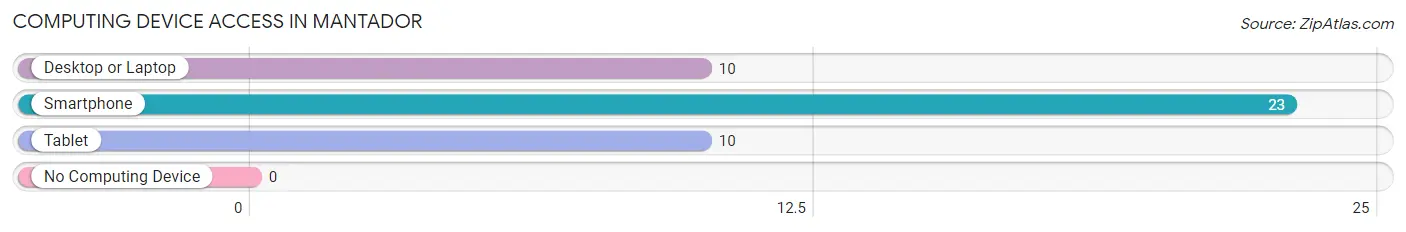
| Device Type | # Households | % Households |
| Desktop or Laptop | 10 | 41.7% |
| Smartphone | 23 | 95.8% |
| Tablet | 10 | 41.7% |
| No Computing Device | 0 | 0.0% |
| Total | 24 | 100.0% |
Internet Access in Mantador
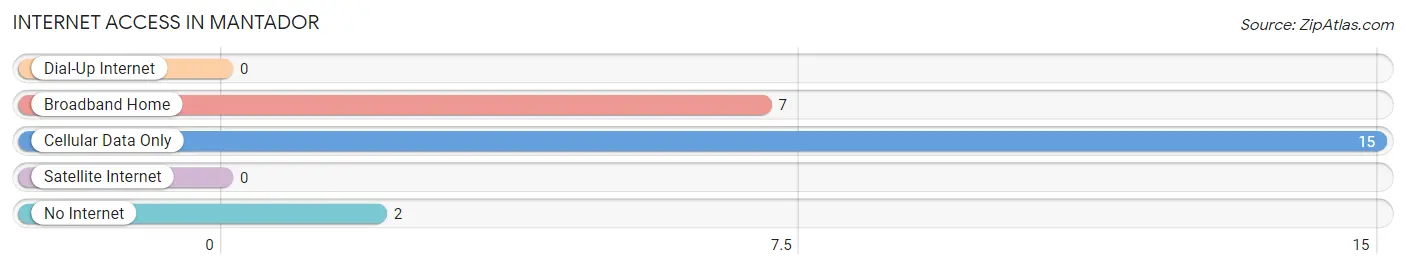
| Internet Type | # Households | % Households |
| Dial-Up Internet | 0 | 0.0% |
| Broadband Home | 7 | 29.2% |
| Cellular Data Only | 15 | 62.5% |
| Satellite Internet | 0 | 0.0% |
| No Internet | 2 | 8.3% |
| Total | 24 | 100.0% |
Mantador Summary
Mantador is a small city located in the southeastern corner of North Dakota, United States. It is situated in the Red River Valley, a flat, fertile region of the Great Plains. The city is located in Richland County, and is part of the Wahpeton-Breckenridge Micropolitan Statistical Area. As of the 2010 census, the population of Mantador was 1,093.
Geography
Mantador is located at 46°25'25" North, 96°45'45" West (46.423, -96.7625). The city is situated in the Red River Valley, a flat, fertile region of the Great Plains. The city is located in Richland County, and is part of the Wahpeton-Breckenridge Micropolitan Statistical Area. The city is located on the banks of the Red River, which forms the border between North Dakota and Minnesota.
The city has a total area of 0.9 square miles, all of which is land. The city is located in the Central Time Zone.
Demographics
As of the 2010 census, there were 1,093 people, 441 households, and 287 families residing in the city. The population density was 1,213.3 people per square mile. There were 486 housing units at an average density of 537.8 per square mile. The racial makeup of the city was 97.2% White, 0.2% African American, 0.2% Native American, 0.2% Asian, 0.2% from other races, and 1.9% from two or more races. Hispanic or Latino of any race were 1.2% of the population.
There were 441 households, out of which 28.2% had children under the age of 18 living with them, 51.6% were married couples living together, 8.6% had a female householder with no husband present, and 36.2% were non-families. 32.2% of all households were made up of individuals, and 16.3% had someone living alone who was 65 years of age or older. The average household size was 2.37 and the average family size was 2.99.
The median age in the city was 41.2 years. 24.2% of residents were under the age of 18; 6.3% were between the ages of 18 and 24; 22.7% were from 25 to 44; 25.3% were from 45 to 64; and 21.5% were 65 years of age or older. The gender makeup of the city was 48.2% male and 51.8% female.
Economy
Mantador is a small city with a limited economy. The city is home to several small businesses, including a grocery store, a hardware store, a restaurant, and a few other small shops. The city also has a few manufacturing plants, including a plastics factory and a metal fabrication plant.
The city is also home to a large agricultural industry. The city is located in the heart of the Red River Valley, which is one of the most productive agricultural regions in the United States. The city is home to several large farms, which produce a variety of crops, including wheat, corn, soybeans, and sugar beets.
The city is also home to a large oil and gas industry. The city is located in the heart of the Bakken Formation, which is one of the largest oil and gas fields in the United States. The city is home to several oil and gas companies, which are responsible for the extraction and production of oil and gas in the region.
Conclusion
Mantador is a small city located in the southeastern corner of North Dakota. The city is situated in the Red River Valley, a flat, fertile region of the Great Plains. The city is home to a small population of 1,093 people, as of the 2010 census. The city has a limited economy, with several small businesses, manufacturing plants, and a large agricultural and oil and gas industry.
Common Questions
What is Per Capita Income in Mantador?
Per Capita income in Mantador is $41,621.
What is the Median Family Income in Mantador?
Median Family Income in Mantador is $51,667.
What is the Median Household income in Mantador?
Median Household Income in Mantador is $48,750.
What is Inequality or Gini Index in Mantador?
Inequality or Gini Index in Mantador is 0.31.
What is the Total Population of Mantador?
Total Population of Mantador is 34.
What is the Total Male Population of Mantador?
Total Male Population of Mantador is 13.
What is the Total Female Population of Mantador?
Total Female Population of Mantador is 21.
What is the Ratio of Males per 100 Females in Mantador?
There are 61.90 Males per 100 Females in Mantador.
What is the Ratio of Females per 100 Males in Mantador?
There are 161.54 Females per 100 Males in Mantador.
What is the Median Population Age in Mantador?
Median Population Age in Mantador is 42.6 Years.
What is the Average Family Size in Mantador
Average Family Size in Mantador is 2.2 People.
What is the Average Household Size in Mantador
Average Household Size in Mantador is 1.4 People.
How Large is the Labor Force in Mantador?
There are 22 People in the Labor Forcein in Mantador.
What is the Percentage of People in the Labor Force in Mantador?
84.6% of People are in the Labor Force in Mantador.