Zip Codes with the Highest Percentage of Population Employed in Life, Physical & Social Science in North Dakota
RELATED REPORTS & OPTIONS
Life, Physical & Social Science
North Dakota
Compare Zip Codes
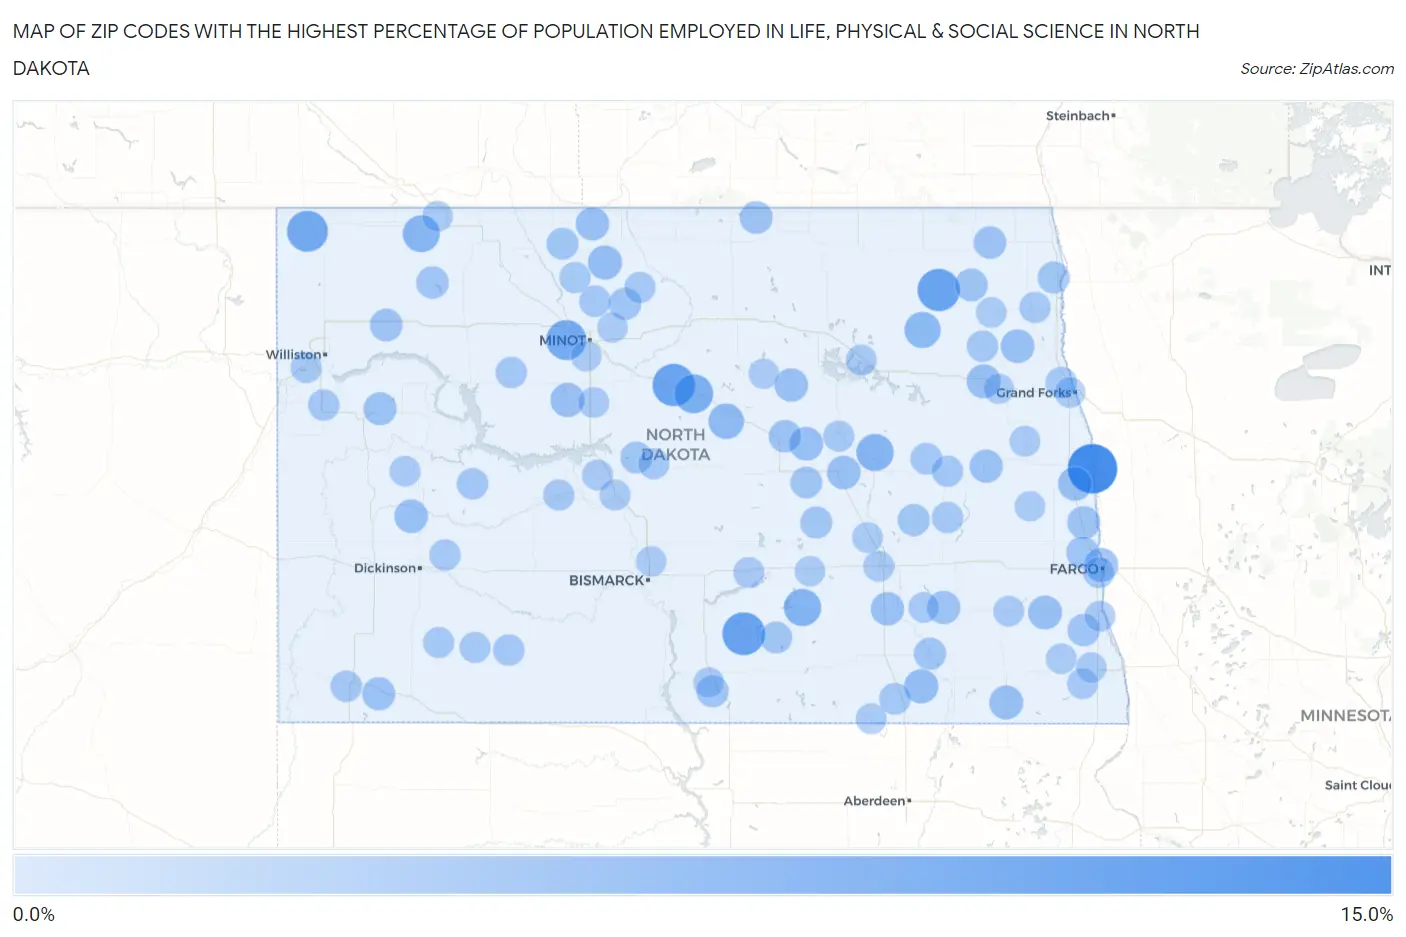
Map of Zip Codes with the Highest Percentage of Population Employed in Life, Physical & Social Science in North Dakota
0.0%
15.0%
Zip Codes with the Highest Percentage of Population Employed in Life, Physical & Social Science in North Dakota
| Zip Code | % Employed | vs State | vs National | |
| 1. | 58219 | 14.7% | 0.93%(+13.8)#1 | 1.1%(+13.6)#105 |
| 2. | 58549 | 9.9% | 0.93%(+9.00)#2 | 1.1%(+8.84)#213 |
| 3. | 58712 | 9.5% | 0.93%(+8.60)#3 | 1.1%(+8.43)#225 |
| 4. | 58229 | 9.5% | 0.93%(+8.60)#4 | 1.1%(+8.43)#226 |
| 5. | 58844 | 8.5% | 0.93%(+7.55)#5 | 1.1%(+7.38)#288 |
| 6. | 58722 | 7.9% | 0.93%(+6.93)#6 | 1.1%(+6.77)#333 |
| 7. | 58736 | 7.0% | 0.93%(+6.06)#7 | 1.1%(+5.90)#408 |
| 8. | 58483 | 5.8% | 0.93%(+4.92)#8 | 1.1%(+4.76)#564 |
| 9. | 58445 | 5.8% | 0.93%(+4.89)#9 | 1.1%(+4.72)#574 |
| 10. | 58727 | 5.7% | 0.93%(+4.73)#10 | 1.1%(+4.57)#597 |
| 11. | 58345 | 5.1% | 0.93%(+4.17)#11 | 1.1%(+4.01)#737 |
| 12. | 58758 | 4.6% | 0.93%(+3.66)#12 | 1.1%(+3.50)#891 |
| 13. | 58760 | 3.7% | 0.93%(+2.78)#13 | 1.1%(+2.61)#1,314 |
| 14. | 58441 | 3.7% | 0.93%(+2.75)#14 | 1.1%(+2.59)#1,328 |
| 15. | 58735 | 3.6% | 0.93%(+2.70)#15 | 1.1%(+2.54)#1,357 |
| 16. | 58266 | 3.6% | 0.93%(+2.69)#16 | 1.1%(+2.52)#1,362 |
| 17. | 58032 | 3.6% | 0.93%(+2.62)#17 | 1.1%(+2.46)#1,390 |
| 18. | 58045 | 3.5% | 0.93%(+2.60)#18 | 1.1%(+2.43)#1,409 |
| 19. | 58052 | 3.4% | 0.93%(+2.51)#19 | 1.1%(+2.35)#1,469 |
| 20. | 58105 | 3.4% | 0.93%(+2.51)#20 | 1.1%(+2.34)#1,474 |
| 21. | 58422 | 3.4% | 0.93%(+2.48)#21 | 1.1%(+2.32)#1,497 |
| 22. | 58233 | 3.4% | 0.93%(+2.45)#22 | 1.1%(+2.29)#1,514 |
| 23. | 58421 | 3.3% | 0.93%(+2.37)#23 | 1.1%(+2.20)#1,586 |
| 24. | 58642 | 3.3% | 0.93%(+2.35)#24 | 1.1%(+2.19)#1,603 |
| 25. | 58348 | 3.2% | 0.93%(+2.28)#25 | 1.1%(+2.11)#1,664 |
| 26. | 58711 | 3.2% | 0.93%(+2.23)#26 | 1.1%(+2.07)#1,699 |
| 27. | 58472 | 3.1% | 0.93%(+2.20)#27 | 1.1%(+2.03)#1,727 |
| 28. | 58230 | 3.1% | 0.93%(+2.15)#28 | 1.1%(+1.99)#1,780 |
| 29. | 58461 | 3.0% | 0.93%(+2.09)#29 | 1.1%(+1.92)#1,860 |
| 30. | 58653 | 2.9% | 0.93%(+1.99)#30 | 1.1%(+1.83)#1,975 |
| 31. | 58854 | 2.9% | 0.93%(+1.97)#31 | 1.1%(+1.81)#1,999 |
| 32. | 58227 | 2.8% | 0.93%(+1.88)#32 | 1.1%(+1.72)#2,104 |
| 33. | 58036 | 2.8% | 0.93%(+1.86)#33 | 1.1%(+1.70)#2,131 |
| 34. | 58369 | 2.8% | 0.93%(+1.85)#34 | 1.1%(+1.69)#2,140 |
| 35. | 58220 | 2.6% | 0.93%(+1.71)#35 | 1.1%(+1.55)#2,336 |
| 36. | 58849 | 2.6% | 0.93%(+1.70)#36 | 1.1%(+1.54)#2,355 |
| 37. | 58438 | 2.6% | 0.93%(+1.66)#37 | 1.1%(+1.50)#2,419 |
| 38. | 58773 | 2.6% | 0.93%(+1.62)#38 | 1.1%(+1.46)#2,476 |
| 39. | 58731 | 2.5% | 0.93%(+1.53)#39 | 1.1%(+1.37)#2,639 |
| 40. | 58077 | 2.4% | 0.93%(+1.51)#40 | 1.1%(+1.35)#2,683 |
| 41. | 58042 | 2.4% | 0.93%(+1.49)#41 | 1.1%(+1.33)#2,724 |
| 42. | 58458 | 2.3% | 0.93%(+1.38)#42 | 1.1%(+1.22)#2,937 |
| 43. | 58573 | 2.3% | 0.93%(+1.36)#43 | 1.1%(+1.20)#2,977 |
| 44. | 58492 | 2.3% | 0.93%(+1.35)#44 | 1.1%(+1.19)#2,993 |
| 45. | 58496 | 2.2% | 0.93%(+1.32)#45 | 1.1%(+1.16)#3,071 |
| 46. | 58225 | 2.2% | 0.93%(+1.25)#46 | 1.1%(+1.09)#3,232 |
| 47. | 58575 | 2.1% | 0.93%(+1.19)#47 | 1.1%(+1.03)#3,376 |
| 48. | 58761 | 2.1% | 0.93%(+1.17)#48 | 1.1%(+1.01)#3,421 |
| 49. | 58561 | 2.1% | 0.93%(+1.13)#49 | 1.1%(+0.967)#3,522 |
| 50. | 58486 | 2.0% | 0.93%(+1.09)#50 | 1.1%(+0.929)#3,629 |
| 51. | 58436 | 2.0% | 0.93%(+1.04)#51 | 1.1%(+0.875)#3,788 |
| 52. | 58416 | 2.0% | 0.93%(+1.03)#52 | 1.1%(+0.870)#3,802 |
| 53. | 58636 | 1.9% | 0.93%(+0.967)#53 | 1.1%(+0.805)#3,991 |
| 54. | 58623 | 1.9% | 0.93%(+0.932)#54 | 1.1%(+0.770)#4,108 |
| 55. | 58231 | 1.8% | 0.93%(+0.917)#55 | 1.1%(+0.754)#4,158 |
| 56. | 58740 | 1.8% | 0.93%(+0.904)#56 | 1.1%(+0.742)#4,207 |
| 57. | 58771 | 1.8% | 0.93%(+0.898)#57 | 1.1%(+0.736)#4,232 |
| 58. | 58425 | 1.8% | 0.93%(+0.863)#58 | 1.1%(+0.700)#4,359 |
| 59. | 58562 | 1.8% | 0.93%(+0.857)#59 | 1.1%(+0.695)#4,379 |
| 60. | 58831 | 1.8% | 0.93%(+0.851)#60 | 1.1%(+0.688)#4,400 |
| 61. | 58429 | 1.7% | 0.93%(+0.781)#61 | 1.1%(+0.618)#4,682 |
| 62. | 58203 | 1.7% | 0.93%(+0.775)#62 | 1.1%(+0.613)#4,704 |
| 63. | 58789 | 1.7% | 0.93%(+0.757)#63 | 1.1%(+0.594)#4,798 |
| 64. | 58630 | 1.7% | 0.93%(+0.727)#64 | 1.1%(+0.565)#4,920 |
| 65. | 58750 | 1.6% | 0.93%(+0.684)#65 | 1.1%(+0.522)#5,101 |
| 66. | 58237 | 1.6% | 0.93%(+0.676)#66 | 1.1%(+0.514)#5,130 |
| 67. | 58103 | 1.6% | 0.93%(+0.641)#67 | 1.1%(+0.479)#5,295 |
| 68. | 58356 | 1.6% | 0.93%(+0.628)#68 | 1.1%(+0.466)#5,348 |
| 69. | 58545 | 1.5% | 0.93%(+0.586)#69 | 1.1%(+0.423)#5,586 |
| 70. | 58559 | 1.5% | 0.93%(+0.579)#70 | 1.1%(+0.417)#5,620 |
| 71. | 58650 | 1.5% | 0.93%(+0.572)#71 | 1.1%(+0.409)#5,660 |
| 72. | 58853 | 1.5% | 0.93%(+0.564)#72 | 1.1%(+0.402)#5,697 |
| 73. | 58646 | 1.5% | 0.93%(+0.545)#73 | 1.1%(+0.383)#5,809 |
| 74. | 58482 | 1.5% | 0.93%(+0.533)#74 | 1.1%(+0.370)#5,861 |
| 75. | 58576 | 1.4% | 0.93%(+0.510)#75 | 1.1%(+0.348)#5,973 |
| 76. | 58577 | 1.4% | 0.93%(+0.502)#76 | 1.1%(+0.339)#6,026 |
| 77. | 58401 | 1.4% | 0.93%(+0.456)#77 | 1.1%(+0.294)#6,278 |
| 78. | 58640 | 1.4% | 0.93%(+0.430)#78 | 1.1%(+0.267)#6,434 |
| 79. | 58439 | 1.3% | 0.93%(+0.396)#79 | 1.1%(+0.234)#6,636 |
| 80. | 58420 | 1.3% | 0.93%(+0.393)#80 | 1.1%(+0.231)#6,662 |
| 81. | 58027 | 1.3% | 0.93%(+0.391)#81 | 1.1%(+0.229)#6,669 |
| 82. | 58301 | 1.3% | 0.93%(+0.388)#82 | 1.1%(+0.225)#6,693 |
| 83. | 58466 | 1.3% | 0.93%(+0.387)#83 | 1.1%(+0.225)#6,700 |
| 84. | 58015 | 1.3% | 0.93%(+0.387)#84 | 1.1%(+0.225)#6,703 |
| 85. | 58058 | 1.3% | 0.93%(+0.387)#85 | 1.1%(+0.225)#6,704 |
| 86. | 58759 | 1.3% | 0.93%(+0.362)#86 | 1.1%(+0.199)#6,862 |
| 87. | 58240 | 1.3% | 0.93%(+0.333)#87 | 1.1%(+0.170)#7,046 |
| 88. | 58061 | 1.2% | 0.93%(+0.306)#88 | 1.1%(+0.144)#7,235 |
| 89. | 58081 | 1.2% | 0.93%(+0.303)#89 | 1.1%(+0.141)#7,254 |
| 90. | 58270 | 1.2% | 0.93%(+0.299)#90 | 1.1%(+0.137)#7,286 |
| 91. | 58772 | 1.2% | 0.93%(+0.276)#91 | 1.1%(+0.114)#7,462 |
| 92. | 58202 | 1.2% | 0.93%(+0.249)#92 | 1.1%(+0.087)#7,653 |
| 93. | 58701 | 1.1% | 0.93%(+0.213)#93 | 1.1%(+0.051)#7,918 |
| 94. | 58552 | 1.1% | 0.93%(+0.210)#94 | 1.1%(+0.047)#7,950 |
| 95. | 58467 | 1.1% | 0.93%(+0.208)#95 | 1.1%(+0.045)#7,968 |
| 96. | 58503 | 1.1% | 0.93%(+0.192)#96 | 1.1%(+0.029)#8,070 |
| 97. | 58332 | 1.1% | 0.93%(+0.170)#97 | 1.1%(+0.008)#8,233 |
| 98. | 58785 | 1.1% | 0.93%(+0.138)#98 | 1.1%(-0.024)#8,497 |
| 99. | 58251 | 1.1% | 0.93%(+0.137)#99 | 1.1%(-0.025)#8,504 |
| 100. | 58035 | 1.1% | 0.93%(+0.135)#100 | 1.1%(-0.027)#8,527 |
Common Questions
What are the Top 10 Zip Codes with the Highest Percentage of Population Employed in Life, Physical & Social Science in North Dakota?
Top 10 Zip Codes with the Highest Percentage of Population Employed in Life, Physical & Social Science in North Dakota are:
What zip code has the Highest Percentage of Population Employed in Life, Physical & Social Science in North Dakota?
58219 has the Highest Percentage of Population Employed in Life, Physical & Social Science in North Dakota with 14.7%.
What is the Percentage of Population Employed in Life, Physical & Social Science in the State of North Dakota?
Percentage of Population Employed in Life, Physical & Social Science in North Dakota is 0.93%.
What is the Percentage of Population Employed in Life, Physical & Social Science in the United States?
Percentage of Population Employed in Life, Physical & Social Science in the United States is 1.1%.