Christine, ND Map & Demographics
Christine Map
Christine Overview
$37,019
PER CAPITA INCOME
$92,500
AVG FAMILY INCOME
$84,750
AVG HOUSEHOLD INCOME
50.0%
WAGE / INCOME GAP [ % ]
50.0¢/ $1
WAGE / INCOME GAP [ $ ]
0.26
INEQUALITY / GINI INDEX
166
TOTAL POPULATION
72
MALE POPULATION
94
FEMALE POPULATION
76.60
MALES / 100 FEMALES
130.56
FEMALES / 100 MALES
33.9
MEDIAN AGE
3.0
AVG FAMILY SIZE
2.5
AVG HOUSEHOLD SIZE
103
LABOR FORCE [ PEOPLE ]
83.1%
PERCENT IN LABOR FORCE
Christine Zip Codes
Christine Area Codes
Income in Christine
Income Overview in Christine
Per Capita Income in Christine is $37,019, while median incomes of families and households are $92,500 and $84,750 respectively.
| Characteristic | Number | Measure |
| Per Capita Income | 166 | $37,019 |
| Median Family Income | 48 | $92,500 |
| Mean Family Income | 48 | $107,352 |
| Median Household Income | 65 | $84,750 |
| Mean Household Income | 65 | $92,805 |
| Income Deficit | 48 | $0 |
| Wage / Income Gap (%) | 166 | 50.00% |
| Wage / Income Gap ($) | 166 | 50.00¢ per $1 |
| Gini / Inequality Index | 166 | 0.26 |
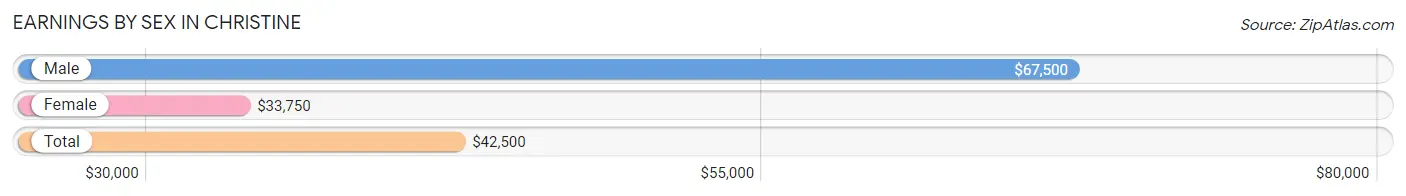
Earnings by Sex in Christine
Average Earnings in Christine are $42,500, $67,500 for men and $33,750 for women, a difference of 50.0%.
| Sex | Number | Average Earnings |
| Male | 54 (50.9%) | $67,500 |
| Female | 52 (49.1%) | $33,750 |
| Total | 106 (100.0%) | $42,500 |
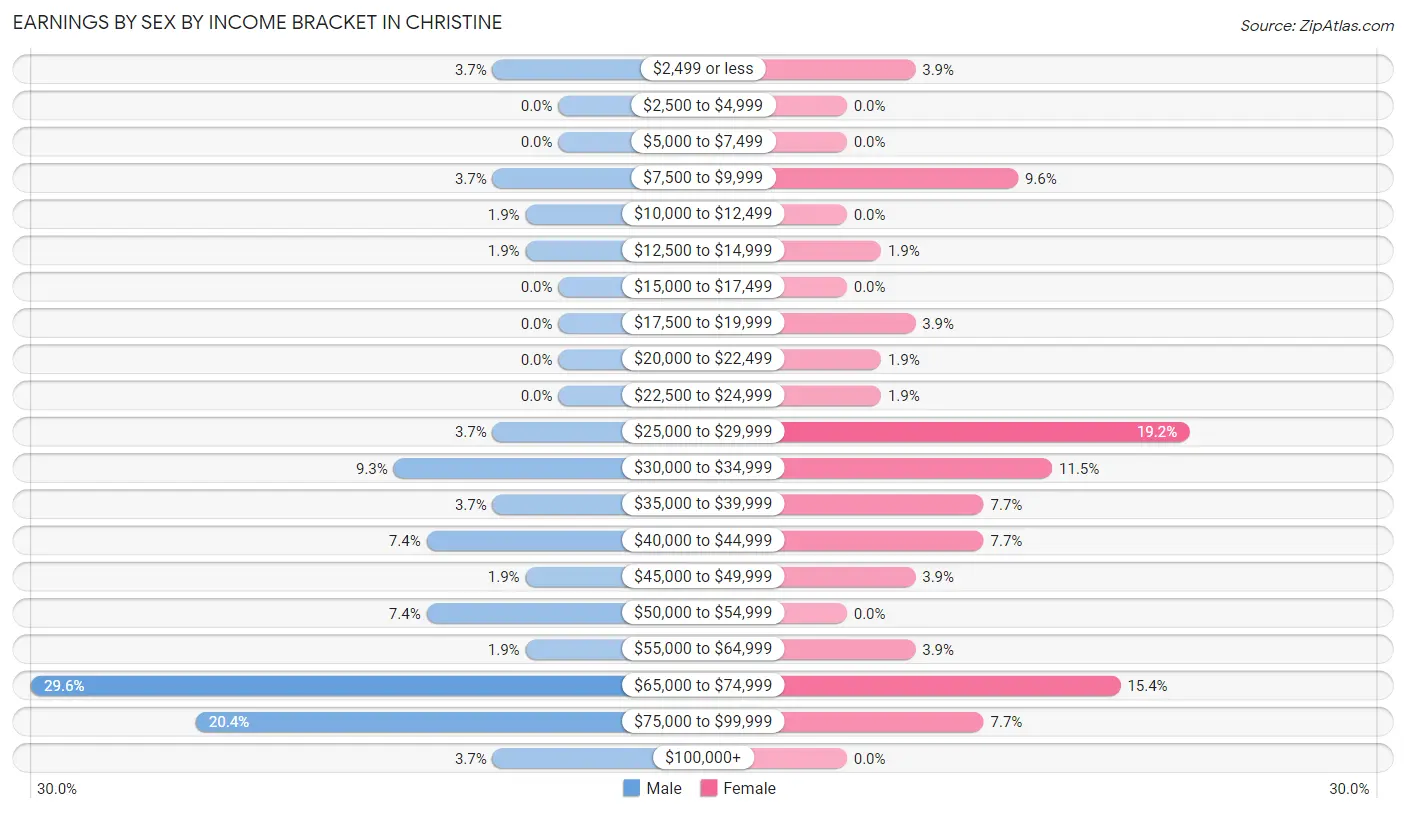
Earnings by Sex by Income Bracket in Christine
The most common earnings brackets in Christine are $65,000 to $74,999 for men (16 | 29.6%) and $25,000 to $29,999 for women (10 | 19.2%).
| Income | Male | Female |
| $2,499 or less | 2 (3.7%) | 2 (3.8%) |
| $2,500 to $4,999 | 0 (0.0%) | 0 (0.0%) |
| $5,000 to $7,499 | 0 (0.0%) | 0 (0.0%) |
| $7,500 to $9,999 | 2 (3.7%) | 5 (9.6%) |
| $10,000 to $12,499 | 1 (1.8%) | 0 (0.0%) |
| $12,500 to $14,999 | 1 (1.8%) | 1 (1.9%) |
| $15,000 to $17,499 | 0 (0.0%) | 0 (0.0%) |
| $17,500 to $19,999 | 0 (0.0%) | 2 (3.8%) |
| $20,000 to $22,499 | 0 (0.0%) | 1 (1.9%) |
| $22,500 to $24,999 | 0 (0.0%) | 1 (1.9%) |
| $25,000 to $29,999 | 2 (3.7%) | 10 (19.2%) |
| $30,000 to $34,999 | 5 (9.3%) | 6 (11.5%) |
| $35,000 to $39,999 | 2 (3.7%) | 4 (7.7%) |
| $40,000 to $44,999 | 4 (7.4%) | 4 (7.7%) |
| $45,000 to $49,999 | 1 (1.8%) | 2 (3.8%) |
| $50,000 to $54,999 | 4 (7.4%) | 0 (0.0%) |
| $55,000 to $64,999 | 1 (1.8%) | 2 (3.8%) |
| $65,000 to $74,999 | 16 (29.6%) | 8 (15.4%) |
| $75,000 to $99,999 | 11 (20.4%) | 4 (7.7%) |
| $100,000+ | 2 (3.7%) | 0 (0.0%) |
| Total | 54 (100.0%) | 52 (100.0%) |
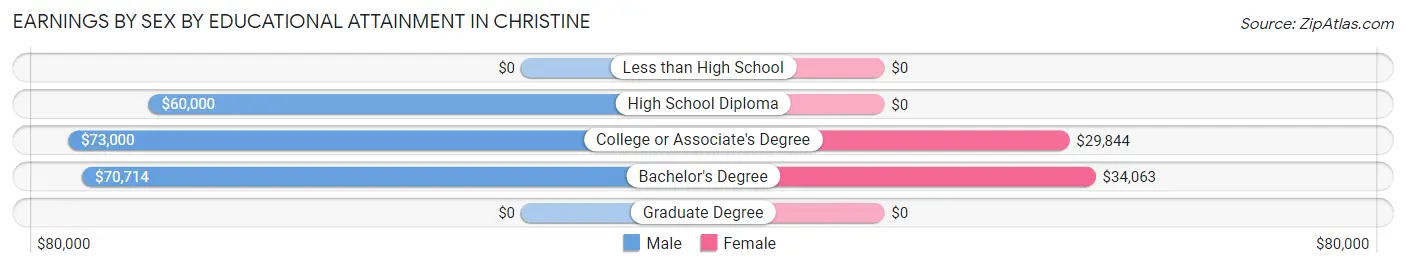
Earnings by Sex by Educational Attainment in Christine
Average earnings in Christine are $70,000 for men and $33,438 for women, a difference of 52.2%. Men with an educational attainment of college or associate's degree enjoy the highest average annual earnings of $73,000, while those with high school diploma education earn the least with $60,000. Women with an educational attainment of bachelor's degree earn the most with the average annual earnings of $34,063, while those with college or associate's degree education have the smallest earnings of $29,844.
| Educational Attainment | Male Income | Female Income |
| Less than High School | - | - |
| High School Diploma | $60,000 | $0 |
| College or Associate's Degree | $73,000 | $29,844 |
| Bachelor's Degree | $70,714 | $34,063 |
| Graduate Degree | - | - |
| Total | $70,000 | $33,438 |
Family Income in Christine
Family Income Brackets in Christine
According to the Christine family income data, there are 20 families falling into the $75,000 to $99,999 income range, which is the most common income bracket and makes up 41.7% of all families.
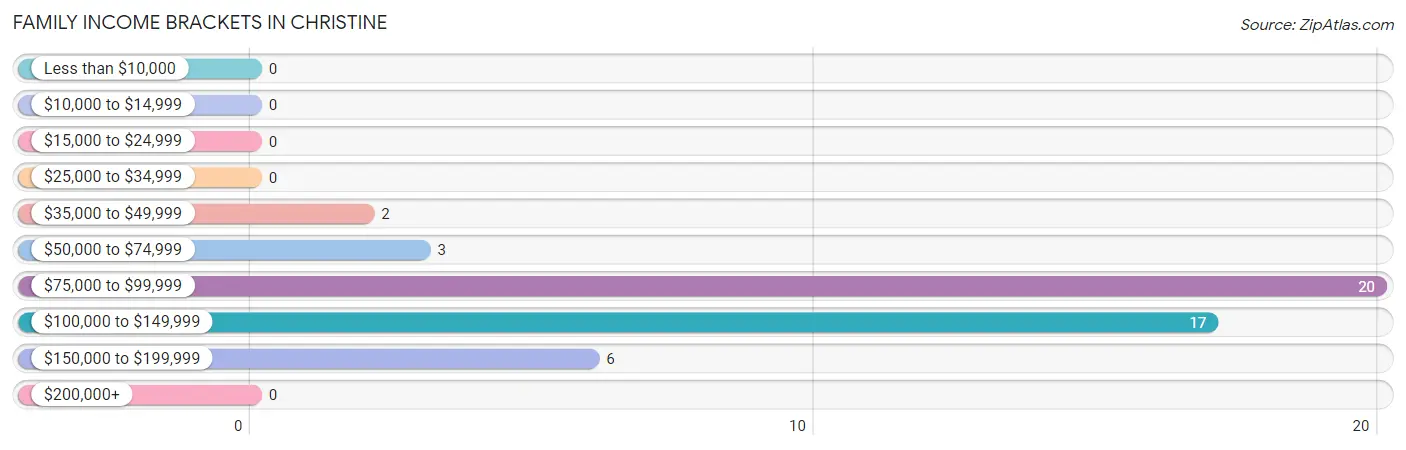
| Income Bracket | # Families | % Families |
| Less than $10,000 | 0 | 0.0% |
| $10,000 to $14,999 | 0 | 0.0% |
| $15,000 to $24,999 | 0 | 0.0% |
| $25,000 to $34,999 | 0 | 0.0% |
| $35,000 to $49,999 | 2 | 4.2% |
| $50,000 to $74,999 | 3 | 6.3% |
| $75,000 to $99,999 | 20 | 41.7% |
| $100,000 to $149,999 | 17 | 35.4% |
| $150,000 to $199,999 | 6 | 12.5% |
| $200,000+ | 0 | 0.0% |
Family Income by Famaliy Size in Christine
4-person families (11 | 22.9%) account for the highest median family income in Christine with $140,893 per family, while 2-person families (23 | 47.9%) have the highest median income of $42,812 per family member.
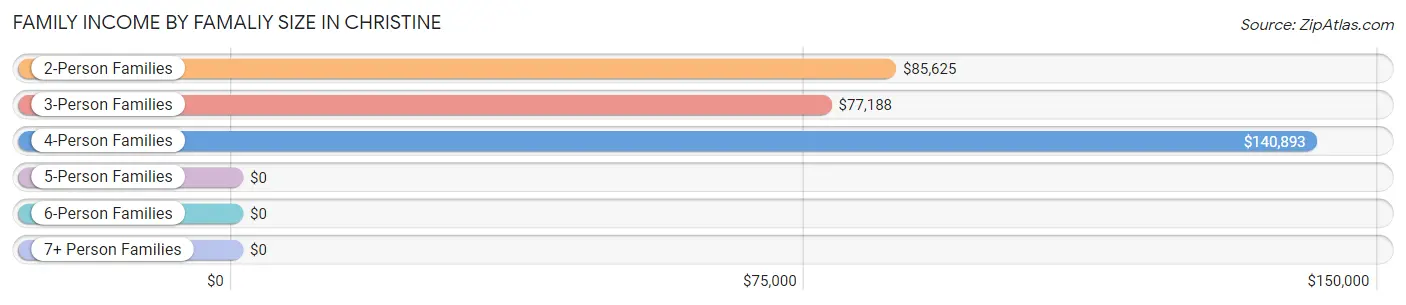
| Income Bracket | # Families | Median Income |
| 2-Person Families | 23 (47.9%) | $85,625 |
| 3-Person Families | 9 (18.8%) | $77,188 |
| 4-Person Families | 11 (22.9%) | $140,893 |
| 5-Person Families | 4 (8.3%) | $0 |
| 6-Person Families | 1 (2.1%) | $0 |
| 7+ Person Families | 0 (0.0%) | $0 |
| Total | 48 (100.0%) | $92,500 |
Family Income by Number of Earners in Christine
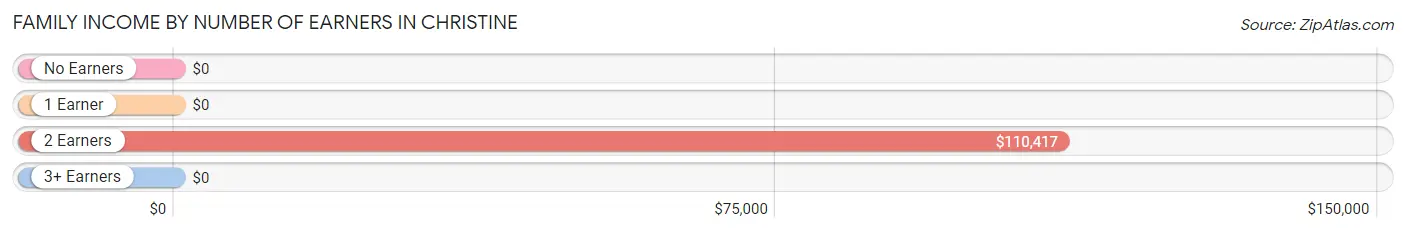
| Number of Earners | # Families | Median Income |
| No Earners | 3 (6.2%) | $0 |
| 1 Earner | 5 (10.4%) | $0 |
| 2 Earners | 39 (81.2%) | $110,417 |
| 3+ Earners | 1 (2.1%) | $0 |
| Total | 48 (100.0%) | $92,500 |
Household Income in Christine
Household Income Brackets in Christine
With 20 households falling in the category, the $75,000 to $99,999 income range is the most frequent in Christine, accounting for 30.8% of all households.
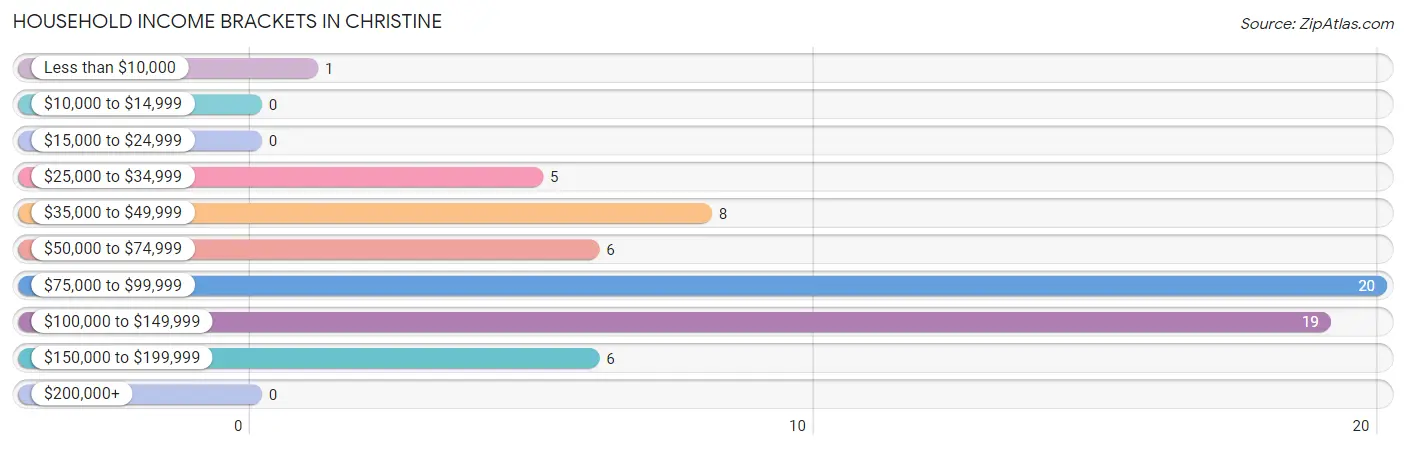
| Income Bracket | # Households | % Households |
| Less than $10,000 | 1 | 1.5% |
| $10,000 to $14,999 | 0 | 0.0% |
| $15,000 to $24,999 | 0 | 0.0% |
| $25,000 to $34,999 | 5 | 7.7% |
| $35,000 to $49,999 | 8 | 12.3% |
| $50,000 to $74,999 | 6 | 9.2% |
| $75,000 to $99,999 | 20 | 30.8% |
| $100,000 to $149,999 | 19 | 29.2% |
| $150,000 to $199,999 | 6 | 9.2% |
| $200,000+ | 0 | 0.0% |
Household Income by Householder Age in Christine
The median household income in Christine is $84,750, with the highest median household income of $111,667 found in the 25 to 44 years age bracket for the primary householder. A total of 26 households (40.0%) fall into this category.
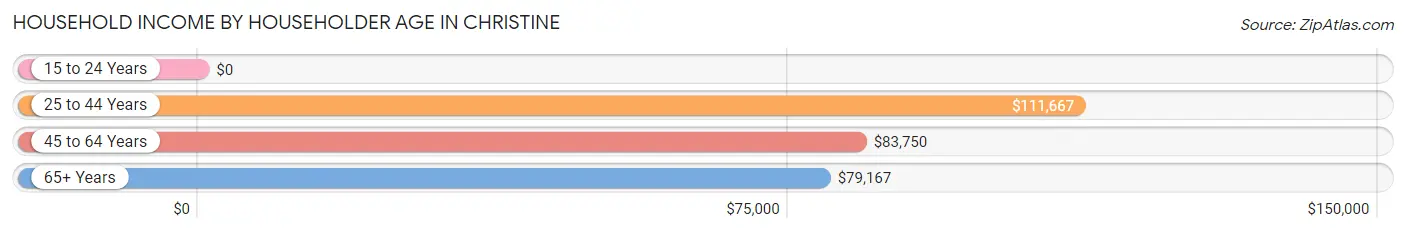
| Income Bracket | # Households | Median Income |
| 15 to 24 Years | 0 (0.0%) | $0 |
| 25 to 44 Years | 26 (40.0%) | $111,667 |
| 45 to 64 Years | 27 (41.5%) | $83,750 |
| 65+ Years | 12 (18.5%) | $79,167 |
| Total | 65 (100.0%) | $84,750 |
Poverty in Christine
Income Below Poverty by Sex and Age in Christine
With 6.9% poverty level for males and 3.2% for females among the residents of Christine, 6 to 11 year old males and 6 to 11 year old females are the most vulnerable to poverty, with 1 males (100.0%) and 1 females (20.0%) in their respective age groups living below the poverty level.
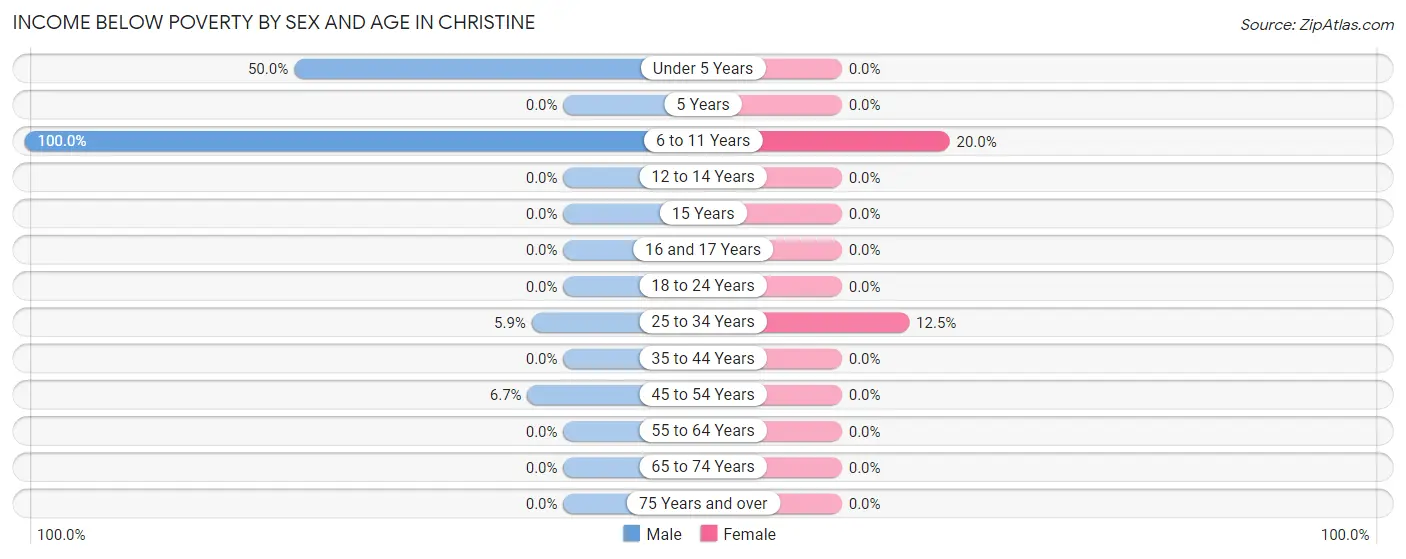
| Age Bracket | Male | Female |
| Under 5 Years | 2 (50.0%) | 0 (0.0%) |
| 5 Years | 0 (0.0%) | 0 (0.0%) |
| 6 to 11 Years | 1 (100.0%) | 1 (20.0%) |
| 12 to 14 Years | 0 (0.0%) | 0 (0.0%) |
| 15 Years | 0 (0.0%) | 0 (0.0%) |
| 16 and 17 Years | 0 (0.0%) | 0 (0.0%) |
| 18 to 24 Years | 0 (0.0%) | 0 (0.0%) |
| 25 to 34 Years | 1 (5.9%) | 2 (12.5%) |
| 35 to 44 Years | 0 (0.0%) | 0 (0.0%) |
| 45 to 54 Years | 1 (6.7%) | 0 (0.0%) |
| 55 to 64 Years | 0 (0.0%) | 0 (0.0%) |
| 65 to 74 Years | 0 (0.0%) | 0 (0.0%) |
| 75 Years and over | 0 (0.0%) | 0 (0.0%) |
| Total | 5 (6.9%) | 3 (3.2%) |
Income Above Poverty by Sex and Age in Christine
According to the poverty statistics in Christine, males aged 5 years and females aged under 5 years are the age groups that are most secure financially, with 100.0% of males and 100.0% of females in these age groups living above the poverty line.
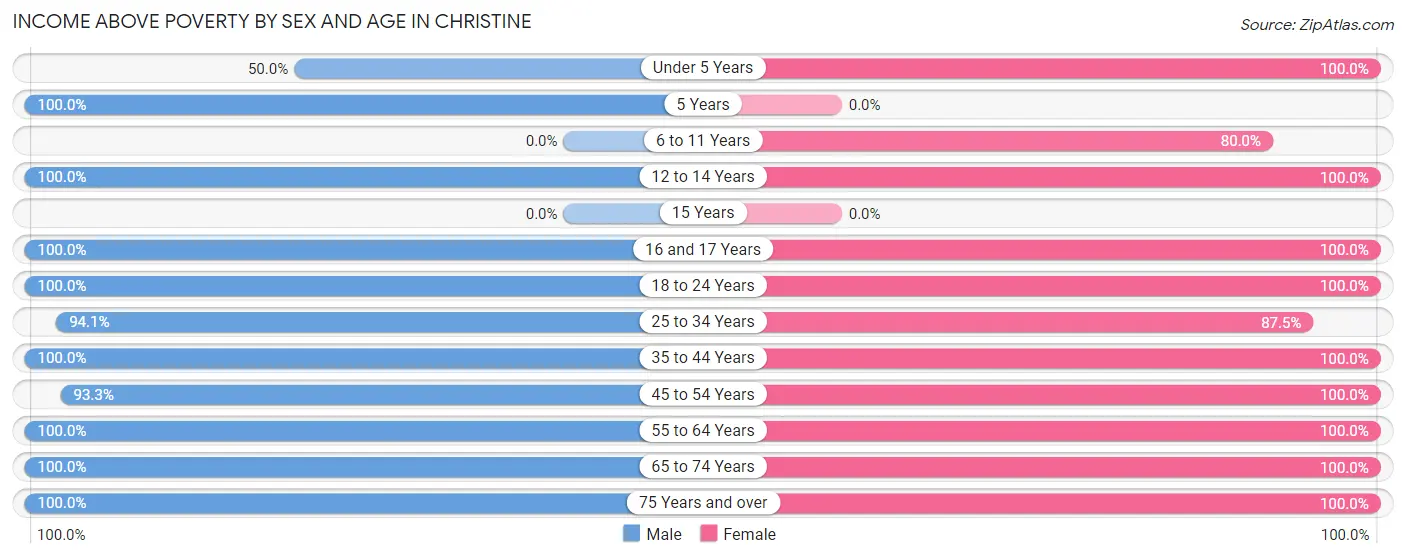
| Age Bracket | Male | Female |
| Under 5 Years | 2 (50.0%) | 21 (100.0%) |
| 5 Years | 2 (100.0%) | 0 (0.0%) |
| 6 to 11 Years | 0 (0.0%) | 4 (80.0%) |
| 12 to 14 Years | 3 (100.0%) | 6 (100.0%) |
| 15 Years | 0 (0.0%) | 0 (0.0%) |
| 16 and 17 Years | 1 (100.0%) | 2 (100.0%) |
| 18 to 24 Years | 4 (100.0%) | 2 (100.0%) |
| 25 to 34 Years | 16 (94.1%) | 14 (87.5%) |
| 35 to 44 Years | 9 (100.0%) | 3 (100.0%) |
| 45 to 54 Years | 14 (93.3%) | 12 (100.0%) |
| 55 to 64 Years | 7 (100.0%) | 19 (100.0%) |
| 65 to 74 Years | 4 (100.0%) | 3 (100.0%) |
| 75 Years and over | 5 (100.0%) | 5 (100.0%) |
| Total | 67 (93.1%) | 91 (96.8%) |
Income Below Poverty Among Married-Couple Families in Christine
The poverty statistics for married-couple families in Christine show that 2.2% or 1 of the total 45 families live below the poverty line. Families with 3 or 4 children have the highest poverty rate of 100.0%, comprising of 1 families. On the other hand, families with no children have the lowest poverty rate of 0.0%, which includes 0 families.
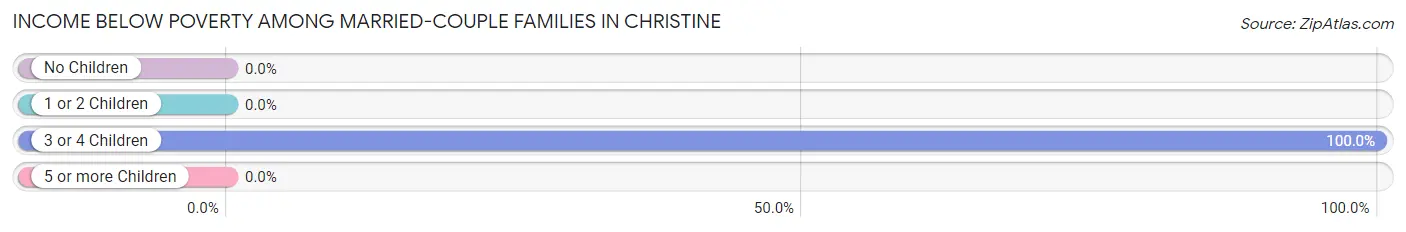
| Children | Above Poverty | Below Poverty |
| No Children | 21 (100.0%) | 0 (0.0%) |
| 1 or 2 Children | 23 (100.0%) | 0 (0.0%) |
| 3 or 4 Children | 0 (0.0%) | 1 (100.0%) |
| 5 or more Children | 0 (0.0%) | 0 (0.0%) |
| Total | 44 (97.8%) | 1 (2.2%) |
Income Below Poverty Among Single-Parent Households in Christine
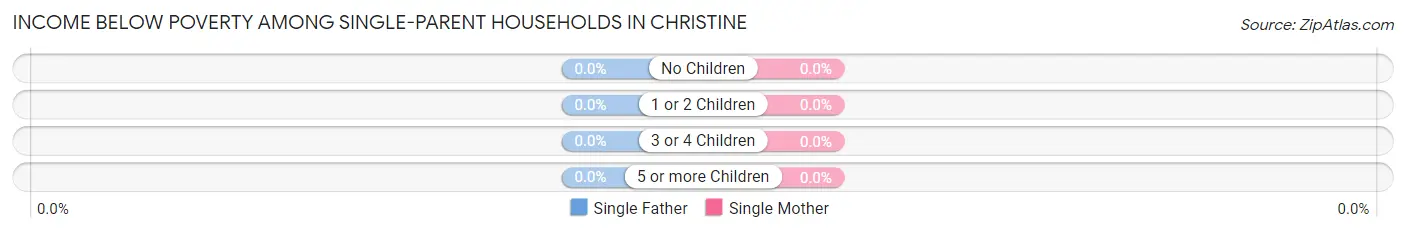
| Children | Single Father | Single Mother |
| No Children | 0 (0.0%) | 0 (0.0%) |
| 1 or 2 Children | 0 (0.0%) | 0 (0.0%) |
| 3 or 4 Children | 0 (0.0%) | 0 (0.0%) |
| 5 or more Children | 0 (0.0%) | 0 (0.0%) |
| Total | 0 (0.0%) | 0 (0.0%) |
Income Below Poverty Among Married-Couple vs Single-Parent Households in Christine
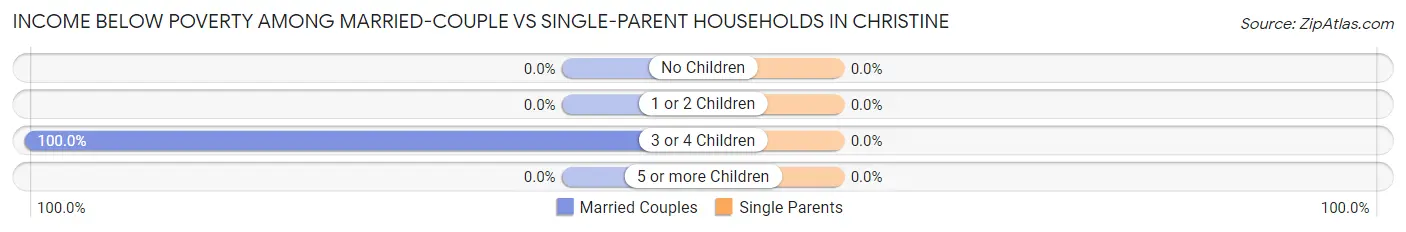
| Children | Married-Couple Families | Single-Parent Households |
| No Children | 0 (0.0%) | 0 (0.0%) |
| 1 or 2 Children | 0 (0.0%) | 0 (0.0%) |
| 3 or 4 Children | 1 (100.0%) | 0 (0.0%) |
| 5 or more Children | 0 (0.0%) | 0 (0.0%) |
| Total | 1 (2.2%) | 0 (0.0%) |
Race in Christine
The most populous races in Christine are White / Caucasian (164 | 98.8%), and Two or more Races (2 | 1.2%).
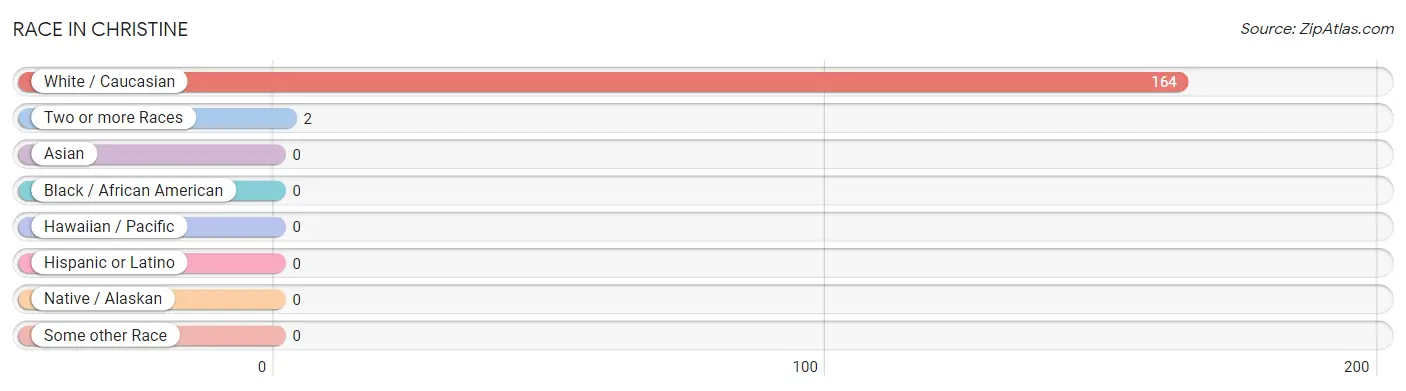
| Race | # Population | % Population |
| Asian | 0 | 0.0% |
| Black / African American | 0 | 0.0% |
| Hawaiian / Pacific | 0 | 0.0% |
| Hispanic or Latino | 0 | 0.0% |
| Native / Alaskan | 0 | 0.0% |
| White / Caucasian | 164 | 98.8% |
| Two or more Races | 2 | 1.2% |
| Some other Race | 0 | 0.0% |
| Total | 166 | 100.0% |
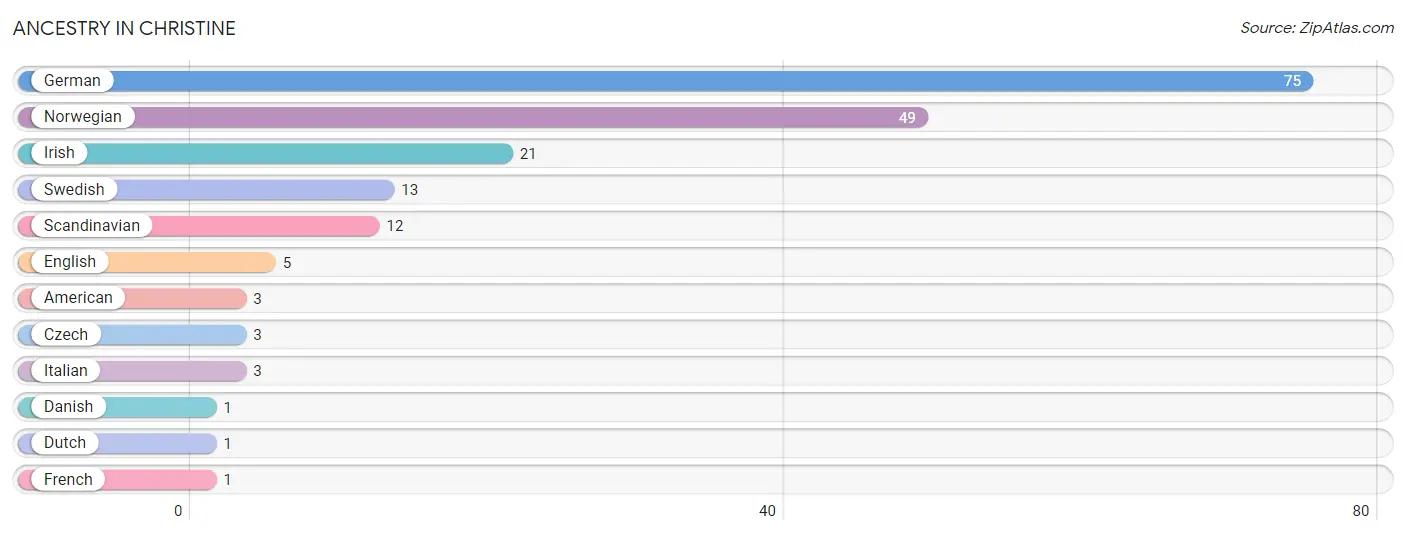
Ancestry in Christine
The most populous ancestries reported in Christine are German (75 | 45.2%), Norwegian (49 | 29.5%), Irish (21 | 12.7%), Swedish (13 | 7.8%), and Scandinavian (12 | 7.2%), together accounting for 102.4% of all Christine residents.
| Ancestry | # Population | % Population |
| American | 3 | 1.8% |
| Czech | 3 | 1.8% |
| Danish | 1 | 0.6% |
| Dutch | 1 | 0.6% |
| English | 5 | 3.0% |
| French | 1 | 0.6% |
| German | 75 | 45.2% |
| Irish | 21 | 12.7% |
| Italian | 3 | 1.8% |
| Norwegian | 49 | 29.5% |
| Scandinavian | 12 | 7.2% |
| Swedish | 13 | 7.8% | View All 12 Rows |
Immigrants in Christine

| Immigration Origin | # Population | % Population | View All 0 Rows |
Sex and Age in Christine
Sex and Age in Christine
The most populous age groups in Christine are 30 to 34 Years (13 | 18.1%) for men and Under 5 Years (21 | 22.3%) for women.
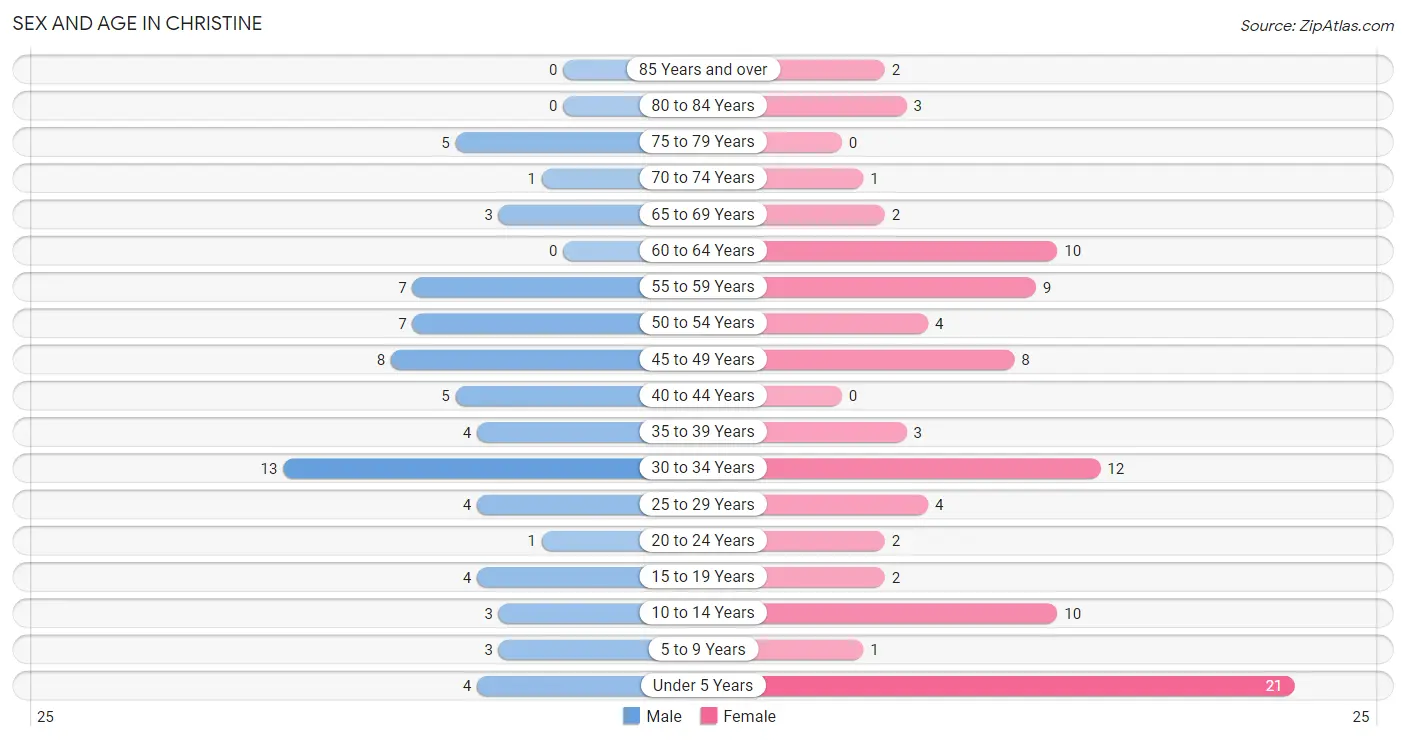
| Age Bracket | Male | Female |
| Under 5 Years | 4 (5.6%) | 21 (22.3%) |
| 5 to 9 Years | 3 (4.2%) | 1 (1.1%) |
| 10 to 14 Years | 3 (4.2%) | 10 (10.6%) |
| 15 to 19 Years | 4 (5.6%) | 2 (2.1%) |
| 20 to 24 Years | 1 (1.4%) | 2 (2.1%) |
| 25 to 29 Years | 4 (5.6%) | 4 (4.3%) |
| 30 to 34 Years | 13 (18.1%) | 12 (12.8%) |
| 35 to 39 Years | 4 (5.6%) | 3 (3.2%) |
| 40 to 44 Years | 5 (6.9%) | 0 (0.0%) |
| 45 to 49 Years | 8 (11.1%) | 8 (8.5%) |
| 50 to 54 Years | 7 (9.7%) | 4 (4.3%) |
| 55 to 59 Years | 7 (9.7%) | 9 (9.6%) |
| 60 to 64 Years | 0 (0.0%) | 10 (10.6%) |
| 65 to 69 Years | 3 (4.2%) | 2 (2.1%) |
| 70 to 74 Years | 1 (1.4%) | 1 (1.1%) |
| 75 to 79 Years | 5 (6.9%) | 0 (0.0%) |
| 80 to 84 Years | 0 (0.0%) | 3 (3.2%) |
| 85 Years and over | 0 (0.0%) | 2 (2.1%) |
| Total | 72 (100.0%) | 94 (100.0%) |
Families and Households in Christine
Median Family Size in Christine
The median family size in Christine is 3.04 persons per family, with married-couple families (45 | 93.8%) accounting for the largest median family size of 3.11 persons per family. On the other hand, single female/mother families (2 | 4.2%) represent the smallest median family size with 1.50 persons per family.
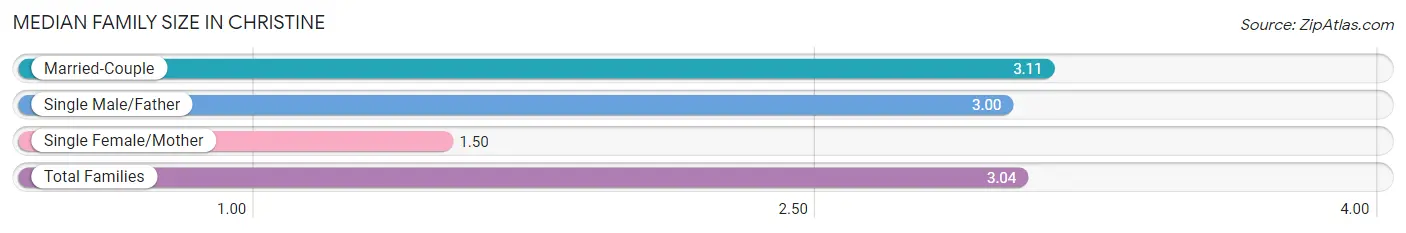
| Family Type | # Families | Family Size |
| Married-Couple | 45 (93.8%) | 3.11 |
| Single Male/Father | 1 (2.1%) | 3.00 |
| Single Female/Mother | 2 (4.2%) | 1.50 |
| Total Families | 48 (100.0%) | 3.04 |
Median Household Size in Christine
The median household size in Christine is 2.55 persons per household, with married-couple households (45 | 69.2%) accounting for the largest median household size of 3.11 persons per household. non-family households (17 | 26.2%) represent the smallest median household size with 1.18 persons per household.
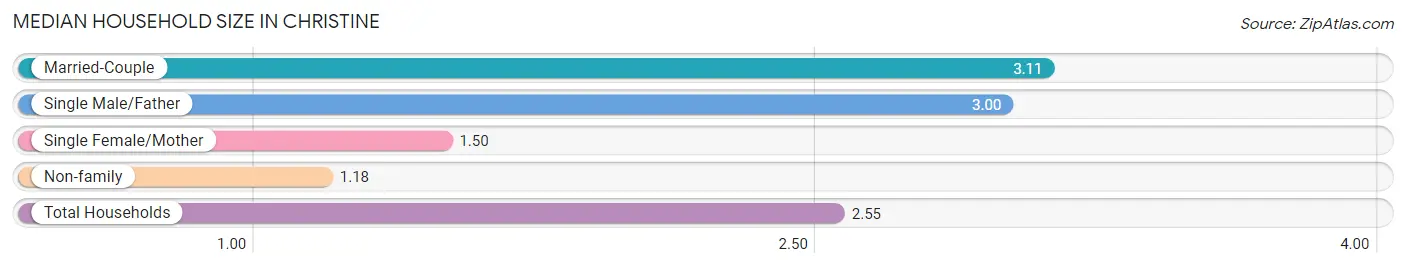
| Household Type | # Households | Household Size |
| Married-Couple | 45 (69.2%) | 3.11 |
| Single Male/Father | 1 (1.5%) | 3.00 |
| Single Female/Mother | 2 (3.1%) | 1.50 |
| Non-family | 17 (26.2%) | 1.18 |
| Total Households | 65 (100.0%) | 2.55 |
Household Size by Marriage Status in Christine
Out of a total of 65 households in Christine, 48 (73.9%) are family households, while 17 (26.2%) are nonfamily households. The most numerous type of family households are 2-person households, comprising 23, and the most common type of nonfamily households are 1-person households, comprising 13.
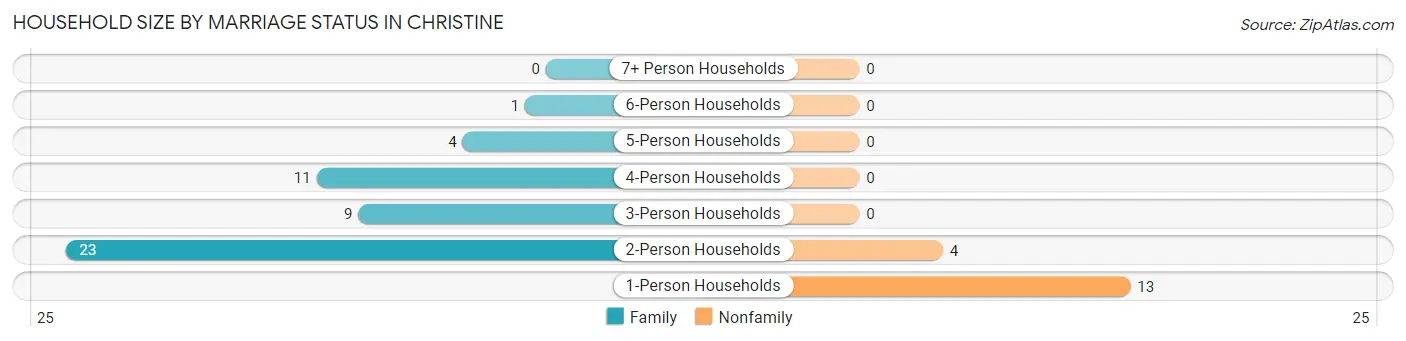
| Household Size | Family Households | Nonfamily Households |
| 1-Person Households | - | 13 (20.0%) |
| 2-Person Households | 23 (35.4%) | 4 (6.1%) |
| 3-Person Households | 9 (13.9%) | 0 (0.0%) |
| 4-Person Households | 11 (16.9%) | 0 (0.0%) |
| 5-Person Households | 4 (6.1%) | 0 (0.0%) |
| 6-Person Households | 1 (1.5%) | 0 (0.0%) |
| 7+ Person Households | 0 (0.0%) | 0 (0.0%) |
| Total | 48 (73.9%) | 17 (26.2%) |
Female Fertility in Christine
Fertility by Age in Christine
Average fertility rate in Christine is 333.0 births per 1,000 women. Women in the age bracket of 20 to 34 years have the highest fertility rate with 611.0 births per 1,000 women. Women in the age bracket of 20 to 34 years acount for 100.0% of all women with births.
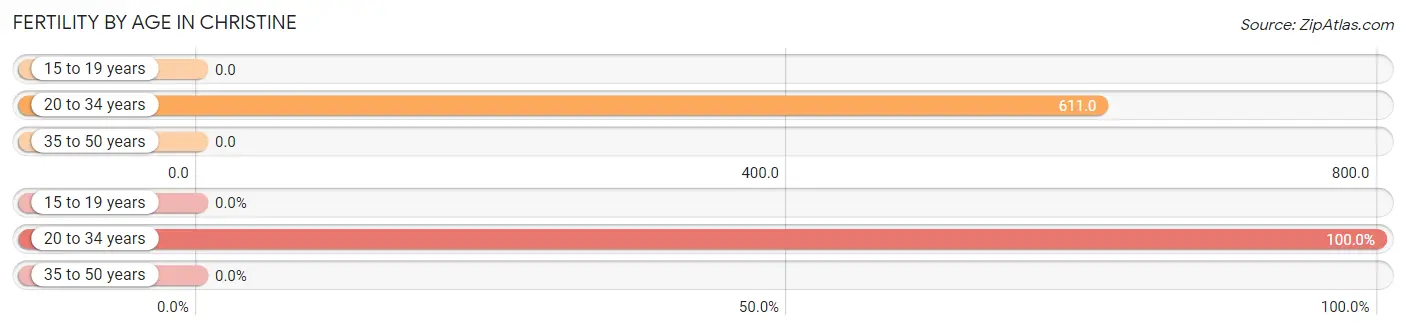
| Age Bracket | Women with Births | Births / 1,000 Women |
| 15 to 19 years | 0 (0.0%) | 0.0 |
| 20 to 34 years | 11 (100.0%) | 611.0 |
| 35 to 50 years | 0 (0.0%) | 0.0 |
| Total | 11 (100.0%) | 333.0 |
Fertility by Age by Marriage Status in Christine
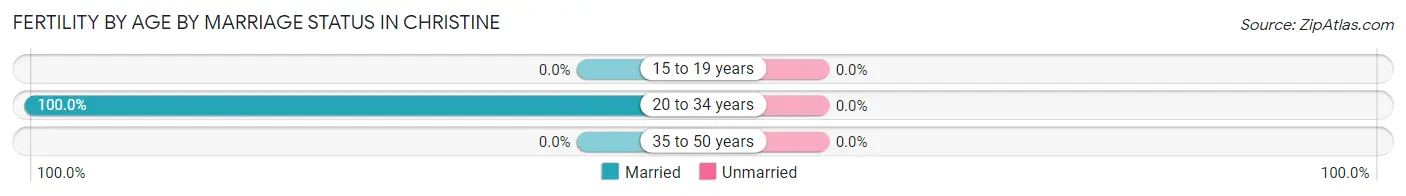
| Age Bracket | Married | Unmarried |
| 15 to 19 years | 0 (0.0%) | 0 (0.0%) |
| 20 to 34 years | 11 (100.0%) | 0 (0.0%) |
| 35 to 50 years | 0 (0.0%) | 0 (0.0%) |
| Total | 11 (100.0%) | 0 (0.0%) |
Fertility by Education in Christine
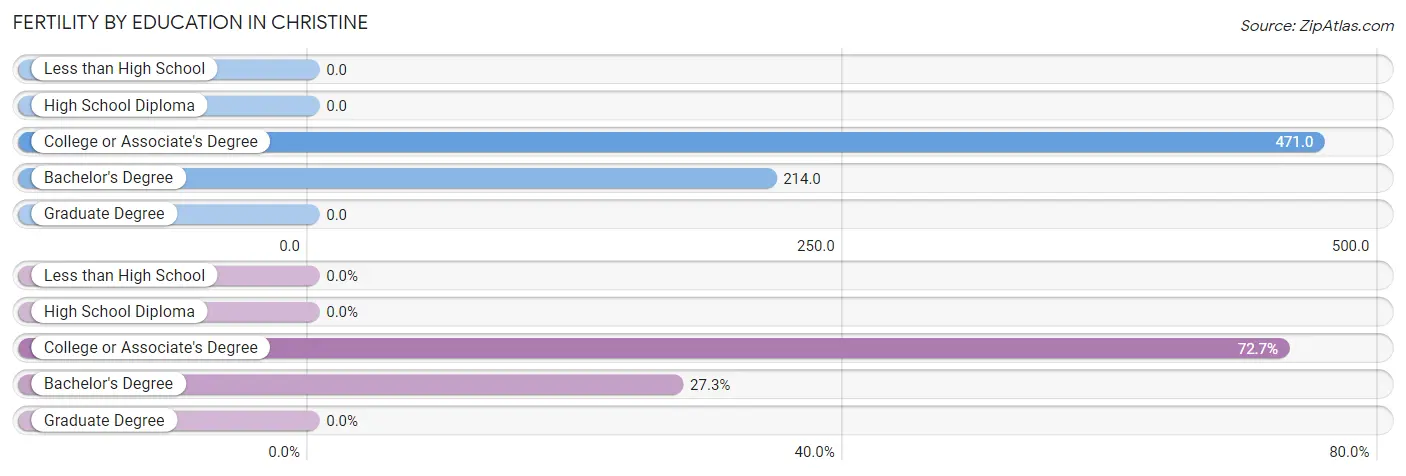
| Educational Attainment | Women with Births | Births / 1,000 Women |
| Less than High School | 0 (0.0%) | 0.0 |
| High School Diploma | 0 (0.0%) | 0.0 |
| College or Associate's Degree | 8 (72.7%) | 471.0 |
| Bachelor's Degree | 3 (27.3%) | 214.0 |
| Graduate Degree | 0 (0.0%) | 0.0 |
| Total | 11 (100.0%) | 333.0 |
Fertility by Education by Marriage Status in Christine
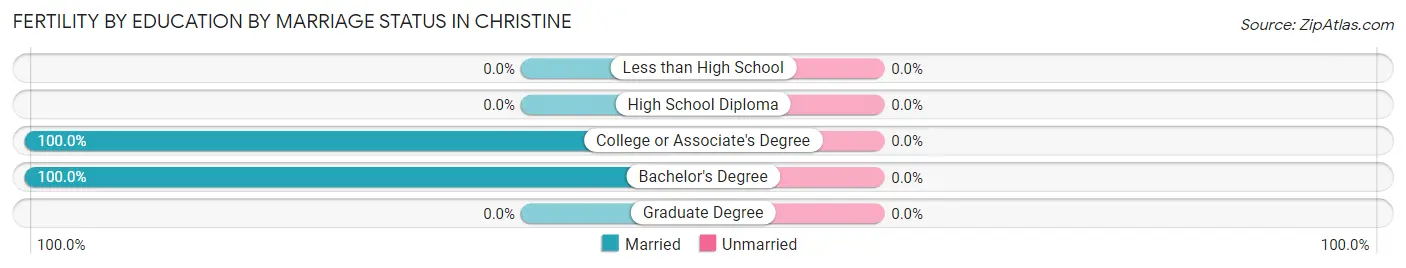
| Educational Attainment | Married | Unmarried |
| Less than High School | 0 (0.0%) | 0 (0.0%) |
| High School Diploma | 0 (0.0%) | 0 (0.0%) |
| College or Associate's Degree | 8 (100.0%) | 0 (0.0%) |
| Bachelor's Degree | 3 (100.0%) | 0 (0.0%) |
| Graduate Degree | 0 (0.0%) | 0 (0.0%) |
| Total | 11 (100.0%) | 0 (0.0%) |
Employment Characteristics in Christine
Employment by Class of Employer in Christine
Among the 101 employed individuals in Christine, private company employees (77 | 76.2%), not-for-profit organizations (15 | 14.8%), and self-employed (not incorporated) (7 | 6.9%) make up the most common classes of employment.
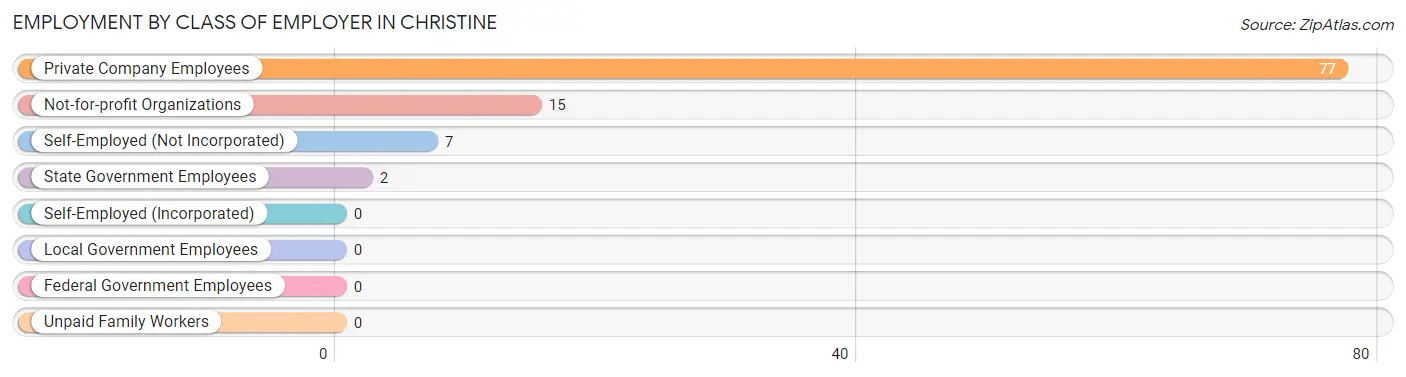
| Employer Class | # Employees | % Employees |
| Private Company Employees | 77 | 76.2% |
| Self-Employed (Incorporated) | 0 | 0.0% |
| Self-Employed (Not Incorporated) | 7 | 6.9% |
| Not-for-profit Organizations | 15 | 14.8% |
| Local Government Employees | 0 | 0.0% |
| State Government Employees | 2 | 2.0% |
| Federal Government Employees | 0 | 0.0% |
| Unpaid Family Workers | 0 | 0.0% |
| Total | 101 | 100.0% |
Employment Status by Age in Christine
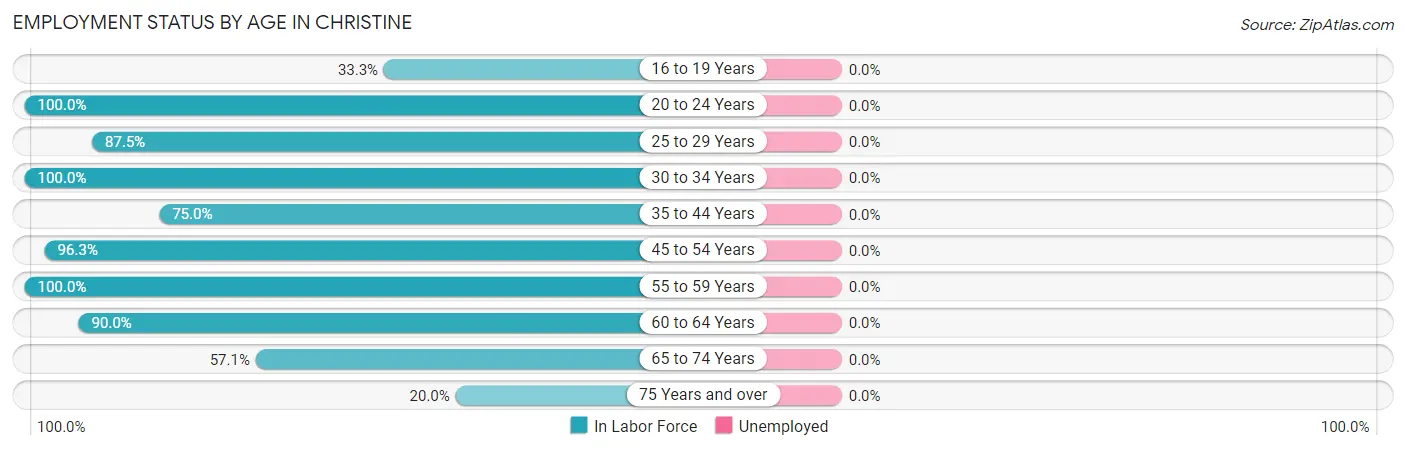
| Age Bracket | In Labor Force | Unemployed |
| 16 to 19 Years | 2 (33.3%) | 0 (0.0%) |
| 20 to 24 Years | 3 (100.0%) | 0 (0.0%) |
| 25 to 29 Years | 7 (87.5%) | 0 (0.0%) |
| 30 to 34 Years | 25 (100.0%) | 0 (0.0%) |
| 35 to 44 Years | 9 (75.0%) | 0 (0.0%) |
| 45 to 54 Years | 26 (96.3%) | 0 (0.0%) |
| 55 to 59 Years | 16 (100.0%) | 0 (0.0%) |
| 60 to 64 Years | 9 (90.0%) | 0 (0.0%) |
| 65 to 74 Years | 4 (57.1%) | 0 (0.0%) |
| 75 Years and over | 2 (20.0%) | 0 (0.0%) |
| Total | 103 (83.1%) | 0 (0.0%) |
Employment Status by Educational Attainment in Christine
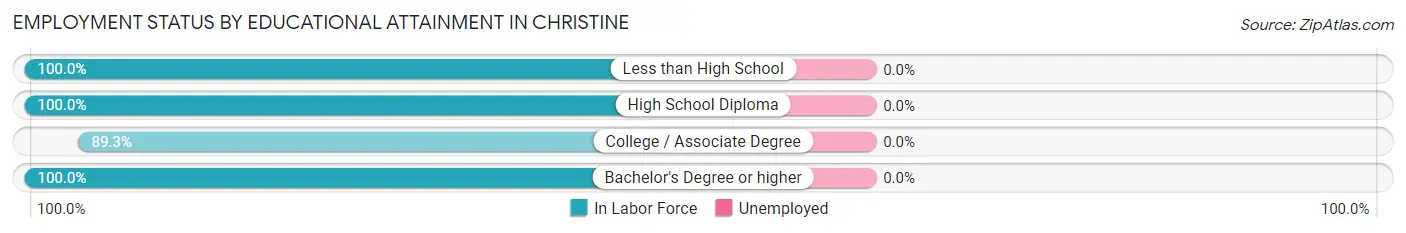
| Educational Attainment | In Labor Force | Unemployed |
| Less than High School | 4 (100.0%) | 0 (0.0%) |
| High School Diploma | 12 (100.0%) | 0 (0.0%) |
| College / Associate Degree | 50 (89.3%) | 0 (0.0%) |
| Bachelor's Degree or higher | 26 (100.0%) | 0 (0.0%) |
| Total | 92 (93.9%) | 0 (0.0%) |
Employment Occupations by Sex in Christine
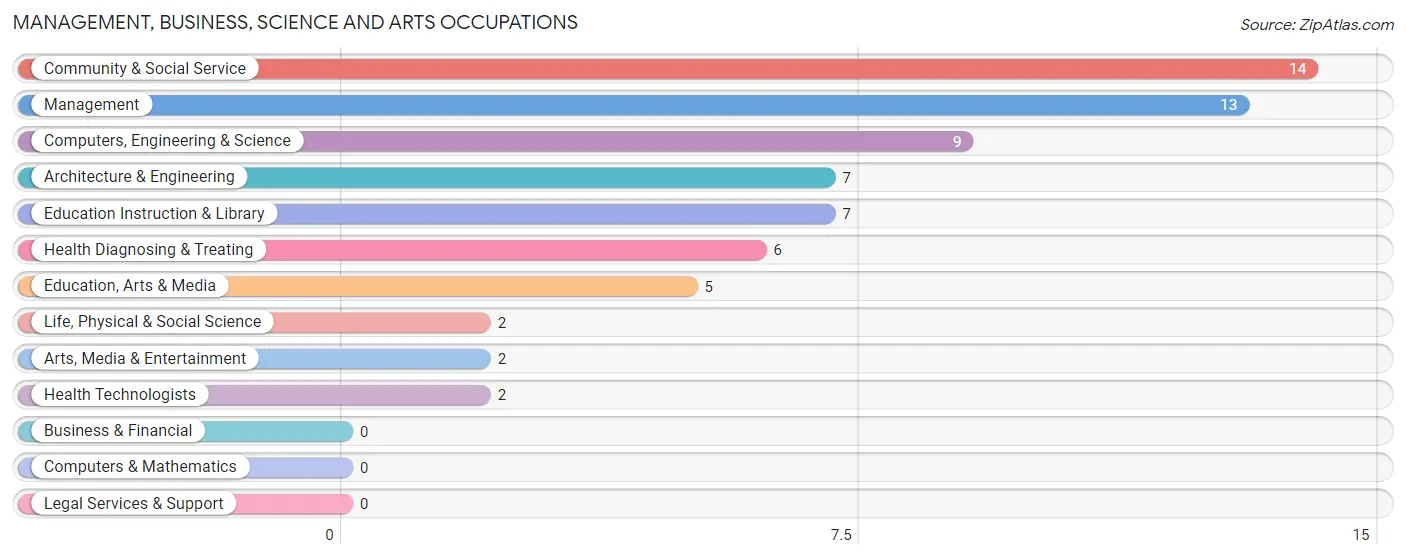
Management, Business, Science and Arts Occupations
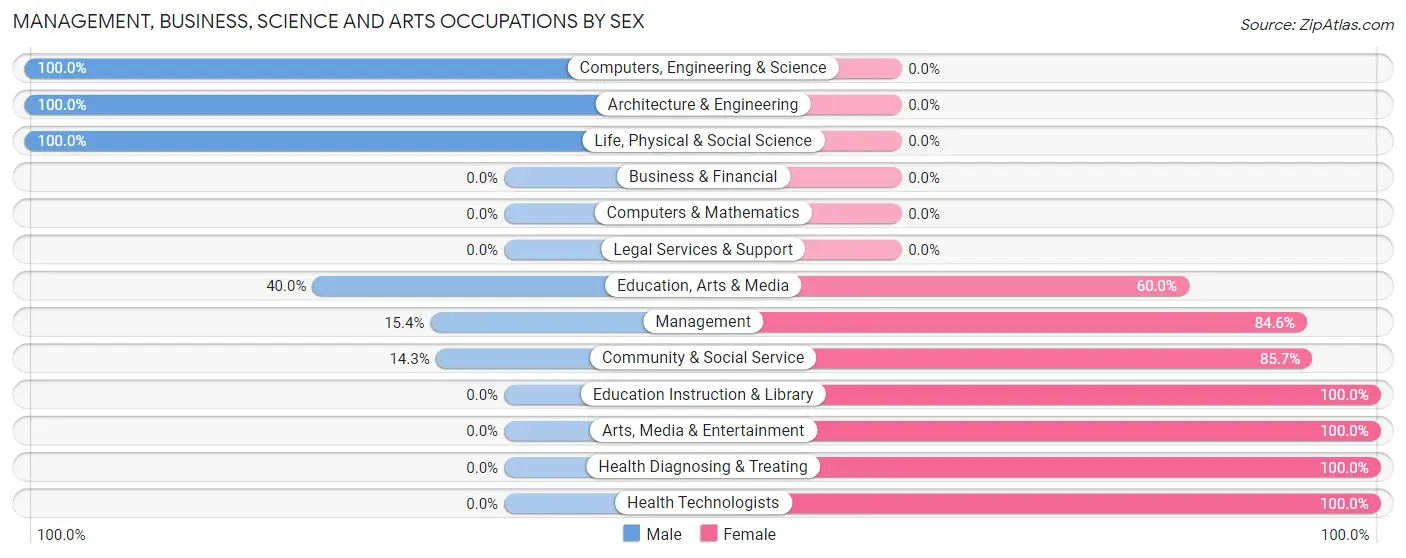
The most common Management, Business, Science and Arts occupations in Christine are Community & Social Service (14 | 13.6%), Management (13 | 12.6%), Computers, Engineering & Science (9 | 8.7%), Architecture & Engineering (7 | 6.8%), and Education Instruction & Library (7 | 6.8%).
Management, Business, Science and Arts Occupations by Sex
Within the Management, Business, Science and Arts occupations in Christine, the most male-oriented occupations are Computers, Engineering & Science (100.0%), Architecture & Engineering (100.0%), and Life, Physical & Social Science (100.0%), while the most female-oriented occupations are Education Instruction & Library (100.0%), Arts, Media & Entertainment (100.0%), and Health Diagnosing & Treating (100.0%).
| Occupation | Male | Female |
| Management | 2 (15.4%) | 11 (84.6%) |
| Business & Financial | 0 (0.0%) | 0 (0.0%) |
| Computers, Engineering & Science | 9 (100.0%) | 0 (0.0%) |
| Computers & Mathematics | 0 (0.0%) | 0 (0.0%) |
| Architecture & Engineering | 7 (100.0%) | 0 (0.0%) |
| Life, Physical & Social Science | 2 (100.0%) | 0 (0.0%) |
| Community & Social Service | 2 (14.3%) | 12 (85.7%) |
| Education, Arts & Media | 2 (40.0%) | 3 (60.0%) |
| Legal Services & Support | 0 (0.0%) | 0 (0.0%) |
| Education Instruction & Library | 0 (0.0%) | 7 (100.0%) |
| Arts, Media & Entertainment | 0 (0.0%) | 2 (100.0%) |
| Health Diagnosing & Treating | 0 (0.0%) | 6 (100.0%) |
| Health Technologists | 0 (0.0%) | 2 (100.0%) |
| Total (Category) | 13 (30.9%) | 29 (69.1%) |
| Total (Overall) | 53 (51.5%) | 50 (48.5%) |
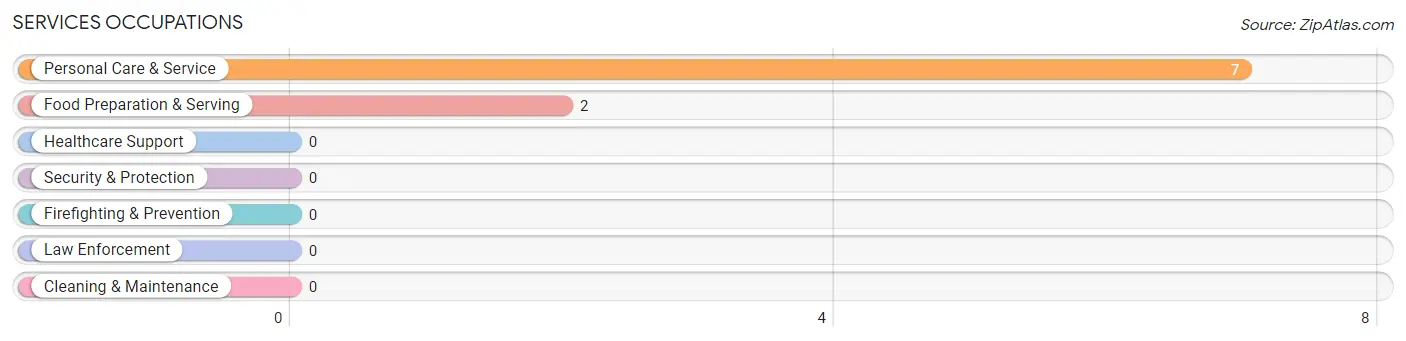
Services Occupations
The most common Services occupations in Christine are Personal Care & Service (7 | 6.8%), and Food Preparation & Serving (2 | 1.9%).
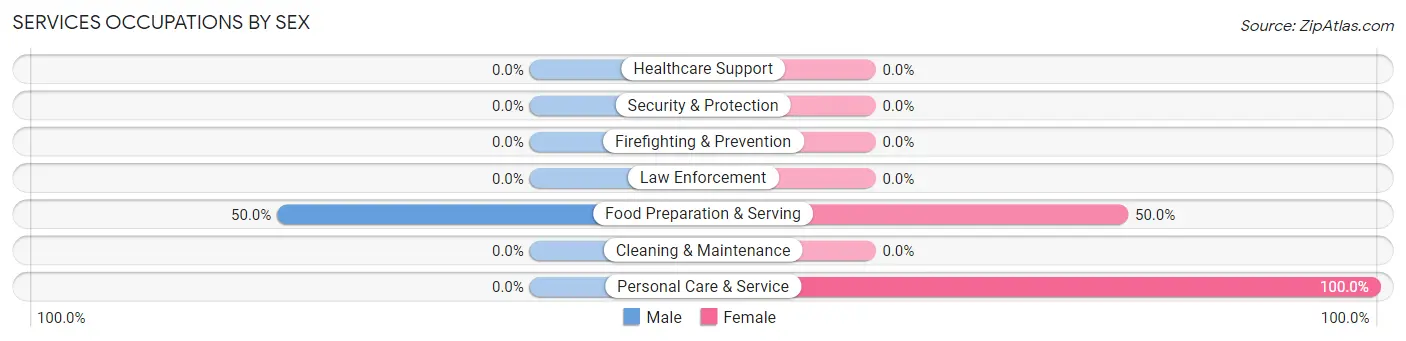
Services Occupations by Sex
| Occupation | Male | Female |
| Healthcare Support | 0 (0.0%) | 0 (0.0%) |
| Security & Protection | 0 (0.0%) | 0 (0.0%) |
| Firefighting & Prevention | 0 (0.0%) | 0 (0.0%) |
| Law Enforcement | 0 (0.0%) | 0 (0.0%) |
| Food Preparation & Serving | 1 (50.0%) | 1 (50.0%) |
| Cleaning & Maintenance | 0 (0.0%) | 0 (0.0%) |
| Personal Care & Service | 0 (0.0%) | 7 (100.0%) |
| Total (Category) | 1 (11.1%) | 8 (88.9%) |
| Total (Overall) | 53 (51.5%) | 50 (48.5%) |
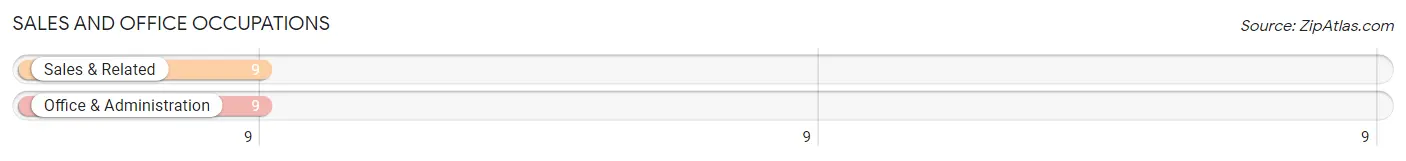
Sales and Office Occupations
The most common Sales and Office occupations in Christine are Sales & Related (9 | 8.7%), and Office & Administration (9 | 8.7%).
Sales and Office Occupations by Sex

| Occupation | Male | Female |
| Sales & Related | 6 (66.7%) | 3 (33.3%) |
| Office & Administration | 1 (11.1%) | 8 (88.9%) |
| Total (Category) | 7 (38.9%) | 11 (61.1%) |
| Total (Overall) | 53 (51.5%) | 50 (48.5%) |
Natural Resources, Construction and Maintenance Occupations
The most common Natural Resources, Construction and Maintenance occupations in Christine are Installation, Maintenance & Repair (4 | 3.9%), Farming, Fishing & Forestry (3 | 2.9%), and Construction & Extraction (2 | 1.9%).
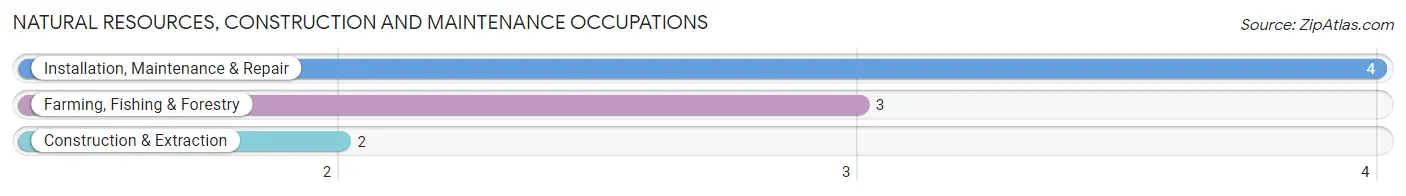
Natural Resources, Construction and Maintenance Occupations by Sex
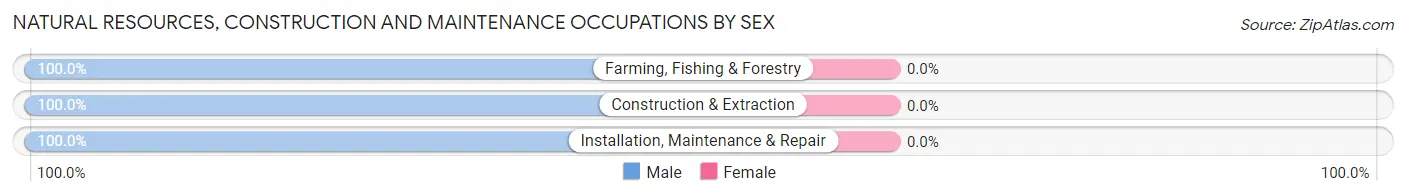
| Occupation | Male | Female |
| Farming, Fishing & Forestry | 3 (100.0%) | 0 (0.0%) |
| Construction & Extraction | 2 (100.0%) | 0 (0.0%) |
| Installation, Maintenance & Repair | 4 (100.0%) | 0 (0.0%) |
| Total (Category) | 9 (100.0%) | 0 (0.0%) |
| Total (Overall) | 53 (51.5%) | 50 (48.5%) |
Production, Transportation and Moving Occupations
The most common Production, Transportation and Moving occupations in Christine are Production (13 | 12.6%), Material Moving (8 | 7.8%), and Transportation (4 | 3.9%).
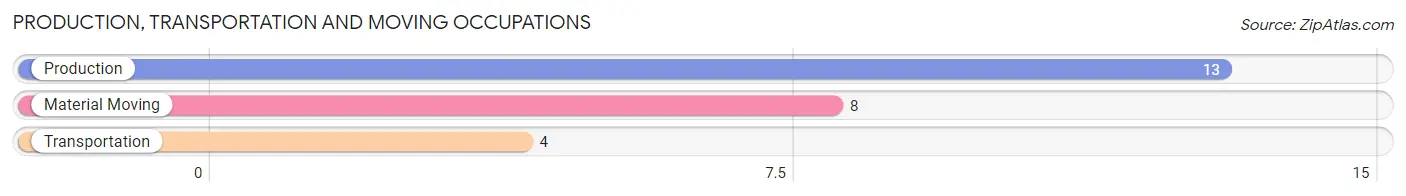
Production, Transportation and Moving Occupations by Sex
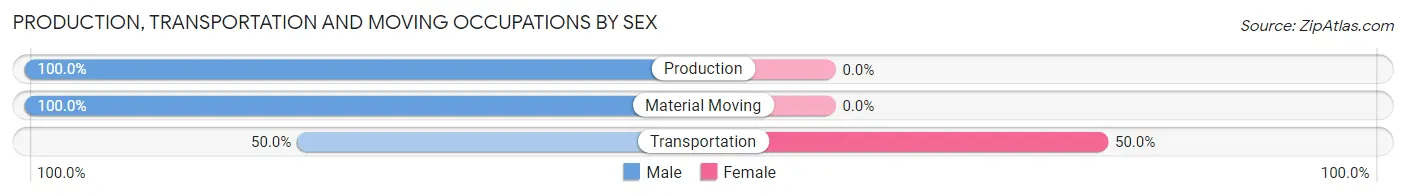
| Occupation | Male | Female |
| Production | 13 (100.0%) | 0 (0.0%) |
| Transportation | 2 (50.0%) | 2 (50.0%) |
| Material Moving | 8 (100.0%) | 0 (0.0%) |
| Total (Category) | 23 (92.0%) | 2 (8.0%) |
| Total (Overall) | 53 (51.5%) | 50 (48.5%) |
Employment Industries by Sex in Christine
Employment Industries in Christine
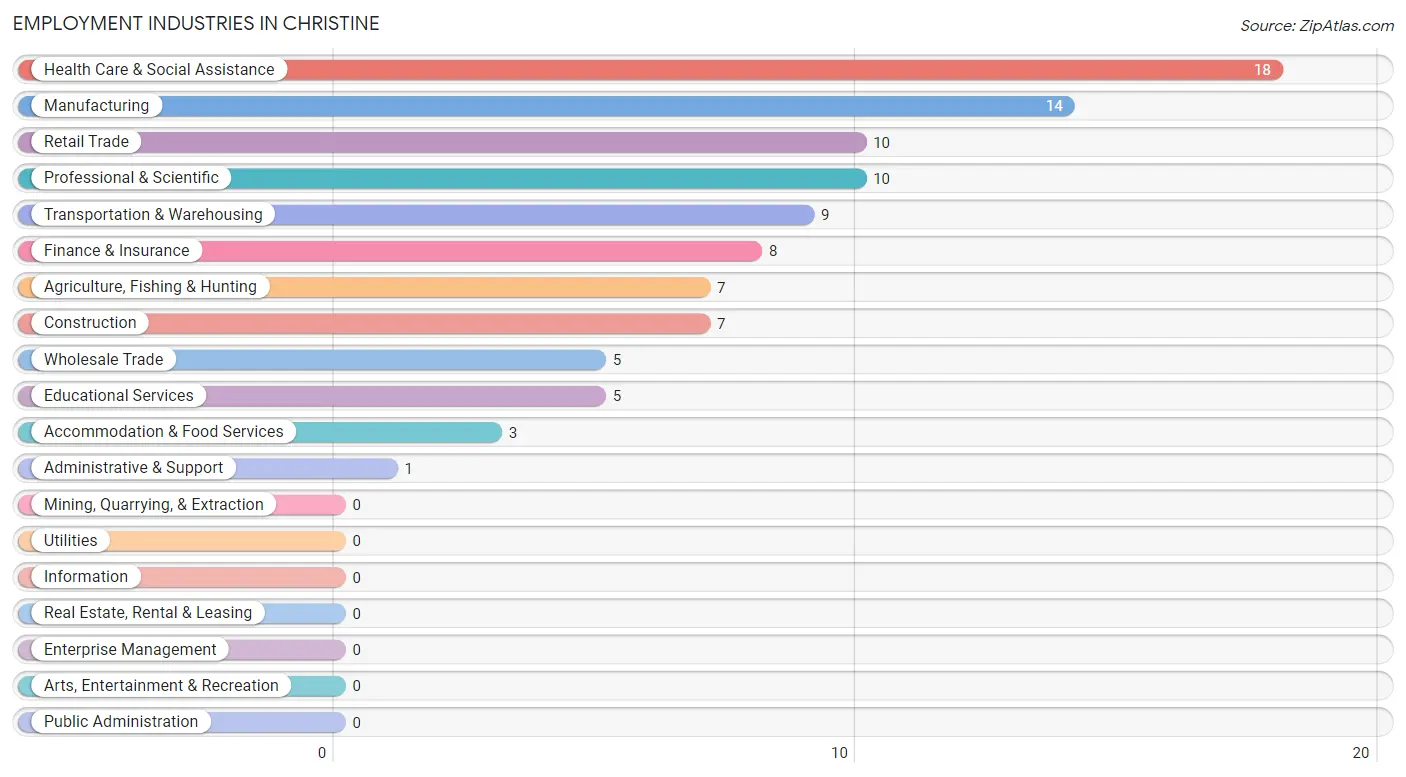
The major employment industries in Christine include Health Care & Social Assistance (18 | 17.5%), Manufacturing (14 | 13.6%), Retail Trade (10 | 9.7%), Professional & Scientific (10 | 9.7%), and Transportation & Warehousing (9 | 8.7%).
Employment Industries by Sex in Christine
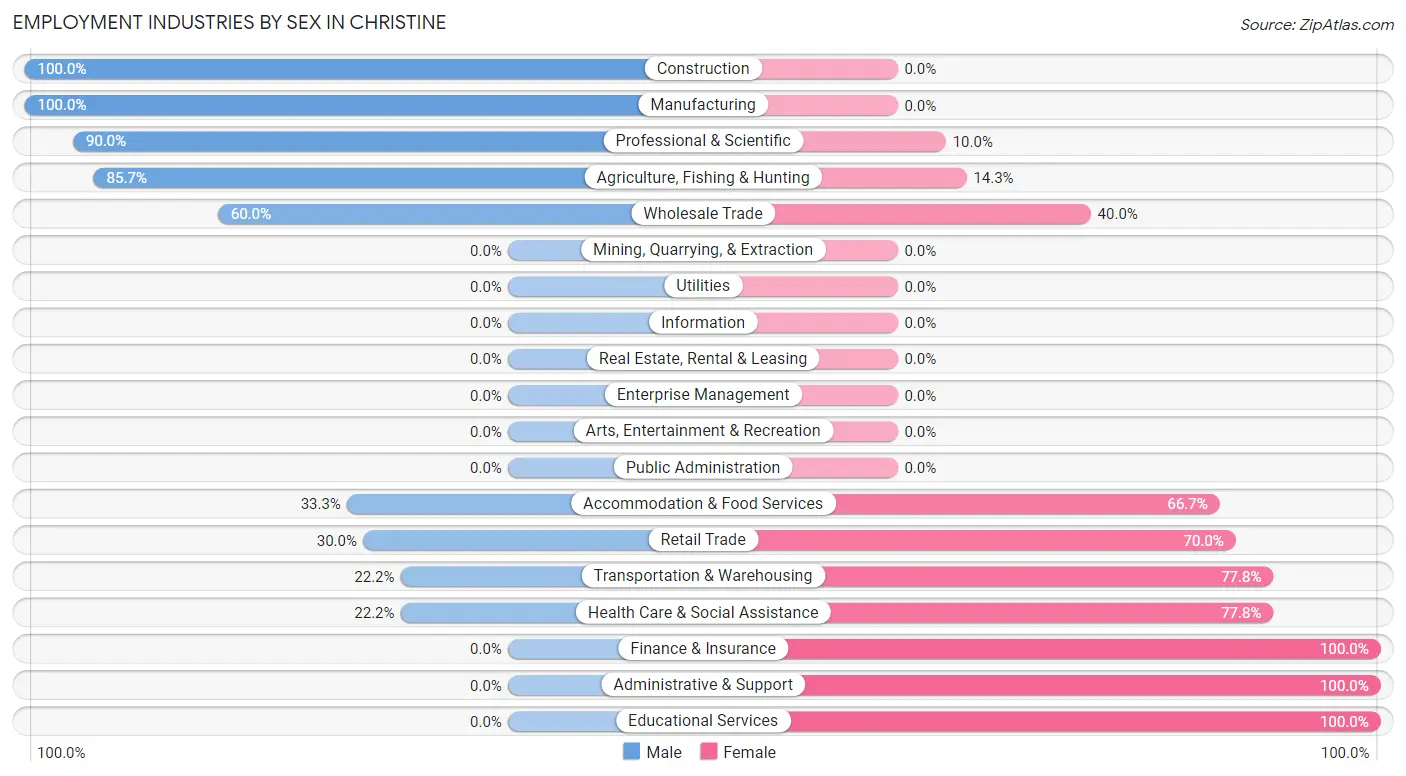
The Christine industries that see more men than women are Construction (100.0%), Manufacturing (100.0%), and Professional & Scientific (90.0%), whereas the industries that tend to have a higher number of women are Finance & Insurance (100.0%), Administrative & Support (100.0%), and Educational Services (100.0%).
| Industry | Male | Female |
| Agriculture, Fishing & Hunting | 6 (85.7%) | 1 (14.3%) |
| Mining, Quarrying, & Extraction | 0 (0.0%) | 0 (0.0%) |
| Construction | 7 (100.0%) | 0 (0.0%) |
| Manufacturing | 14 (100.0%) | 0 (0.0%) |
| Wholesale Trade | 3 (60.0%) | 2 (40.0%) |
| Retail Trade | 3 (30.0%) | 7 (70.0%) |
| Transportation & Warehousing | 2 (22.2%) | 7 (77.8%) |
| Utilities | 0 (0.0%) | 0 (0.0%) |
| Information | 0 (0.0%) | 0 (0.0%) |
| Finance & Insurance | 0 (0.0%) | 8 (100.0%) |
| Real Estate, Rental & Leasing | 0 (0.0%) | 0 (0.0%) |
| Professional & Scientific | 9 (90.0%) | 1 (10.0%) |
| Enterprise Management | 0 (0.0%) | 0 (0.0%) |
| Administrative & Support | 0 (0.0%) | 1 (100.0%) |
| Educational Services | 0 (0.0%) | 5 (100.0%) |
| Health Care & Social Assistance | 4 (22.2%) | 14 (77.8%) |
| Arts, Entertainment & Recreation | 0 (0.0%) | 0 (0.0%) |
| Accommodation & Food Services | 1 (33.3%) | 2 (66.7%) |
| Public Administration | 0 (0.0%) | 0 (0.0%) |
| Total | 53 (51.5%) | 50 (48.5%) |
Education in Christine
School Enrollment in Christine
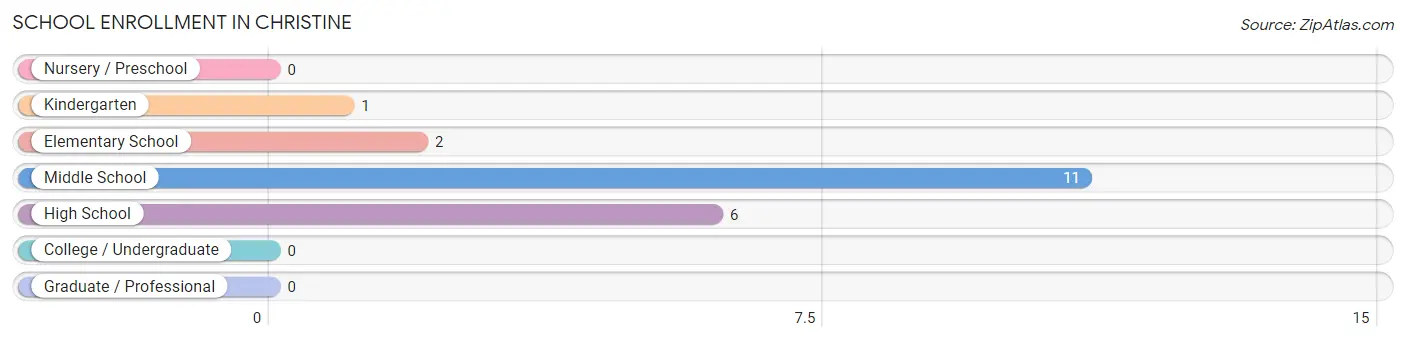
The most common levels of schooling among the 20 students in Christine are middle school (11 | 55.0%), high school (6 | 30.0%), and elementary school (2 | 10.0%).
| School Level | # Students | % Students |
| Nursery / Preschool | 0 | 0.0% |
| Kindergarten | 1 | 5.0% |
| Elementary School | 2 | 10.0% |
| Middle School | 11 | 55.0% |
| High School | 6 | 30.0% |
| College / Undergraduate | 0 | 0.0% |
| Graduate / Professional | 0 | 0.0% |
| Total | 20 | 100.0% |
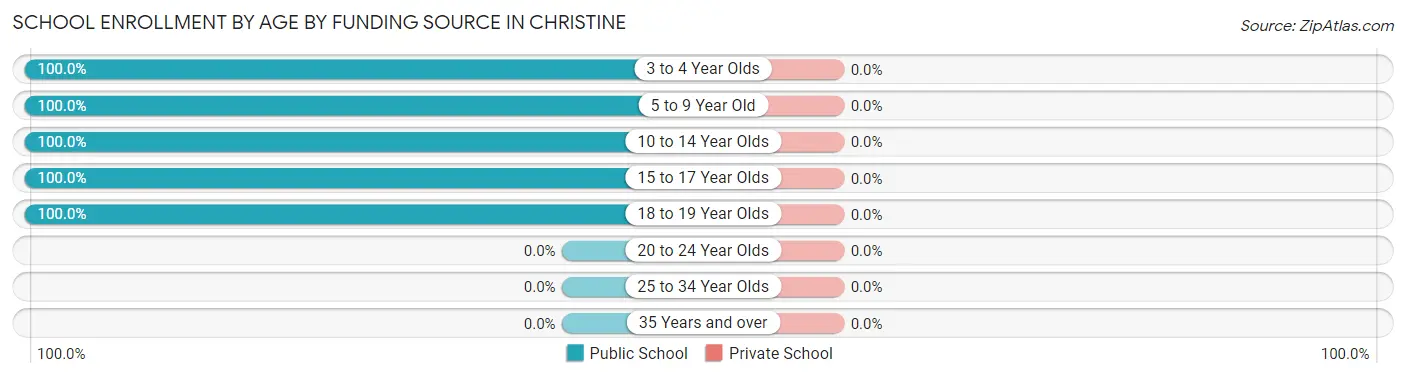
School Enrollment by Age by Funding Source in Christine
| Age Bracket | Public School | Private School |
| 3 to 4 Year Olds | 1 (100.0%) | 0 (0.0%) |
| 5 to 9 Year Old | 2 (100.0%) | 0 (0.0%) |
| 10 to 14 Year Olds | 11 (100.0%) | 0 (0.0%) |
| 15 to 17 Year Olds | 3 (100.0%) | 0 (0.0%) |
| 18 to 19 Year Olds | 3 (100.0%) | 0 (0.0%) |
| 20 to 24 Year Olds | 0 (0.0%) | 0 (0.0%) |
| 25 to 34 Year Olds | 0 (0.0%) | 0 (0.0%) |
| 35 Years and over | 0 (0.0%) | 0 (0.0%) |
| Total | 20 (100.0%) | 0 (0.0%) |
Educational Attainment by Field of Study in Christine
Education (10 | 30.3%), bio, nature & agricultural (8 | 24.2%), science & technology (7 | 21.2%), arts & humanities (3 | 9.1%), and physical & health sciences (2 | 6.1%) are the most common fields of study among 33 individuals in Christine who have obtained a bachelor's degree or higher.
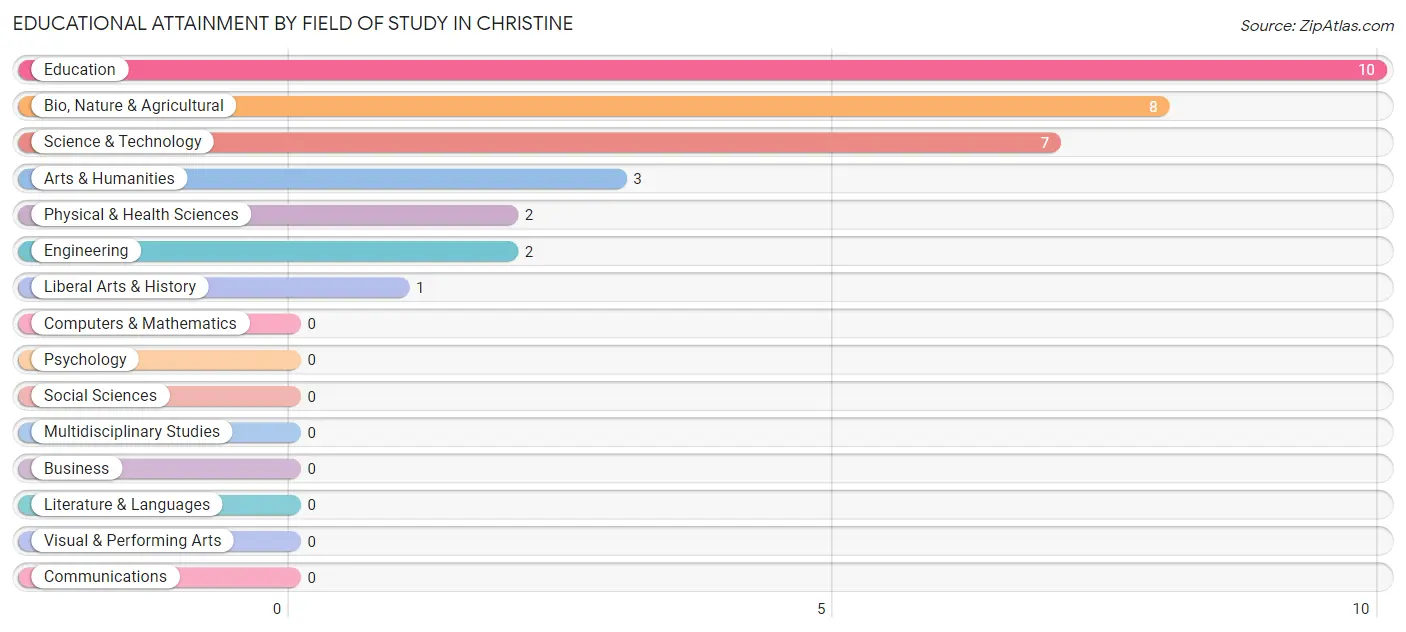
| Field of Study | # Graduates | % Graduates |
| Computers & Mathematics | 0 | 0.0% |
| Bio, Nature & Agricultural | 8 | 24.2% |
| Physical & Health Sciences | 2 | 6.1% |
| Psychology | 0 | 0.0% |
| Social Sciences | 0 | 0.0% |
| Engineering | 2 | 6.1% |
| Multidisciplinary Studies | 0 | 0.0% |
| Science & Technology | 7 | 21.2% |
| Business | 0 | 0.0% |
| Education | 10 | 30.3% |
| Literature & Languages | 0 | 0.0% |
| Liberal Arts & History | 1 | 3.0% |
| Visual & Performing Arts | 0 | 0.0% |
| Communications | 0 | 0.0% |
| Arts & Humanities | 3 | 9.1% |
| Total | 33 | 100.0% |
Transportation & Commute in Christine
Vehicle Availability by Sex in Christine
The most prevalent vehicle ownership categories in Christine are males with 3 vehicles (25, accounting for 47.2%) and females with 3 vehicles (24, making up 52.1%).
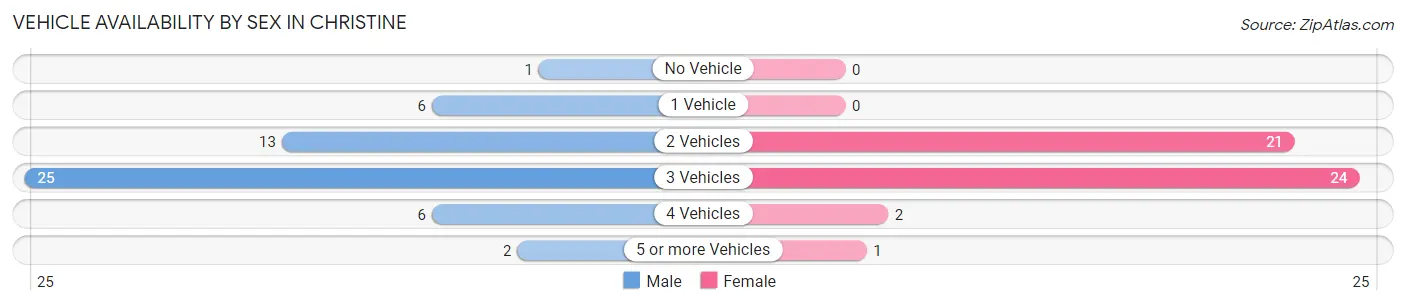
| Vehicles Available | Male | Female |
| No Vehicle | 1 (1.9%) | 0 (0.0%) |
| 1 Vehicle | 6 (11.3%) | 0 (0.0%) |
| 2 Vehicles | 13 (24.5%) | 21 (43.8%) |
| 3 Vehicles | 25 (47.2%) | 24 (50.0%) |
| 4 Vehicles | 6 (11.3%) | 2 (4.2%) |
| 5 or more Vehicles | 2 (3.8%) | 1 (2.1%) |
| Total | 53 (100.0%) | 48 (100.0%) |
Commute Time in Christine
The most frequently occuring commute durations in Christine are 30 to 34 minutes (40 commuters, 44.0%), 20 to 24 minutes (20 commuters, 22.0%), and 25 to 29 minutes (18 commuters, 19.8%).
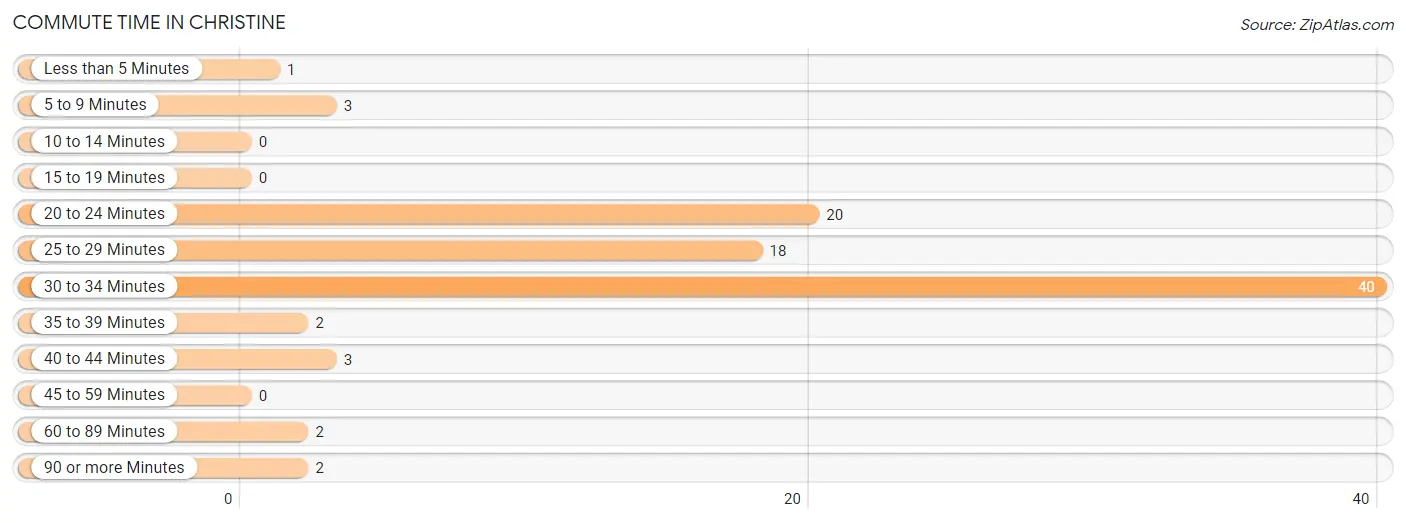
| Commute Time | # Commuters | % Commuters |
| Less than 5 Minutes | 1 | 1.1% |
| 5 to 9 Minutes | 3 | 3.3% |
| 10 to 14 Minutes | 0 | 0.0% |
| 15 to 19 Minutes | 0 | 0.0% |
| 20 to 24 Minutes | 20 | 22.0% |
| 25 to 29 Minutes | 18 | 19.8% |
| 30 to 34 Minutes | 40 | 44.0% |
| 35 to 39 Minutes | 2 | 2.2% |
| 40 to 44 Minutes | 3 | 3.3% |
| 45 to 59 Minutes | 0 | 0.0% |
| 60 to 89 Minutes | 2 | 2.2% |
| 90 or more Minutes | 2 | 2.2% |
Commute Time by Sex in Christine
The most common commute times in Christine are 30 to 34 minutes (21 commuters, 41.2%) for males and 30 to 34 minutes (19 commuters, 47.5%) for females.
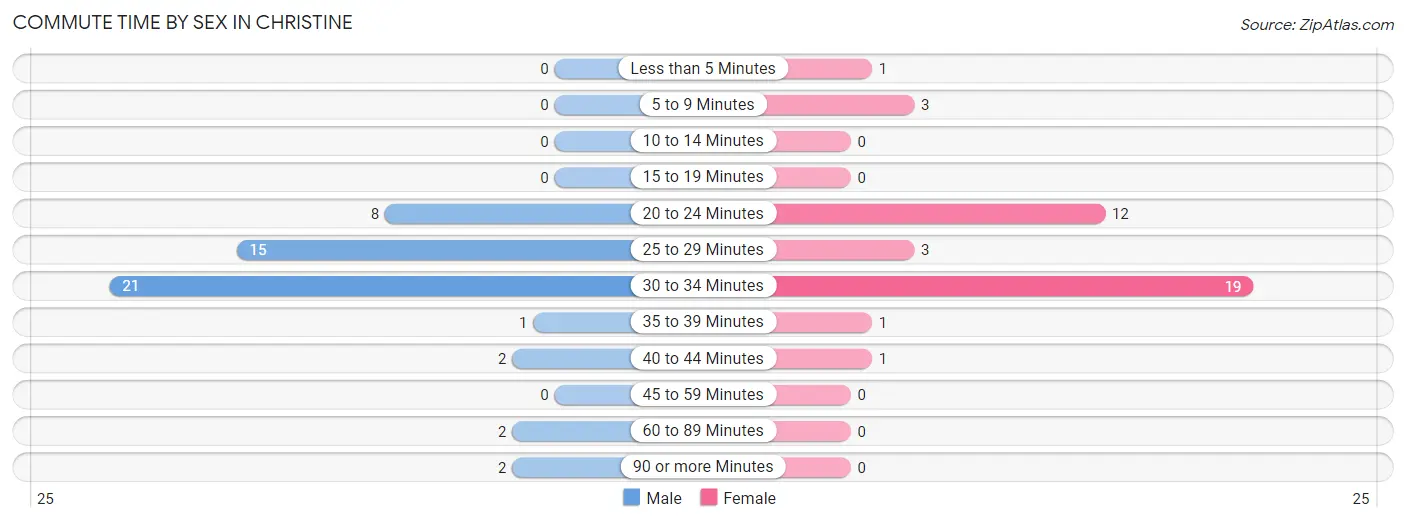
| Commute Time | Male | Female |
| Less than 5 Minutes | 0 (0.0%) | 1 (2.5%) |
| 5 to 9 Minutes | 0 (0.0%) | 3 (7.5%) |
| 10 to 14 Minutes | 0 (0.0%) | 0 (0.0%) |
| 15 to 19 Minutes | 0 (0.0%) | 0 (0.0%) |
| 20 to 24 Minutes | 8 (15.7%) | 12 (30.0%) |
| 25 to 29 Minutes | 15 (29.4%) | 3 (7.5%) |
| 30 to 34 Minutes | 21 (41.2%) | 19 (47.5%) |
| 35 to 39 Minutes | 1 (2.0%) | 1 (2.5%) |
| 40 to 44 Minutes | 2 (3.9%) | 1 (2.5%) |
| 45 to 59 Minutes | 0 (0.0%) | 0 (0.0%) |
| 60 to 89 Minutes | 2 (3.9%) | 0 (0.0%) |
| 90 or more Minutes | 2 (3.9%) | 0 (0.0%) |
Time of Departure to Work by Sex in Christine
The most frequent times of departure to work in Christine are 7:00 AM to 7:29 AM (15, 29.4%) for males and 7:00 AM to 7:29 AM (14, 35.0%) for females.
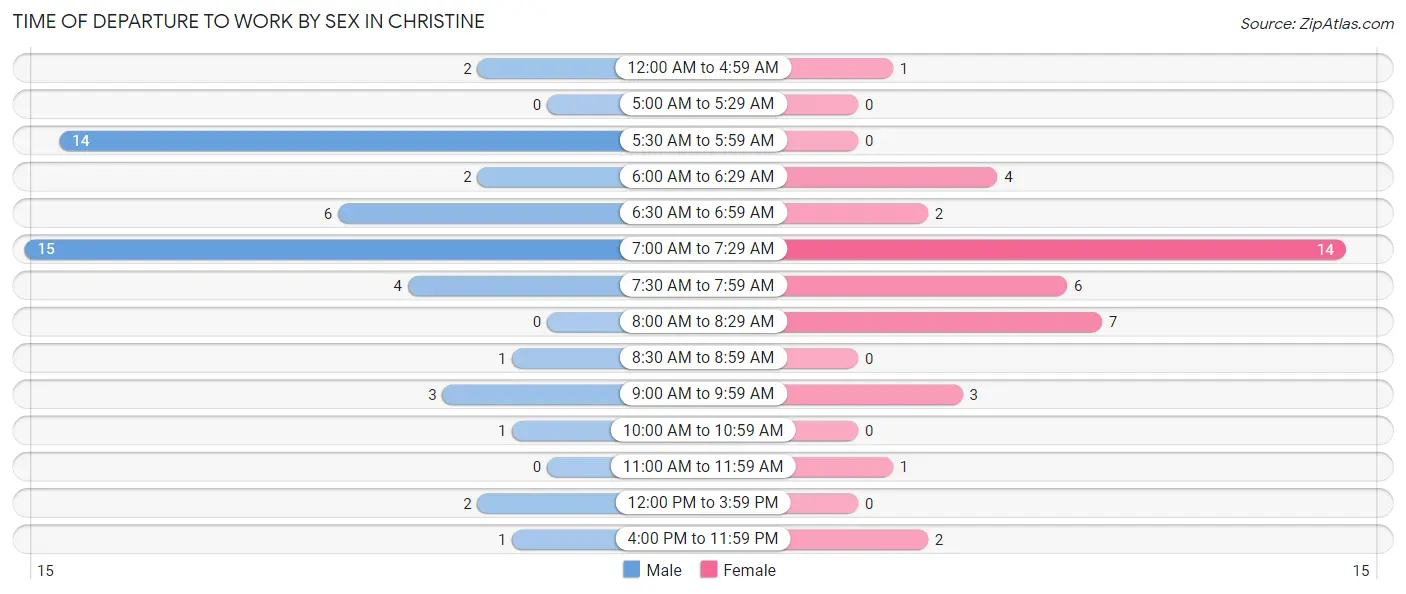
| Time of Departure | Male | Female |
| 12:00 AM to 4:59 AM | 2 (3.9%) | 1 (2.5%) |
| 5:00 AM to 5:29 AM | 0 (0.0%) | 0 (0.0%) |
| 5:30 AM to 5:59 AM | 14 (27.5%) | 0 (0.0%) |
| 6:00 AM to 6:29 AM | 2 (3.9%) | 4 (10.0%) |
| 6:30 AM to 6:59 AM | 6 (11.8%) | 2 (5.0%) |
| 7:00 AM to 7:29 AM | 15 (29.4%) | 14 (35.0%) |
| 7:30 AM to 7:59 AM | 4 (7.8%) | 6 (15.0%) |
| 8:00 AM to 8:29 AM | 0 (0.0%) | 7 (17.5%) |
| 8:30 AM to 8:59 AM | 1 (2.0%) | 0 (0.0%) |
| 9:00 AM to 9:59 AM | 3 (5.9%) | 3 (7.5%) |
| 10:00 AM to 10:59 AM | 1 (2.0%) | 0 (0.0%) |
| 11:00 AM to 11:59 AM | 0 (0.0%) | 1 (2.5%) |
| 12:00 PM to 3:59 PM | 2 (3.9%) | 0 (0.0%) |
| 4:00 PM to 11:59 PM | 1 (2.0%) | 2 (5.0%) |
| Total | 51 (100.0%) | 40 (100.0%) |
Housing Occupancy in Christine
Occupancy by Ownership in Christine
Of the total 65 dwellings in Christine, owner-occupied units account for 60 (92.3%), while renter-occupied units make up 5 (7.7%).
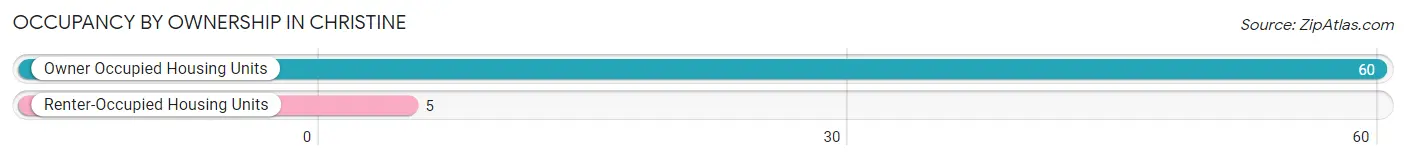
| Occupancy | # Housing Units | % Housing Units |
| Owner Occupied Housing Units | 60 | 92.3% |
| Renter-Occupied Housing Units | 5 | 7.7% |
| Total Occupied Housing Units | 65 | 100.0% |
Occupancy by Household Size in Christine
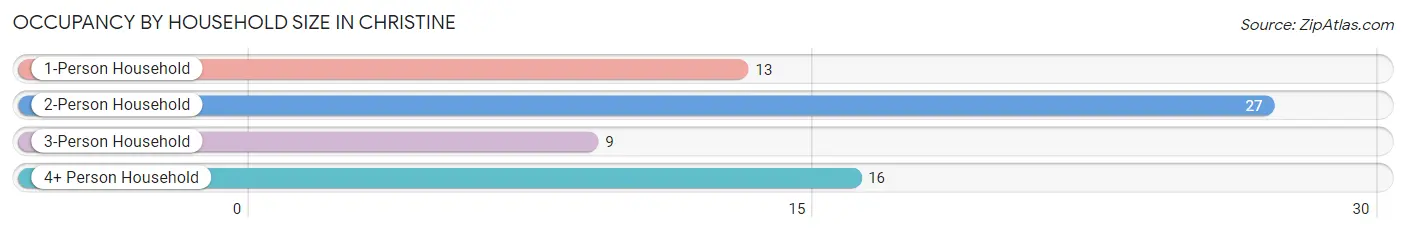
| Household Size | # Housing Units | % Housing Units |
| 1-Person Household | 13 | 20.0% |
| 2-Person Household | 27 | 41.5% |
| 3-Person Household | 9 | 13.9% |
| 4+ Person Household | 16 | 24.6% |
| Total Housing Units | 65 | 100.0% |
Occupancy by Ownership by Household Size in Christine
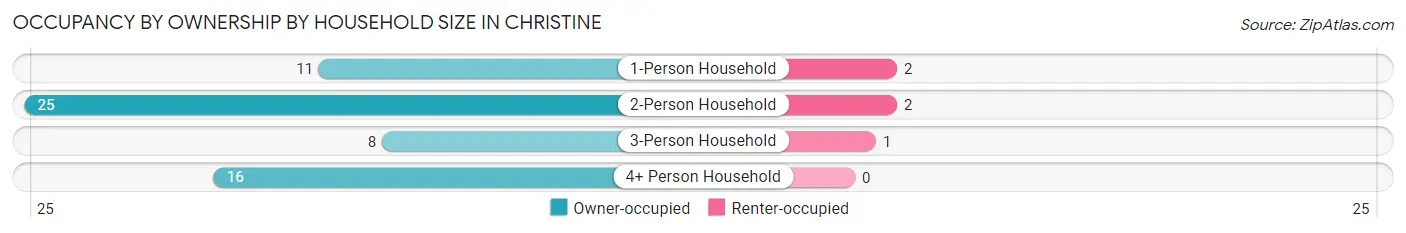
| Household Size | Owner-occupied | Renter-occupied |
| 1-Person Household | 11 (84.6%) | 2 (15.4%) |
| 2-Person Household | 25 (92.6%) | 2 (7.4%) |
| 3-Person Household | 8 (88.9%) | 1 (11.1%) |
| 4+ Person Household | 16 (100.0%) | 0 (0.0%) |
| Total Housing Units | 60 (92.3%) | 5 (7.7%) |
Occupancy by Educational Attainment in Christine
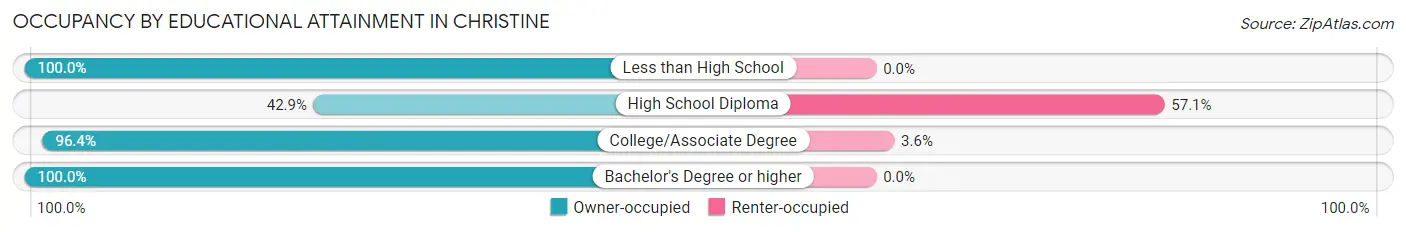
| Household Size | Owner-occupied | Renter-occupied |
| Less than High School | 3 (100.0%) | 0 (0.0%) |
| High School Diploma | 3 (42.9%) | 4 (57.1%) |
| College/Associate Degree | 27 (96.4%) | 1 (3.6%) |
| Bachelor's Degree or higher | 27 (100.0%) | 0 (0.0%) |
Occupancy by Age of Householder in Christine
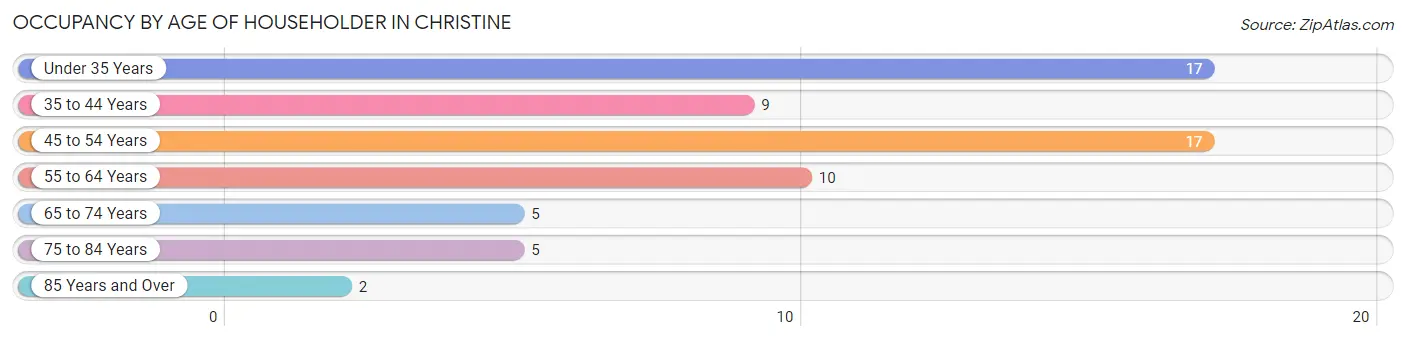
| Age Bracket | # Households | % Households |
| Under 35 Years | 17 | 26.2% |
| 35 to 44 Years | 9 | 13.9% |
| 45 to 54 Years | 17 | 26.2% |
| 55 to 64 Years | 10 | 15.4% |
| 65 to 74 Years | 5 | 7.7% |
| 75 to 84 Years | 5 | 7.7% |
| 85 Years and Over | 2 | 3.1% |
| Total | 65 | 100.0% |
Housing Finances in Christine
Median Income by Occupancy in Christine
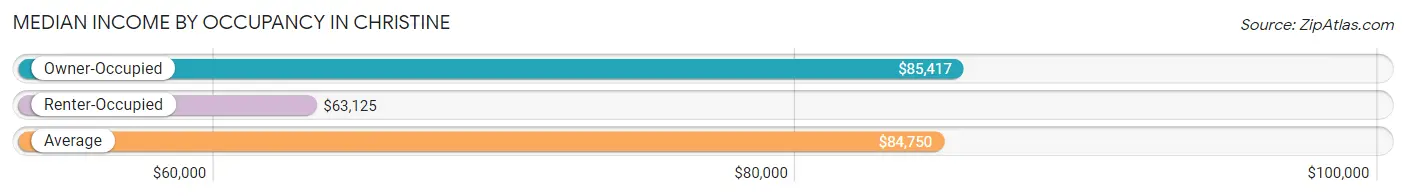
| Occupancy Type | # Households | Median Income |
| Owner-Occupied | 60 (92.3%) | $85,417 |
| Renter-Occupied | 5 (7.7%) | $63,125 |
| Average | 65 (100.0%) | $84,750 |
Occupancy by Householder Income Bracket in Christine
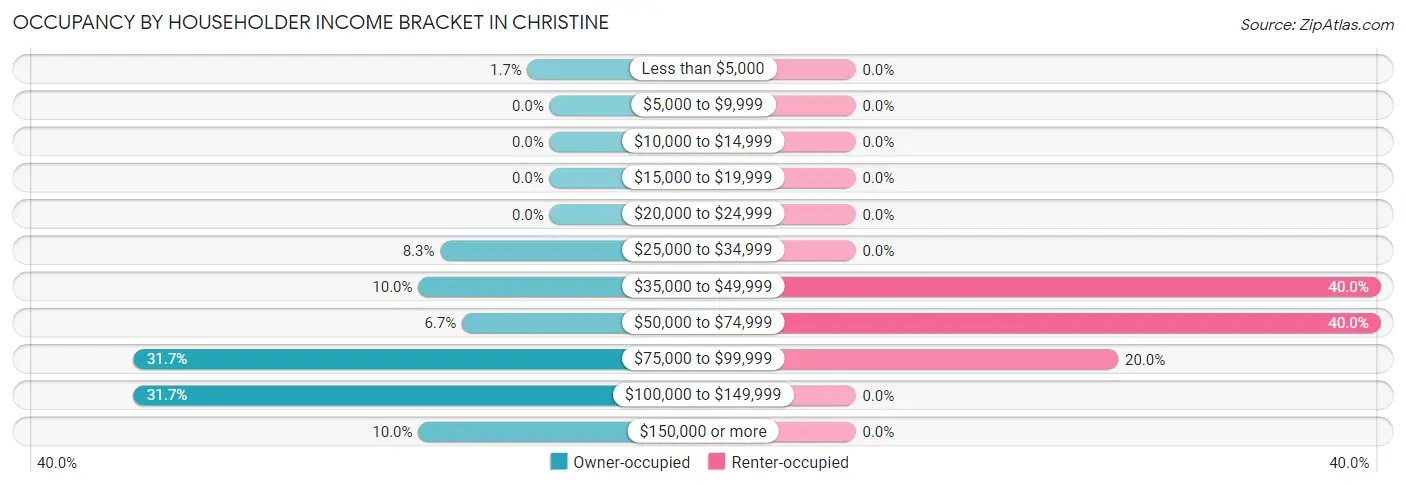
| Income Bracket | Owner-occupied | Renter-occupied |
| Less than $5,000 | 1 (1.7%) | 0 (0.0%) |
| $5,000 to $9,999 | 0 (0.0%) | 0 (0.0%) |
| $10,000 to $14,999 | 0 (0.0%) | 0 (0.0%) |
| $15,000 to $19,999 | 0 (0.0%) | 0 (0.0%) |
| $20,000 to $24,999 | 0 (0.0%) | 0 (0.0%) |
| $25,000 to $34,999 | 5 (8.3%) | 0 (0.0%) |
| $35,000 to $49,999 | 6 (10.0%) | 2 (40.0%) |
| $50,000 to $74,999 | 4 (6.7%) | 2 (40.0%) |
| $75,000 to $99,999 | 19 (31.7%) | 1 (20.0%) |
| $100,000 to $149,999 | 19 (31.7%) | 0 (0.0%) |
| $150,000 or more | 6 (10.0%) | 0 (0.0%) |
| Total | 60 (100.0%) | 5 (100.0%) |
Monthly Housing Cost Tiers in Christine
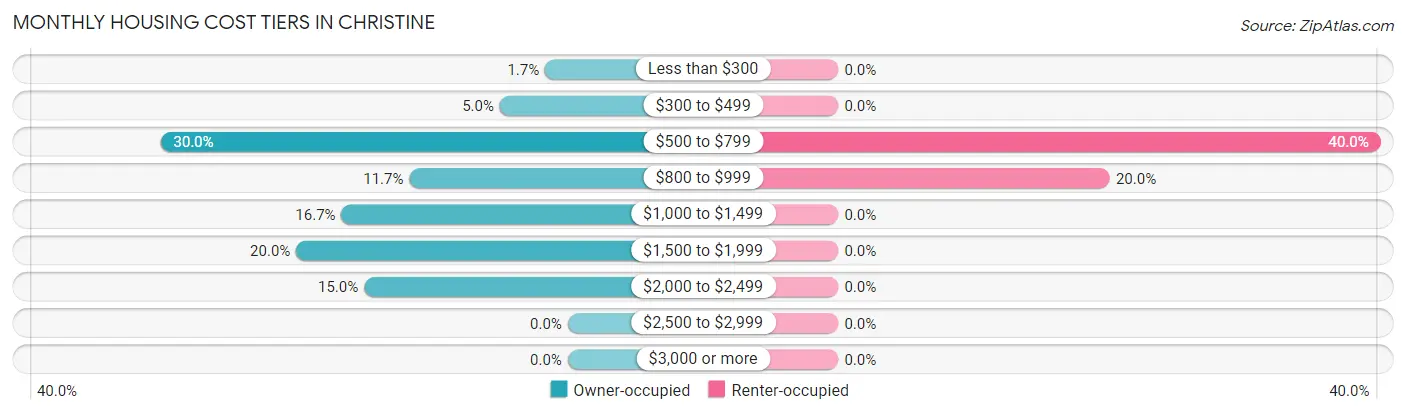
| Monthly Cost | Owner-occupied | Renter-occupied |
| Less than $300 | 1 (1.7%) | 0 (0.0%) |
| $300 to $499 | 3 (5.0%) | 0 (0.0%) |
| $500 to $799 | 18 (30.0%) | 2 (40.0%) |
| $800 to $999 | 7 (11.7%) | 1 (20.0%) |
| $1,000 to $1,499 | 10 (16.7%) | 0 (0.0%) |
| $1,500 to $1,999 | 12 (20.0%) | 0 (0.0%) |
| $2,000 to $2,499 | 9 (15.0%) | 0 (0.0%) |
| $2,500 to $2,999 | 0 (0.0%) | 0 (0.0%) |
| $3,000 or more | 0 (0.0%) | 0 (0.0%) |
| Total | 60 (100.0%) | 5 (100.0%) |
Physical Housing Characteristics in Christine
Housing Structures in Christine
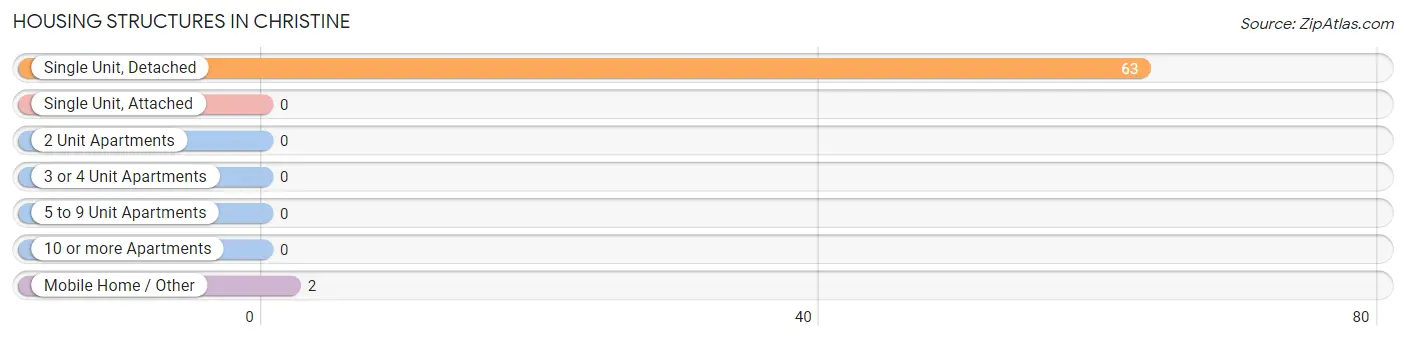
| Structure Type | # Housing Units | % Housing Units |
| Single Unit, Detached | 63 | 96.9% |
| Single Unit, Attached | 0 | 0.0% |
| 2 Unit Apartments | 0 | 0.0% |
| 3 or 4 Unit Apartments | 0 | 0.0% |
| 5 to 9 Unit Apartments | 0 | 0.0% |
| 10 or more Apartments | 0 | 0.0% |
| Mobile Home / Other | 2 | 3.1% |
| Total | 65 | 100.0% |
Housing Structures by Occupancy in Christine
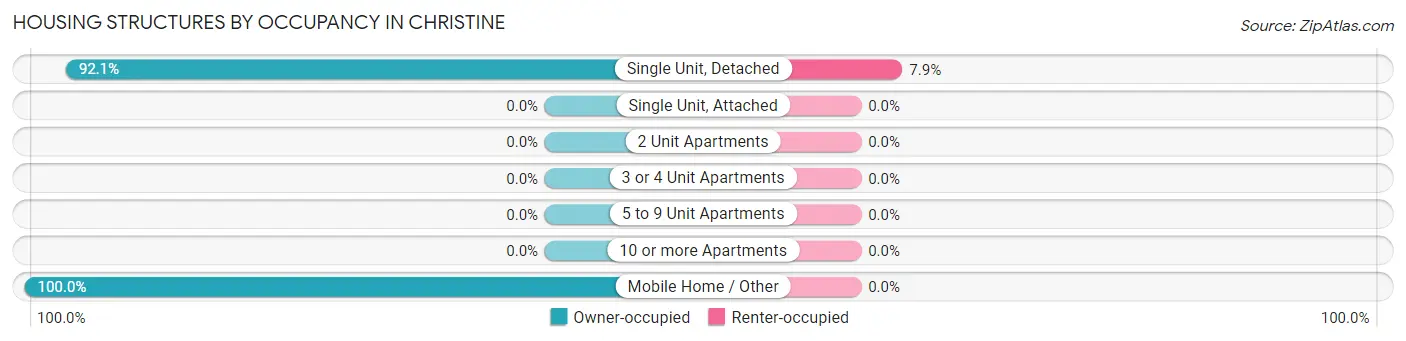
| Structure Type | Owner-occupied | Renter-occupied |
| Single Unit, Detached | 58 (92.1%) | 5 (7.9%) |
| Single Unit, Attached | 0 (0.0%) | 0 (0.0%) |
| 2 Unit Apartments | 0 (0.0%) | 0 (0.0%) |
| 3 or 4 Unit Apartments | 0 (0.0%) | 0 (0.0%) |
| 5 to 9 Unit Apartments | 0 (0.0%) | 0 (0.0%) |
| 10 or more Apartments | 0 (0.0%) | 0 (0.0%) |
| Mobile Home / Other | 2 (100.0%) | 0 (0.0%) |
| Total | 60 (92.3%) | 5 (7.7%) |
Housing Structures by Number of Rooms in Christine
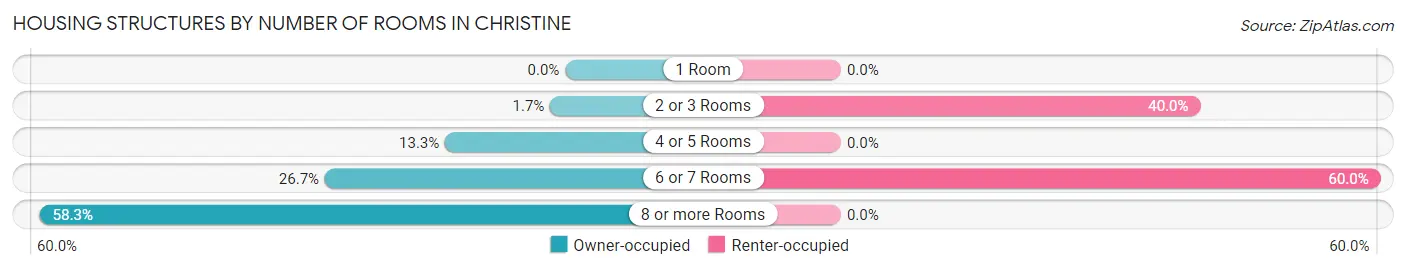
| Number of Rooms | Owner-occupied | Renter-occupied |
| 1 Room | 0 (0.0%) | 0 (0.0%) |
| 2 or 3 Rooms | 1 (1.7%) | 2 (40.0%) |
| 4 or 5 Rooms | 8 (13.3%) | 0 (0.0%) |
| 6 or 7 Rooms | 16 (26.7%) | 3 (60.0%) |
| 8 or more Rooms | 35 (58.3%) | 0 (0.0%) |
| Total | 60 (100.0%) | 5 (100.0%) |
Housing Structure by Heating Type in Christine
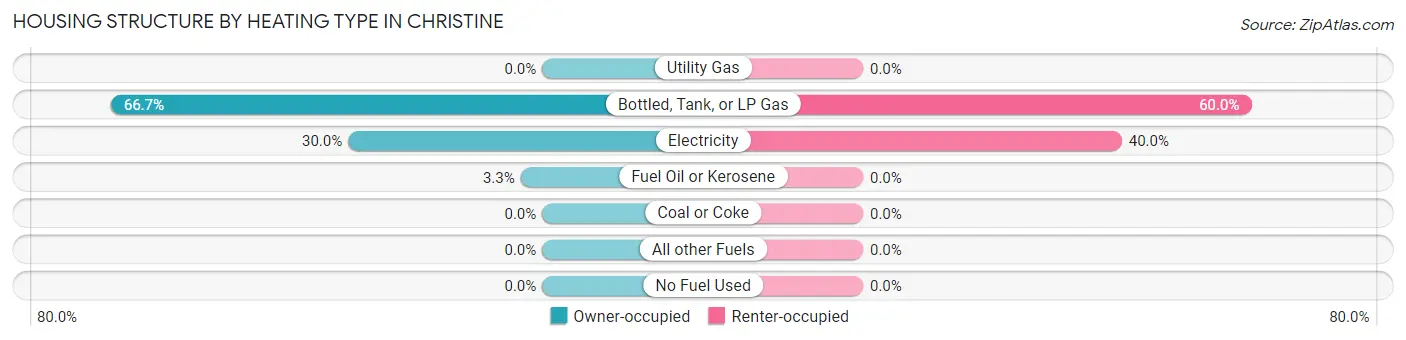
| Heating Type | Owner-occupied | Renter-occupied |
| Utility Gas | 0 (0.0%) | 0 (0.0%) |
| Bottled, Tank, or LP Gas | 40 (66.7%) | 3 (60.0%) |
| Electricity | 18 (30.0%) | 2 (40.0%) |
| Fuel Oil or Kerosene | 2 (3.3%) | 0 (0.0%) |
| Coal or Coke | 0 (0.0%) | 0 (0.0%) |
| All other Fuels | 0 (0.0%) | 0 (0.0%) |
| No Fuel Used | 0 (0.0%) | 0 (0.0%) |
| Total | 60 (100.0%) | 5 (100.0%) |
Household Vehicle Usage in Christine
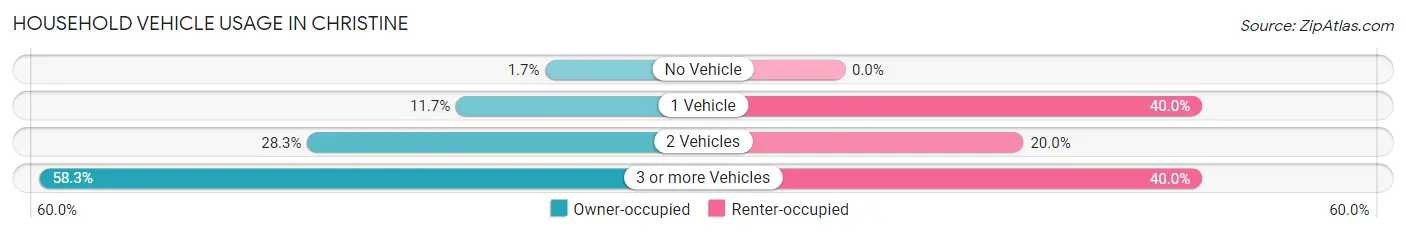
| Vehicles per Household | Owner-occupied | Renter-occupied |
| No Vehicle | 1 (1.7%) | 0 (0.0%) |
| 1 Vehicle | 7 (11.7%) | 2 (40.0%) |
| 2 Vehicles | 17 (28.3%) | 1 (20.0%) |
| 3 or more Vehicles | 35 (58.3%) | 2 (40.0%) |
| Total | 60 (100.0%) | 5 (100.0%) |
Real Estate & Mortgages in Christine
Real Estate and Mortgage Overview in Christine
| Characteristic | Without Mortgage | With Mortgage |
| Housing Units | 23 | 37 |
| Median Property Value | $258,300 | $246,400 |
| Median Household Income | $84,750 | $3 |
| Monthly Housing Costs | $658 | $0 |
| Real Estate Taxes | $2,167 | $0 |
Property Value by Mortgage Status in Christine
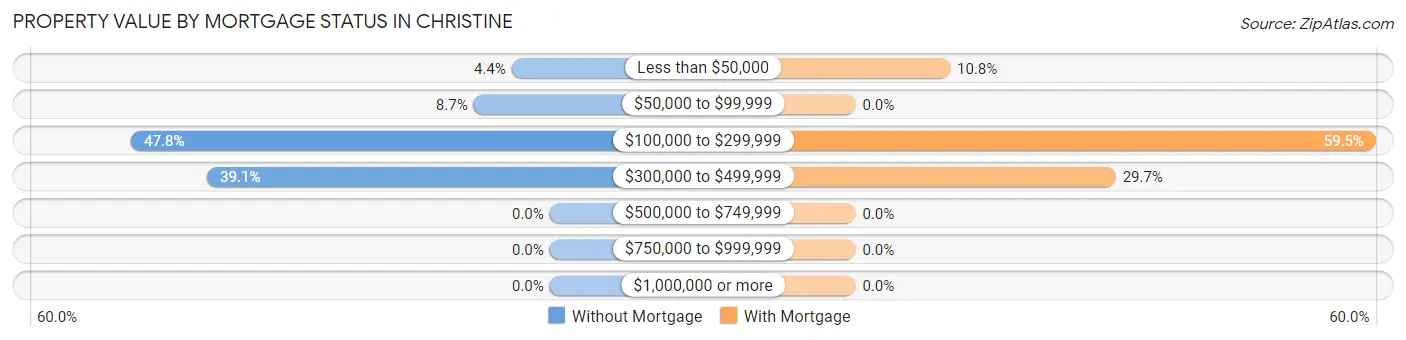
| Property Value | Without Mortgage | With Mortgage |
| Less than $50,000 | 1 (4.3%) | 4 (10.8%) |
| $50,000 to $99,999 | 2 (8.7%) | 0 (0.0%) |
| $100,000 to $299,999 | 11 (47.8%) | 22 (59.5%) |
| $300,000 to $499,999 | 9 (39.1%) | 11 (29.7%) |
| $500,000 to $749,999 | 0 (0.0%) | 0 (0.0%) |
| $750,000 to $999,999 | 0 (0.0%) | 0 (0.0%) |
| $1,000,000 or more | 0 (0.0%) | 0 (0.0%) |
| Total | 23 (100.0%) | 37 (100.0%) |
Household Income by Mortgage Status in Christine
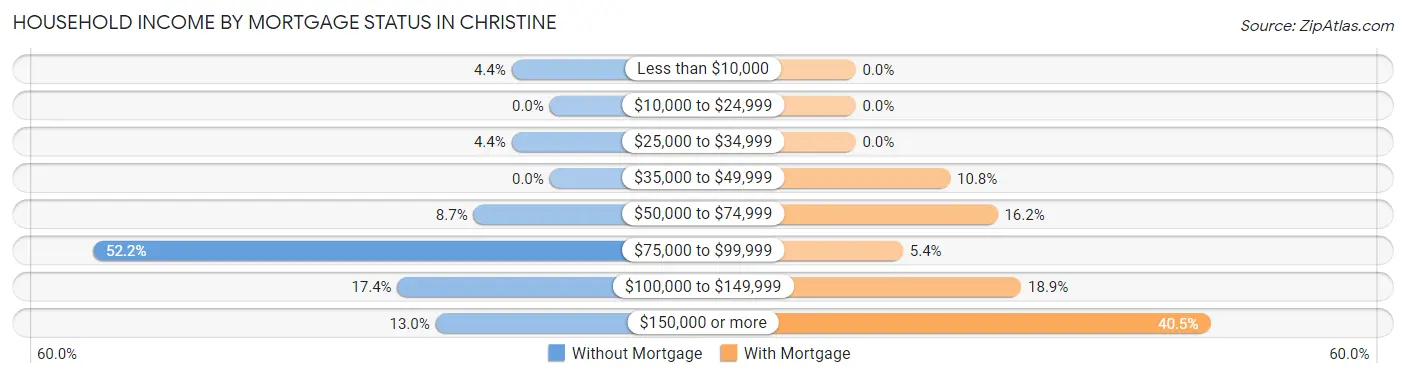
| Household Income | Without Mortgage | With Mortgage |
| Less than $10,000 | 1 (4.3%) | 0 (0.0%) |
| $10,000 to $24,999 | 0 (0.0%) | 0 (0.0%) |
| $25,000 to $34,999 | 1 (4.3%) | 0 (0.0%) |
| $35,000 to $49,999 | 0 (0.0%) | 4 (10.8%) |
| $50,000 to $74,999 | 2 (8.7%) | 6 (16.2%) |
| $75,000 to $99,999 | 12 (52.2%) | 2 (5.4%) |
| $100,000 to $149,999 | 4 (17.4%) | 7 (18.9%) |
| $150,000 or more | 3 (13.0%) | 15 (40.5%) |
| Total | 23 (100.0%) | 37 (100.0%) |
Property Value to Household Income Ratio in Christine
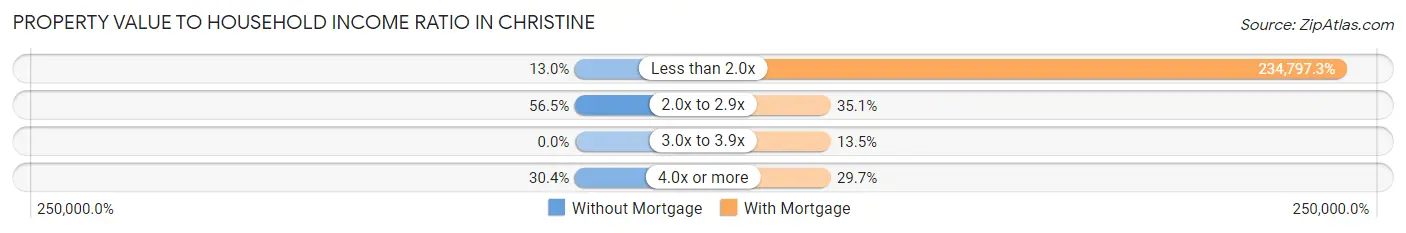
| Value-to-Income Ratio | Without Mortgage | With Mortgage |
| Less than 2.0x | 3 (13.0%) | 86,875 (234,797.3%) |
| 2.0x to 2.9x | 13 (56.5%) | 13 (35.1%) |
| 3.0x to 3.9x | 0 (0.0%) | 5 (13.5%) |
| 4.0x or more | 7 (30.4%) | 11 (29.7%) |
| Total | 23 (100.0%) | 37 (100.0%) |
Real Estate Taxes by Mortgage Status in Christine
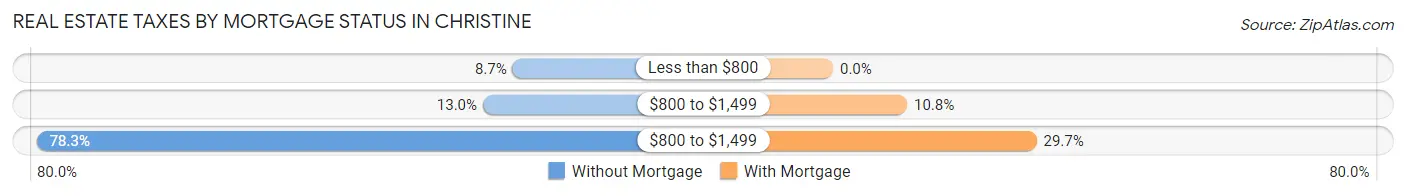
| Property Taxes | Without Mortgage | With Mortgage |
| Less than $800 | 2 (8.7%) | 0 (0.0%) |
| $800 to $1,499 | 3 (13.0%) | 4 (10.8%) |
| $800 to $1,499 | 18 (78.3%) | 11 (29.7%) |
| Total | 23 (100.0%) | 37 (100.0%) |
Health & Disability in Christine
Health Insurance Coverage by Age in Christine
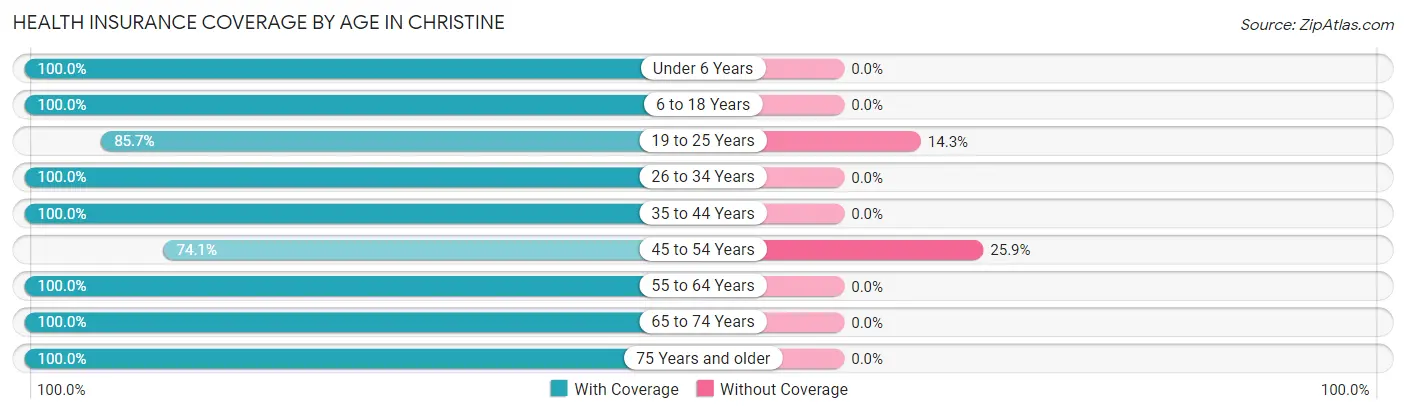
| Age Bracket | With Coverage | Without Coverage |
| Under 6 Years | 27 (100.0%) | 0 (0.0%) |
| 6 to 18 Years | 21 (100.0%) | 0 (0.0%) |
| 19 to 25 Years | 6 (85.7%) | 1 (14.3%) |
| 26 to 34 Years | 29 (100.0%) | 0 (0.0%) |
| 35 to 44 Years | 12 (100.0%) | 0 (0.0%) |
| 45 to 54 Years | 20 (74.1%) | 7 (25.9%) |
| 55 to 64 Years | 26 (100.0%) | 0 (0.0%) |
| 65 to 74 Years | 7 (100.0%) | 0 (0.0%) |
| 75 Years and older | 10 (100.0%) | 0 (0.0%) |
| Total | 158 (95.2%) | 8 (4.8%) |
Health Insurance Coverage by Citizenship Status in Christine
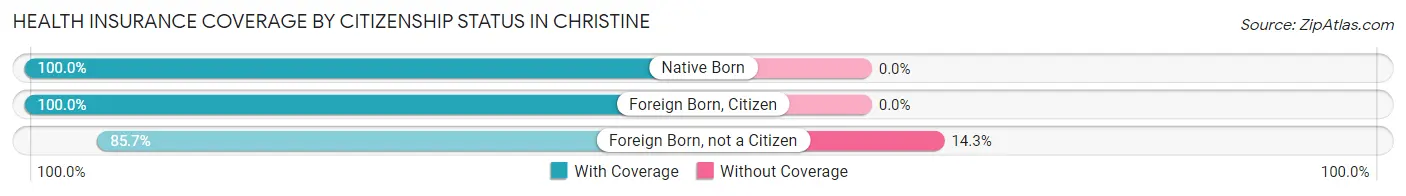
| Citizenship Status | With Coverage | Without Coverage |
| Native Born | 27 (100.0%) | 0 (0.0%) |
| Foreign Born, Citizen | 21 (100.0%) | 0 (0.0%) |
| Foreign Born, not a Citizen | 6 (85.7%) | 1 (14.3%) |
Health Insurance Coverage by Household Income in Christine
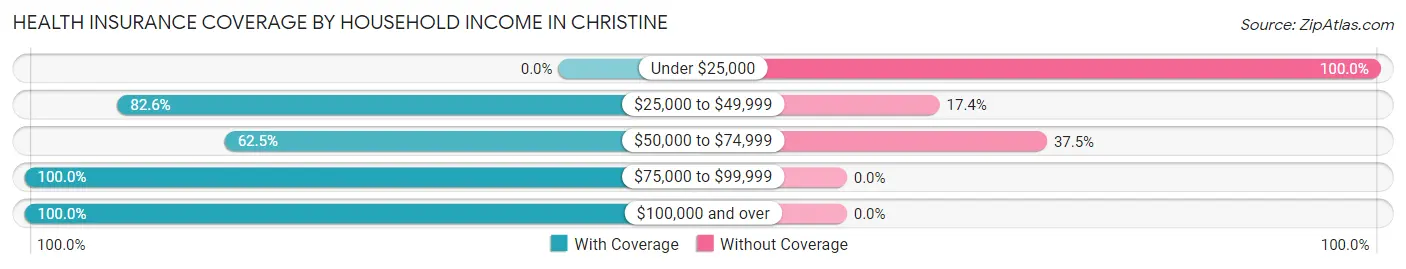
| Household Income | With Coverage | Without Coverage |
| Under $25,000 | 0 (0.0%) | 1 (100.0%) |
| $25,000 to $49,999 | 19 (82.6%) | 4 (17.4%) |
| $50,000 to $74,999 | 5 (62.5%) | 3 (37.5%) |
| $75,000 to $99,999 | 64 (100.0%) | 0 (0.0%) |
| $100,000 and over | 70 (100.0%) | 0 (0.0%) |
Public vs Private Health Insurance Coverage by Age in Christine
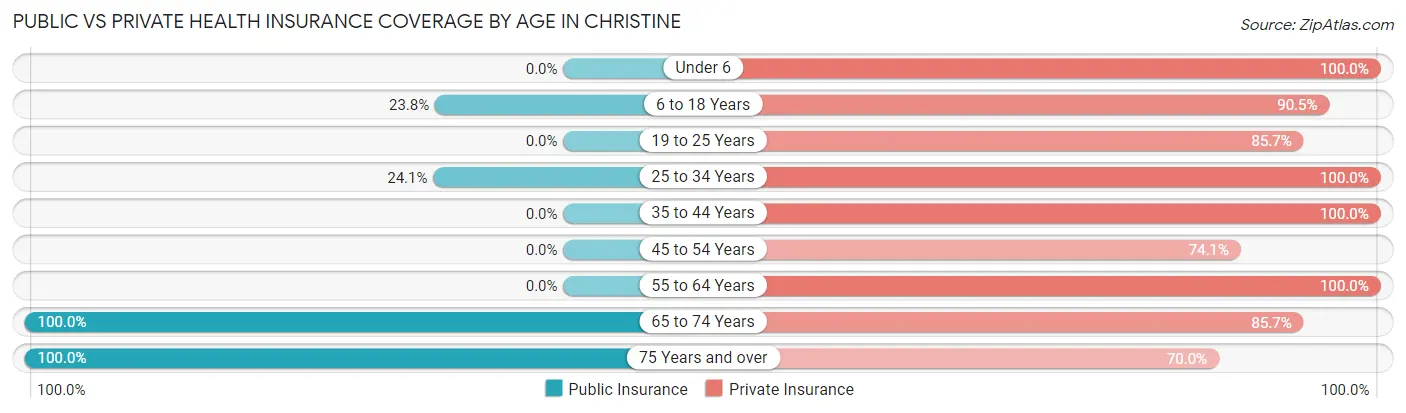
| Age Bracket | Public Insurance | Private Insurance |
| Under 6 | 0 (0.0%) | 27 (100.0%) |
| 6 to 18 Years | 5 (23.8%) | 19 (90.5%) |
| 19 to 25 Years | 0 (0.0%) | 6 (85.7%) |
| 25 to 34 Years | 7 (24.1%) | 29 (100.0%) |
| 35 to 44 Years | 0 (0.0%) | 12 (100.0%) |
| 45 to 54 Years | 0 (0.0%) | 20 (74.1%) |
| 55 to 64 Years | 0 (0.0%) | 26 (100.0%) |
| 65 to 74 Years | 7 (100.0%) | 6 (85.7%) |
| 75 Years and over | 10 (100.0%) | 7 (70.0%) |
| Total | 29 (17.5%) | 152 (91.6%) |
Disability Status by Sex by Age in Christine
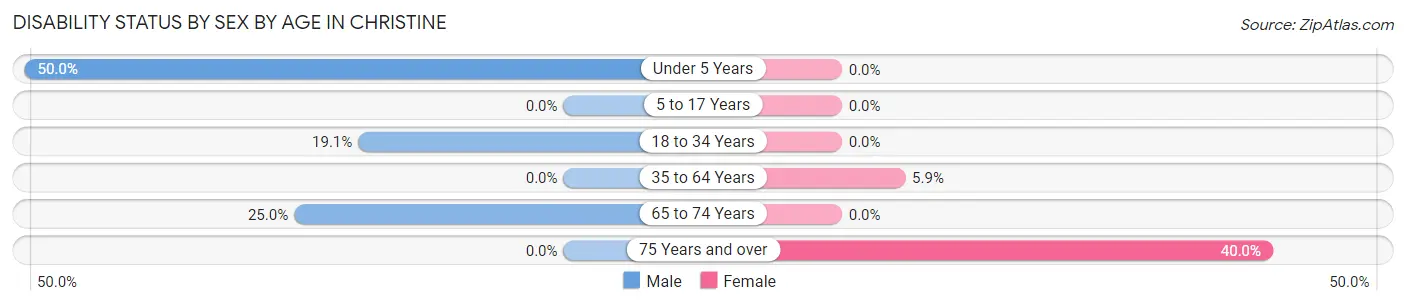
| Age Bracket | Male | Female |
| Under 5 Years | 2 (50.0%) | 0 (0.0%) |
| 5 to 17 Years | 0 (0.0%) | 0 (0.0%) |
| 18 to 34 Years | 4 (19.1%) | 0 (0.0%) |
| 35 to 64 Years | 0 (0.0%) | 2 (5.9%) |
| 65 to 74 Years | 1 (25.0%) | 0 (0.0%) |
| 75 Years and over | 0 (0.0%) | 2 (40.0%) |
Disability Class by Sex by Age in Christine
Disability Class: Hearing Difficulty
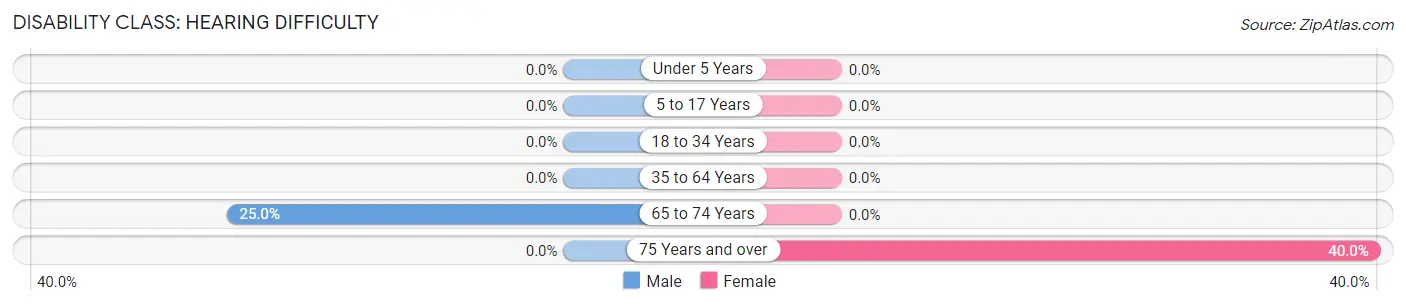
| Age Bracket | Male | Female |
| Under 5 Years | 0 (0.0%) | 0 (0.0%) |
| 5 to 17 Years | 0 (0.0%) | 0 (0.0%) |
| 18 to 34 Years | 0 (0.0%) | 0 (0.0%) |
| 35 to 64 Years | 0 (0.0%) | 0 (0.0%) |
| 65 to 74 Years | 1 (25.0%) | 0 (0.0%) |
| 75 Years and over | 0 (0.0%) | 2 (40.0%) |
Disability Class: Vision Difficulty
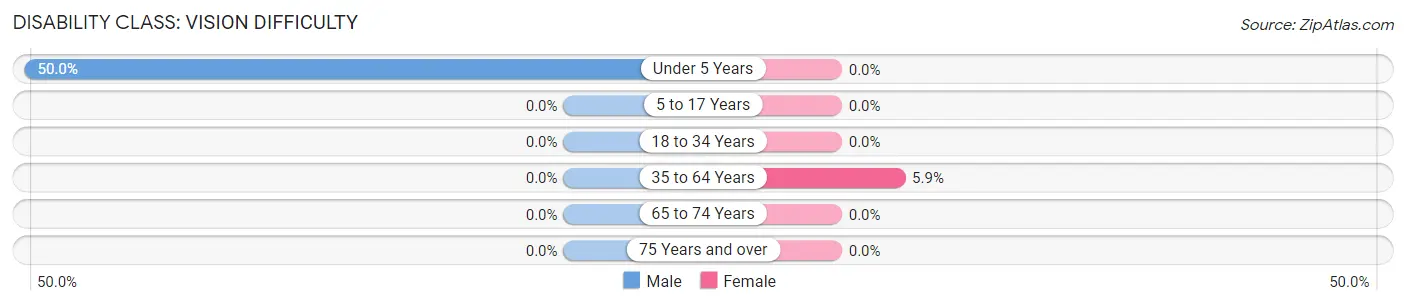
| Age Bracket | Male | Female |
| Under 5 Years | 2 (50.0%) | 0 (0.0%) |
| 5 to 17 Years | 0 (0.0%) | 0 (0.0%) |
| 18 to 34 Years | 0 (0.0%) | 0 (0.0%) |
| 35 to 64 Years | 0 (0.0%) | 2 (5.9%) |
| 65 to 74 Years | 0 (0.0%) | 0 (0.0%) |
| 75 Years and over | 0 (0.0%) | 0 (0.0%) |
Disability Class: Cognitive Difficulty
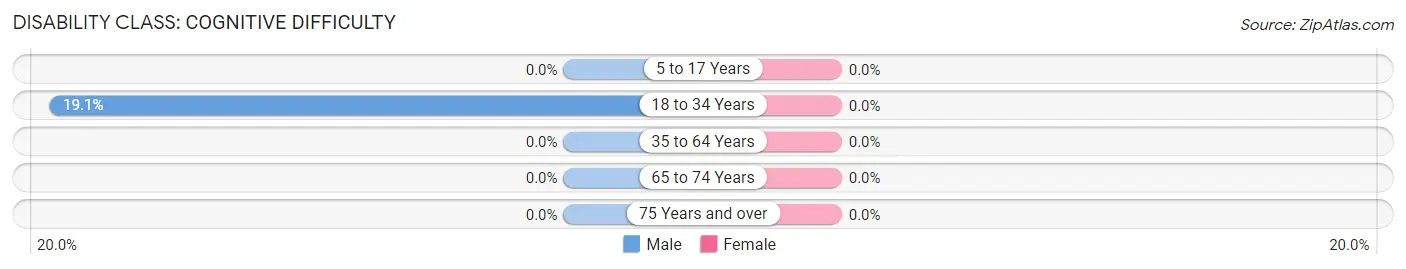
| Age Bracket | Male | Female |
| 5 to 17 Years | 0 (0.0%) | 0 (0.0%) |
| 18 to 34 Years | 4 (19.1%) | 0 (0.0%) |
| 35 to 64 Years | 0 (0.0%) | 0 (0.0%) |
| 65 to 74 Years | 0 (0.0%) | 0 (0.0%) |
| 75 Years and over | 0 (0.0%) | 0 (0.0%) |
Disability Class: Ambulatory Difficulty
| Age Bracket | Male | Female |
| 5 to 17 Years | 0 (0.0%) | 0 (0.0%) |
| 18 to 34 Years | 0 (0.0%) | 0 (0.0%) |
| 35 to 64 Years | 0 (0.0%) | 0 (0.0%) |
| 65 to 74 Years | 0 (0.0%) | 0 (0.0%) |
| 75 Years and over | 0 (0.0%) | 0 (0.0%) |
Disability Class: Self-Care Difficulty
| Age Bracket | Male | Female |
| 5 to 17 Years | 0 (0.0%) | 0 (0.0%) |
| 18 to 34 Years | 0 (0.0%) | 0 (0.0%) |
| 35 to 64 Years | 0 (0.0%) | 0 (0.0%) |
| 65 to 74 Years | 0 (0.0%) | 0 (0.0%) |
| 75 Years and over | 0 (0.0%) | 0 (0.0%) |
Technology Access in Christine
Computing Device Access in Christine
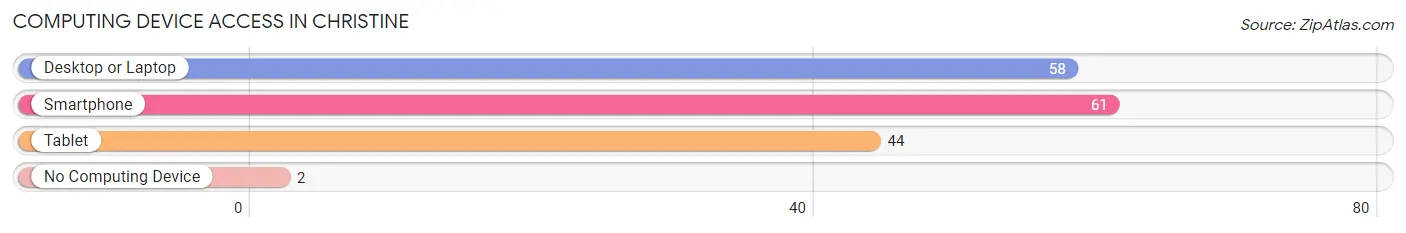
| Device Type | # Households | % Households |
| Desktop or Laptop | 58 | 89.2% |
| Smartphone | 61 | 93.9% |
| Tablet | 44 | 67.7% |
| No Computing Device | 2 | 3.1% |
| Total | 65 | 100.0% |
Internet Access in Christine
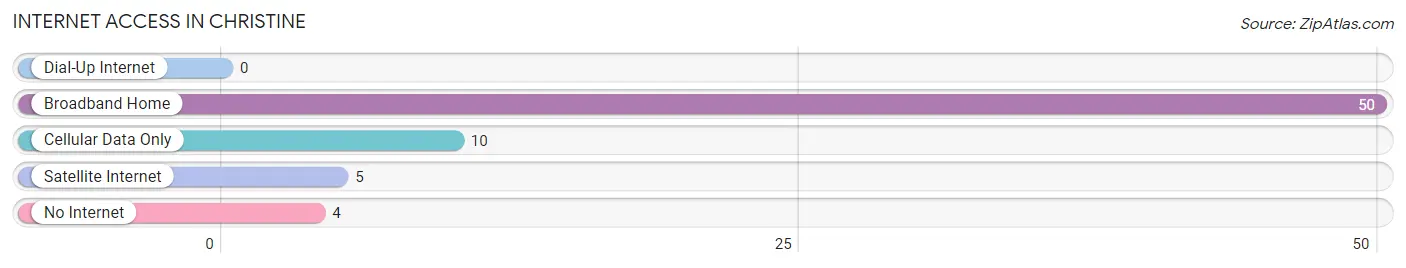
| Internet Type | # Households | % Households |
| Dial-Up Internet | 0 | 0.0% |
| Broadband Home | 50 | 76.9% |
| Cellular Data Only | 10 | 15.4% |
| Satellite Internet | 5 | 7.7% |
| No Internet | 4 | 6.1% |
| Total | 65 | 100.0% |
Christine Summary
North Dakota is a state located in the Midwestern and Great Plains regions of the United States. It is the 19th largest state by area and the 39th most populous state. North Dakota is bordered by the Canadian provinces of Saskatchewan and Manitoba to the north, Minnesota to the east, South Dakota to the south, and Montana to the west. The state capital is Bismarck, and the largest city is Fargo.
History
The area that is now North Dakota has been inhabited for thousands of years by various Native American tribes. The first Europeans to explore the area were French fur traders, who arrived in the late 17th century. In 1803, the area became part of the United States as part of the Louisiana Purchase. In 1861, the Dakota Territory was created, which included the area that is now North Dakota. The territory was divided into two states in 1889, with North Dakota becoming a state on November 2nd of that year.
Geography
North Dakota is located in the Midwestern and Great Plains regions of the United States. It is the 19th largest state by area, with a total area of 70,700 square miles. The state is bordered by the Canadian provinces of Saskatchewan and Manitoba to the north, Minnesota to the east, South Dakota to the south, and Montana to the west.
The geography of North Dakota is mostly flat, with rolling hills in the east and west. The state is divided into three distinct geographic regions: the Red River Valley in the east, the Missouri Plateau in the west, and the Drift Prairie in the central part of the state. The Red River Valley is a flat, fertile region that is home to the Red River of the North, which forms the border between North Dakota and Minnesota. The Missouri Plateau is a hilly region that is home to the Missouri River, which forms the border between North Dakota and South Dakota. The Drift Prairie is a flat region that is home to the Missouri River, which forms the border between North Dakota and Montana.
Economy
North Dakota’s economy is largely based on agriculture, with wheat, corn, and soybeans being the main crops. The state is also a major producer of oil and natural gas, and is home to several large oil refineries. Other major industries in the state include manufacturing, tourism, and energy production.
The state’s unemployment rate was 3.2% in 2019, which is lower than the national average. The median household income in North Dakota was $58,906 in 2019, which is higher than the national average.
Demographics
As of 2019, North Dakota had a population of 762,062, making it the 39th most populous state in the United States. The state’s population is mostly white (90.2%), with small percentages of Native American (5.2%), African American (2.2%), Asian (1.2%), and other races (1.2%).
The largest cities in North Dakota are Fargo (population 122,359), Bismarck (population 72,865), Grand Forks (population 54,844), Minot (population 46,321), and West Fargo (population 34,876). The state’s capital is Bismarck.
North Dakota is home to several Native American tribes, including the Mandan, Hidatsa, and Arikara Nation, the Standing Rock Sioux Tribe, the Spirit Lake Tribe, and the Turtle Mountain Band of Chippewa Indians. The state also has a large German-American population, with German being the second most spoken language in the state.
Common Questions
What is Per Capita Income in Christine?
Per Capita income in Christine is $37,019.
What is the Median Family Income in Christine?
Median Family Income in Christine is $92,500.
What is the Median Household income in Christine?
Median Household Income in Christine is $84,750.
What is Income or Wage Gap in Christine?
Income or Wage Gap in Christine is 50.0%.
Women in Christine earn 50.0 cents for every dollar earned by a man.
What is Inequality or Gini Index in Christine?
Inequality or Gini Index in Christine is 0.26.
What is the Total Population of Christine?
Total Population of Christine is 166.
What is the Total Male Population of Christine?
Total Male Population of Christine is 72.
What is the Total Female Population of Christine?
Total Female Population of Christine is 94.
What is the Ratio of Males per 100 Females in Christine?
There are 76.60 Males per 100 Females in Christine.
What is the Ratio of Females per 100 Males in Christine?
There are 130.56 Females per 100 Males in Christine.
What is the Median Population Age in Christine?
Median Population Age in Christine is 33.9 Years.
What is the Average Family Size in Christine
Average Family Size in Christine is 3.0 People.
What is the Average Household Size in Christine
Average Household Size in Christine is 2.5 People.
How Large is the Labor Force in Christine?
There are 103 People in the Labor Forcein in Christine.
What is the Percentage of People in the Labor Force in Christine?
83.1% of People are in the Labor Force in Christine.