Brooktree Park, ND Map & Demographics
Brooktree Park Map
Brooktree Park Overview
$43,396
PER CAPITA INCOME
$191,118
AVG FAMILY INCOME
$191,118
AVG HOUSEHOLD INCOME
0.09
INEQUALITY / GINI INDEX
156
TOTAL POPULATION
66
MALE POPULATION
90
FEMALE POPULATION
73.33
MALES / 100 FEMALES
136.36
FEMALES / 100 MALES
17.3
MEDIAN AGE
4.2
AVG FAMILY SIZE
4.2
AVG HOUSEHOLD SIZE
64
LABOR FORCE [ PEOPLE ]
80.0%
PERCENT IN LABOR FORCE
Income in Brooktree Park
Income Overview in Brooktree Park
Per Capita Income in Brooktree Park is $43,396, while median incomes of families and households are $191,118 and $191,118 respectively.
| Characteristic | Number | Measure |
| Per Capita Income | 156 | $43,396 |
| Median Family Income | 37 | $191,118 |
| Mean Family Income | 37 | $184,962 |
| Median Household Income | 37 | $191,118 |
| Mean Household Income | 37 | $184,962 |
| Income Deficit | 37 | $0 |
| Wage / Income Gap (%) | 156 | 0.00% |
| Wage / Income Gap ($) | 156 | 100.00¢ per $1 |
| Gini / Inequality Index | 156 | 0.09 |
Earnings by Sex in Brooktree Park
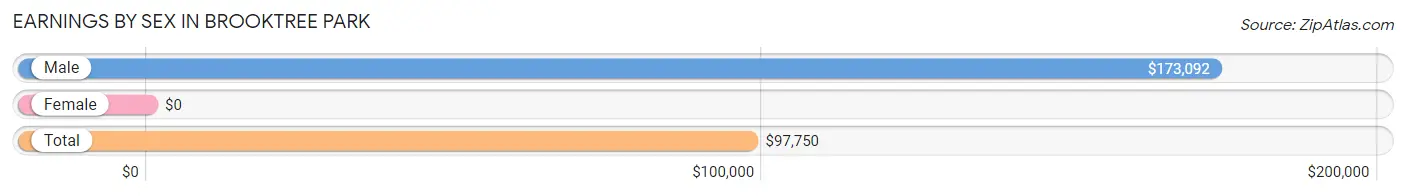
| Sex | Number | Average Earnings |
| Male | 45 (62.5%) | $173,092 |
| Female | 27 (37.5%) | $0 |
| Total | 72 (100.0%) | $97,750 |
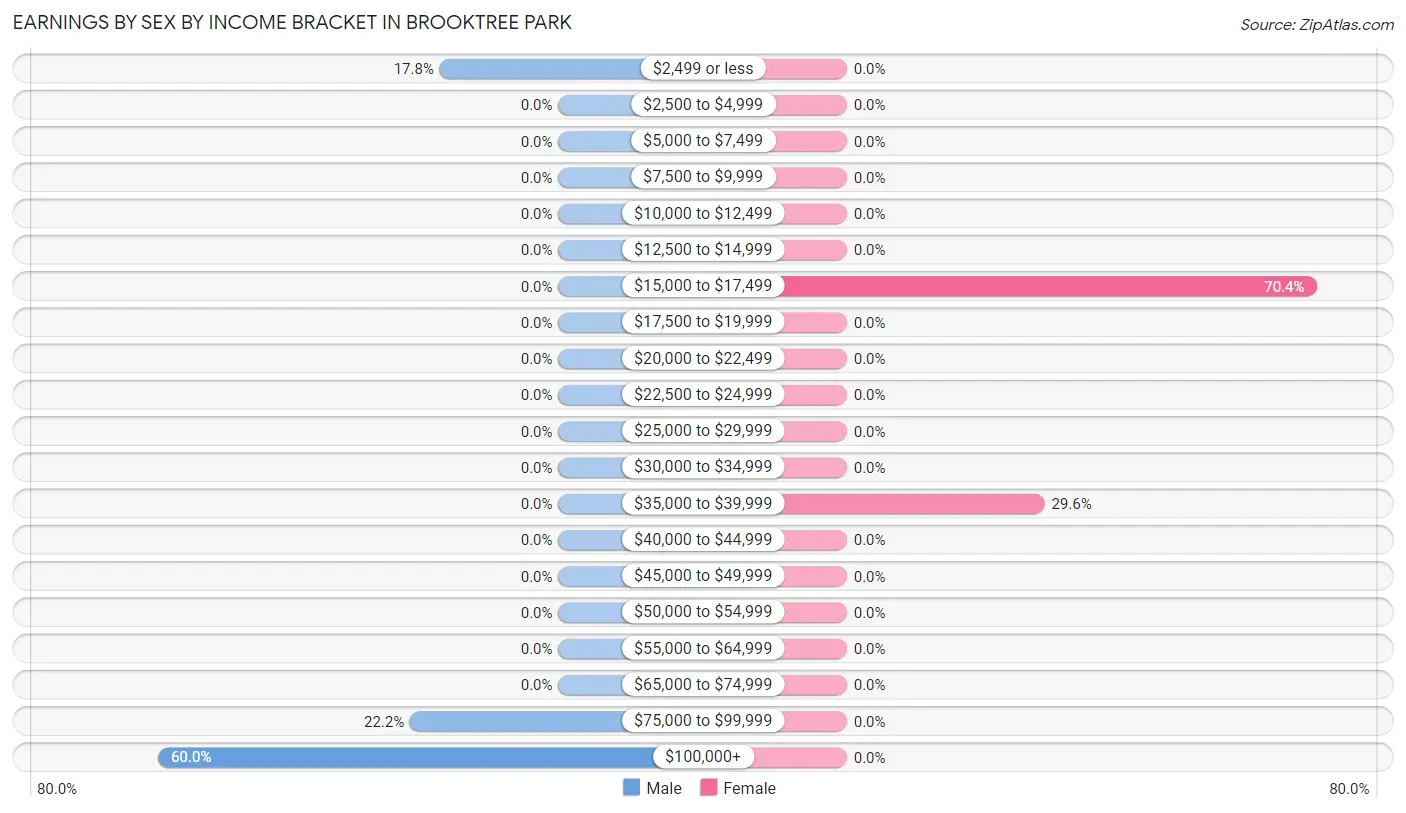
Earnings by Sex by Income Bracket in Brooktree Park
The most common earnings brackets in Brooktree Park are $100,000+ for men (27 | 60.0%) and $15,000 to $17,499 for women (19 | 70.4%).
| Income | Male | Female |
| $2,499 or less | 8 (17.8%) | 0 (0.0%) |
| $2,500 to $4,999 | 0 (0.0%) | 0 (0.0%) |
| $5,000 to $7,499 | 0 (0.0%) | 0 (0.0%) |
| $7,500 to $9,999 | 0 (0.0%) | 0 (0.0%) |
| $10,000 to $12,499 | 0 (0.0%) | 0 (0.0%) |
| $12,500 to $14,999 | 0 (0.0%) | 0 (0.0%) |
| $15,000 to $17,499 | 0 (0.0%) | 19 (70.4%) |
| $17,500 to $19,999 | 0 (0.0%) | 0 (0.0%) |
| $20,000 to $22,499 | 0 (0.0%) | 0 (0.0%) |
| $22,500 to $24,999 | 0 (0.0%) | 0 (0.0%) |
| $25,000 to $29,999 | 0 (0.0%) | 0 (0.0%) |
| $30,000 to $34,999 | 0 (0.0%) | 0 (0.0%) |
| $35,000 to $39,999 | 0 (0.0%) | 8 (29.6%) |
| $40,000 to $44,999 | 0 (0.0%) | 0 (0.0%) |
| $45,000 to $49,999 | 0 (0.0%) | 0 (0.0%) |
| $50,000 to $54,999 | 0 (0.0%) | 0 (0.0%) |
| $55,000 to $64,999 | 0 (0.0%) | 0 (0.0%) |
| $65,000 to $74,999 | 0 (0.0%) | 0 (0.0%) |
| $75,000 to $99,999 | 10 (22.2%) | 0 (0.0%) |
| $100,000+ | 27 (60.0%) | 0 (0.0%) |
| Total | 45 (100.0%) | 27 (100.0%) |
Earnings by Sex by Educational Attainment in Brooktree Park
| Educational Attainment | Male Income | Female Income |
| Less than High School | - | - |
| High School Diploma | - | - |
| College or Associate's Degree | - | - |
| Bachelor's Degree | - | - |
| Graduate Degree | - | - |
| Total | $173,618 | $0 |
Family Income in Brooktree Park
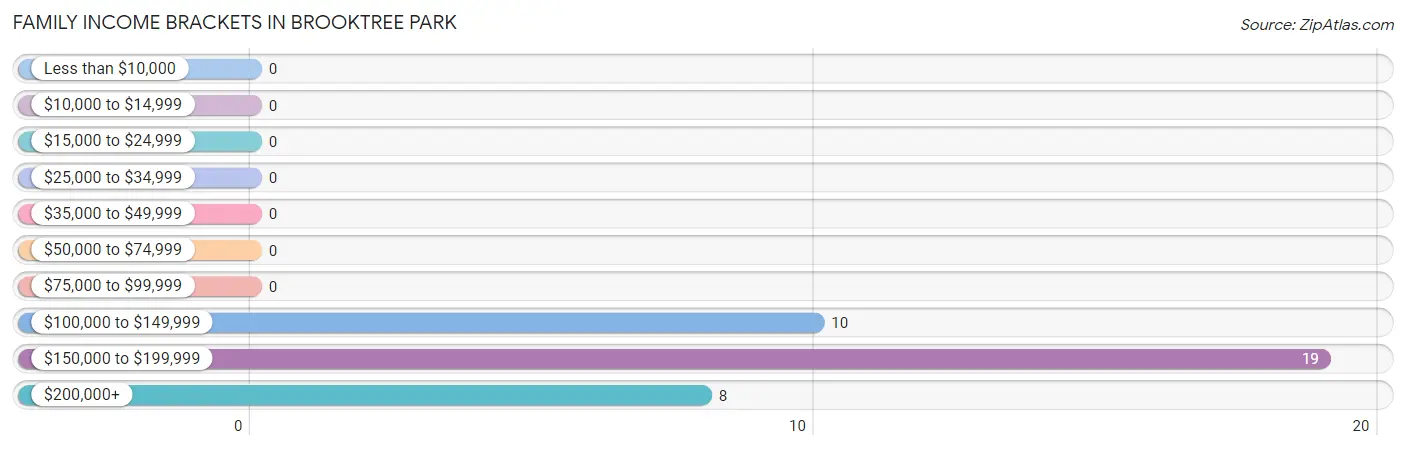
Family Income Brackets in Brooktree Park
According to the Brooktree Park family income data, there are 19 families falling into the $150,000 to $199,999 income range, which is the most common income bracket and makes up 51.3% of all families.
| Income Bracket | # Families | % Families |
| Less than $10,000 | 0 | 0.0% |
| $10,000 to $14,999 | 0 | 0.0% |
| $15,000 to $24,999 | 0 | 0.0% |
| $25,000 to $34,999 | 0 | 0.0% |
| $35,000 to $49,999 | 0 | 0.0% |
| $50,000 to $74,999 | 0 | 0.0% |
| $75,000 to $99,999 | 0 | 0.0% |
| $100,000 to $149,999 | 10 | 27.0% |
| $150,000 to $199,999 | 19 | 51.4% |
| $200,000+ | 8 | 21.6% |
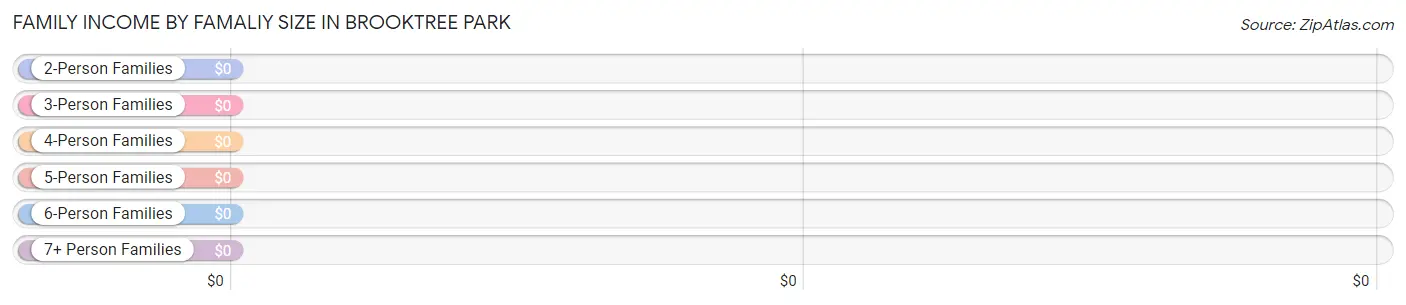
Family Income by Famaliy Size in Brooktree Park
| Income Bracket | # Families | Median Income |
| 2-Person Families | 10 (27.0%) | $0 |
| 3-Person Families | 0 (0.0%) | $0 |
| 4-Person Families | 0 (0.0%) | $0 |
| 5-Person Families | 27 (73.0%) | $0 |
| 6-Person Families | 0 (0.0%) | $0 |
| 7+ Person Families | 0 (0.0%) | $0 |
| Total | 37 (100.0%) | $191,118 |
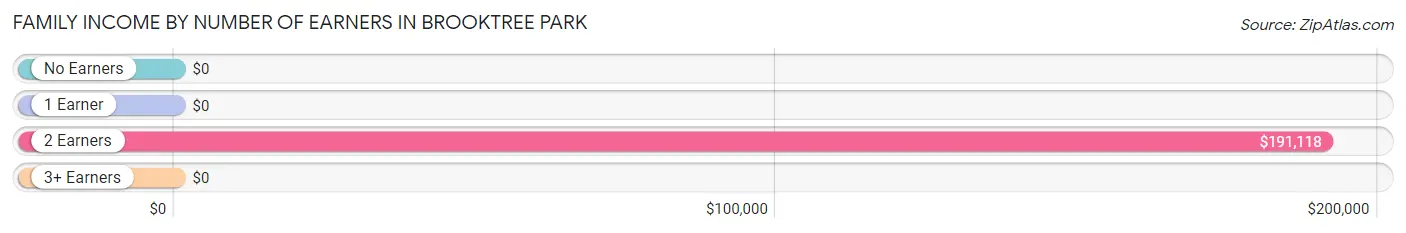
Family Income by Number of Earners in Brooktree Park
| Number of Earners | # Families | Median Income |
| No Earners | 0 (0.0%) | $0 |
| 1 Earner | 0 (0.0%) | $0 |
| 2 Earners | 37 (100.0%) | $191,118 |
| 3+ Earners | 0 (0.0%) | $0 |
| Total | 37 (100.0%) | $191,118 |
Household Income in Brooktree Park
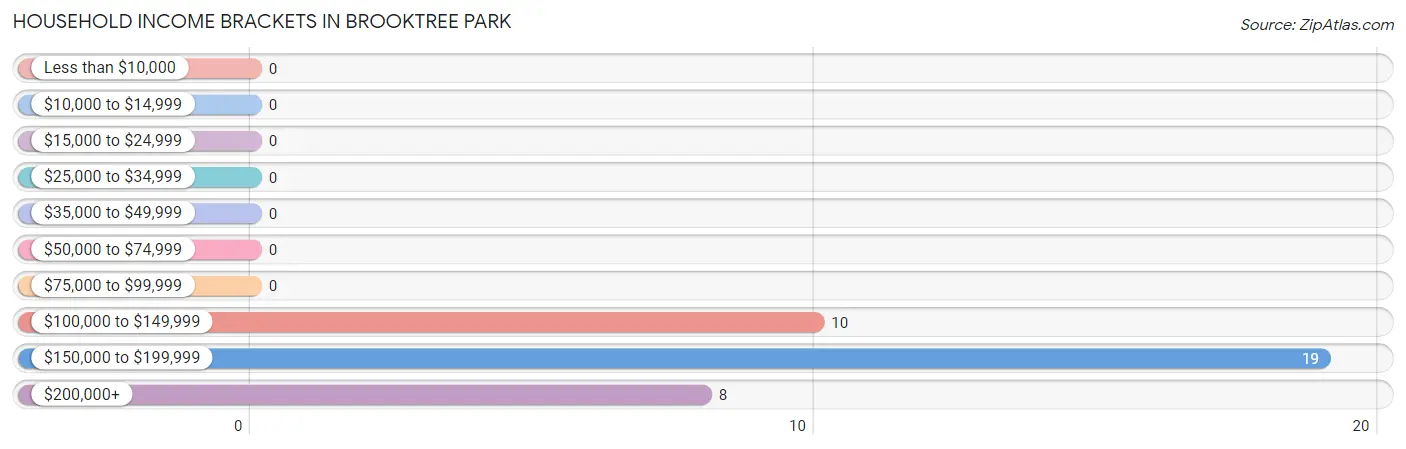
Household Income Brackets in Brooktree Park
With 19 households falling in the category, the $150,000 to $199,999 income range is the most frequent in Brooktree Park, accounting for 51.3% of all households.
| Income Bracket | # Households | % Households |
| Less than $10,000 | 0 | 0.0% |
| $10,000 to $14,999 | 0 | 0.0% |
| $15,000 to $24,999 | 0 | 0.0% |
| $25,000 to $34,999 | 0 | 0.0% |
| $35,000 to $49,999 | 0 | 0.0% |
| $50,000 to $74,999 | 0 | 0.0% |
| $75,000 to $99,999 | 0 | 0.0% |
| $100,000 to $149,999 | 10 | 27.0% |
| $150,000 to $199,999 | 19 | 51.4% |
| $200,000+ | 8 | 21.6% |
Household Income by Householder Age in Brooktree Park
The median household income in Brooktree Park is $191,118, with the highest median household income of $191,118 found in the 25 to 44 years age bracket for the primary householder. A total of 37 households (100.0%) fall into this category.
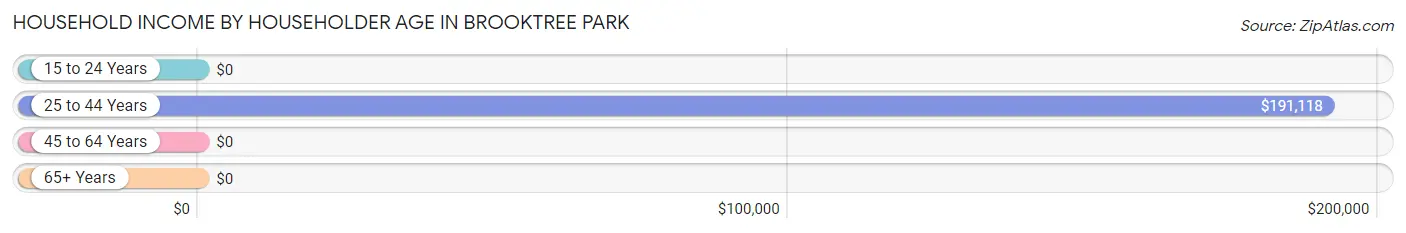
| Income Bracket | # Households | Median Income |
| 15 to 24 Years | 0 (0.0%) | $0 |
| 25 to 44 Years | 37 (100.0%) | $191,118 |
| 45 to 64 Years | 0 (0.0%) | $0 |
| 65+ Years | 0 (0.0%) | $0 |
| Total | 37 (100.0%) | $191,118 |
Poverty in Brooktree Park
Income Below Poverty by Sex and Age in Brooktree Park
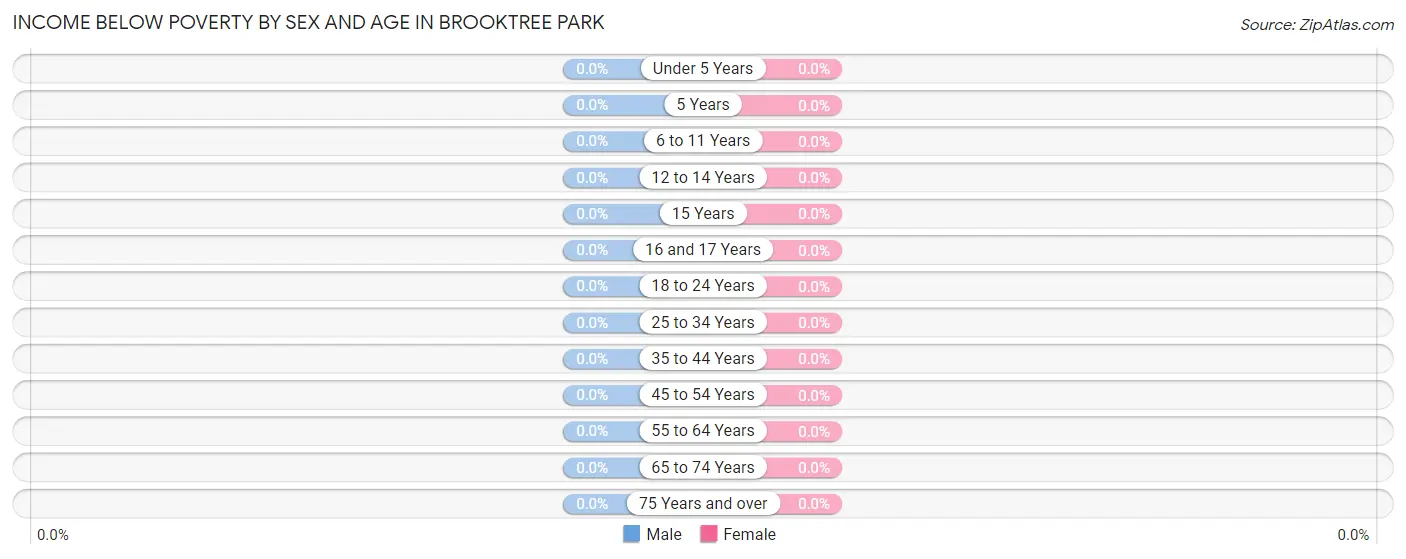
| Age Bracket | Male | Female |
| Under 5 Years | 0 (0.0%) | 0 (0.0%) |
| 5 Years | 0 (0.0%) | 0 (0.0%) |
| 6 to 11 Years | 0 (0.0%) | 0 (0.0%) |
| 12 to 14 Years | 0 (0.0%) | 0 (0.0%) |
| 15 Years | 0 (0.0%) | 0 (0.0%) |
| 16 and 17 Years | 0 (0.0%) | 0 (0.0%) |
| 18 to 24 Years | 0 (0.0%) | 0 (0.0%) |
| 25 to 34 Years | 0 (0.0%) | 0 (0.0%) |
| 35 to 44 Years | 0 (0.0%) | 0 (0.0%) |
| 45 to 54 Years | 0 (0.0%) | 0 (0.0%) |
| 55 to 64 Years | 0 (0.0%) | 0 (0.0%) |
| 65 to 74 Years | 0 (0.0%) | 0 (0.0%) |
| 75 Years and over | 0 (0.0%) | 0 (0.0%) |
| Total | 0 (0.0%) | 0 (0.0%) |
Income Above Poverty by Sex and Age in Brooktree Park
According to the poverty statistics in Brooktree Park, males aged under 5 years and females aged under 5 years are the age groups that are most secure financially, with 100.0% of males and 100.0% of females in these age groups living above the poverty line.
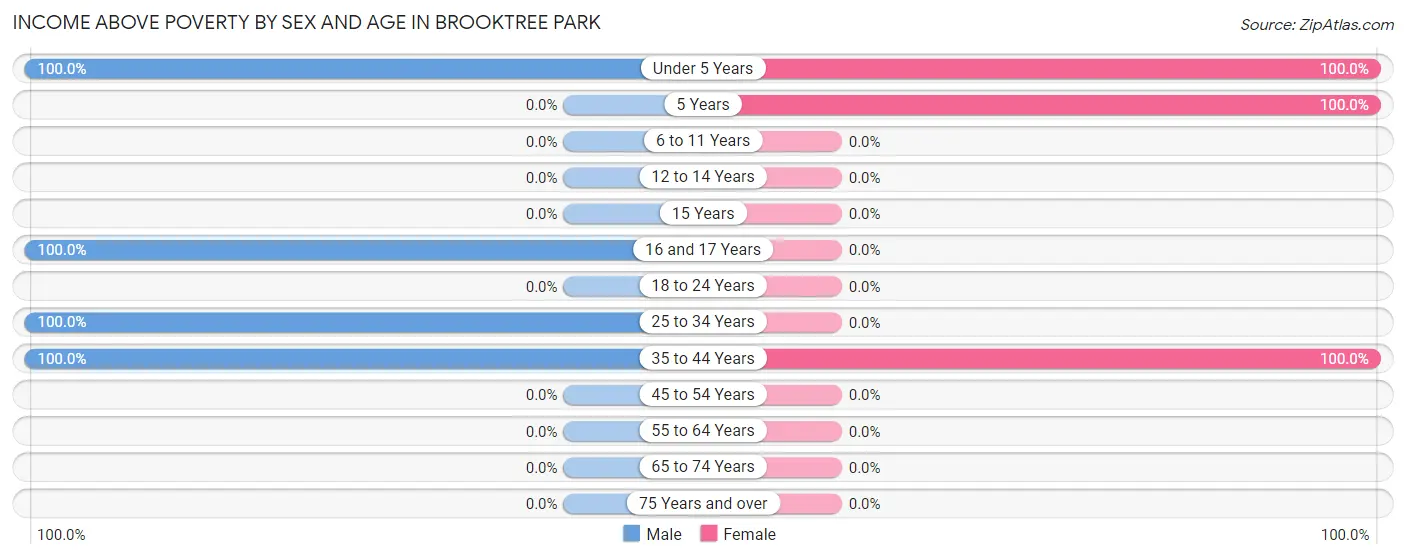
| Age Bracket | Male | Female |
| Under 5 Years | 21 (100.0%) | 27 (100.0%) |
| 5 Years | 0 (0.0%) | 28 (100.0%) |
| 6 to 11 Years | 0 (0.0%) | 0 (0.0%) |
| 12 to 14 Years | 0 (0.0%) | 0 (0.0%) |
| 15 Years | 0 (0.0%) | 0 (0.0%) |
| 16 and 17 Years | 8 (100.0%) | 0 (0.0%) |
| 18 to 24 Years | 0 (0.0%) | 0 (0.0%) |
| 25 to 34 Years | 19 (100.0%) | 0 (0.0%) |
| 35 to 44 Years | 18 (100.0%) | 35 (100.0%) |
| 45 to 54 Years | 0 (0.0%) | 0 (0.0%) |
| 55 to 64 Years | 0 (0.0%) | 0 (0.0%) |
| 65 to 74 Years | 0 (0.0%) | 0 (0.0%) |
| 75 Years and over | 0 (0.0%) | 0 (0.0%) |
| Total | 66 (100.0%) | 90 (100.0%) |
Income Below Poverty Among Married-Couple Families in Brooktree Park
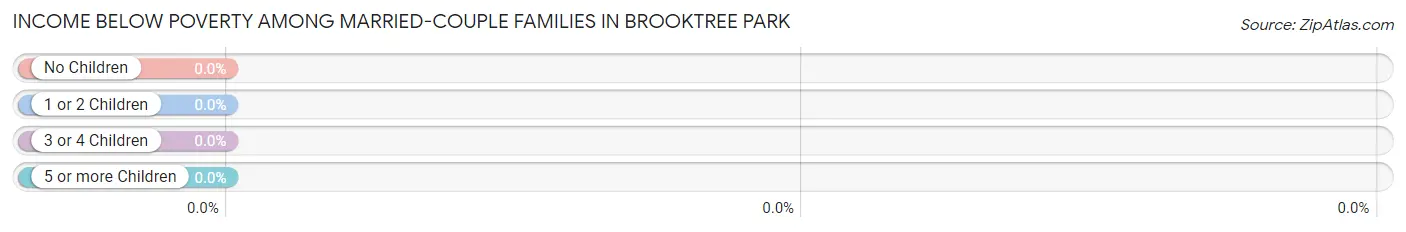
| Children | Above Poverty | Below Poverty |
| No Children | 10 (100.0%) | 0 (0.0%) |
| 1 or 2 Children | 0 (0.0%) | 0 (0.0%) |
| 3 or 4 Children | 27 (100.0%) | 0 (0.0%) |
| 5 or more Children | 0 (0.0%) | 0 (0.0%) |
| Total | 37 (100.0%) | 0 (0.0%) |
Income Below Poverty Among Single-Parent Households in Brooktree Park
| Children | Single Father | Single Mother |
| No Children | 0 (0.0%) | 0 (0.0%) |
| 1 or 2 Children | 0 (0.0%) | 0 (0.0%) |
| 3 or 4 Children | 0 (0.0%) | 0 (0.0%) |
| 5 or more Children | 0 (0.0%) | 0 (0.0%) |
| Total | 0 (0.0%) | 0 (0.0%) |
Income Below Poverty Among Married-Couple vs Single-Parent Households in Brooktree Park
| Children | Married-Couple Families | Single-Parent Households |
| No Children | 0 (0.0%) | 0 (0.0%) |
| 1 or 2 Children | 0 (0.0%) | 0 (0.0%) |
| 3 or 4 Children | 0 (0.0%) | 0 (0.0%) |
| 5 or more Children | 0 (0.0%) | 0 (0.0%) |
| Total | 0 (0.0%) | 0 (0.0%) |
Race in Brooktree Park
The most populous races in Brooktree Park are , and White / Caucasian (156 | 100.0%).
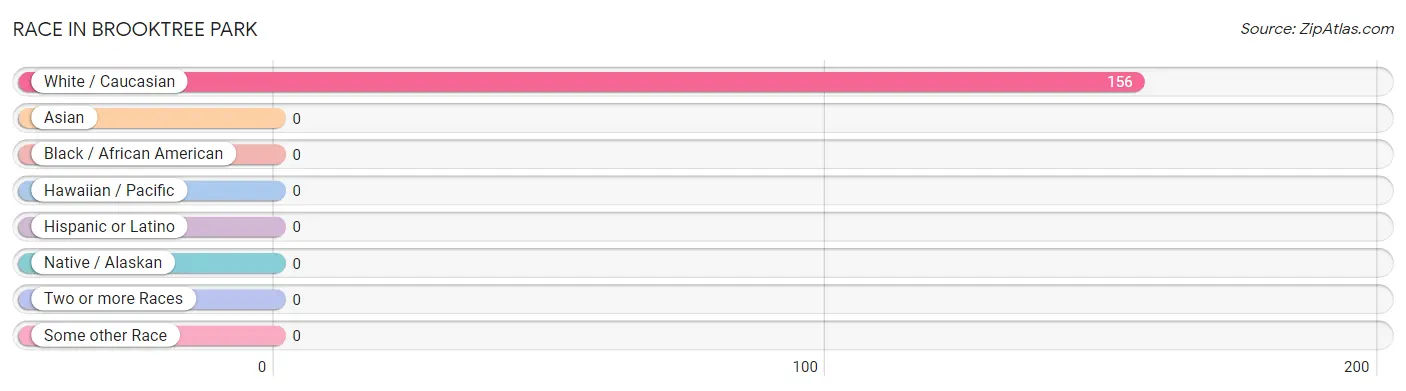
| Race | # Population | % Population |
| Asian | 0 | 0.0% |
| Black / African American | 0 | 0.0% |
| Hawaiian / Pacific | 0 | 0.0% |
| Hispanic or Latino | 0 | 0.0% |
| Native / Alaskan | 0 | 0.0% |
| White / Caucasian | 156 | 100.0% |
| Two or more Races | 0 | 0.0% |
| Some other Race | 0 | 0.0% |
| Total | 156 | 100.0% |
Ancestry in Brooktree Park
The most populous ancestries reported in Brooktree Park are German (87 | 55.8%), Norwegian (79 | 50.6%), Russian (19 | 12.2%), Scandinavian (10 | 6.4%), and French (8 | 5.1%), together accounting for 130.1% of all Brooktree Park residents.
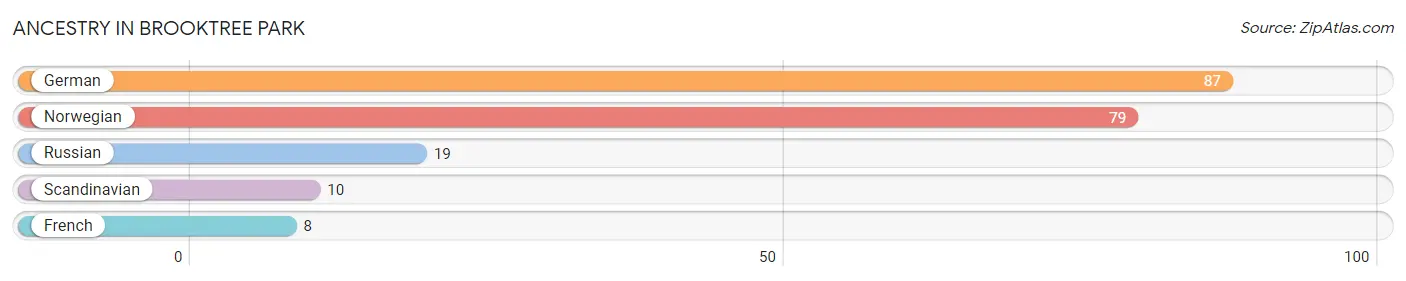
| Ancestry | # Population | % Population |
| French | 8 | 5.1% |
| German | 87 | 55.8% |
| Norwegian | 79 | 50.6% |
| Russian | 19 | 12.2% |
| Scandinavian | 10 | 6.4% | View All 5 Rows |
Immigrants in Brooktree Park

| Immigration Origin | # Population | % Population | View All 0 Rows |
Sex and Age in Brooktree Park
Sex and Age in Brooktree Park
The most populous age groups in Brooktree Park are Under 5 Years (21 | 31.8%) for men and 5 to 9 Years (28 | 31.1%) for women.
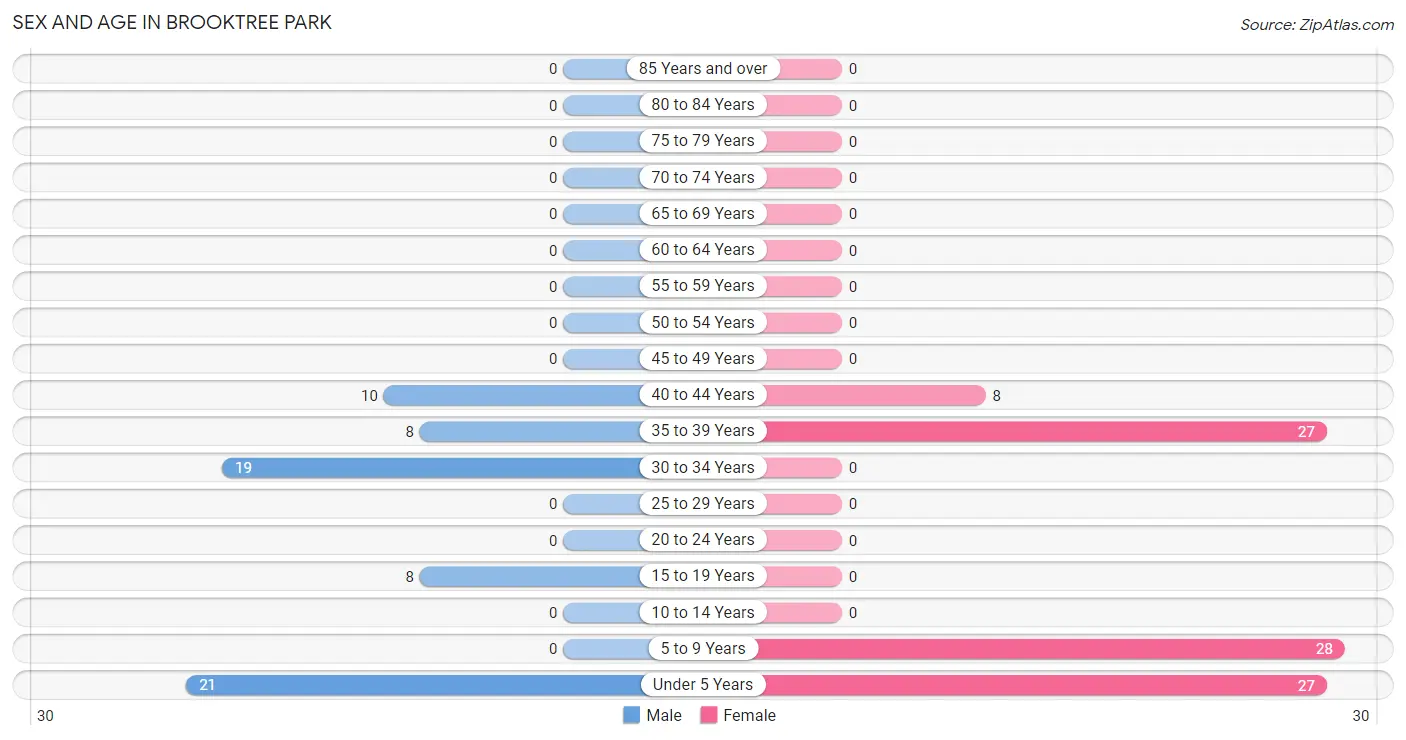
| Age Bracket | Male | Female |
| Under 5 Years | 21 (31.8%) | 27 (30.0%) |
| 5 to 9 Years | 0 (0.0%) | 28 (31.1%) |
| 10 to 14 Years | 0 (0.0%) | 0 (0.0%) |
| 15 to 19 Years | 8 (12.1%) | 0 (0.0%) |
| 20 to 24 Years | 0 (0.0%) | 0 (0.0%) |
| 25 to 29 Years | 0 (0.0%) | 0 (0.0%) |
| 30 to 34 Years | 19 (28.8%) | 0 (0.0%) |
| 35 to 39 Years | 8 (12.1%) | 27 (30.0%) |
| 40 to 44 Years | 10 (15.1%) | 8 (8.9%) |
| 45 to 49 Years | 0 (0.0%) | 0 (0.0%) |
| 50 to 54 Years | 0 (0.0%) | 0 (0.0%) |
| 55 to 59 Years | 0 (0.0%) | 0 (0.0%) |
| 60 to 64 Years | 0 (0.0%) | 0 (0.0%) |
| 65 to 69 Years | 0 (0.0%) | 0 (0.0%) |
| 70 to 74 Years | 0 (0.0%) | 0 (0.0%) |
| 75 to 79 Years | 0 (0.0%) | 0 (0.0%) |
| 80 to 84 Years | 0 (0.0%) | 0 (0.0%) |
| 85 Years and over | 0 (0.0%) | 0 (0.0%) |
| Total | 66 (100.0%) | 90 (100.0%) |
Families and Households in Brooktree Park
Median Family Size in Brooktree Park
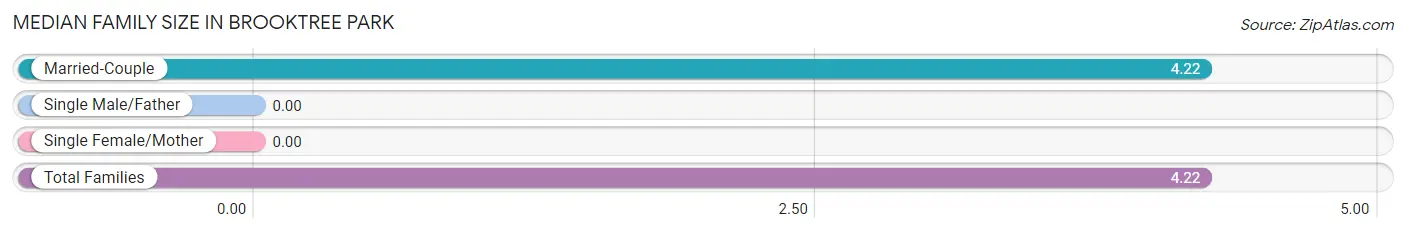
| Family Type | # Families | Family Size |
| Married-Couple | 37 (100.0%) | 4.22 |
| Single Male/Father | 0 (0.0%) | - |
| Single Female/Mother | 0 (0.0%) | - |
| Total Families | 37 (100.0%) | 4.22 |
Median Household Size in Brooktree Park
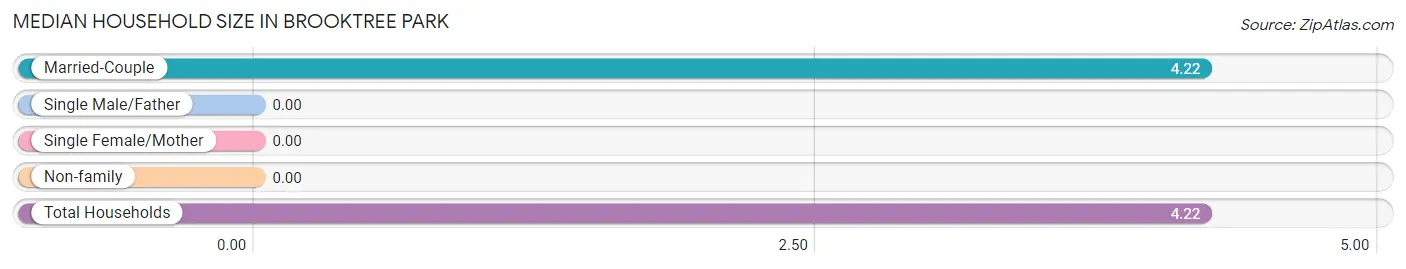
| Household Type | # Households | Household Size |
| Married-Couple | 37 (100.0%) | 4.22 |
| Single Male/Father | 0 (0.0%) | - |
| Single Female/Mother | 0 (0.0%) | - |
| Non-family | 0 (0.0%) | - |
| Total Households | 37 (100.0%) | 4.22 |
Household Size by Marriage Status in Brooktree Park
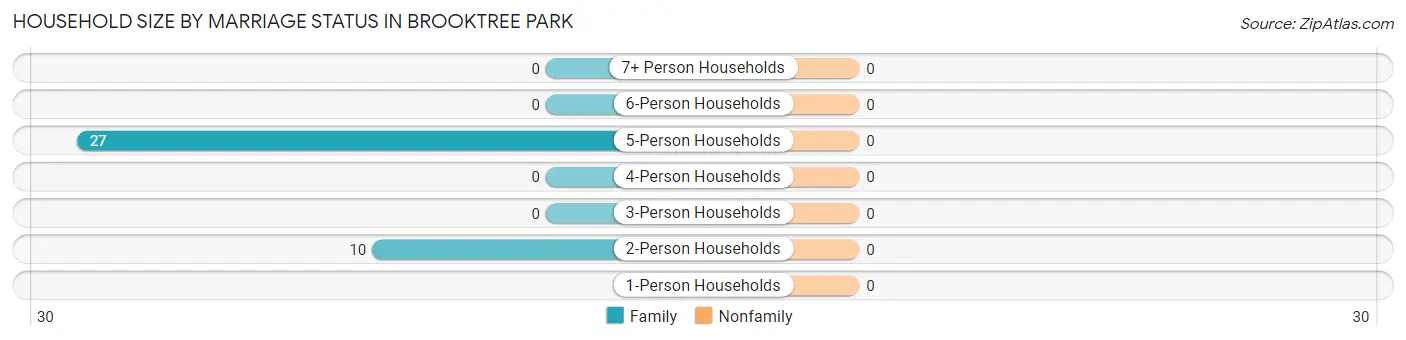
| Household Size | Family Households | Nonfamily Households |
| 1-Person Households | - | 0 (0.0%) |
| 2-Person Households | 10 (27.0%) | 0 (0.0%) |
| 3-Person Households | 0 (0.0%) | 0 (0.0%) |
| 4-Person Households | 0 (0.0%) | 0 (0.0%) |
| 5-Person Households | 27 (73.0%) | 0 (0.0%) |
| 6-Person Households | 0 (0.0%) | 0 (0.0%) |
| 7+ Person Households | 0 (0.0%) | 0 (0.0%) |
| Total | 37 (100.0%) | 0 (0.0%) |
Female Fertility in Brooktree Park
Fertility by Age in Brooktree Park
Average fertility rate in Brooktree Park is 229.0 births per 1,000 women. Women in the age bracket of 35 to 50 years have the highest fertility rate with 229.0 births per 1,000 women. Women in the age bracket of 35 to 50 years acount for 100.0% of all women with births.
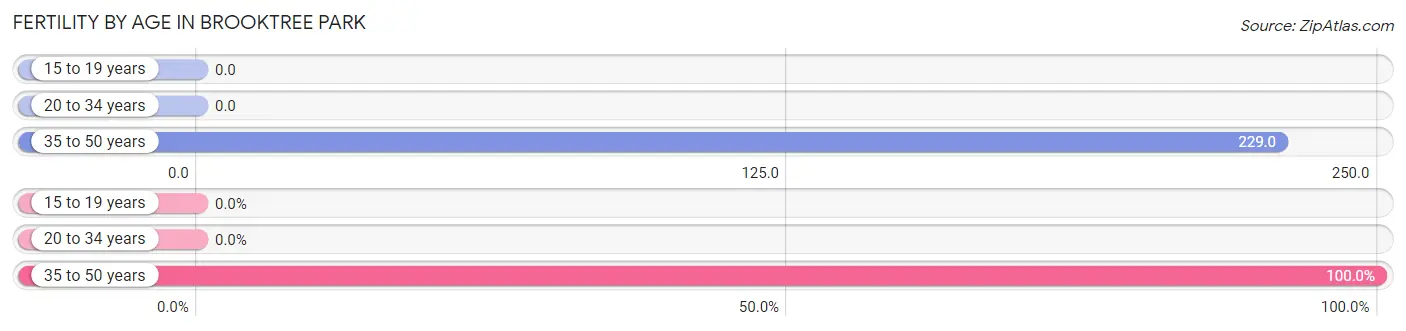
| Age Bracket | Women with Births | Births / 1,000 Women |
| 15 to 19 years | 0 (0.0%) | 0.0 |
| 20 to 34 years | 0 (0.0%) | 0.0 |
| 35 to 50 years | 8 (100.0%) | 229.0 |
| Total | 8 (100.0%) | 229.0 |
Fertility by Age by Marriage Status in Brooktree Park
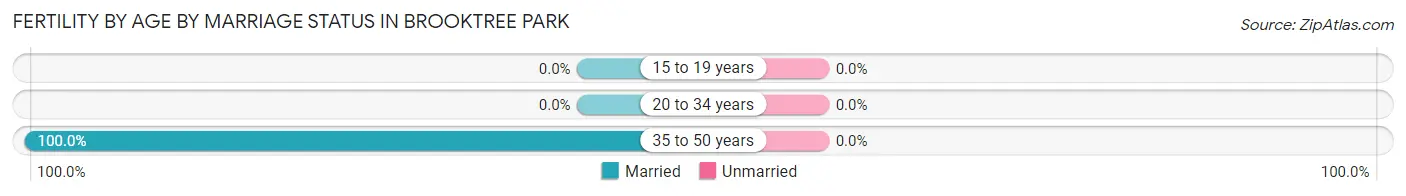
| Age Bracket | Married | Unmarried |
| 15 to 19 years | 0 (0.0%) | 0 (0.0%) |
| 20 to 34 years | 0 (0.0%) | 0 (0.0%) |
| 35 to 50 years | 8 (100.0%) | 0 (0.0%) |
| Total | 8 (100.0%) | 0 (0.0%) |
Fertility by Education in Brooktree Park
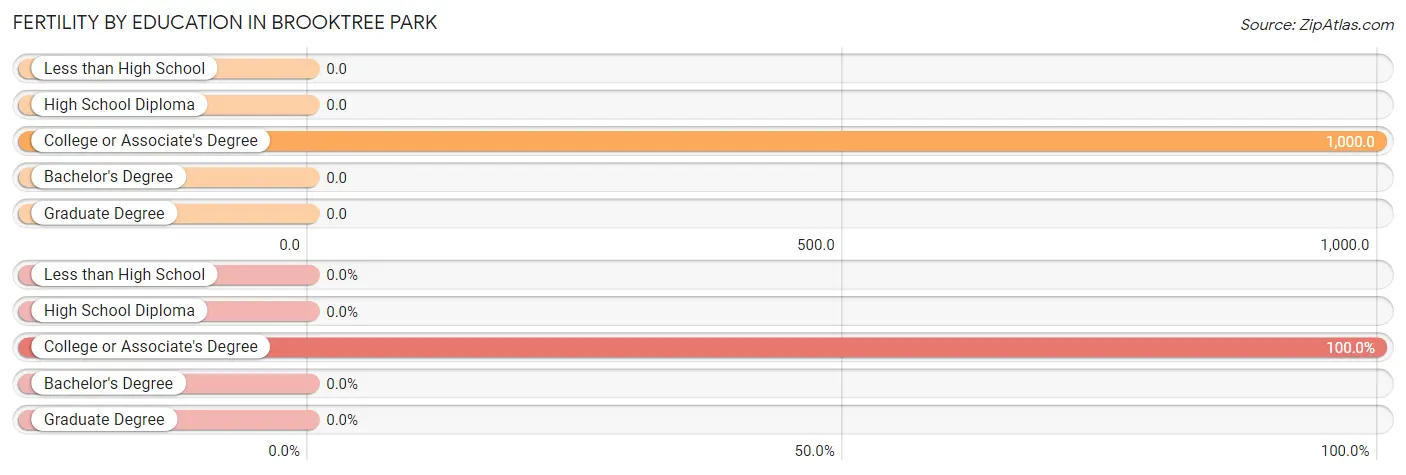
| Educational Attainment | Women with Births | Births / 1,000 Women |
| Less than High School | 0 (0.0%) | 0.0 |
| High School Diploma | 0 (0.0%) | 0.0 |
| College or Associate's Degree | 8 (100.0%) | 1,000.0 |
| Bachelor's Degree | 0 (0.0%) | 0.0 |
| Graduate Degree | 0 (0.0%) | 0.0 |
| Total | 8 (100.0%) | 229.0 |
Fertility by Education by Marriage Status in Brooktree Park
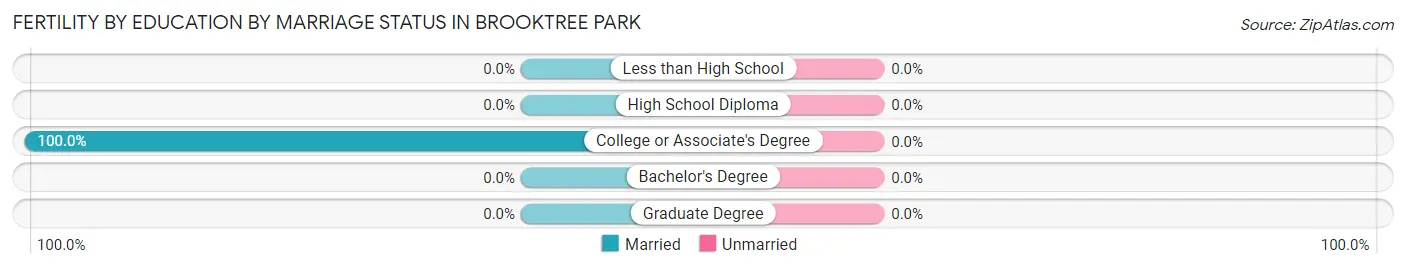
| Educational Attainment | Married | Unmarried |
| Less than High School | 0 (0.0%) | 0 (0.0%) |
| High School Diploma | 0 (0.0%) | 0 (0.0%) |
| College or Associate's Degree | 8 (100.0%) | 0 (0.0%) |
| Bachelor's Degree | 0 (0.0%) | 0 (0.0%) |
| Graduate Degree | 0 (0.0%) | 0 (0.0%) |
| Total | 8 (100.0%) | 0 (0.0%) |
Employment Characteristics in Brooktree Park
Employment by Class of Employer in Brooktree Park
Among the 64 employed individuals in Brooktree Park, self-employed (not incorporated) (38 | 59.4%), private company employees (16 | 25.0%), and federal government employees (10 | 15.6%) make up the most common classes of employment.
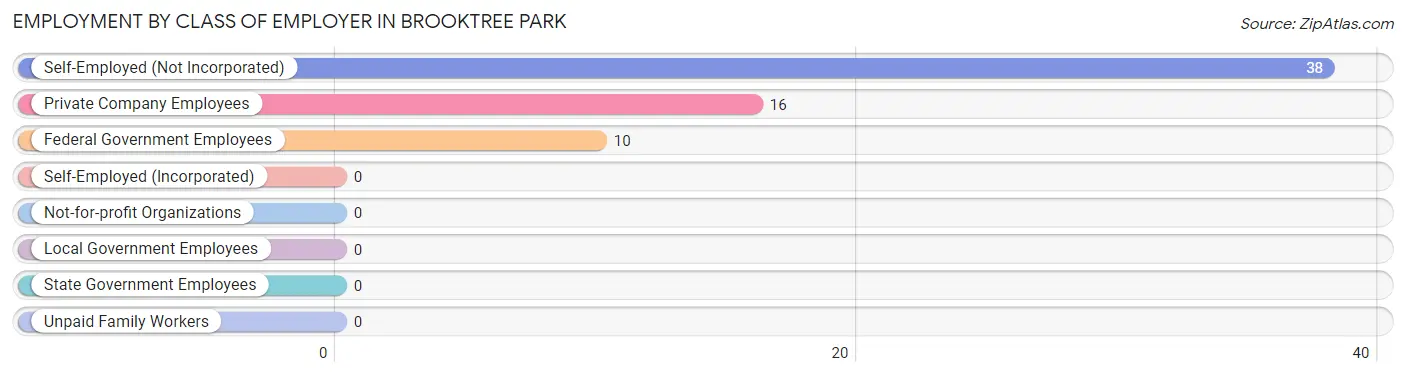
| Employer Class | # Employees | % Employees |
| Private Company Employees | 16 | 25.0% |
| Self-Employed (Incorporated) | 0 | 0.0% |
| Self-Employed (Not Incorporated) | 38 | 59.4% |
| Not-for-profit Organizations | 0 | 0.0% |
| Local Government Employees | 0 | 0.0% |
| State Government Employees | 0 | 0.0% |
| Federal Government Employees | 10 | 15.6% |
| Unpaid Family Workers | 0 | 0.0% |
| Total | 64 | 100.0% |
Employment Status by Age in Brooktree Park
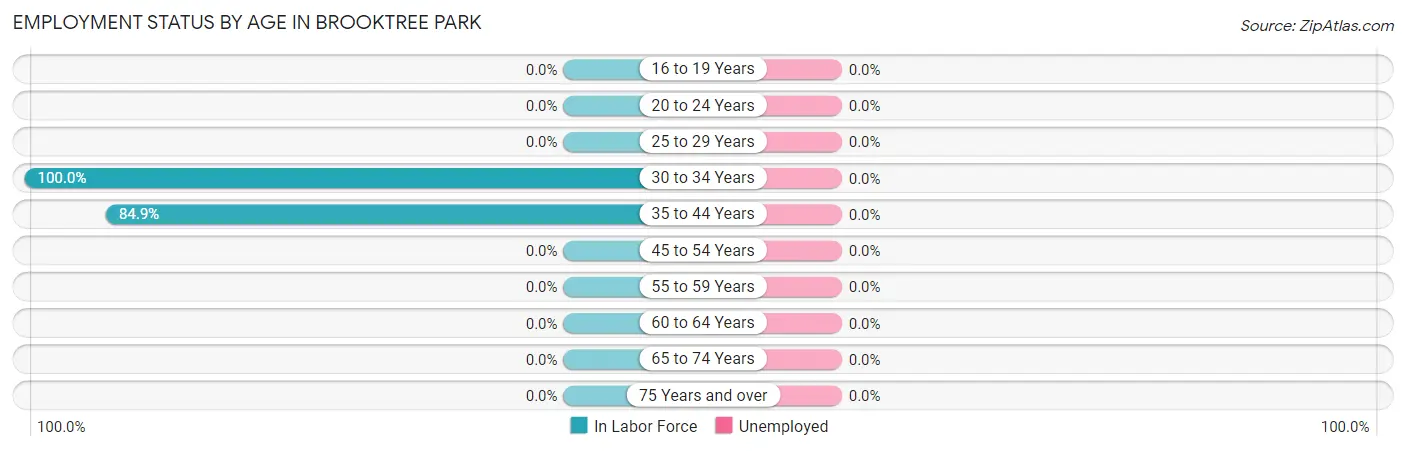
| Age Bracket | In Labor Force | Unemployed |
| 16 to 19 Years | 0 (0.0%) | 0 (0.0%) |
| 20 to 24 Years | 0 (0.0%) | 0 (0.0%) |
| 25 to 29 Years | 0 (0.0%) | 0 (0.0%) |
| 30 to 34 Years | 19 (100.0%) | 0 (0.0%) |
| 35 to 44 Years | 45 (84.9%) | 0 (0.0%) |
| 45 to 54 Years | 0 (0.0%) | 0 (0.0%) |
| 55 to 59 Years | 0 (0.0%) | 0 (0.0%) |
| 60 to 64 Years | 0 (0.0%) | 0 (0.0%) |
| 65 to 74 Years | 0 (0.0%) | 0 (0.0%) |
| 75 Years and over | 0 (0.0%) | 0 (0.0%) |
| Total | 64 (80.0%) | 0 (0.0%) |
Employment Status by Educational Attainment in Brooktree Park
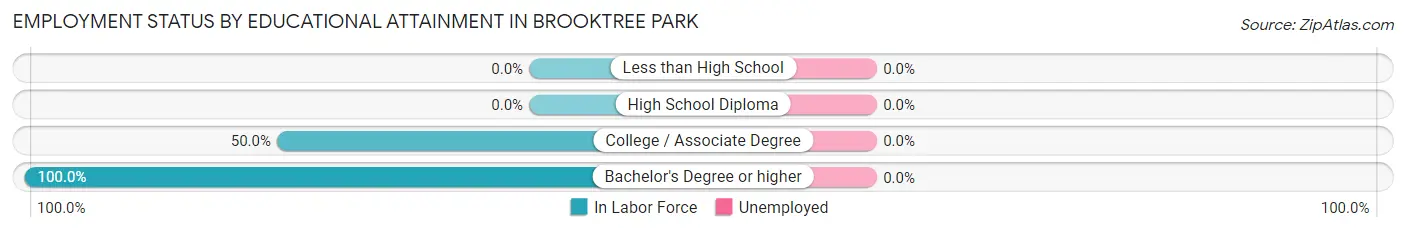
| Educational Attainment | In Labor Force | Unemployed |
| Less than High School | 0 (0.0%) | 0 (0.0%) |
| High School Diploma | 0 (0.0%) | 0 (0.0%) |
| College / Associate Degree | 8 (50.0%) | 0 (0.0%) |
| Bachelor's Degree or higher | 56 (100.0%) | 0 (0.0%) |
| Total | 64 (88.9%) | 0 (0.0%) |
Employment Occupations by Sex in Brooktree Park
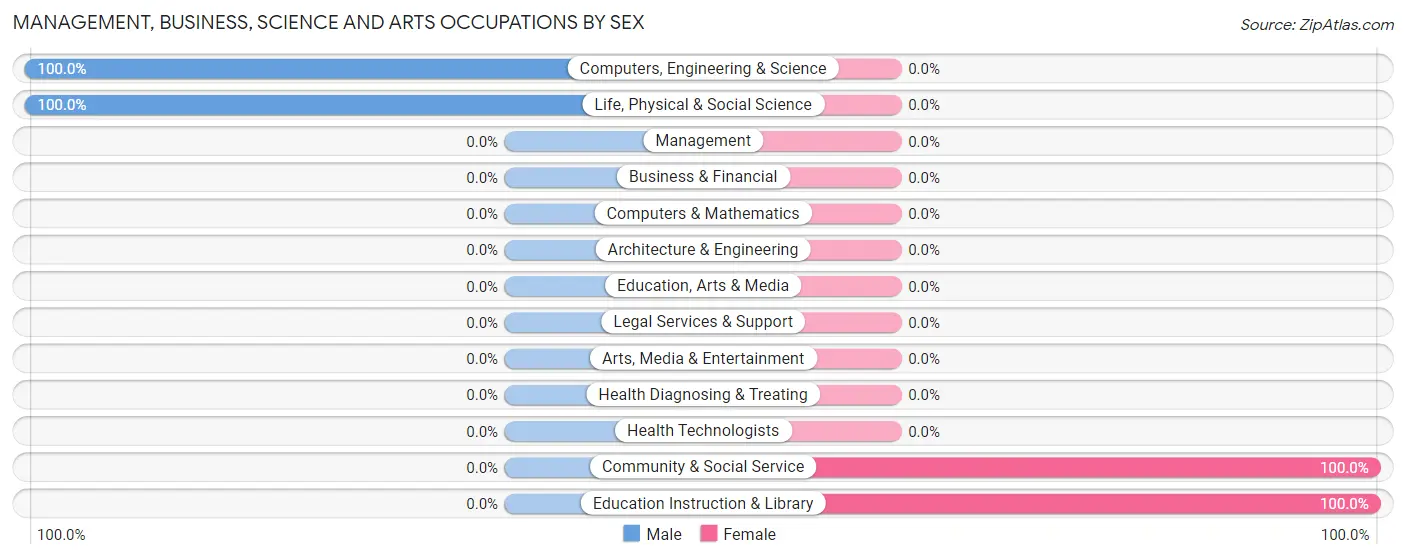
Management, Business, Science and Arts Occupations
The most common Management, Business, Science and Arts occupations in Brooktree Park are Community & Social Service (19 | 35.2%), Education Instruction & Library (19 | 35.2%), Computers, Engineering & Science (8 | 14.8%), and Life, Physical & Social Science (8 | 14.8%).
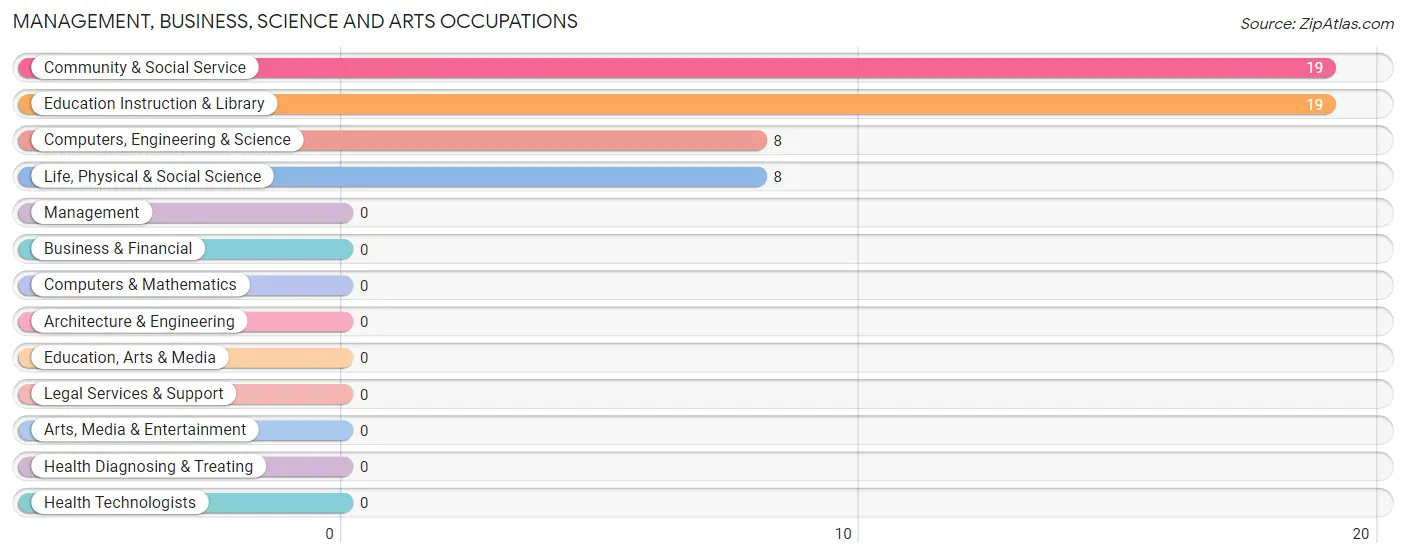
Management, Business, Science and Arts Occupations by Sex
Within the Management, Business, Science and Arts occupations in Brooktree Park, the most male-oriented occupations are Computers, Engineering & Science (100.0%), and Life, Physical & Social Science (100.0%), while the most female-oriented occupations are Community & Social Service (100.0%), and Education Instruction & Library (100.0%).
| Occupation | Male | Female |
| Management | 0 (0.0%) | 0 (0.0%) |
| Business & Financial | 0 (0.0%) | 0 (0.0%) |
| Computers, Engineering & Science | 8 (100.0%) | 0 (0.0%) |
| Computers & Mathematics | 0 (0.0%) | 0 (0.0%) |
| Architecture & Engineering | 0 (0.0%) | 0 (0.0%) |
| Life, Physical & Social Science | 8 (100.0%) | 0 (0.0%) |
| Community & Social Service | 0 (0.0%) | 19 (100.0%) |
| Education, Arts & Media | 0 (0.0%) | 0 (0.0%) |
| Legal Services & Support | 0 (0.0%) | 0 (0.0%) |
| Education Instruction & Library | 0 (0.0%) | 19 (100.0%) |
| Arts, Media & Entertainment | 0 (0.0%) | 0 (0.0%) |
| Health Diagnosing & Treating | 0 (0.0%) | 0 (0.0%) |
| Health Technologists | 0 (0.0%) | 0 (0.0%) |
| Total (Category) | 8 (29.6%) | 19 (70.4%) |
| Total (Overall) | 27 (50.0%) | 27 (50.0%) |
Services Occupations
Services Occupations by Sex
| Occupation | Male | Female |
| Healthcare Support | 0 (0.0%) | 0 (0.0%) |
| Security & Protection | 0 (0.0%) | 0 (0.0%) |
| Firefighting & Prevention | 0 (0.0%) | 0 (0.0%) |
| Law Enforcement | 0 (0.0%) | 0 (0.0%) |
| Food Preparation & Serving | 0 (0.0%) | 0 (0.0%) |
| Cleaning & Maintenance | 0 (0.0%) | 0 (0.0%) |
| Personal Care & Service | 0 (0.0%) | 0 (0.0%) |
| Total (Category) | 0 (0.0%) | 0 (0.0%) |
| Total (Overall) | 27 (50.0%) | 27 (50.0%) |
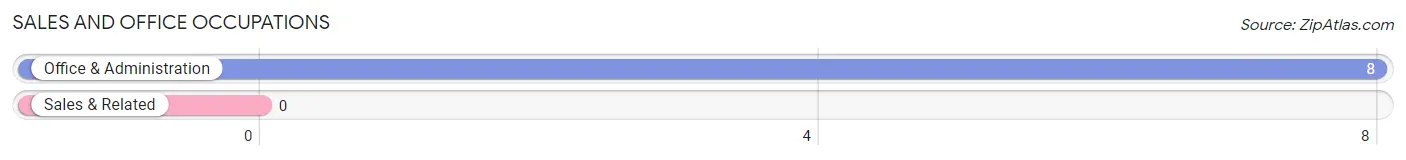
Sales and Office Occupations
The most common Sales and Office occupations in Brooktree Park are , and Office & Administration (8 | 14.8%).
Sales and Office Occupations by Sex
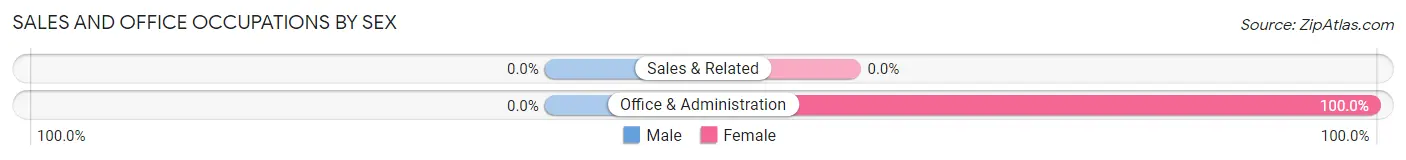
| Occupation | Male | Female |
| Sales & Related | 0 (0.0%) | 0 (0.0%) |
| Office & Administration | 0 (0.0%) | 8 (100.0%) |
| Total (Category) | 0 (0.0%) | 8 (100.0%) |
| Total (Overall) | 27 (50.0%) | 27 (50.0%) |
Natural Resources, Construction and Maintenance Occupations
The most common Natural Resources, Construction and Maintenance occupations in Brooktree Park are , and Construction & Extraction (19 | 35.2%).
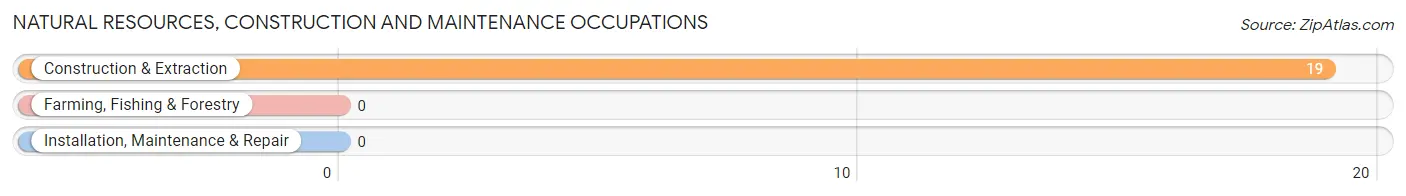
Natural Resources, Construction and Maintenance Occupations by Sex
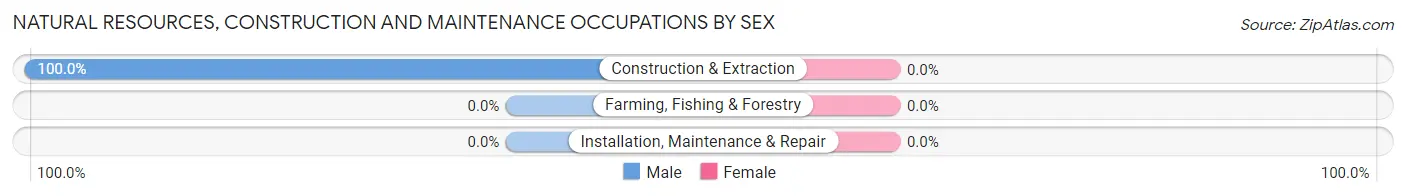
| Occupation | Male | Female |
| Farming, Fishing & Forestry | 0 (0.0%) | 0 (0.0%) |
| Construction & Extraction | 19 (100.0%) | 0 (0.0%) |
| Installation, Maintenance & Repair | 0 (0.0%) | 0 (0.0%) |
| Total (Category) | 19 (100.0%) | 0 (0.0%) |
| Total (Overall) | 27 (50.0%) | 27 (50.0%) |
Production, Transportation and Moving Occupations
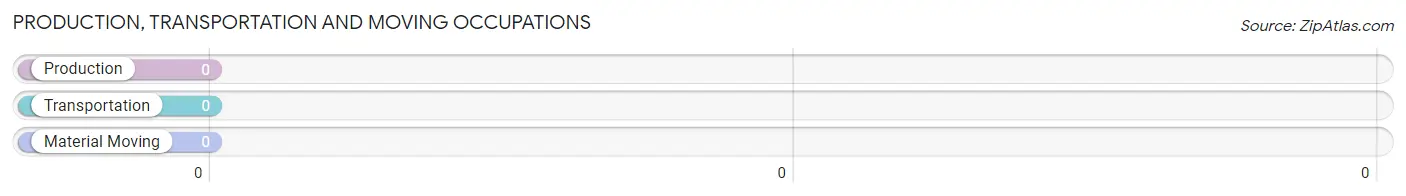
Production, Transportation and Moving Occupations by Sex
| Occupation | Male | Female |
| Production | 0 (0.0%) | 0 (0.0%) |
| Transportation | 0 (0.0%) | 0 (0.0%) |
| Material Moving | 0 (0.0%) | 0 (0.0%) |
| Total (Category) | 0 (0.0%) | 0 (0.0%) |
| Total (Overall) | 27 (50.0%) | 27 (50.0%) |
Employment Industries by Sex in Brooktree Park
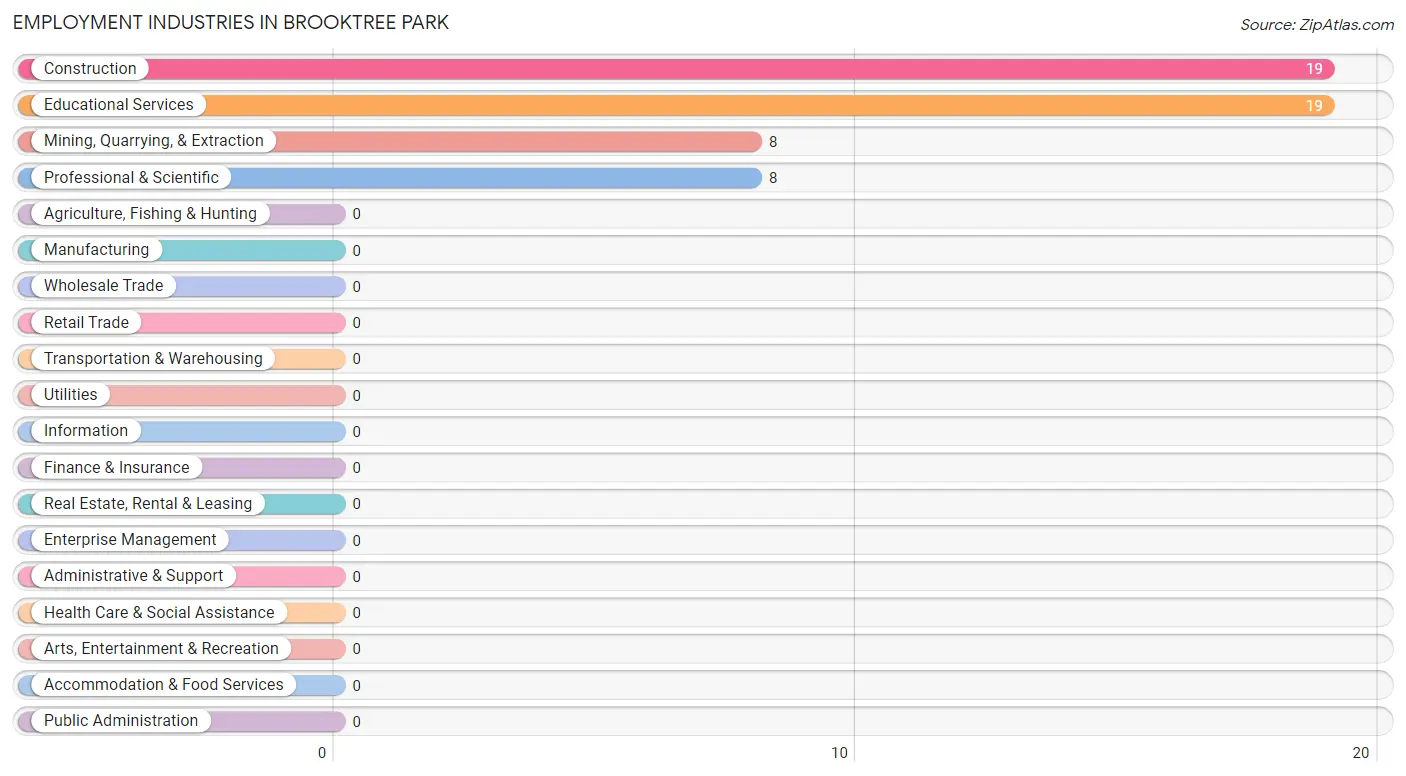
Employment Industries in Brooktree Park
The major employment industries in Brooktree Park include Construction (19 | 35.2%), Educational Services (19 | 35.2%), Mining, Quarrying, & Extraction (8 | 14.8%), and Professional & Scientific (8 | 14.8%).
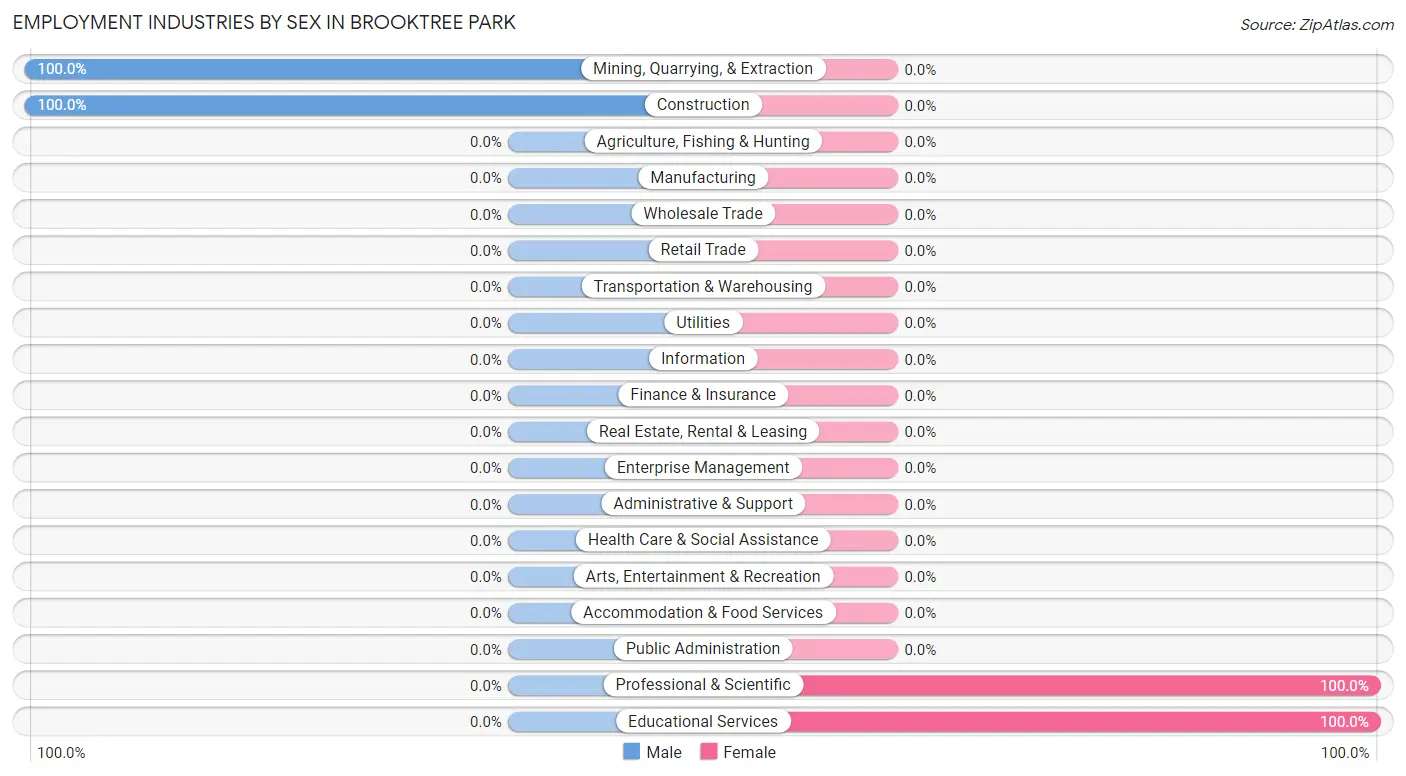
Employment Industries by Sex in Brooktree Park
The Brooktree Park industries that see more men than women are Mining, Quarrying, & Extraction (100.0%), and Construction (100.0%), whereas the industries that tend to have a higher number of women are Professional & Scientific (100.0%), and Educational Services (100.0%).
| Industry | Male | Female |
| Agriculture, Fishing & Hunting | 0 (0.0%) | 0 (0.0%) |
| Mining, Quarrying, & Extraction | 8 (100.0%) | 0 (0.0%) |
| Construction | 19 (100.0%) | 0 (0.0%) |
| Manufacturing | 0 (0.0%) | 0 (0.0%) |
| Wholesale Trade | 0 (0.0%) | 0 (0.0%) |
| Retail Trade | 0 (0.0%) | 0 (0.0%) |
| Transportation & Warehousing | 0 (0.0%) | 0 (0.0%) |
| Utilities | 0 (0.0%) | 0 (0.0%) |
| Information | 0 (0.0%) | 0 (0.0%) |
| Finance & Insurance | 0 (0.0%) | 0 (0.0%) |
| Real Estate, Rental & Leasing | 0 (0.0%) | 0 (0.0%) |
| Professional & Scientific | 0 (0.0%) | 8 (100.0%) |
| Enterprise Management | 0 (0.0%) | 0 (0.0%) |
| Administrative & Support | 0 (0.0%) | 0 (0.0%) |
| Educational Services | 0 (0.0%) | 19 (100.0%) |
| Health Care & Social Assistance | 0 (0.0%) | 0 (0.0%) |
| Arts, Entertainment & Recreation | 0 (0.0%) | 0 (0.0%) |
| Accommodation & Food Services | 0 (0.0%) | 0 (0.0%) |
| Public Administration | 0 (0.0%) | 0 (0.0%) |
| Total | 27 (50.0%) | 27 (50.0%) |
Education in Brooktree Park
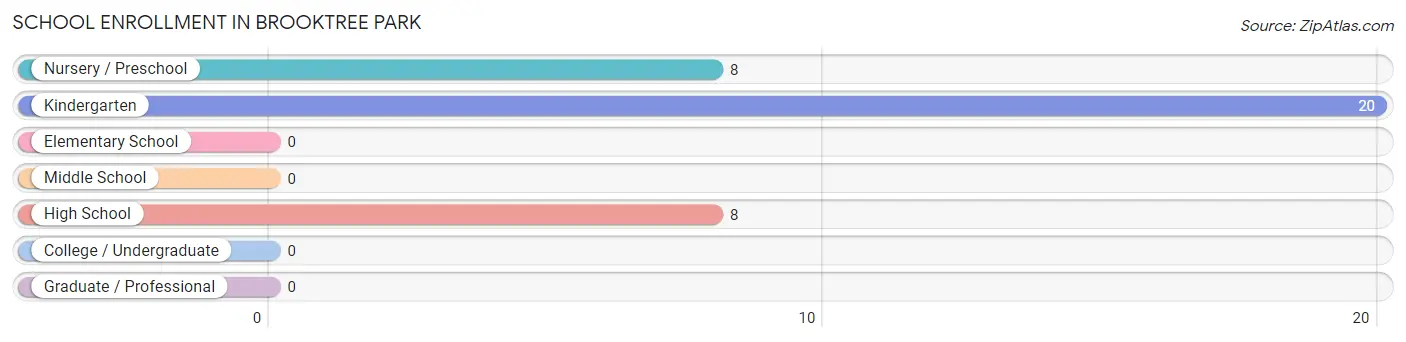
School Enrollment in Brooktree Park
The most common levels of schooling among the 36 students in Brooktree Park are kindergarten (20 | 55.6%), nursery / preschool (8 | 22.2%), and high school (8 | 22.2%).
| School Level | # Students | % Students |
| Nursery / Preschool | 8 | 22.2% |
| Kindergarten | 20 | 55.6% |
| Elementary School | 0 | 0.0% |
| Middle School | 0 | 0.0% |
| High School | 8 | 22.2% |
| College / Undergraduate | 0 | 0.0% |
| Graduate / Professional | 0 | 0.0% |
| Total | 36 | 100.0% |
School Enrollment by Age by Funding Source in Brooktree Park
Out of a total of 36 students who are enrolled in schools in Brooktree Park, 8 (22.2%) attend a private institution, while the remaining 28 (77.8%) are enrolled in public schools. The age group of 5 to 9 year old has the highest likelihood of being enrolled in private schools, with 8 (28.6% in the age bracket) enrolled. Conversely, the age group of 15 to 17 year olds has the lowest likelihood of being enrolled in a private school, with 8 (100.0% in the age bracket) attending a public institution.
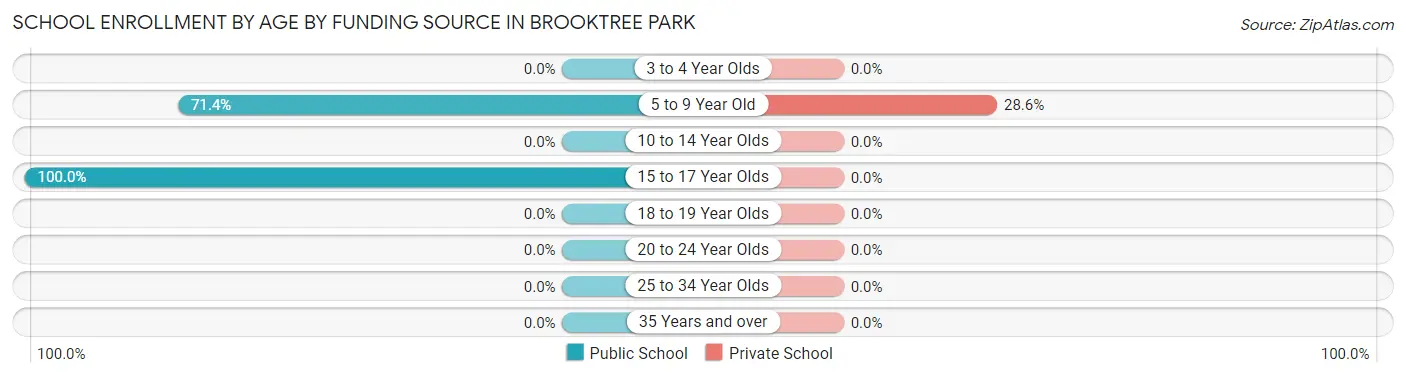
| Age Bracket | Public School | Private School |
| 3 to 4 Year Olds | 0 (0.0%) | 0 (0.0%) |
| 5 to 9 Year Old | 20 (71.4%) | 8 (28.6%) |
| 10 to 14 Year Olds | 0 (0.0%) | 0 (0.0%) |
| 15 to 17 Year Olds | 8 (100.0%) | 0 (0.0%) |
| 18 to 19 Year Olds | 0 (0.0%) | 0 (0.0%) |
| 20 to 24 Year Olds | 0 (0.0%) | 0 (0.0%) |
| 25 to 34 Year Olds | 0 (0.0%) | 0 (0.0%) |
| 35 Years and over | 0 (0.0%) | 0 (0.0%) |
| Total | 28 (77.8%) | 8 (22.2%) |
Educational Attainment by Field of Study in Brooktree Park
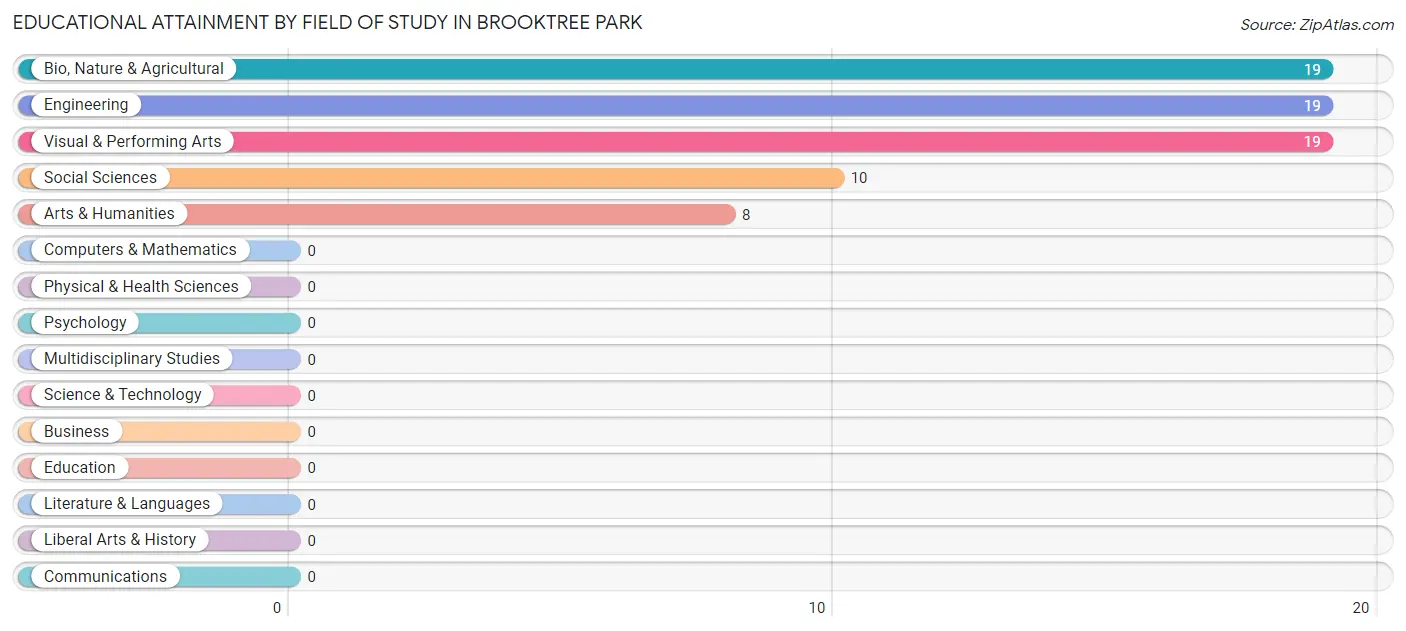
Bio, nature & agricultural (19 | 25.3%), engineering (19 | 25.3%), visual & performing arts (19 | 25.3%), social sciences (10 | 13.3%), and arts & humanities (8 | 10.7%) are the most common fields of study among 75 individuals in Brooktree Park who have obtained a bachelor's degree or higher.
| Field of Study | # Graduates | % Graduates |
| Computers & Mathematics | 0 | 0.0% |
| Bio, Nature & Agricultural | 19 | 25.3% |
| Physical & Health Sciences | 0 | 0.0% |
| Psychology | 0 | 0.0% |
| Social Sciences | 10 | 13.3% |
| Engineering | 19 | 25.3% |
| Multidisciplinary Studies | 0 | 0.0% |
| Science & Technology | 0 | 0.0% |
| Business | 0 | 0.0% |
| Education | 0 | 0.0% |
| Literature & Languages | 0 | 0.0% |
| Liberal Arts & History | 0 | 0.0% |
| Visual & Performing Arts | 19 | 25.3% |
| Communications | 0 | 0.0% |
| Arts & Humanities | 8 | 10.7% |
| Total | 75 | 100.0% |
Transportation & Commute in Brooktree Park
Vehicle Availability by Sex in Brooktree Park
The most prevalent vehicle ownership categories in Brooktree Park are males with 2 vehicles (37, accounting for 100.0%) and females with 2 vehicles (27, making up 137.0%).
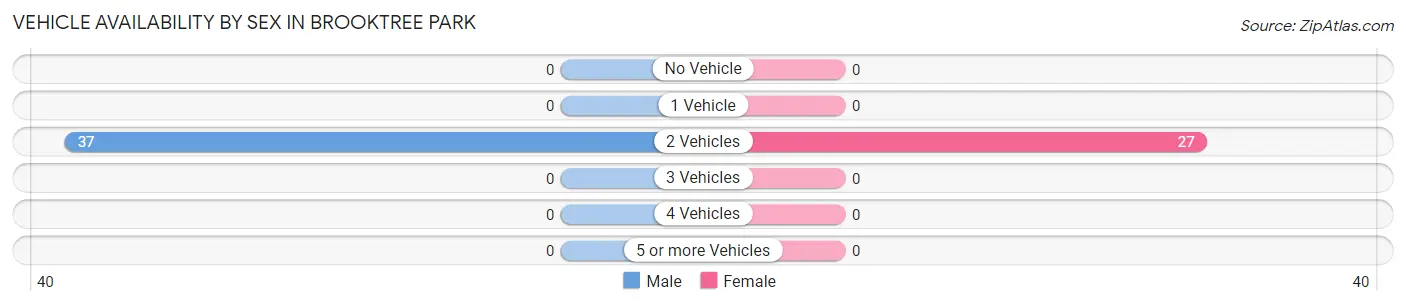
| Vehicles Available | Male | Female |
| No Vehicle | 0 (0.0%) | 0 (0.0%) |
| 1 Vehicle | 0 (0.0%) | 0 (0.0%) |
| 2 Vehicles | 37 (100.0%) | 27 (100.0%) |
| 3 Vehicles | 0 (0.0%) | 0 (0.0%) |
| 4 Vehicles | 0 (0.0%) | 0 (0.0%) |
| 5 or more Vehicles | 0 (0.0%) | 0 (0.0%) |
| Total | 37 (100.0%) | 27 (100.0%) |
Commute Time in Brooktree Park
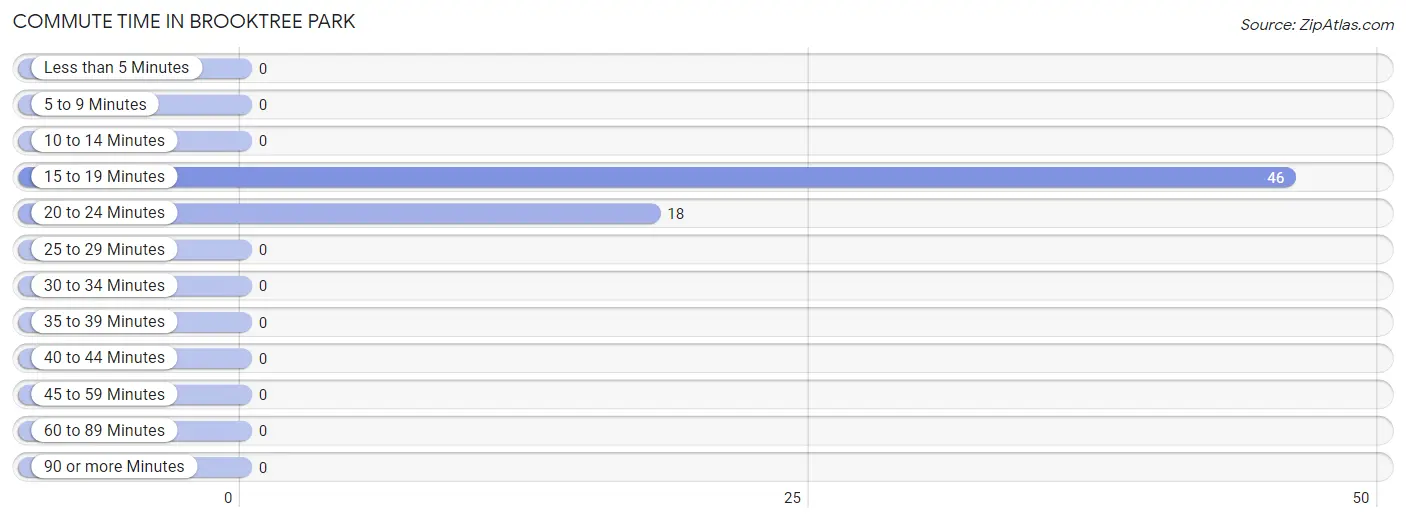
The most frequently occuring commute durations in Brooktree Park are 15 to 19 minutes (46 commuters, 71.9%), 20 to 24 minutes (18 commuters, 28.1%), and less than 5 minutes (0 commuters, 0.0%).
| Commute Time | # Commuters | % Commuters |
| Less than 5 Minutes | 0 | 0.0% |
| 5 to 9 Minutes | 0 | 0.0% |
| 10 to 14 Minutes | 0 | 0.0% |
| 15 to 19 Minutes | 46 | 71.9% |
| 20 to 24 Minutes | 18 | 28.1% |
| 25 to 29 Minutes | 0 | 0.0% |
| 30 to 34 Minutes | 0 | 0.0% |
| 35 to 39 Minutes | 0 | 0.0% |
| 40 to 44 Minutes | 0 | 0.0% |
| 45 to 59 Minutes | 0 | 0.0% |
| 60 to 89 Minutes | 0 | 0.0% |
| 90 or more Minutes | 0 | 0.0% |
Commute Time by Sex in Brooktree Park
The most common commute times in Brooktree Park are 15 to 19 minutes (27 commuters, 73.0%) for males and 15 to 19 minutes (19 commuters, 70.4%) for females.
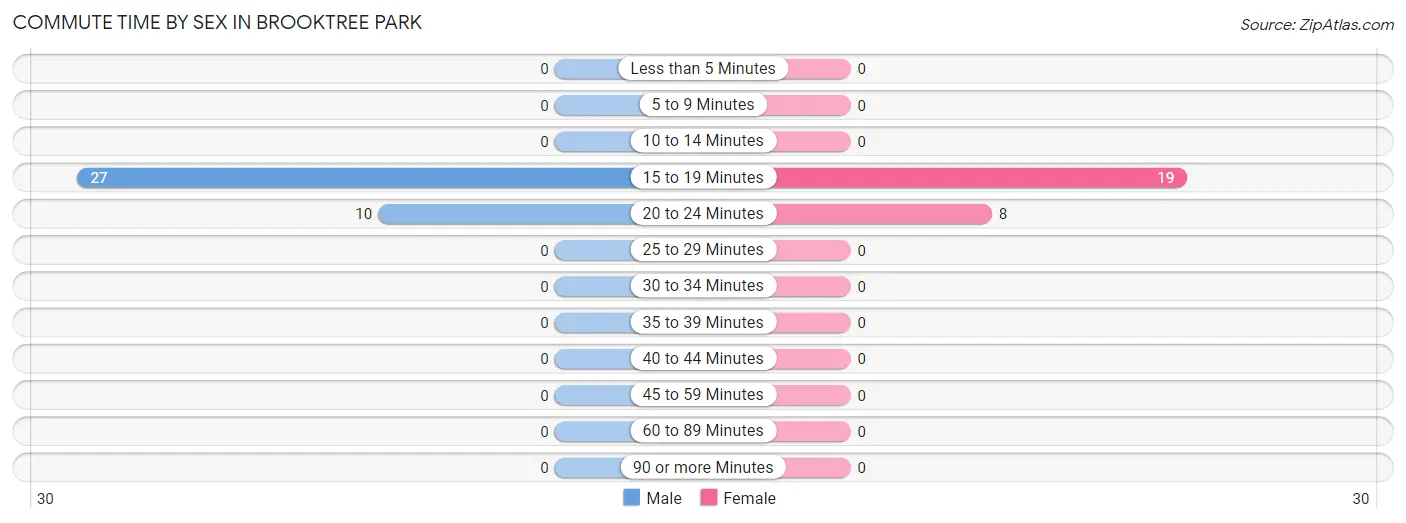
| Commute Time | Male | Female |
| Less than 5 Minutes | 0 (0.0%) | 0 (0.0%) |
| 5 to 9 Minutes | 0 (0.0%) | 0 (0.0%) |
| 10 to 14 Minutes | 0 (0.0%) | 0 (0.0%) |
| 15 to 19 Minutes | 27 (73.0%) | 19 (70.4%) |
| 20 to 24 Minutes | 10 (27.0%) | 8 (29.6%) |
| 25 to 29 Minutes | 0 (0.0%) | 0 (0.0%) |
| 30 to 34 Minutes | 0 (0.0%) | 0 (0.0%) |
| 35 to 39 Minutes | 0 (0.0%) | 0 (0.0%) |
| 40 to 44 Minutes | 0 (0.0%) | 0 (0.0%) |
| 45 to 59 Minutes | 0 (0.0%) | 0 (0.0%) |
| 60 to 89 Minutes | 0 (0.0%) | 0 (0.0%) |
| 90 or more Minutes | 0 (0.0%) | 0 (0.0%) |
Time of Departure to Work by Sex in Brooktree Park
The most frequent times of departure to work in Brooktree Park are 8:00 AM to 8:29 AM (19, 51.3%) for males and 9:00 AM to 9:59 AM (19, 70.4%) for females.
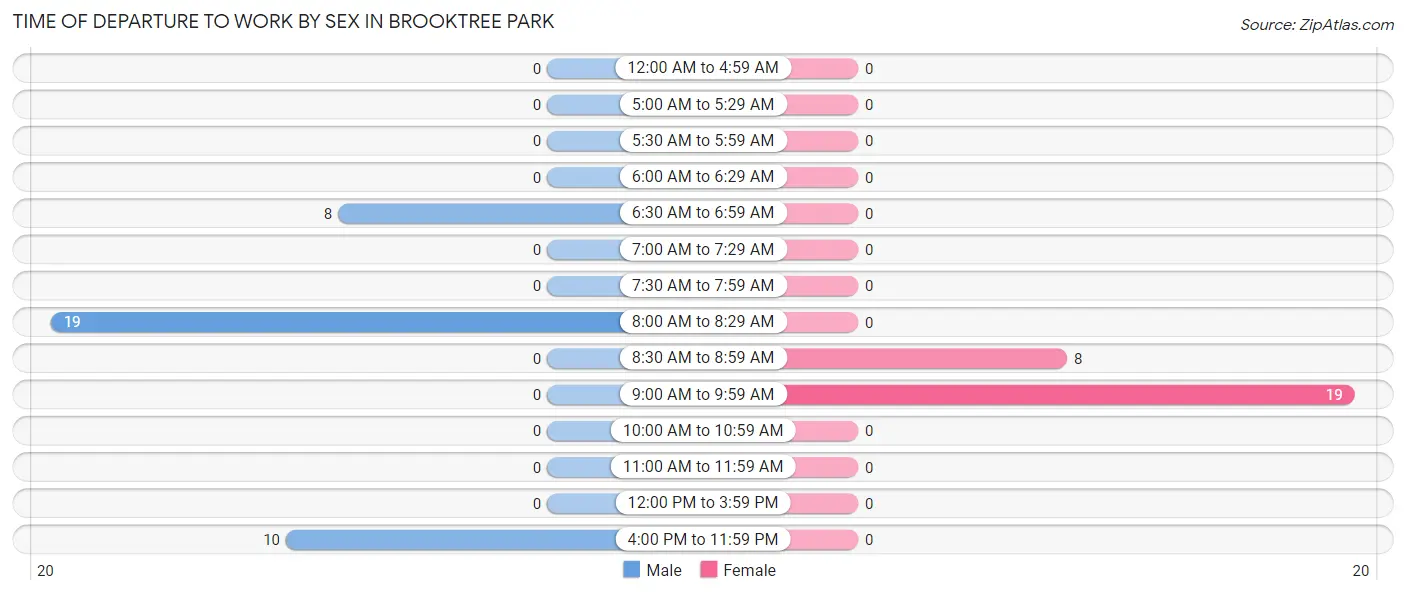
| Time of Departure | Male | Female |
| 12:00 AM to 4:59 AM | 0 (0.0%) | 0 (0.0%) |
| 5:00 AM to 5:29 AM | 0 (0.0%) | 0 (0.0%) |
| 5:30 AM to 5:59 AM | 0 (0.0%) | 0 (0.0%) |
| 6:00 AM to 6:29 AM | 0 (0.0%) | 0 (0.0%) |
| 6:30 AM to 6:59 AM | 8 (21.6%) | 0 (0.0%) |
| 7:00 AM to 7:29 AM | 0 (0.0%) | 0 (0.0%) |
| 7:30 AM to 7:59 AM | 0 (0.0%) | 0 (0.0%) |
| 8:00 AM to 8:29 AM | 19 (51.3%) | 0 (0.0%) |
| 8:30 AM to 8:59 AM | 0 (0.0%) | 8 (29.6%) |
| 9:00 AM to 9:59 AM | 0 (0.0%) | 19 (70.4%) |
| 10:00 AM to 10:59 AM | 0 (0.0%) | 0 (0.0%) |
| 11:00 AM to 11:59 AM | 0 (0.0%) | 0 (0.0%) |
| 12:00 PM to 3:59 PM | 0 (0.0%) | 0 (0.0%) |
| 4:00 PM to 11:59 PM | 10 (27.0%) | 0 (0.0%) |
| Total | 37 (100.0%) | 27 (100.0%) |
Housing Occupancy in Brooktree Park
Occupancy by Ownership in Brooktree Park
Of the total 37 dwellings in Brooktree Park, owner-occupied units account for 37 (100.0%), while renter-occupied units make up 0 (0.0%).
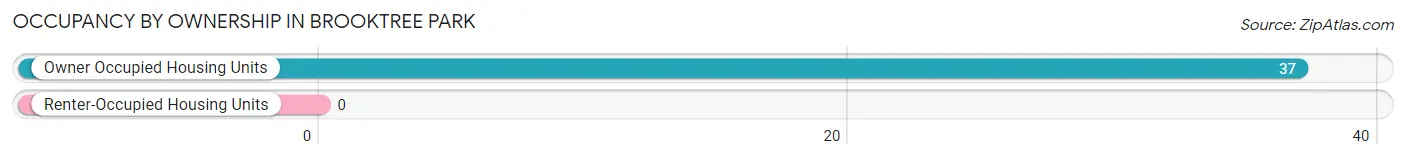
| Occupancy | # Housing Units | % Housing Units |
| Owner Occupied Housing Units | 37 | 100.0% |
| Renter-Occupied Housing Units | 0 | 0.0% |
| Total Occupied Housing Units | 37 | 100.0% |
Occupancy by Household Size in Brooktree Park
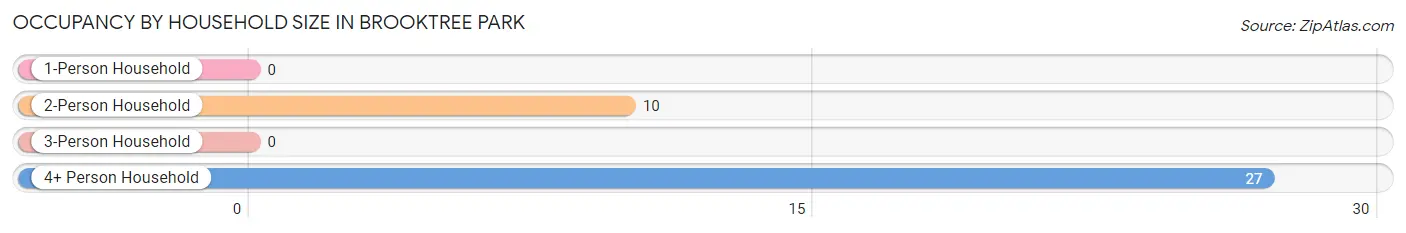
| Household Size | # Housing Units | % Housing Units |
| 1-Person Household | 0 | 0.0% |
| 2-Person Household | 10 | 27.0% |
| 3-Person Household | 0 | 0.0% |
| 4+ Person Household | 27 | 73.0% |
| Total Housing Units | 37 | 100.0% |
Occupancy by Ownership by Household Size in Brooktree Park
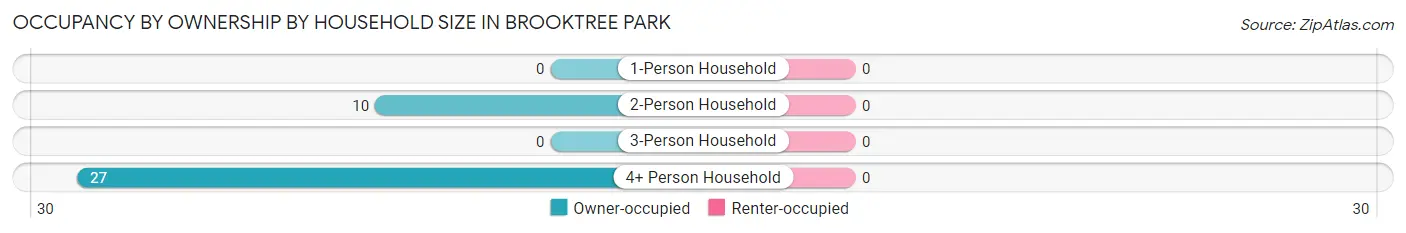
| Household Size | Owner-occupied | Renter-occupied |
| 1-Person Household | 0 (0.0%) | 0 (0.0%) |
| 2-Person Household | 10 (100.0%) | 0 (0.0%) |
| 3-Person Household | 0 (0.0%) | 0 (0.0%) |
| 4+ Person Household | 27 (100.0%) | 0 (0.0%) |
| Total Housing Units | 37 (100.0%) | 0 (0.0%) |
Occupancy by Educational Attainment in Brooktree Park
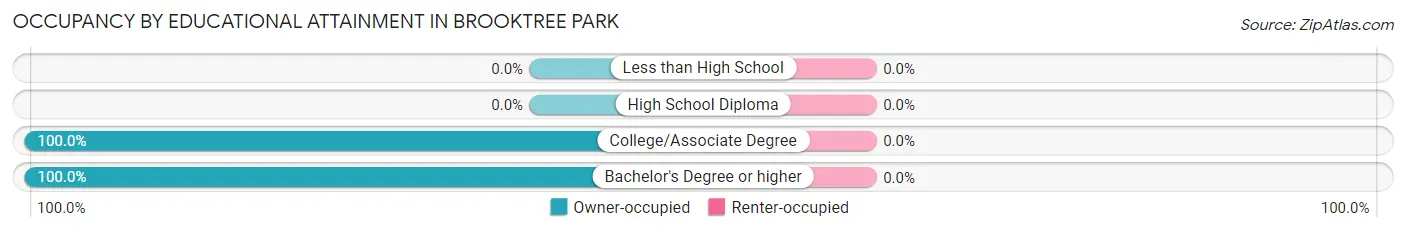
| Household Size | Owner-occupied | Renter-occupied |
| Less than High School | 0 (0.0%) | 0 (0.0%) |
| High School Diploma | 0 (0.0%) | 0 (0.0%) |
| College/Associate Degree | 8 (100.0%) | 0 (0.0%) |
| Bachelor's Degree or higher | 29 (100.0%) | 0 (0.0%) |
Occupancy by Age of Householder in Brooktree Park
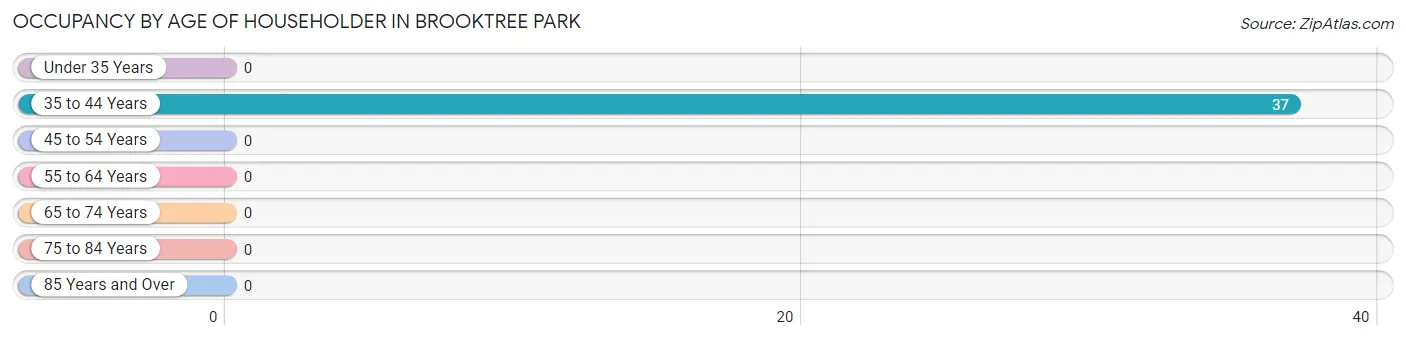
| Age Bracket | # Households | % Households |
| Under 35 Years | 0 | 0.0% |
| 35 to 44 Years | 37 | 100.0% |
| 45 to 54 Years | 0 | 0.0% |
| 55 to 64 Years | 0 | 0.0% |
| 65 to 74 Years | 0 | 0.0% |
| 75 to 84 Years | 0 | 0.0% |
| 85 Years and Over | 0 | 0.0% |
| Total | 37 | 100.0% |
Housing Finances in Brooktree Park
Median Income by Occupancy in Brooktree Park
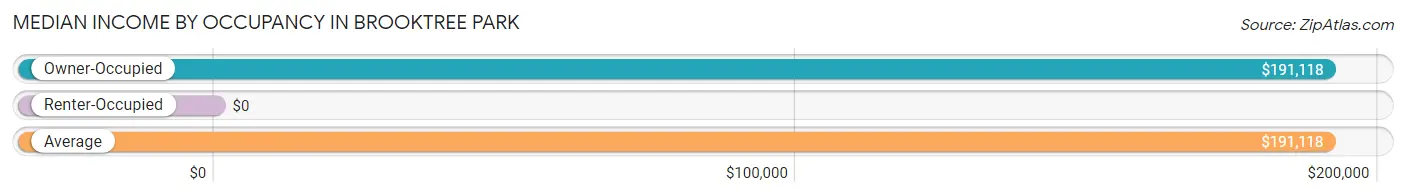
| Occupancy Type | # Households | Median Income |
| Owner-Occupied | 37 (100.0%) | $191,118 |
| Renter-Occupied | 0 (0.0%) | $0 |
| Average | 37 (100.0%) | $191,118 |
Occupancy by Householder Income Bracket in Brooktree Park
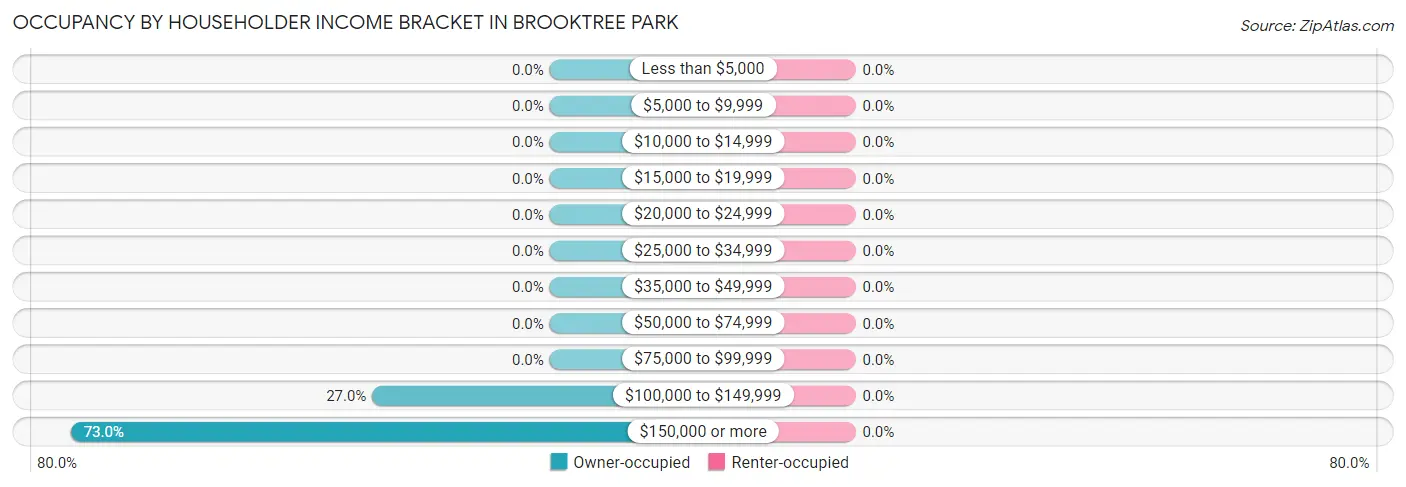
| Income Bracket | Owner-occupied | Renter-occupied |
| Less than $5,000 | 0 (0.0%) | 0 (0.0%) |
| $5,000 to $9,999 | 0 (0.0%) | 0 (0.0%) |
| $10,000 to $14,999 | 0 (0.0%) | 0 (0.0%) |
| $15,000 to $19,999 | 0 (0.0%) | 0 (0.0%) |
| $20,000 to $24,999 | 0 (0.0%) | 0 (0.0%) |
| $25,000 to $34,999 | 0 (0.0%) | 0 (0.0%) |
| $35,000 to $49,999 | 0 (0.0%) | 0 (0.0%) |
| $50,000 to $74,999 | 0 (0.0%) | 0 (0.0%) |
| $75,000 to $99,999 | 0 (0.0%) | 0 (0.0%) |
| $100,000 to $149,999 | 10 (27.0%) | 0 (0.0%) |
| $150,000 or more | 27 (73.0%) | 0 (0.0%) |
| Total | 37 (100.0%) | 0 (0.0%) |
Monthly Housing Cost Tiers in Brooktree Park
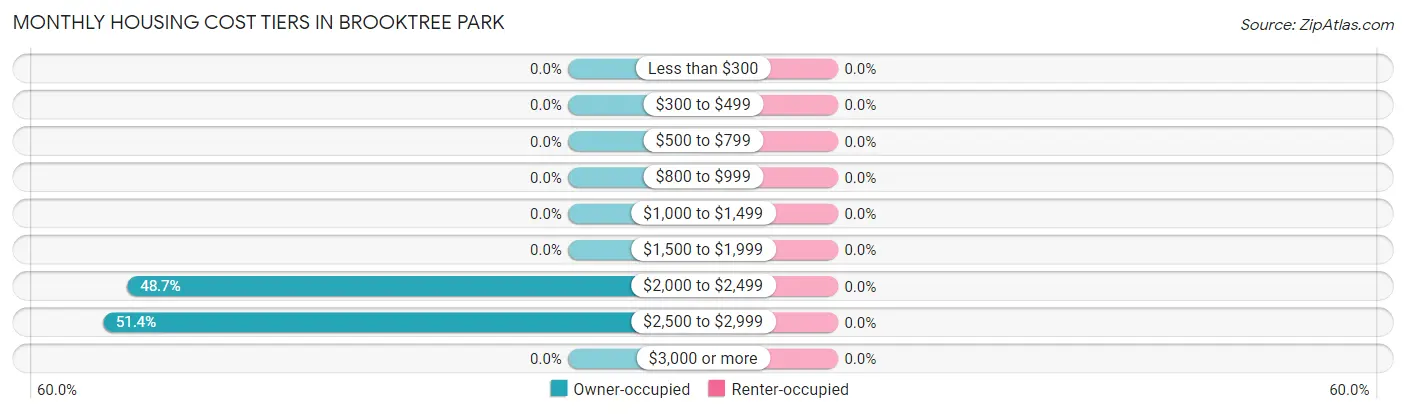
| Monthly Cost | Owner-occupied | Renter-occupied |
| Less than $300 | 0 (0.0%) | 0 (0.0%) |
| $300 to $499 | 0 (0.0%) | 0 (0.0%) |
| $500 to $799 | 0 (0.0%) | 0 (0.0%) |
| $800 to $999 | 0 (0.0%) | 0 (0.0%) |
| $1,000 to $1,499 | 0 (0.0%) | 0 (0.0%) |
| $1,500 to $1,999 | 0 (0.0%) | 0 (0.0%) |
| $2,000 to $2,499 | 18 (48.6%) | 0 (0.0%) |
| $2,500 to $2,999 | 19 (51.3%) | 0 (0.0%) |
| $3,000 or more | 0 (0.0%) | 0 (0.0%) |
| Total | 37 (100.0%) | 0 (0.0%) |
Physical Housing Characteristics in Brooktree Park
Housing Structures in Brooktree Park
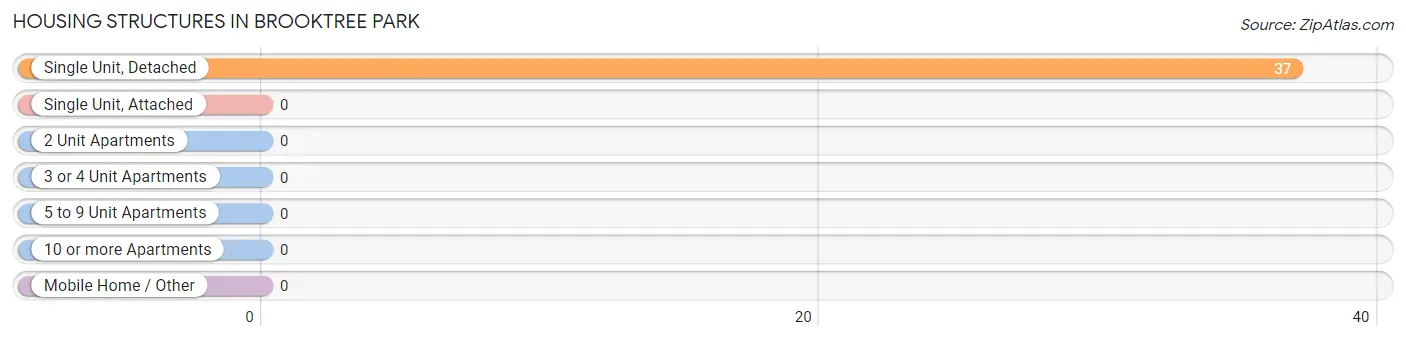
| Structure Type | # Housing Units | % Housing Units |
| Single Unit, Detached | 37 | 100.0% |
| Single Unit, Attached | 0 | 0.0% |
| 2 Unit Apartments | 0 | 0.0% |
| 3 or 4 Unit Apartments | 0 | 0.0% |
| 5 to 9 Unit Apartments | 0 | 0.0% |
| 10 or more Apartments | 0 | 0.0% |
| Mobile Home / Other | 0 | 0.0% |
| Total | 37 | 100.0% |
Housing Structures by Occupancy in Brooktree Park
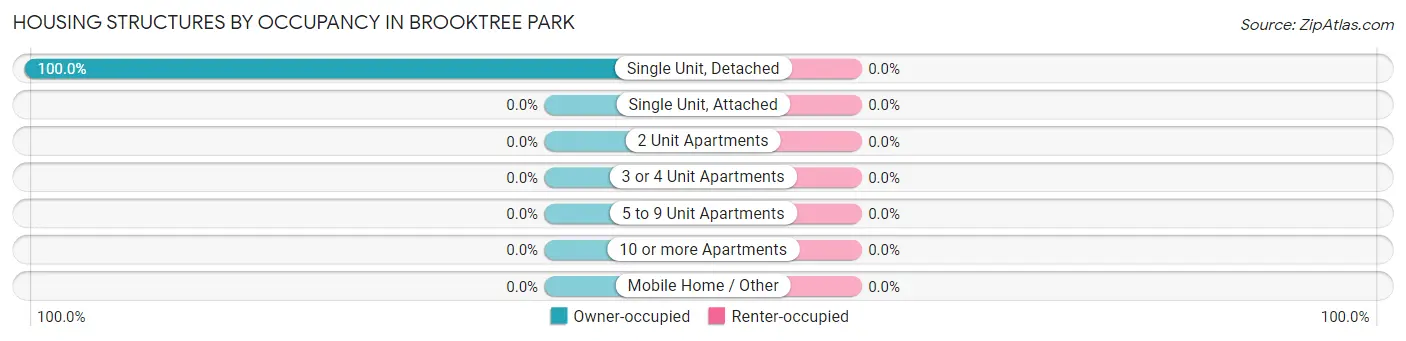
| Structure Type | Owner-occupied | Renter-occupied |
| Single Unit, Detached | 37 (100.0%) | 0 (0.0%) |
| Single Unit, Attached | 0 (0.0%) | 0 (0.0%) |
| 2 Unit Apartments | 0 (0.0%) | 0 (0.0%) |
| 3 or 4 Unit Apartments | 0 (0.0%) | 0 (0.0%) |
| 5 to 9 Unit Apartments | 0 (0.0%) | 0 (0.0%) |
| 10 or more Apartments | 0 (0.0%) | 0 (0.0%) |
| Mobile Home / Other | 0 (0.0%) | 0 (0.0%) |
| Total | 37 (100.0%) | 0 (0.0%) |
Housing Structures by Number of Rooms in Brooktree Park
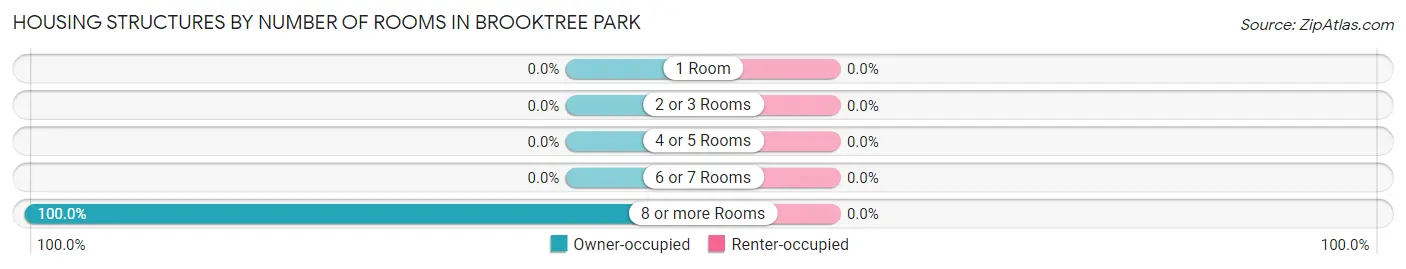
| Number of Rooms | Owner-occupied | Renter-occupied |
| 1 Room | 0 (0.0%) | 0 (0.0%) |
| 2 or 3 Rooms | 0 (0.0%) | 0 (0.0%) |
| 4 or 5 Rooms | 0 (0.0%) | 0 (0.0%) |
| 6 or 7 Rooms | 0 (0.0%) | 0 (0.0%) |
| 8 or more Rooms | 37 (100.0%) | 0 (0.0%) |
| Total | 37 (100.0%) | 0 (0.0%) |
Housing Structure by Heating Type in Brooktree Park
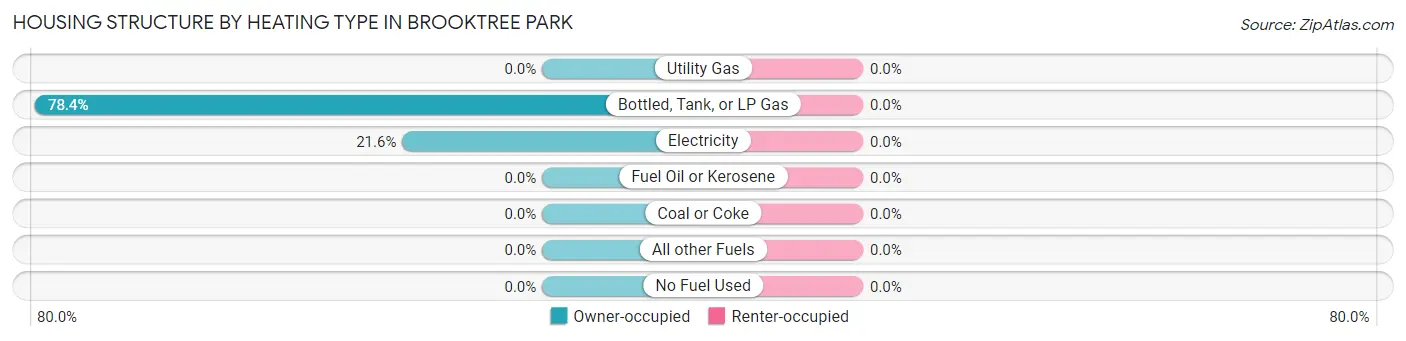
| Heating Type | Owner-occupied | Renter-occupied |
| Utility Gas | 0 (0.0%) | 0 (0.0%) |
| Bottled, Tank, or LP Gas | 29 (78.4%) | 0 (0.0%) |
| Electricity | 8 (21.6%) | 0 (0.0%) |
| Fuel Oil or Kerosene | 0 (0.0%) | 0 (0.0%) |
| Coal or Coke | 0 (0.0%) | 0 (0.0%) |
| All other Fuels | 0 (0.0%) | 0 (0.0%) |
| No Fuel Used | 0 (0.0%) | 0 (0.0%) |
| Total | 37 (100.0%) | 0 (0.0%) |
Household Vehicle Usage in Brooktree Park
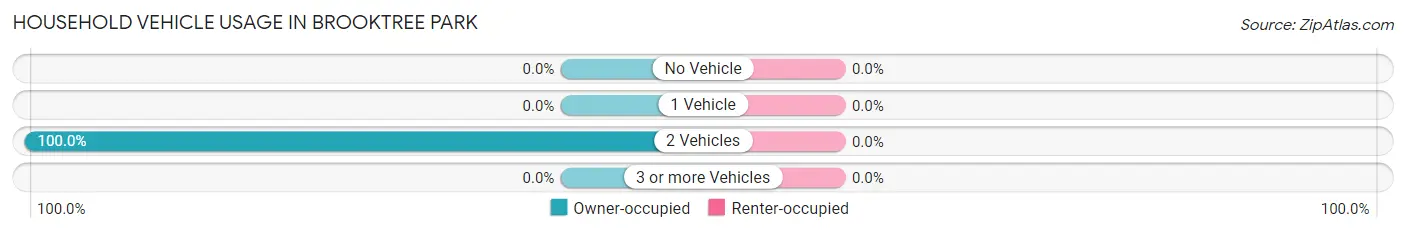
| Vehicles per Household | Owner-occupied | Renter-occupied |
| No Vehicle | 0 (0.0%) | 0 (0.0%) |
| 1 Vehicle | 0 (0.0%) | 0 (0.0%) |
| 2 Vehicles | 37 (100.0%) | 0 (0.0%) |
| 3 or more Vehicles | 0 (0.0%) | 0 (0.0%) |
| Total | 37 (100.0%) | 0 (0.0%) |
Real Estate & Mortgages in Brooktree Park
Real Estate and Mortgage Overview in Brooktree Park
| Characteristic | Without Mortgage | With Mortgage |
| Housing Units | 0 | 37 |
| Median Property Value | - | - |
| Median Household Income | - | - |
| Monthly Housing Costs | - | - |
| Real Estate Taxes | - | - |
Property Value by Mortgage Status in Brooktree Park
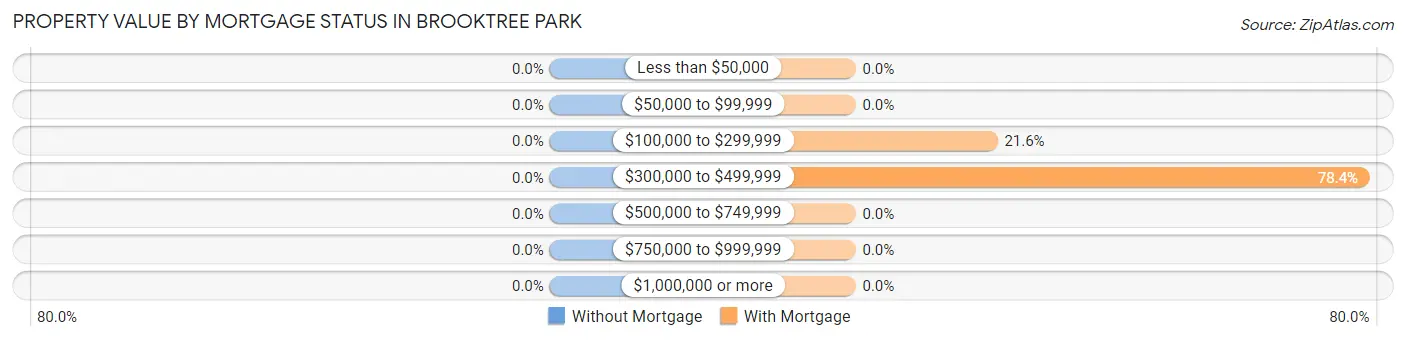
| Property Value | Without Mortgage | With Mortgage |
| Less than $50,000 | 0 (0.0%) | 0 (0.0%) |
| $50,000 to $99,999 | 0 (0.0%) | 0 (0.0%) |
| $100,000 to $299,999 | 0 (0.0%) | 8 (21.6%) |
| $300,000 to $499,999 | 0 (0.0%) | 29 (78.4%) |
| $500,000 to $749,999 | 0 (0.0%) | 0 (0.0%) |
| $750,000 to $999,999 | 0 (0.0%) | 0 (0.0%) |
| $1,000,000 or more | 0 (0.0%) | 0 (0.0%) |
| Total | 0 (0.0%) | 37 (100.0%) |
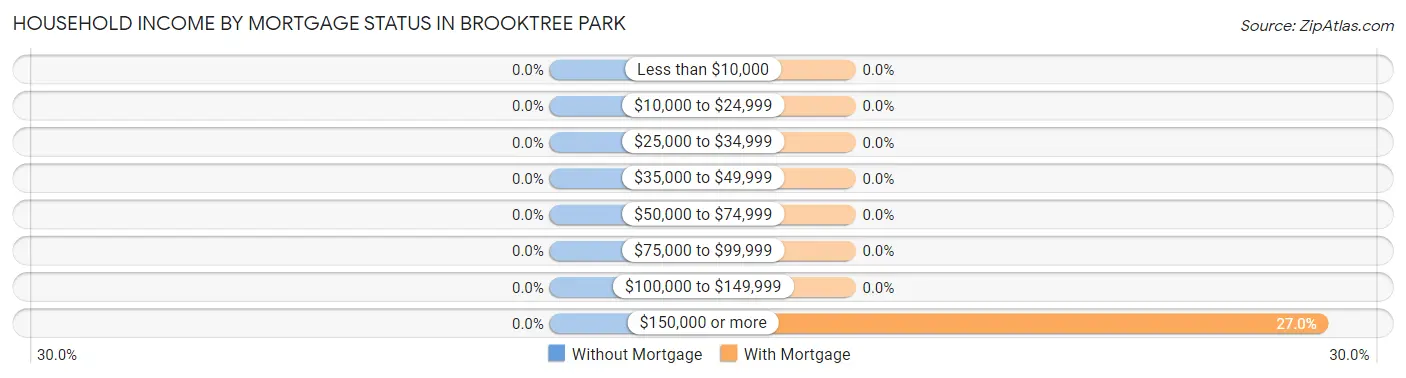
Household Income by Mortgage Status in Brooktree Park
| Household Income | Without Mortgage | With Mortgage |
| Less than $10,000 | 0 (0.0%) | 0 (0.0%) |
| $10,000 to $24,999 | 0 (0.0%) | 0 (0.0%) |
| $25,000 to $34,999 | 0 (0.0%) | 0 (0.0%) |
| $35,000 to $49,999 | 0 (0.0%) | 0 (0.0%) |
| $50,000 to $74,999 | 0 (0.0%) | 0 (0.0%) |
| $75,000 to $99,999 | 0 (0.0%) | 0 (0.0%) |
| $100,000 to $149,999 | 0 (0.0%) | 0 (0.0%) |
| $150,000 or more | 0 (0.0%) | 10 (27.0%) |
| Total | 0 (0.0%) | 37 (100.0%) |
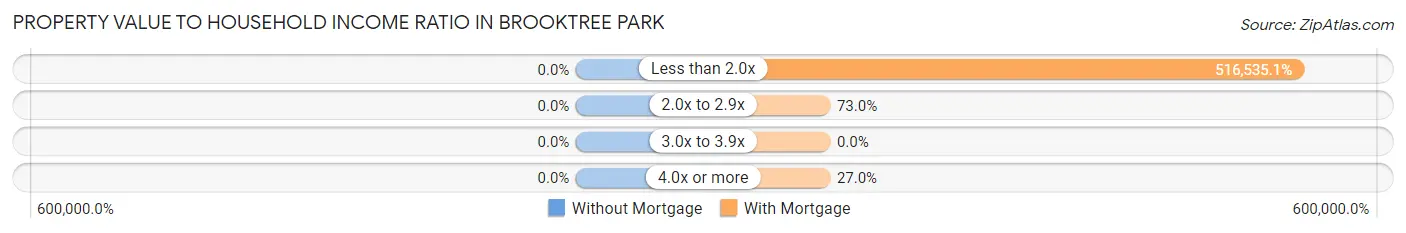
Property Value to Household Income Ratio in Brooktree Park
| Value-to-Income Ratio | Without Mortgage | With Mortgage |
| Less than 2.0x | 0 (0.0%) | 191,118 (516,535.1%) |
| 2.0x to 2.9x | 0 (0.0%) | 27 (73.0%) |
| 3.0x to 3.9x | 0 (0.0%) | 0 (0.0%) |
| 4.0x or more | 0 (0.0%) | 10 (27.0%) |
| Total | 0 (0.0%) | 37 (100.0%) |
Real Estate Taxes by Mortgage Status in Brooktree Park
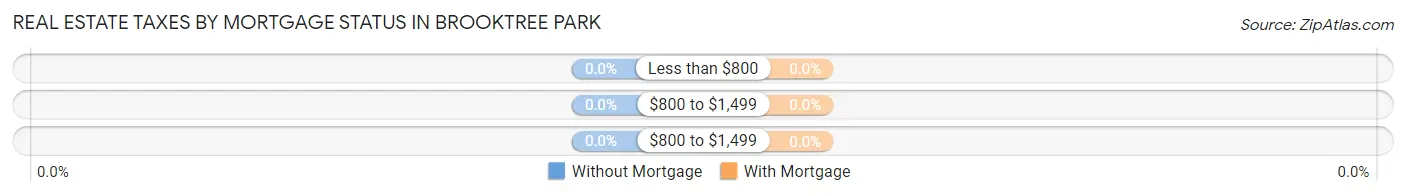
| Property Taxes | Without Mortgage | With Mortgage |
| Less than $800 | 0 (0.0%) | 0 (0.0%) |
| $800 to $1,499 | 0 (0.0%) | 0 (0.0%) |
| $800 to $1,499 | 0 (0.0%) | 0 (0.0%) |
| Total | 0 (0.0%) | 37 (100.0%) |
Health & Disability in Brooktree Park
Health Insurance Coverage by Age in Brooktree Park
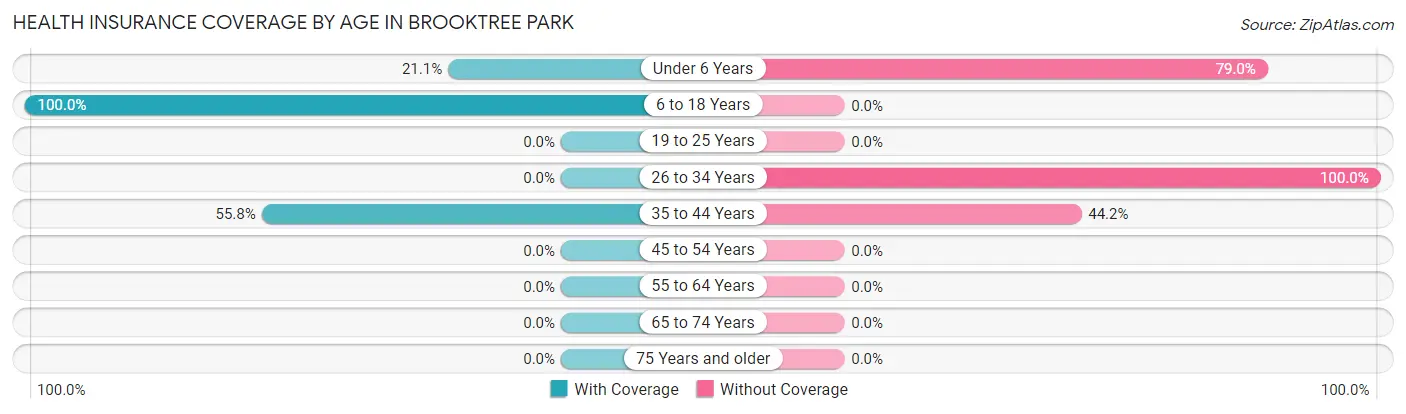
| Age Bracket | With Coverage | Without Coverage |
| Under 6 Years | 16 (21.0%) | 60 (78.9%) |
| 6 to 18 Years | 8 (100.0%) | 0 (0.0%) |
| 19 to 25 Years | 0 (0.0%) | 0 (0.0%) |
| 26 to 34 Years | 0 (0.0%) | 19 (100.0%) |
| 35 to 44 Years | 24 (55.8%) | 19 (44.2%) |
| 45 to 54 Years | 0 (0.0%) | 0 (0.0%) |
| 55 to 64 Years | 0 (0.0%) | 0 (0.0%) |
| 65 to 74 Years | 0 (0.0%) | 0 (0.0%) |
| 75 Years and older | 0 (0.0%) | 0 (0.0%) |
| Total | 48 (32.9%) | 98 (67.1%) |
Health Insurance Coverage by Citizenship Status in Brooktree Park
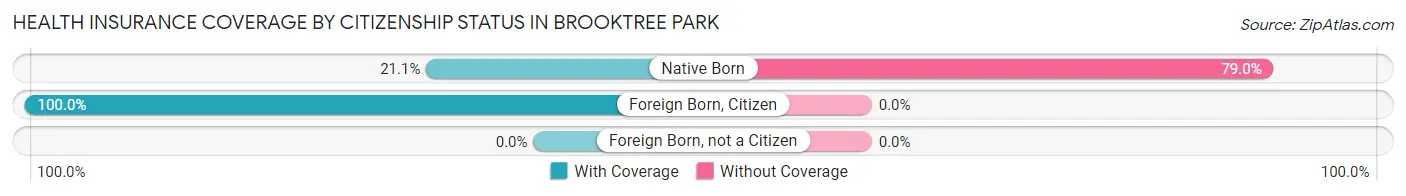
| Citizenship Status | With Coverage | Without Coverage |
| Native Born | 16 (21.0%) | 60 (78.9%) |
| Foreign Born, Citizen | 8 (100.0%) | 0 (0.0%) |
| Foreign Born, not a Citizen | 0 (0.0%) | 0 (0.0%) |
Health Insurance Coverage by Household Income in Brooktree Park
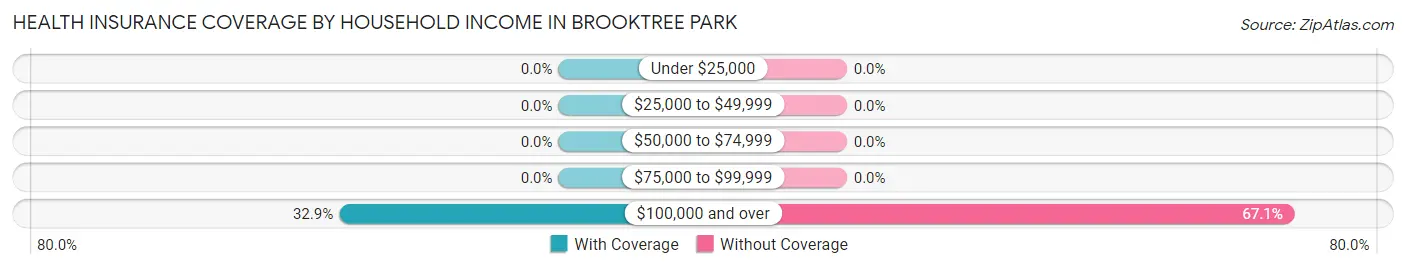
| Household Income | With Coverage | Without Coverage |
| Under $25,000 | 0 (0.0%) | 0 (0.0%) |
| $25,000 to $49,999 | 0 (0.0%) | 0 (0.0%) |
| $50,000 to $74,999 | 0 (0.0%) | 0 (0.0%) |
| $75,000 to $99,999 | 0 (0.0%) | 0 (0.0%) |
| $100,000 and over | 48 (32.9%) | 98 (67.1%) |
Public vs Private Health Insurance Coverage by Age in Brooktree Park
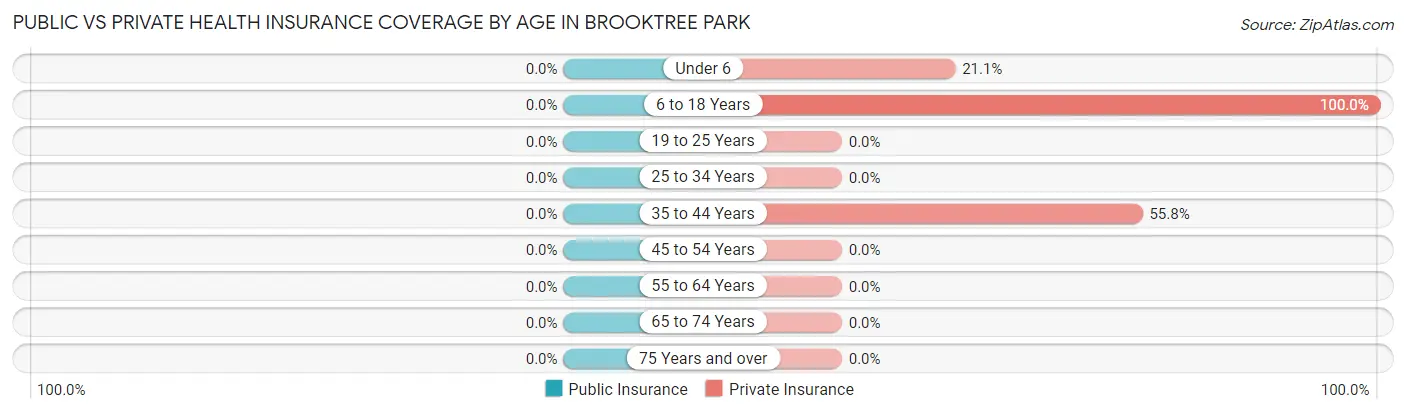
| Age Bracket | Public Insurance | Private Insurance |
| Under 6 | 0 (0.0%) | 16 (21.0%) |
| 6 to 18 Years | 0 (0.0%) | 8 (100.0%) |
| 19 to 25 Years | 0 (0.0%) | 0 (0.0%) |
| 25 to 34 Years | 0 (0.0%) | 0 (0.0%) |
| 35 to 44 Years | 0 (0.0%) | 24 (55.8%) |
| 45 to 54 Years | 0 (0.0%) | 0 (0.0%) |
| 55 to 64 Years | 0 (0.0%) | 0 (0.0%) |
| 65 to 74 Years | 0 (0.0%) | 0 (0.0%) |
| 75 Years and over | 0 (0.0%) | 0 (0.0%) |
| Total | 0 (0.0%) | 48 (32.9%) |
Disability Status by Sex by Age in Brooktree Park
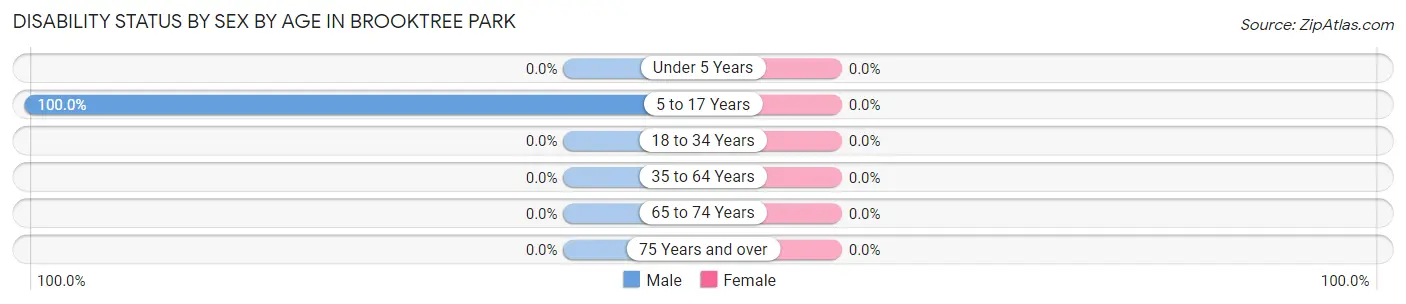
| Age Bracket | Male | Female |
| Under 5 Years | 0 (0.0%) | 0 (0.0%) |
| 5 to 17 Years | 8 (100.0%) | 0 (0.0%) |
| 18 to 34 Years | 0 (0.0%) | 0 (0.0%) |
| 35 to 64 Years | 0 (0.0%) | 0 (0.0%) |
| 65 to 74 Years | 0 (0.0%) | 0 (0.0%) |
| 75 Years and over | 0 (0.0%) | 0 (0.0%) |
Disability Class by Sex by Age in Brooktree Park
Disability Class: Hearing Difficulty
| Age Bracket | Male | Female |
| Under 5 Years | 0 (0.0%) | 0 (0.0%) |
| 5 to 17 Years | 0 (0.0%) | 0 (0.0%) |
| 18 to 34 Years | 0 (0.0%) | 0 (0.0%) |
| 35 to 64 Years | 0 (0.0%) | 0 (0.0%) |
| 65 to 74 Years | 0 (0.0%) | 0 (0.0%) |
| 75 Years and over | 0 (0.0%) | 0 (0.0%) |
Disability Class: Vision Difficulty
| Age Bracket | Male | Female |
| Under 5 Years | 0 (0.0%) | 0 (0.0%) |
| 5 to 17 Years | 0 (0.0%) | 0 (0.0%) |
| 18 to 34 Years | 0 (0.0%) | 0 (0.0%) |
| 35 to 64 Years | 0 (0.0%) | 0 (0.0%) |
| 65 to 74 Years | 0 (0.0%) | 0 (0.0%) |
| 75 Years and over | 0 (0.0%) | 0 (0.0%) |
Disability Class: Cognitive Difficulty
| Age Bracket | Male | Female |
| 5 to 17 Years | 8 (100.0%) | 0 (0.0%) |
| 18 to 34 Years | 0 (0.0%) | 0 (0.0%) |
| 35 to 64 Years | 0 (0.0%) | 0 (0.0%) |
| 65 to 74 Years | 0 (0.0%) | 0 (0.0%) |
| 75 Years and over | 0 (0.0%) | 0 (0.0%) |
Disability Class: Ambulatory Difficulty
| Age Bracket | Male | Female |
| 5 to 17 Years | 0 (0.0%) | 0 (0.0%) |
| 18 to 34 Years | 0 (0.0%) | 0 (0.0%) |
| 35 to 64 Years | 0 (0.0%) | 0 (0.0%) |
| 65 to 74 Years | 0 (0.0%) | 0 (0.0%) |
| 75 Years and over | 0 (0.0%) | 0 (0.0%) |
Disability Class: Self-Care Difficulty
| Age Bracket | Male | Female |
| 5 to 17 Years | 0 (0.0%) | 0 (0.0%) |
| 18 to 34 Years | 0 (0.0%) | 0 (0.0%) |
| 35 to 64 Years | 0 (0.0%) | 0 (0.0%) |
| 65 to 74 Years | 0 (0.0%) | 0 (0.0%) |
| 75 Years and over | 0 (0.0%) | 0 (0.0%) |
Technology Access in Brooktree Park
Computing Device Access in Brooktree Park
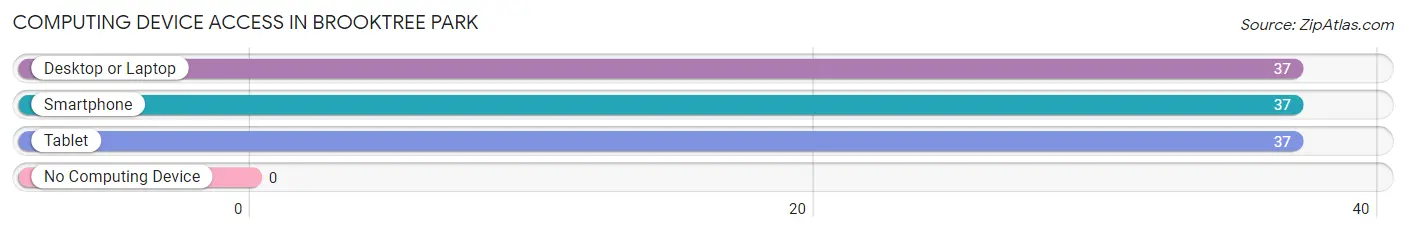
| Device Type | # Households | % Households |
| Desktop or Laptop | 37 | 100.0% |
| Smartphone | 37 | 100.0% |
| Tablet | 37 | 100.0% |
| No Computing Device | 0 | 0.0% |
| Total | 37 | 100.0% |
Internet Access in Brooktree Park
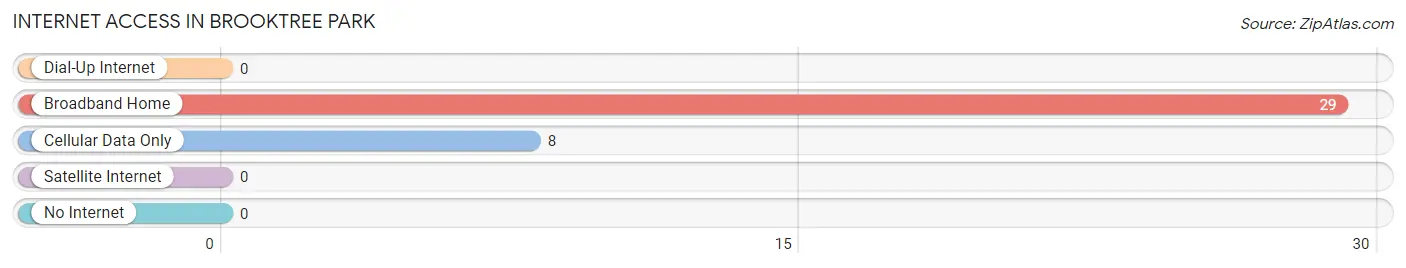
| Internet Type | # Households | % Households |
| Dial-Up Internet | 0 | 0.0% |
| Broadband Home | 29 | 78.4% |
| Cellular Data Only | 8 | 21.6% |
| Satellite Internet | 0 | 0.0% |
| No Internet | 0 | 0.0% |
| Total | 37 | 100.0% |
Brooktree Park Summary
Brooktree Park is a small city located in the state of North Dakota. It is situated in the southeastern corner of the state, near the border with Minnesota. The city has a population of approximately 1,500 people and is part of the Grand Forks metropolitan area.
History
The area that is now Brooktree Park was first settled in the late 1800s by Scandinavian immigrants. The city was officially incorporated in 1909 and was named after a nearby park. The city was originally a farming community, but in the 1950s, the city began to experience a population boom due to the growth of the nearby Grand Forks Air Force Base. This growth continued until the base closed in the late 1990s.
Geography
Brooktree Park is located in the southeastern corner of North Dakota, near the border with Minnesota. The city is situated on the Red River of the North, which forms the border between the two states. The city is located in the Red River Valley, which is a flat, fertile region of the state. The city is surrounded by rolling hills and farmland.
Economy
The economy of Brooktree Park is largely based on agriculture. The city is home to several large farms, which produce a variety of crops, including wheat, corn, and soybeans. The city also has a number of small businesses, including restaurants, retail stores, and service providers.
Demographics
As of the 2010 census, the population of Brooktree Park was 1,500. The racial makeup of the city was 97.3% White, 0.7% African American, 0.3% Native American, 0.3% Asian, and 1.3% from other races. The median household income was $45,000, and the median family income was $50,000. The per capita income was $20,000.
Conclusion
Brooktree Park is a small city located in the southeastern corner of North Dakota. The city has a population of approximately 1,500 people and is part of the Grand Forks metropolitan area. The economy of the city is largely based on agriculture, and the city is home to several large farms. The racial makeup of the city is predominantly White, with a small percentage of African American, Native American, and Asian residents. The median household income is $45,000, and the median family income is $50,000.
Common Questions
What is Per Capita Income in Brooktree Park?
Per Capita income in Brooktree Park is $43,396.
What is the Median Family Income in Brooktree Park?
Median Family Income in Brooktree Park is $191,118.
What is the Median Household income in Brooktree Park?
Median Household Income in Brooktree Park is $191,118.
What is Inequality or Gini Index in Brooktree Park?
Inequality or Gini Index in Brooktree Park is 0.09.
What is the Total Population of Brooktree Park?
Total Population of Brooktree Park is 156.
What is the Total Male Population of Brooktree Park?
Total Male Population of Brooktree Park is 66.
What is the Total Female Population of Brooktree Park?
Total Female Population of Brooktree Park is 90.
What is the Ratio of Males per 100 Females in Brooktree Park?
There are 73.33 Males per 100 Females in Brooktree Park.
What is the Ratio of Females per 100 Males in Brooktree Park?
There are 136.36 Females per 100 Males in Brooktree Park.
What is the Median Population Age in Brooktree Park?
Median Population Age in Brooktree Park is 17.3 Years.
What is the Average Family Size in Brooktree Park
Average Family Size in Brooktree Park is 4.2 People.
What is the Average Household Size in Brooktree Park
Average Household Size in Brooktree Park is 4.2 People.
How Large is the Labor Force in Brooktree Park?
There are 64 People in the Labor Forcein in Brooktree Park.
What is the Percentage of People in the Labor Force in Brooktree Park?
80.0% of People are in the Labor Force in Brooktree Park.