Stanford, MT Map & Demographics
Stanford Map
Stanford Overview
$49,310
PER CAPITA INCOME
$88,438
AVG FAMILY INCOME
$46,250
AVG HOUSEHOLD INCOME
0.66
INEQUALITY / GINI INDEX
229
TOTAL POPULATION
111
MALE POPULATION
118
FEMALE POPULATION
94.07
MALES / 100 FEMALES
106.31
FEMALES / 100 MALES
56.3
MEDIAN AGE
3.0
AVG FAMILY SIZE
1.8
AVG HOUSEHOLD SIZE
109
LABOR FORCE [ PEOPLE ]
54.0%
PERCENT IN LABOR FORCE
Stanford Zip Codes
Stanford Area Codes
Income in Stanford
Income Overview in Stanford
Per Capita Income in Stanford is $49,310, while median incomes of families and households are $88,438 and $46,250 respectively.
| Characteristic | Number | Measure |
| Per Capita Income | 229 | $49,310 |
| Median Family Income | 47 | $88,438 |
| Mean Family Income | 47 | $105,200 |
| Median Household Income | 126 | $46,250 |
| Mean Household Income | 126 | $87,850 |
| Income Deficit | 47 | $0 |
| Wage / Income Gap (%) | 229 | 0.00% |
| Wage / Income Gap ($) | 229 | 100.00¢ per $1 |
| Gini / Inequality Index | 229 | 0.66 |
Earnings by Sex in Stanford
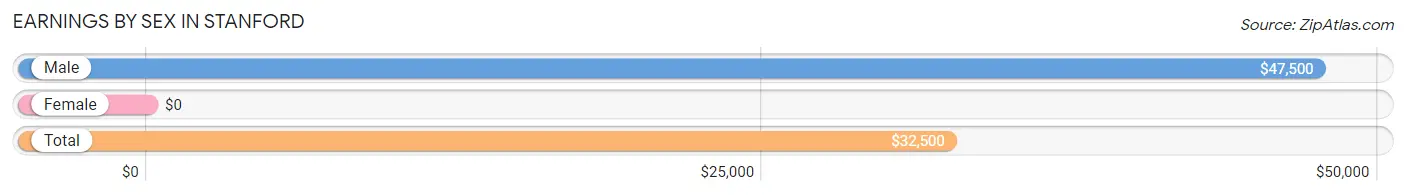
| Sex | Number | Average Earnings |
| Male | 44 (36.7%) | $47,500 |
| Female | 76 (63.3%) | $0 |
| Total | 120 (100.0%) | $32,500 |
Earnings by Sex by Income Bracket in Stanford
The most common earnings brackets in Stanford are $65,000 to $74,999 for men (9 | 20.4%) and $2,500 to $4,999 for women (15 | 19.7%).
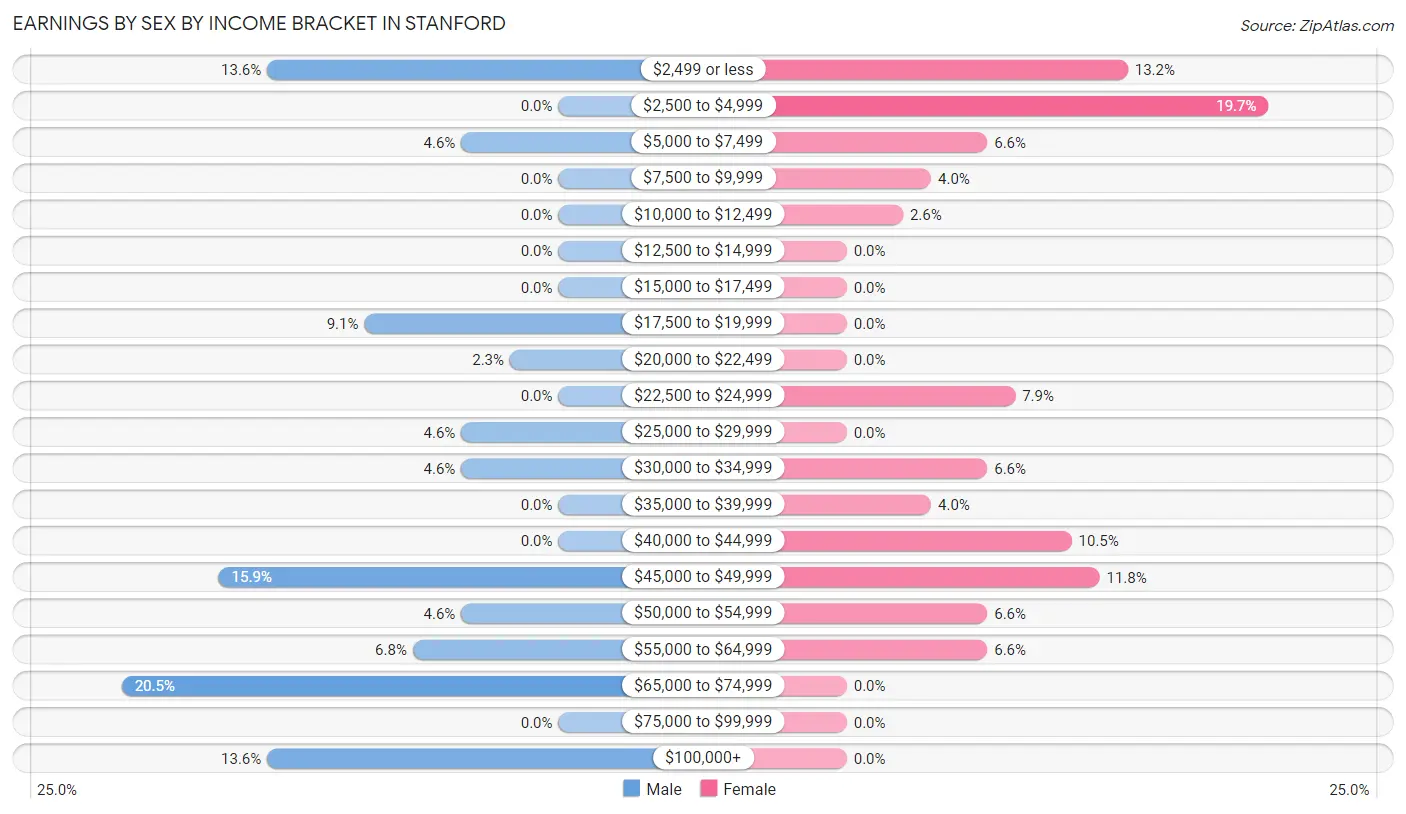
| Income | Male | Female |
| $2,499 or less | 6 (13.6%) | 10 (13.2%) |
| $2,500 to $4,999 | 0 (0.0%) | 15 (19.7%) |
| $5,000 to $7,499 | 2 (4.5%) | 5 (6.6%) |
| $7,500 to $9,999 | 0 (0.0%) | 3 (4.0%) |
| $10,000 to $12,499 | 0 (0.0%) | 2 (2.6%) |
| $12,500 to $14,999 | 0 (0.0%) | 0 (0.0%) |
| $15,000 to $17,499 | 0 (0.0%) | 0 (0.0%) |
| $17,500 to $19,999 | 4 (9.1%) | 0 (0.0%) |
| $20,000 to $22,499 | 1 (2.3%) | 0 (0.0%) |
| $22,500 to $24,999 | 0 (0.0%) | 6 (7.9%) |
| $25,000 to $29,999 | 2 (4.5%) | 0 (0.0%) |
| $30,000 to $34,999 | 2 (4.5%) | 5 (6.6%) |
| $35,000 to $39,999 | 0 (0.0%) | 3 (4.0%) |
| $40,000 to $44,999 | 0 (0.0%) | 8 (10.5%) |
| $45,000 to $49,999 | 7 (15.9%) | 9 (11.8%) |
| $50,000 to $54,999 | 2 (4.5%) | 5 (6.6%) |
| $55,000 to $64,999 | 3 (6.8%) | 5 (6.6%) |
| $65,000 to $74,999 | 9 (20.4%) | 0 (0.0%) |
| $75,000 to $99,999 | 0 (0.0%) | 0 (0.0%) |
| $100,000+ | 6 (13.6%) | 0 (0.0%) |
| Total | 44 (100.0%) | 76 (100.0%) |
Earnings by Sex by Educational Attainment in Stanford
Average earnings in Stanford are $50,625 for men and $32,500 for women, a difference of 35.8%. Men with an educational attainment of high school diploma enjoy the highest average annual earnings of $55,417, while those with high school diploma education earn the least with $55,417. Women with an educational attainment of bachelor's degree earn the most with the average annual earnings of $51,250, while those with college or associate's degree education have the smallest earnings of $47,917.
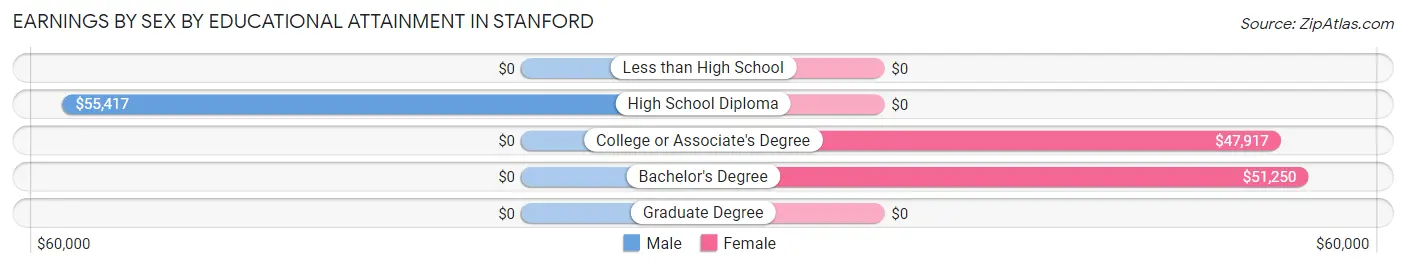
| Educational Attainment | Male Income | Female Income |
| Less than High School | - | - |
| High School Diploma | $55,417 | $0 |
| College or Associate's Degree | - | - |
| Bachelor's Degree | - | - |
| Graduate Degree | - | - |
| Total | $50,625 | $32,500 |
Family Income in Stanford
Family Income Brackets in Stanford
According to the Stanford family income data, there are 18 families falling into the $75,000 to $99,999 income range, which is the most common income bracket and makes up 38.3% of all families.
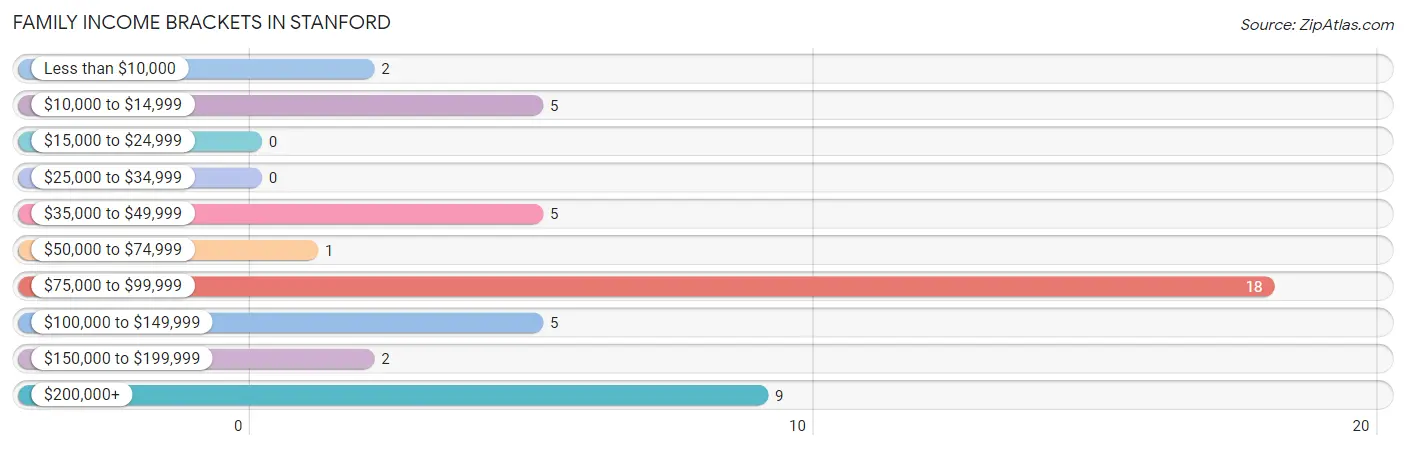
| Income Bracket | # Families | % Families |
| Less than $10,000 | 2 | 4.3% |
| $10,000 to $14,999 | 5 | 10.6% |
| $15,000 to $24,999 | 0 | 0.0% |
| $25,000 to $34,999 | 0 | 0.0% |
| $35,000 to $49,999 | 5 | 10.6% |
| $50,000 to $74,999 | 1 | 2.1% |
| $75,000 to $99,999 | 18 | 38.3% |
| $100,000 to $149,999 | 5 | 10.6% |
| $150,000 to $199,999 | 2 | 4.3% |
| $200,000+ | 9 | 19.1% |
Family Income by Famaliy Size in Stanford
3-person families (23 | 48.9%) account for the highest median family income in Stanford with $86,875 per family, while 3-person families (23 | 48.9%) have the highest median income of $28,958 per family member.
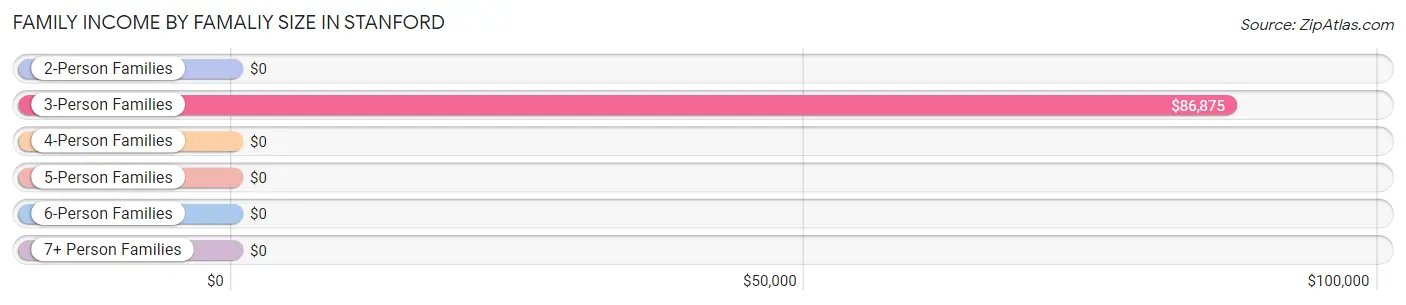
| Income Bracket | # Families | Median Income |
| 2-Person Families | 24 (51.1%) | $0 |
| 3-Person Families | 23 (48.9%) | $86,875 |
| 4-Person Families | 0 (0.0%) | $0 |
| 5-Person Families | 0 (0.0%) | $0 |
| 6-Person Families | 0 (0.0%) | $0 |
| 7+ Person Families | 0 (0.0%) | $0 |
| Total | 47 (100.0%) | $88,438 |
Family Income by Number of Earners in Stanford
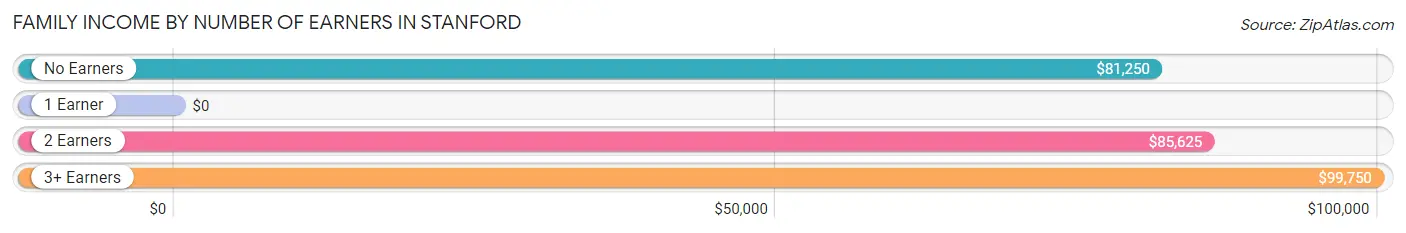
| Number of Earners | # Families | Median Income |
| No Earners | 7 (14.9%) | $81,250 |
| 1 Earner | 10 (21.3%) | $0 |
| 2 Earners | 21 (44.7%) | $85,625 |
| 3+ Earners | 9 (19.2%) | $99,750 |
| Total | 47 (100.0%) | $88,438 |
Household Income in Stanford
Household Income Brackets in Stanford
With 29 households falling in the category, the $10,000 to $14,999 income range is the most frequent in Stanford, accounting for 23.0% of all households.
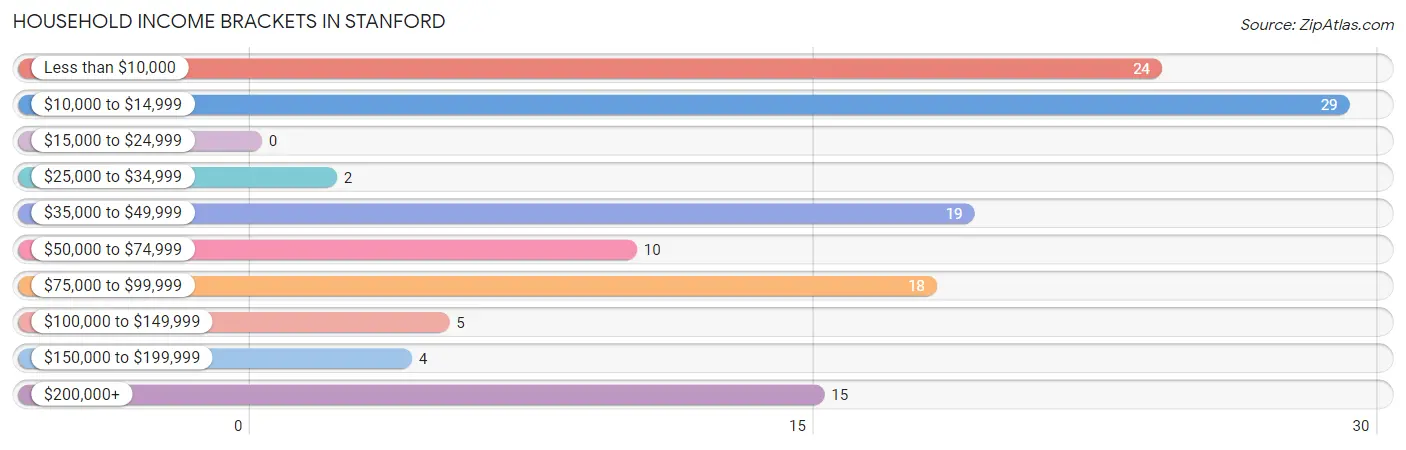
| Income Bracket | # Households | % Households |
| Less than $10,000 | 24 | 19.0% |
| $10,000 to $14,999 | 29 | 23.0% |
| $15,000 to $24,999 | 0 | 0.0% |
| $25,000 to $34,999 | 2 | 1.6% |
| $35,000 to $49,999 | 19 | 15.1% |
| $50,000 to $74,999 | 10 | 7.9% |
| $75,000 to $99,999 | 18 | 14.3% |
| $100,000 to $149,999 | 5 | 4.0% |
| $150,000 to $199,999 | 4 | 3.2% |
| $200,000+ | 15 | 11.9% |
Household Income by Householder Age in Stanford
The median household income in Stanford is $46,250, with the highest median household income of $48,333 found in the 45 to 64 years age bracket for the primary householder. A total of 66 households (52.4%) fall into this category. Meanwhile, the 15 to 24 years age bracket for the primary householder has the lowest median household income of $0, with 3 households (2.4%) in this group.
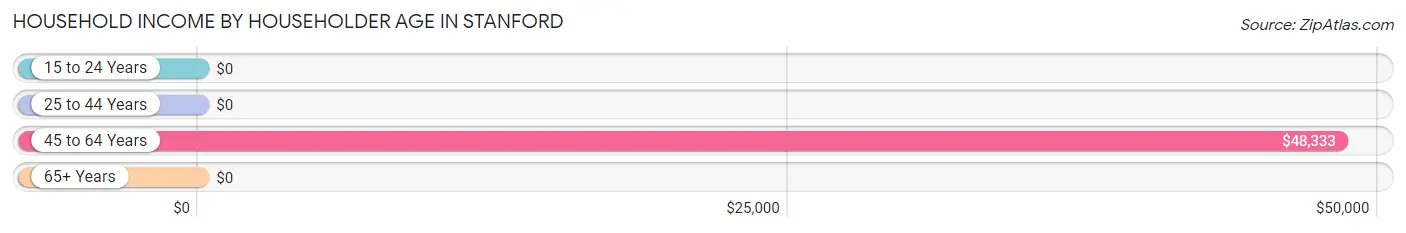
| Income Bracket | # Households | Median Income |
| 15 to 24 Years | 3 (2.4%) | $0 |
| 25 to 44 Years | 10 (7.9%) | $0 |
| 45 to 64 Years | 66 (52.4%) | $48,333 |
| 65+ Years | 47 (37.3%) | $0 |
| Total | 126 (100.0%) | $46,250 |
Poverty in Stanford
Income Below Poverty by Sex and Age in Stanford
With 38.7% poverty level for males and 36.4% for females among the residents of Stanford, 6 to 11 year old males and 35 to 44 year old females are the most vulnerable to poverty, with 19 males (90.5%) and 5 females (62.5%) in their respective age groups living below the poverty level.
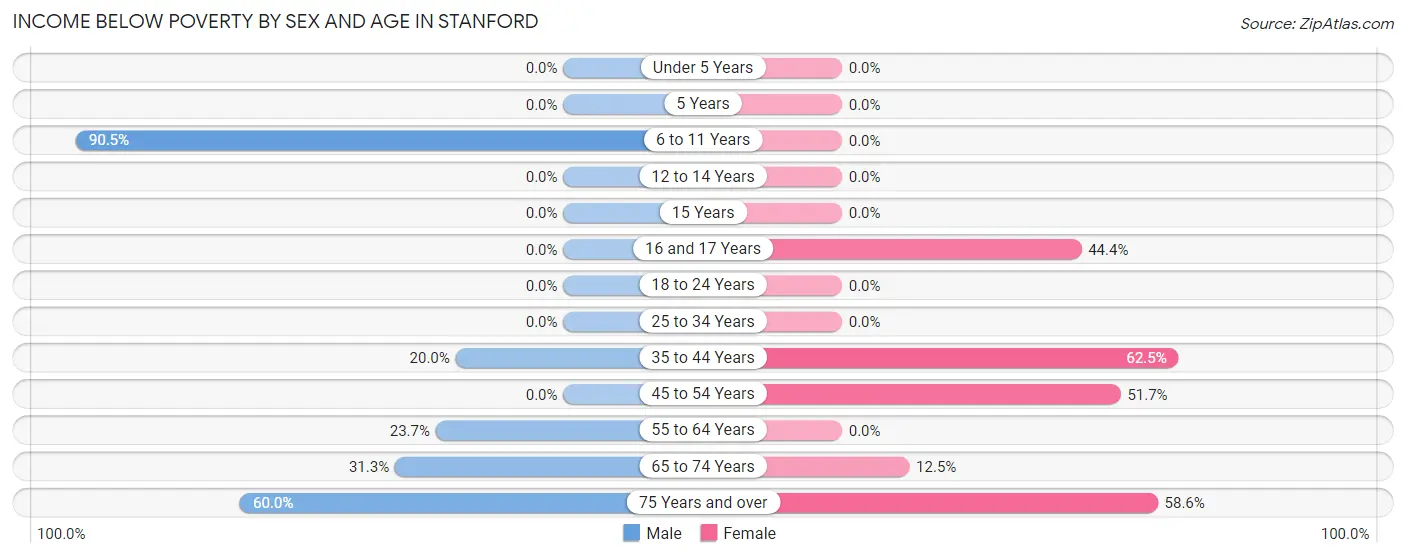
| Age Bracket | Male | Female |
| Under 5 Years | 0 (0.0%) | 0 (0.0%) |
| 5 Years | 0 (0.0%) | 0 (0.0%) |
| 6 to 11 Years | 19 (90.5%) | 0 (0.0%) |
| 12 to 14 Years | 0 (0.0%) | 0 (0.0%) |
| 15 Years | 0 (0.0%) | 0 (0.0%) |
| 16 and 17 Years | 0 (0.0%) | 4 (44.4%) |
| 18 to 24 Years | 0 (0.0%) | 0 (0.0%) |
| 25 to 34 Years | 0 (0.0%) | 0 (0.0%) |
| 35 to 44 Years | 1 (20.0%) | 5 (62.5%) |
| 45 to 54 Years | 0 (0.0%) | 15 (51.7%) |
| 55 to 64 Years | 9 (23.7%) | 0 (0.0%) |
| 65 to 74 Years | 5 (31.2%) | 2 (12.5%) |
| 75 Years and over | 9 (60.0%) | 17 (58.6%) |
| Total | 43 (38.7%) | 43 (36.4%) |
Income Above Poverty by Sex and Age in Stanford
According to the poverty statistics in Stanford, males aged 15 years and females aged under 5 years are the age groups that are most secure financially, with 100.0% of males and 100.0% of females in these age groups living above the poverty line.
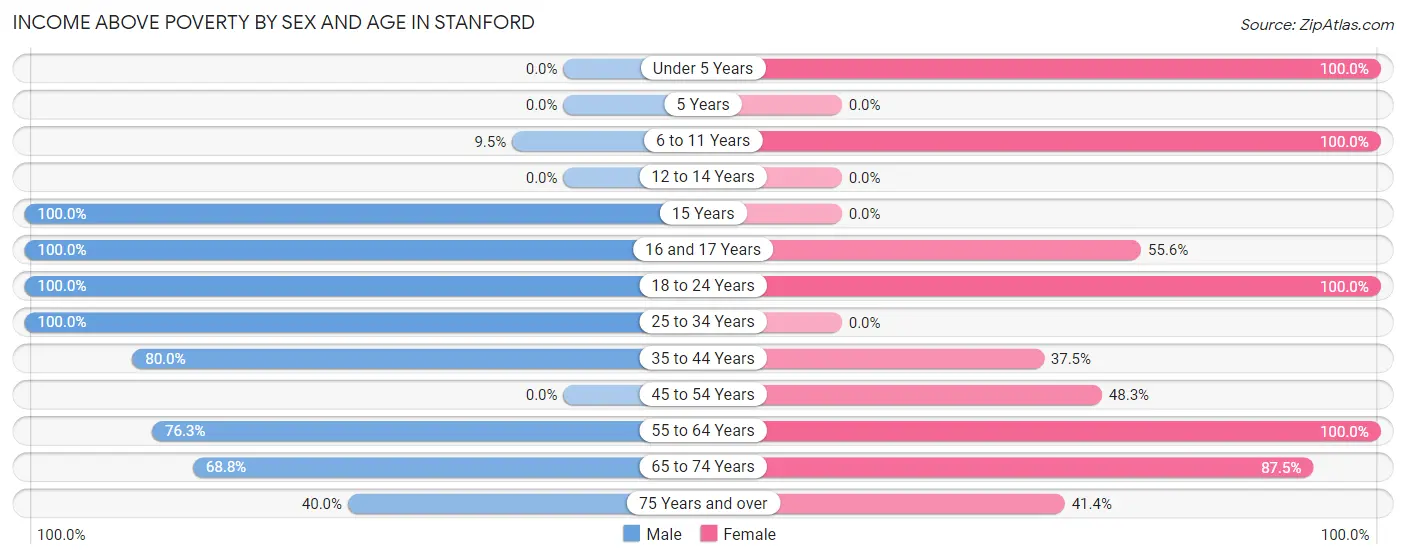
| Age Bracket | Male | Female |
| Under 5 Years | 0 (0.0%) | 2 (100.0%) |
| 5 Years | 0 (0.0%) | 0 (0.0%) |
| 6 to 11 Years | 2 (9.5%) | 1 (100.0%) |
| 12 to 14 Years | 0 (0.0%) | 0 (0.0%) |
| 15 Years | 3 (100.0%) | 0 (0.0%) |
| 16 and 17 Years | 6 (100.0%) | 5 (55.6%) |
| 18 to 24 Years | 5 (100.0%) | 3 (100.0%) |
| 25 to 34 Years | 2 (100.0%) | 0 (0.0%) |
| 35 to 44 Years | 4 (80.0%) | 3 (37.5%) |
| 45 to 54 Years | 0 (0.0%) | 14 (48.3%) |
| 55 to 64 Years | 29 (76.3%) | 21 (100.0%) |
| 65 to 74 Years | 11 (68.8%) | 14 (87.5%) |
| 75 Years and over | 6 (40.0%) | 12 (41.4%) |
| Total | 68 (61.3%) | 75 (63.6%) |
Income Below Poverty Among Married-Couple Families in Stanford
The poverty statistics for married-couple families in Stanford show that 5.4% or 2 of the total 37 families live below the poverty line. Families with no children have the highest poverty rate of 7.7%, comprising of 2 families. On the other hand, families with 1 or 2 children have the lowest poverty rate of 0.0%, which includes 0 families.
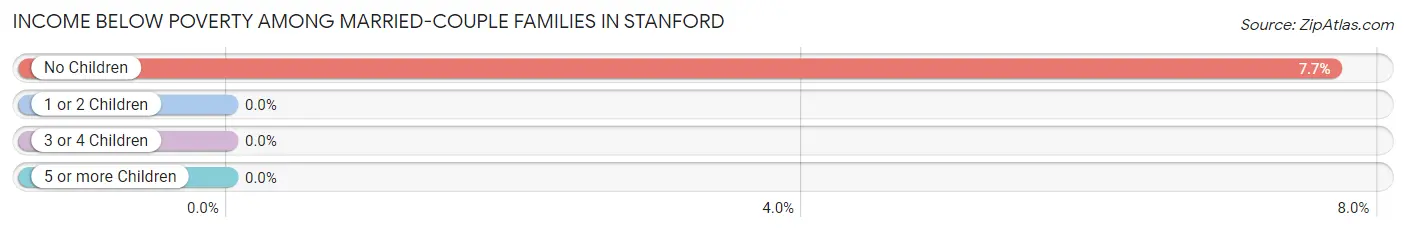
| Children | Above Poverty | Below Poverty |
| No Children | 24 (92.3%) | 2 (7.7%) |
| 1 or 2 Children | 11 (100.0%) | 0 (0.0%) |
| 3 or 4 Children | 0 (0.0%) | 0 (0.0%) |
| 5 or more Children | 0 (0.0%) | 0 (0.0%) |
| Total | 35 (94.6%) | 2 (5.4%) |
Income Below Poverty Among Single-Parent Households in Stanford
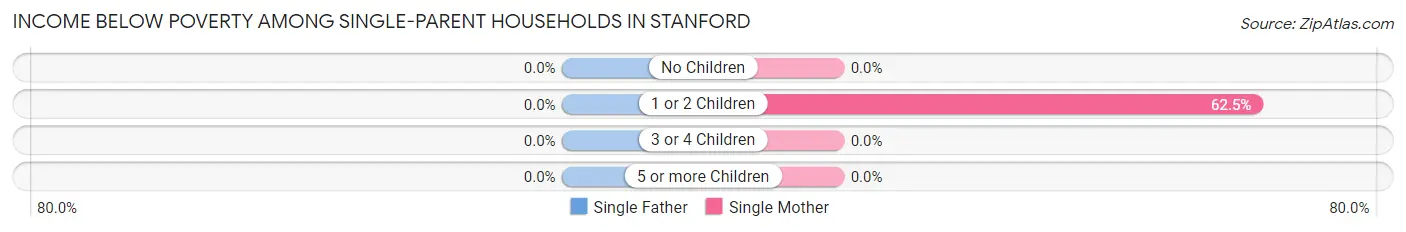
| Children | Single Father | Single Mother |
| No Children | 0 (0.0%) | 0 (0.0%) |
| 1 or 2 Children | 0 (0.0%) | 5 (62.5%) |
| 3 or 4 Children | 0 (0.0%) | 0 (0.0%) |
| 5 or more Children | 0 (0.0%) | 0 (0.0%) |
| Total | 0 (0.0%) | 5 (62.5%) |
Income Below Poverty Among Married-Couple vs Single-Parent Households in Stanford
The poverty data for Stanford shows that 2 of the married-couple family households (5.4%) and 5 of the single-parent households (50.0%) are living below the poverty level. Within the married-couple family households, those with no children have the highest poverty rate, with 2 households (7.7%) falling below the poverty line. Among the single-parent households, those with 1 or 2 children have the highest poverty rate, with 5 household (62.5%) living below poverty.
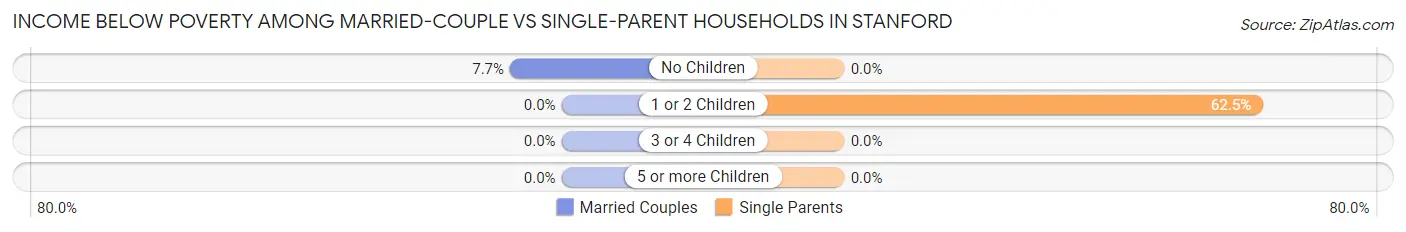
| Children | Married-Couple Families | Single-Parent Households |
| No Children | 2 (7.7%) | 0 (0.0%) |
| 1 or 2 Children | 0 (0.0%) | 5 (62.5%) |
| 3 or 4 Children | 0 (0.0%) | 0 (0.0%) |
| 5 or more Children | 0 (0.0%) | 0 (0.0%) |
| Total | 2 (5.4%) | 5 (50.0%) |
Race in Stanford
The most populous races in Stanford are White / Caucasian (204 | 89.1%), Hispanic or Latino (23 | 10.0%), and Native / Alaskan (19 | 8.3%).
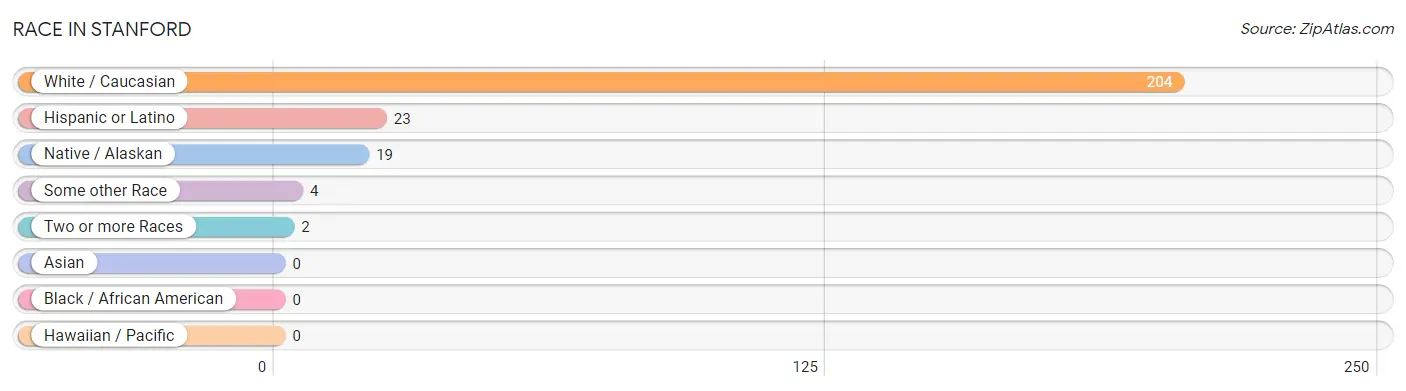
| Race | # Population | % Population |
| Asian | 0 | 0.0% |
| Black / African American | 0 | 0.0% |
| Hawaiian / Pacific | 0 | 0.0% |
| Hispanic or Latino | 23 | 10.0% |
| Native / Alaskan | 19 | 8.3% |
| White / Caucasian | 204 | 89.1% |
| Two or more Races | 2 | 0.9% |
| Some other Race | 4 | 1.8% |
| Total | 229 | 100.0% |
Ancestry in Stanford
The most populous ancestries reported in Stanford are German (69 | 30.1%), Irish (57 | 24.9%), English (46 | 20.1%), American (29 | 12.7%), and Mexican (23 | 10.0%), together accounting for 97.8% of all Stanford residents.
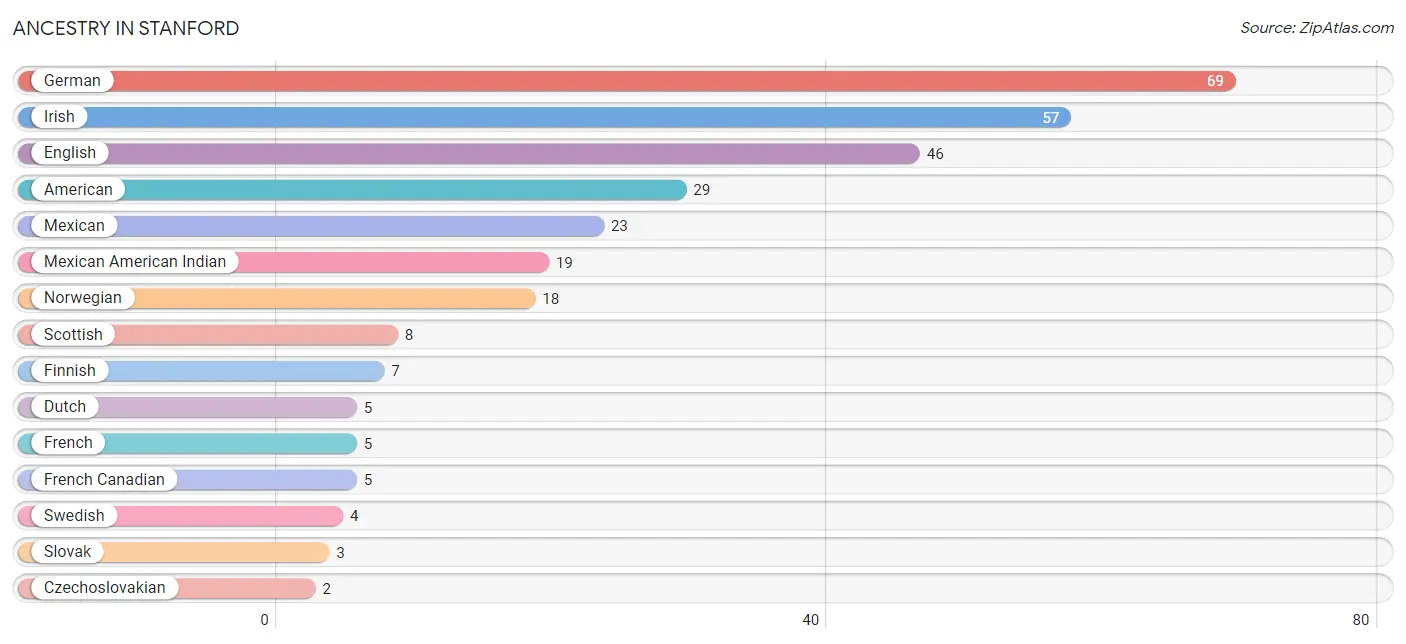
| Ancestry | # Population | % Population |
| American | 29 | 12.7% |
| Armenian | 1 | 0.4% |
| Czechoslovakian | 2 | 0.9% |
| Dutch | 5 | 2.2% |
| English | 46 | 20.1% |
| Finnish | 7 | 3.1% |
| French | 5 | 2.2% |
| French Canadian | 5 | 2.2% |
| German | 69 | 30.1% |
| Irish | 57 | 24.9% |
| Mexican | 23 | 10.0% |
| Mexican American Indian | 19 | 8.3% |
| New Zealander | 1 | 0.4% |
| Norwegian | 18 | 7.9% |
| Polish | 2 | 0.9% |
| Scottish | 8 | 3.5% |
| Slovak | 3 | 1.3% |
| Swedish | 4 | 1.8% |
| Welsh | 2 | 0.9% | View All 19 Rows |
Immigrants in Stanford
The most numerous immigrant groups reported in Stanford came from Central America (4 | 1.8%), Latin America (4 | 1.8%), and Mexico (4 | 1.8%), together accounting for 5.3% of all Stanford residents.
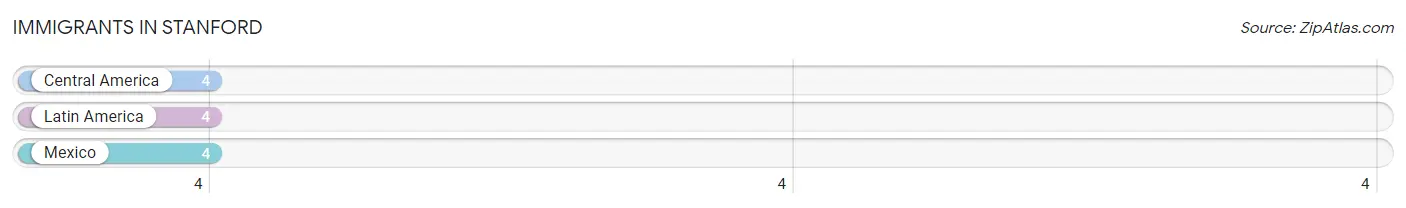
| Immigration Origin | # Population | % Population |
| Central America | 4 | 1.8% |
| Latin America | 4 | 1.8% |
| Mexico | 4 | 1.8% | View All 3 Rows |
Sex and Age in Stanford
Sex and Age in Stanford
The most populous age groups in Stanford are 60 to 64 Years (23 | 20.7%) for men and 45 to 49 Years (23 | 19.5%) for women.
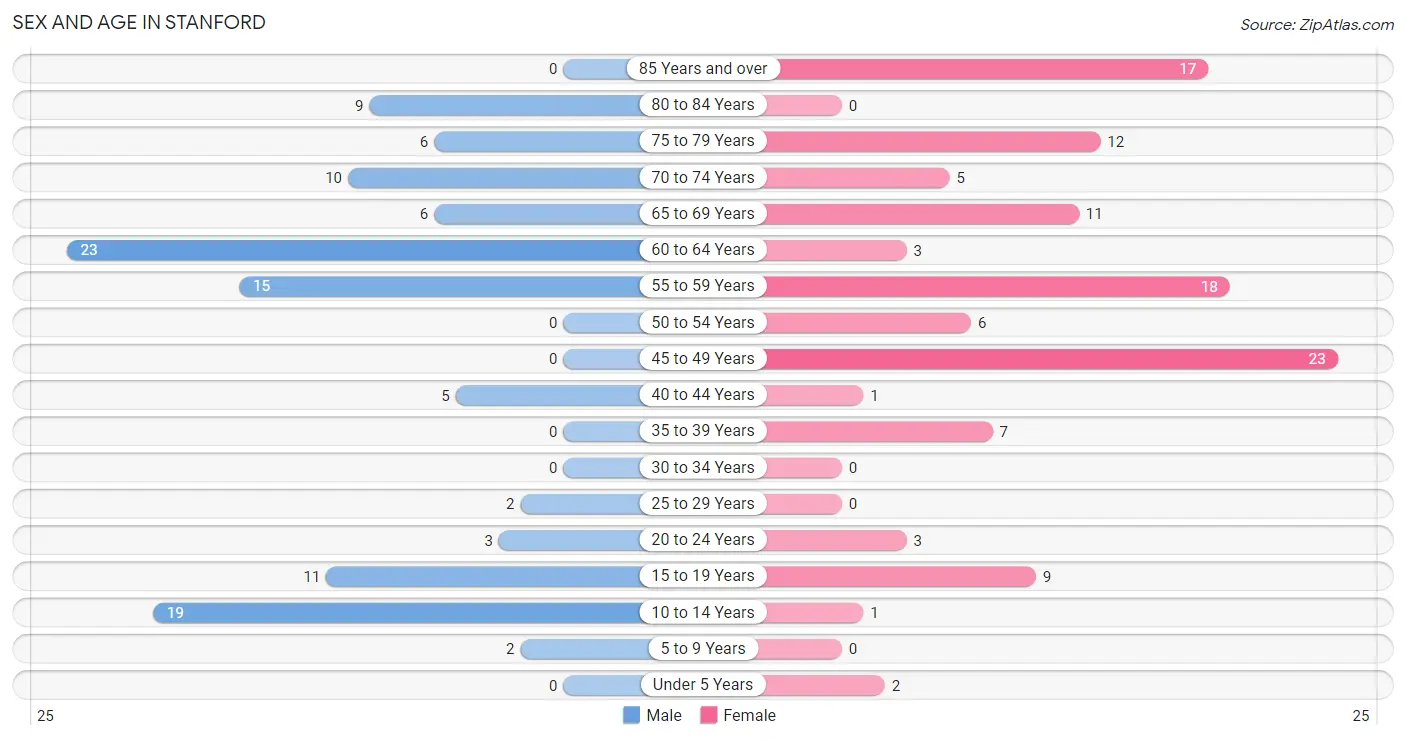
| Age Bracket | Male | Female |
| Under 5 Years | 0 (0.0%) | 2 (1.7%) |
| 5 to 9 Years | 2 (1.8%) | 0 (0.0%) |
| 10 to 14 Years | 19 (17.1%) | 1 (0.9%) |
| 15 to 19 Years | 11 (9.9%) | 9 (7.6%) |
| 20 to 24 Years | 3 (2.7%) | 3 (2.5%) |
| 25 to 29 Years | 2 (1.8%) | 0 (0.0%) |
| 30 to 34 Years | 0 (0.0%) | 0 (0.0%) |
| 35 to 39 Years | 0 (0.0%) | 7 (5.9%) |
| 40 to 44 Years | 5 (4.5%) | 1 (0.9%) |
| 45 to 49 Years | 0 (0.0%) | 23 (19.5%) |
| 50 to 54 Years | 0 (0.0%) | 6 (5.1%) |
| 55 to 59 Years | 15 (13.5%) | 18 (15.2%) |
| 60 to 64 Years | 23 (20.7%) | 3 (2.5%) |
| 65 to 69 Years | 6 (5.4%) | 11 (9.3%) |
| 70 to 74 Years | 10 (9.0%) | 5 (4.2%) |
| 75 to 79 Years | 6 (5.4%) | 12 (10.2%) |
| 80 to 84 Years | 9 (8.1%) | 0 (0.0%) |
| 85 Years and over | 0 (0.0%) | 17 (14.4%) |
| Total | 111 (100.0%) | 118 (100.0%) |
Families and Households in Stanford
Median Family Size in Stanford
The median family size in Stanford is 2.96 persons per family, with single female/mother families (8 | 17.0%) accounting for the largest median family size of 5 persons per family. On the other hand, married-couple families (37 | 78.7%) represent the smallest median family size with 2.43 persons per family.
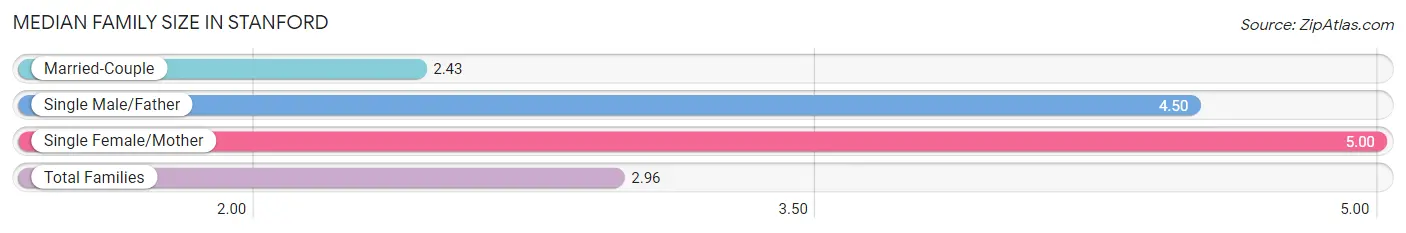
| Family Type | # Families | Family Size |
| Married-Couple | 37 (78.7%) | 2.43 |
| Single Male/Father | 2 (4.3%) | 4.50 |
| Single Female/Mother | 8 (17.0%) | 5.00 |
| Total Families | 47 (100.0%) | 2.96 |
Median Household Size in Stanford
The median household size in Stanford is 1.82 persons per household, with single female/mother households (8 | 6.4%) accounting for the largest median household size of 5.13 persons per household. non-family households (79 | 62.7%) represent the smallest median household size with 1.13 persons per household.
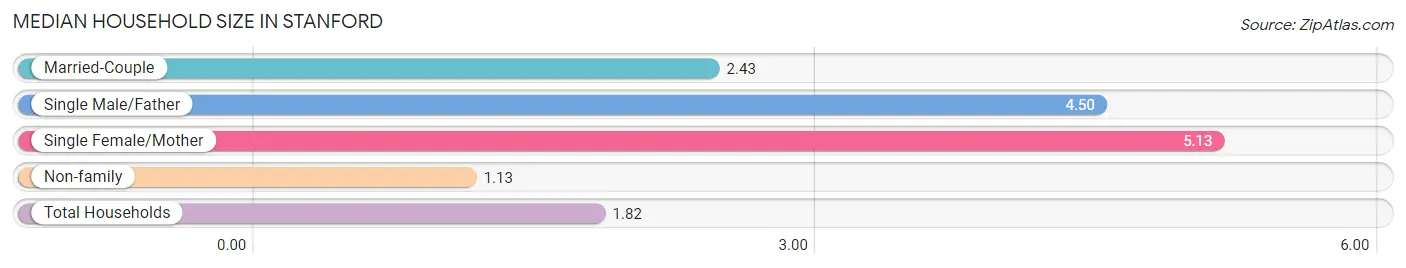
| Household Type | # Households | Household Size |
| Married-Couple | 37 (29.4%) | 2.43 |
| Single Male/Father | 2 (1.6%) | 4.50 |
| Single Female/Mother | 8 (6.4%) | 5.13 |
| Non-family | 79 (62.7%) | 1.13 |
| Total Households | 126 (100.0%) | 1.82 |
Household Size by Marriage Status in Stanford
Out of a total of 126 households in Stanford, 47 (37.3%) are family households, while 79 (62.7%) are nonfamily households. The most numerous type of family households are 2-person households, comprising 24, and the most common type of nonfamily households are 1-person households, comprising 67.
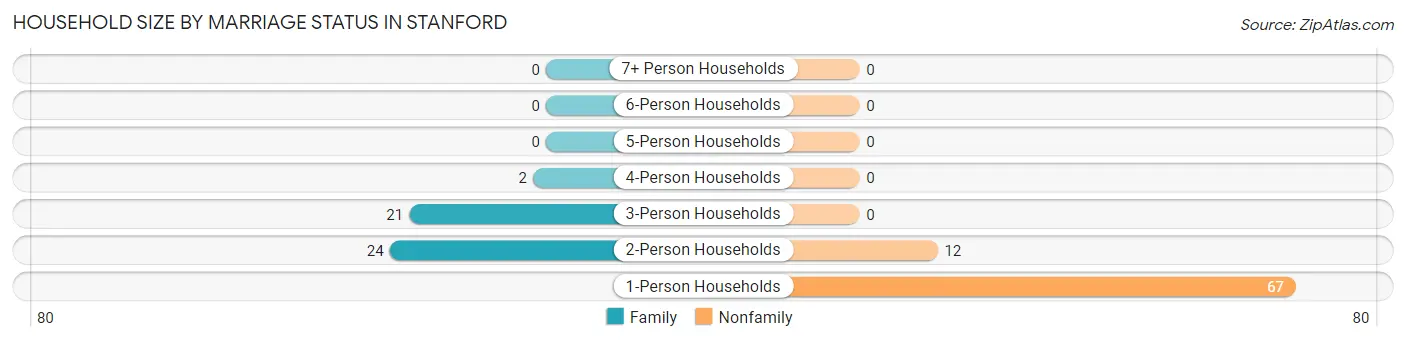
| Household Size | Family Households | Nonfamily Households |
| 1-Person Households | - | 67 (53.2%) |
| 2-Person Households | 24 (19.1%) | 12 (9.5%) |
| 3-Person Households | 21 (16.7%) | 0 (0.0%) |
| 4-Person Households | 2 (1.6%) | 0 (0.0%) |
| 5-Person Households | 0 (0.0%) | 0 (0.0%) |
| 6-Person Households | 0 (0.0%) | 0 (0.0%) |
| 7+ Person Households | 0 (0.0%) | 0 (0.0%) |
| Total | 47 (37.3%) | 79 (62.7%) |
Female Fertility in Stanford
Fertility by Age in Stanford
Average fertility rate in Stanford is 47.0 births per 1,000 women. Women in the age bracket of 20 to 34 years have the highest fertility rate with 667.0 births per 1,000 women. Women in the age bracket of 20 to 34 years acount for 100.0% of all women with births.
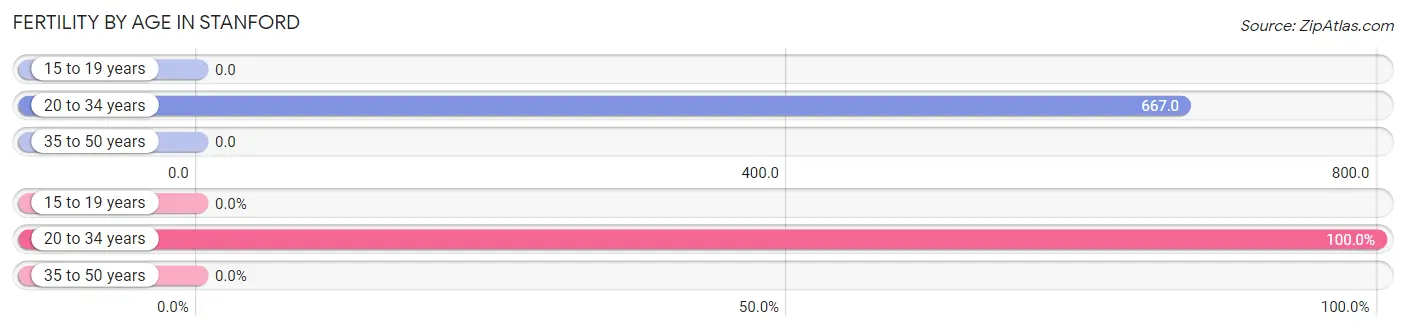
| Age Bracket | Women with Births | Births / 1,000 Women |
| 15 to 19 years | 0 (0.0%) | 0.0 |
| 20 to 34 years | 2 (100.0%) | 667.0 |
| 35 to 50 years | 0 (0.0%) | 0.0 |
| Total | 2 (100.0%) | 47.0 |
Fertility by Age by Marriage Status in Stanford
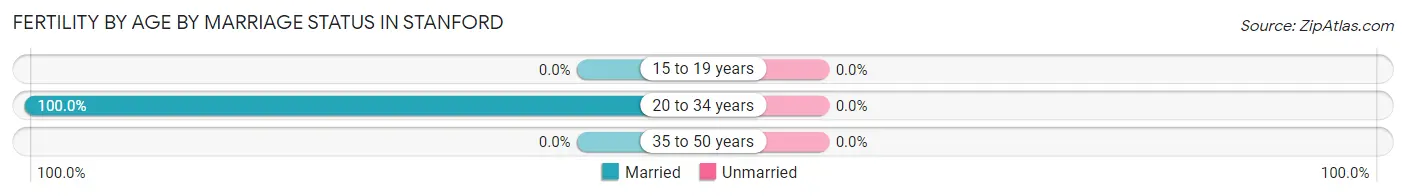
| Age Bracket | Married | Unmarried |
| 15 to 19 years | 0 (0.0%) | 0 (0.0%) |
| 20 to 34 years | 2 (100.0%) | 0 (0.0%) |
| 35 to 50 years | 0 (0.0%) | 0 (0.0%) |
| Total | 2 (100.0%) | 0 (0.0%) |
Fertility by Education in Stanford
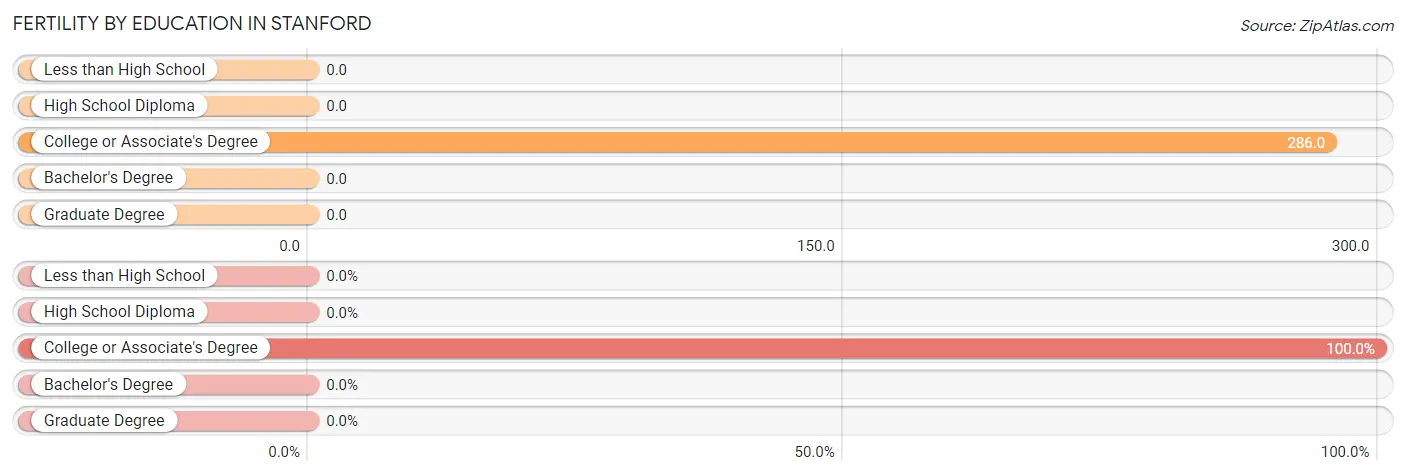
| Educational Attainment | Women with Births | Births / 1,000 Women |
| Less than High School | 0 (0.0%) | 0.0 |
| High School Diploma | 0 (0.0%) | 0.0 |
| College or Associate's Degree | 2 (100.0%) | 286.0 |
| Bachelor's Degree | 0 (0.0%) | 0.0 |
| Graduate Degree | 0 (0.0%) | 0.0 |
| Total | 2 (100.0%) | 47.0 |
Fertility by Education by Marriage Status in Stanford
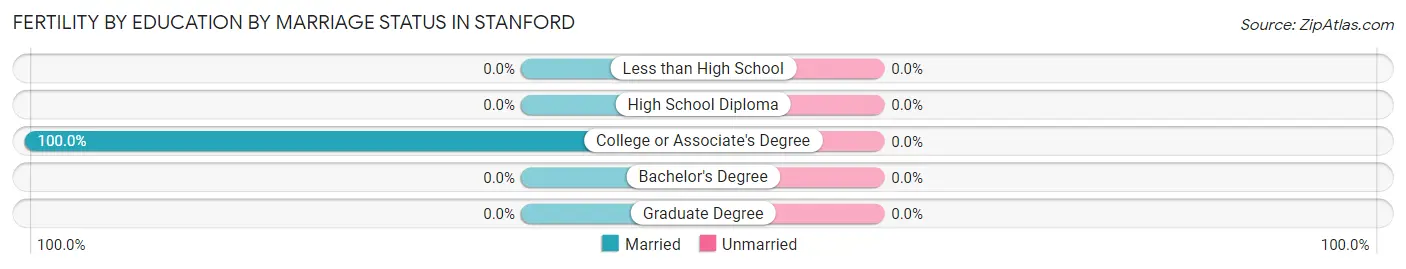
| Educational Attainment | Married | Unmarried |
| Less than High School | 0 (0.0%) | 0 (0.0%) |
| High School Diploma | 0 (0.0%) | 0 (0.0%) |
| College or Associate's Degree | 2 (100.0%) | 0 (0.0%) |
| Bachelor's Degree | 0 (0.0%) | 0 (0.0%) |
| Graduate Degree | 0 (0.0%) | 0 (0.0%) |
| Total | 2 (100.0%) | 0 (0.0%) |
Employment Characteristics in Stanford
Employment by Class of Employer in Stanford
Among the 109 employed individuals in Stanford, private company employees (67 | 61.5%), local government employees (20 | 18.3%), and self-employed (not incorporated) (10 | 9.2%) make up the most common classes of employment.
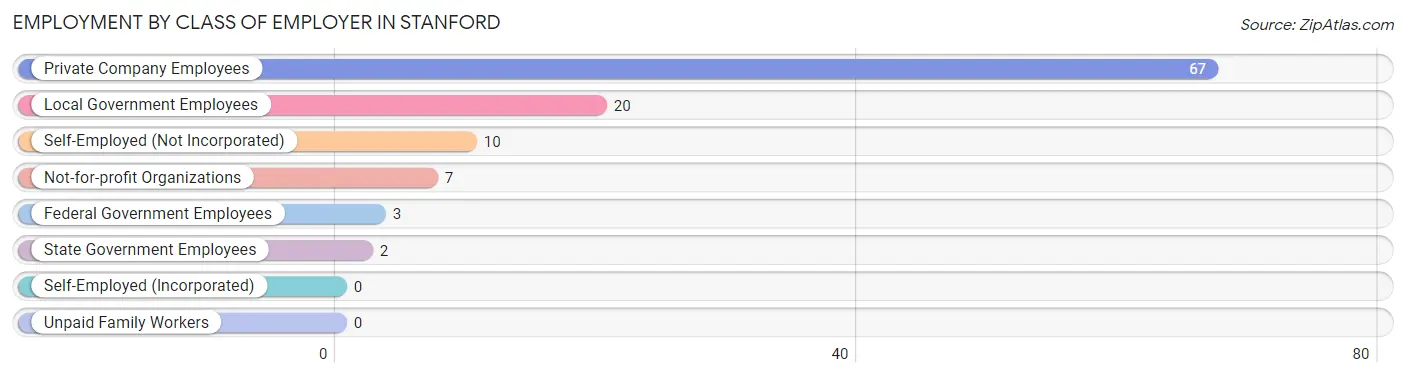
| Employer Class | # Employees | % Employees |
| Private Company Employees | 67 | 61.5% |
| Self-Employed (Incorporated) | 0 | 0.0% |
| Self-Employed (Not Incorporated) | 10 | 9.2% |
| Not-for-profit Organizations | 7 | 6.4% |
| Local Government Employees | 20 | 18.3% |
| State Government Employees | 2 | 1.8% |
| Federal Government Employees | 3 | 2.8% |
| Unpaid Family Workers | 0 | 0.0% |
| Total | 109 | 100.0% |
Employment Status by Age in Stanford
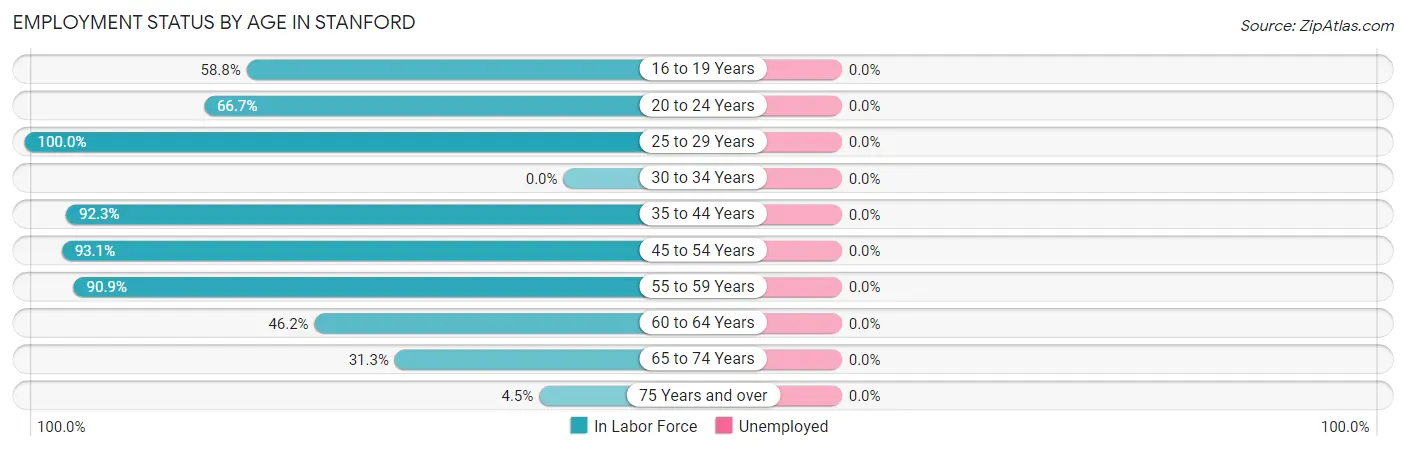
| Age Bracket | In Labor Force | Unemployed |
| 16 to 19 Years | 10 (58.8%) | 0 (0.0%) |
| 20 to 24 Years | 4 (66.7%) | 0 (0.0%) |
| 25 to 29 Years | 2 (100.0%) | 0 (0.0%) |
| 30 to 34 Years | 0 (0.0%) | 0 (0.0%) |
| 35 to 44 Years | 12 (92.3%) | 0 (0.0%) |
| 45 to 54 Years | 27 (93.1%) | 0 (0.0%) |
| 55 to 59 Years | 30 (90.9%) | 0 (0.0%) |
| 60 to 64 Years | 12 (46.2%) | 0 (0.0%) |
| 65 to 74 Years | 10 (31.3%) | 0 (0.0%) |
| 75 Years and over | 2 (4.5%) | 0 (0.0%) |
| Total | 109 (54.0%) | 0 (0.0%) |
Employment Status by Educational Attainment in Stanford
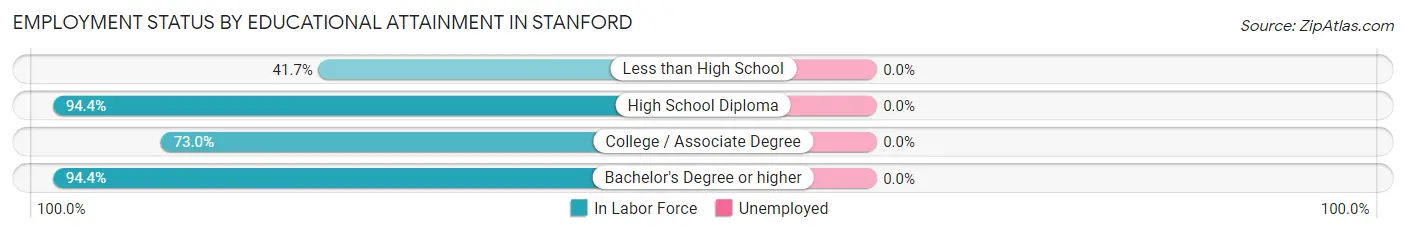
| Educational Attainment | In Labor Force | Unemployed |
| Less than High School | 5 (41.7%) | 0 (0.0%) |
| High School Diploma | 34 (94.4%) | 0 (0.0%) |
| College / Associate Degree | 27 (73.0%) | 0 (0.0%) |
| Bachelor's Degree or higher | 17 (94.4%) | 0 (0.0%) |
| Total | 83 (80.6%) | 0 (0.0%) |
Employment Occupations by Sex in Stanford
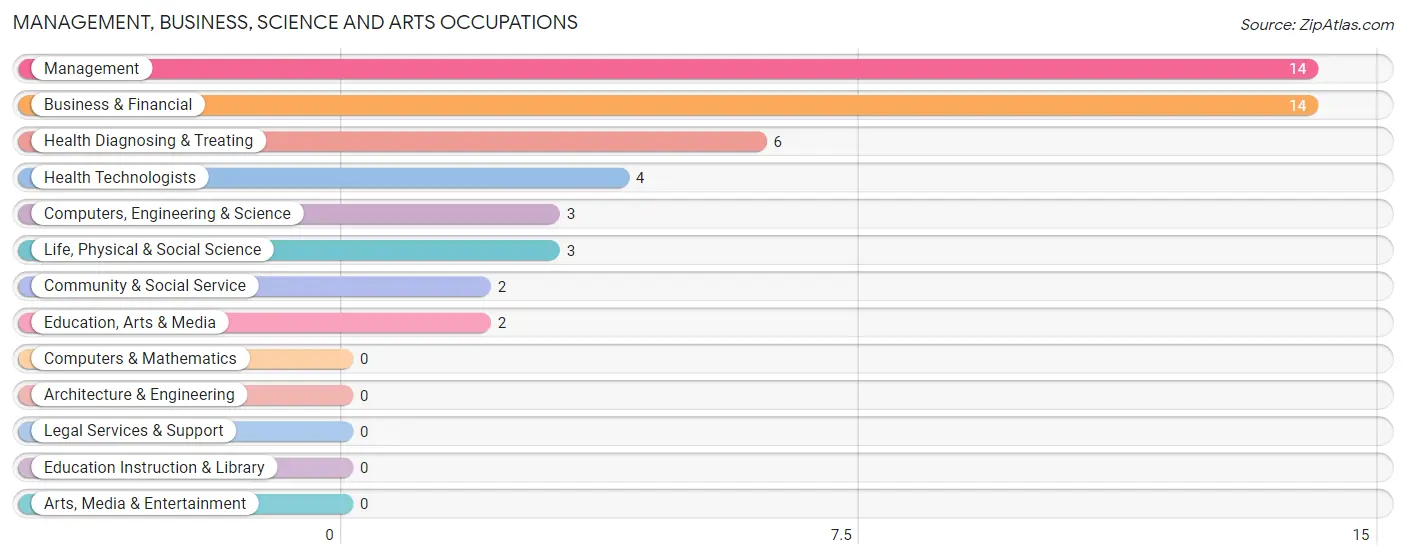
Management, Business, Science and Arts Occupations
The most common Management, Business, Science and Arts occupations in Stanford are Management (14 | 12.8%), Business & Financial (14 | 12.8%), Health Diagnosing & Treating (6 | 5.5%), Health Technologists (4 | 3.7%), and Computers, Engineering & Science (3 | 2.8%).
Management, Business, Science and Arts Occupations by Sex
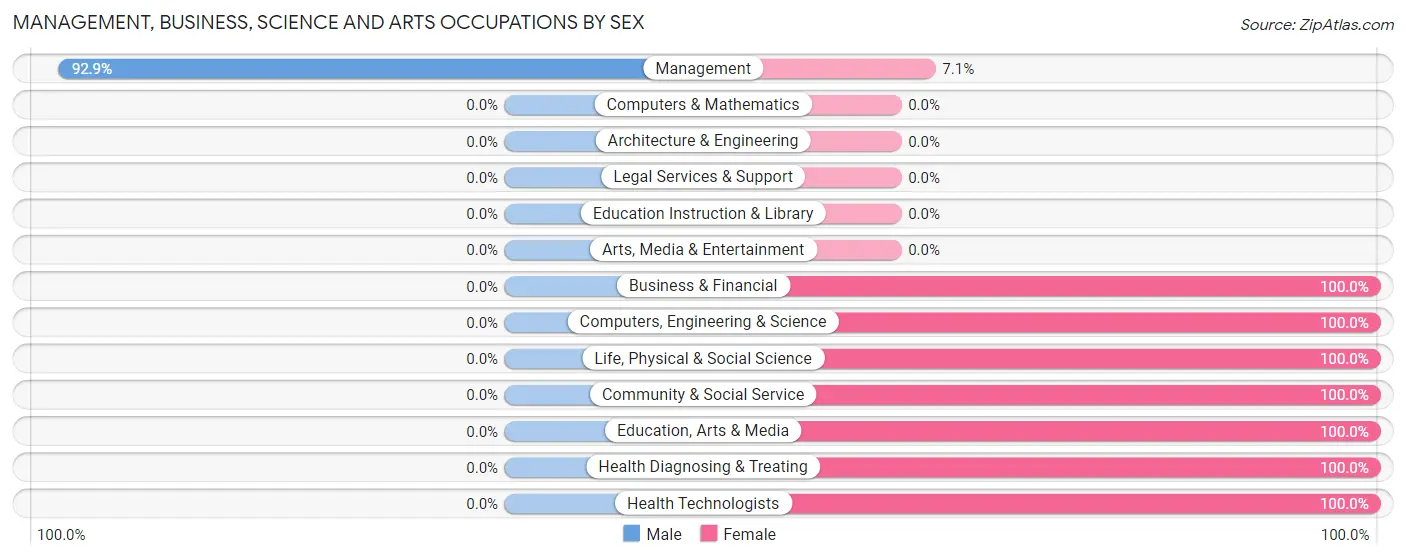
| Occupation | Male | Female |
| Management | 13 (92.9%) | 1 (7.1%) |
| Business & Financial | 0 (0.0%) | 14 (100.0%) |
| Computers, Engineering & Science | 0 (0.0%) | 3 (100.0%) |
| Computers & Mathematics | 0 (0.0%) | 0 (0.0%) |
| Architecture & Engineering | 0 (0.0%) | 0 (0.0%) |
| Life, Physical & Social Science | 0 (0.0%) | 3 (100.0%) |
| Community & Social Service | 0 (0.0%) | 2 (100.0%) |
| Education, Arts & Media | 0 (0.0%) | 2 (100.0%) |
| Legal Services & Support | 0 (0.0%) | 0 (0.0%) |
| Education Instruction & Library | 0 (0.0%) | 0 (0.0%) |
| Arts, Media & Entertainment | 0 (0.0%) | 0 (0.0%) |
| Health Diagnosing & Treating | 0 (0.0%) | 6 (100.0%) |
| Health Technologists | 0 (0.0%) | 4 (100.0%) |
| Total (Category) | 13 (33.3%) | 26 (66.7%) |
| Total (Overall) | 43 (39.5%) | 66 (60.6%) |
Services Occupations
The most common Services occupations in Stanford are Food Preparation & Serving (20 | 18.3%), Security & Protection (11 | 10.1%), Law Enforcement (10 | 9.2%), Cleaning & Maintenance (7 | 6.4%), and Firefighting & Prevention (1 | 0.9%).
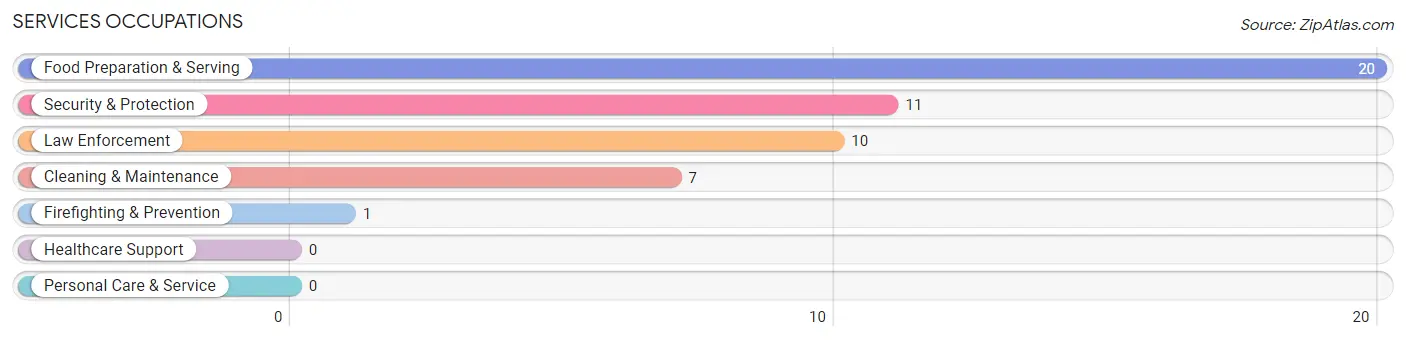
Services Occupations by Sex
Within the Services occupations in Stanford, the most male-oriented occupations are Security & Protection (100.0%), Firefighting & Prevention (100.0%), and Law Enforcement (100.0%), while the most female-oriented occupations are Food Preparation & Serving (100.0%), and Cleaning & Maintenance (28.6%).
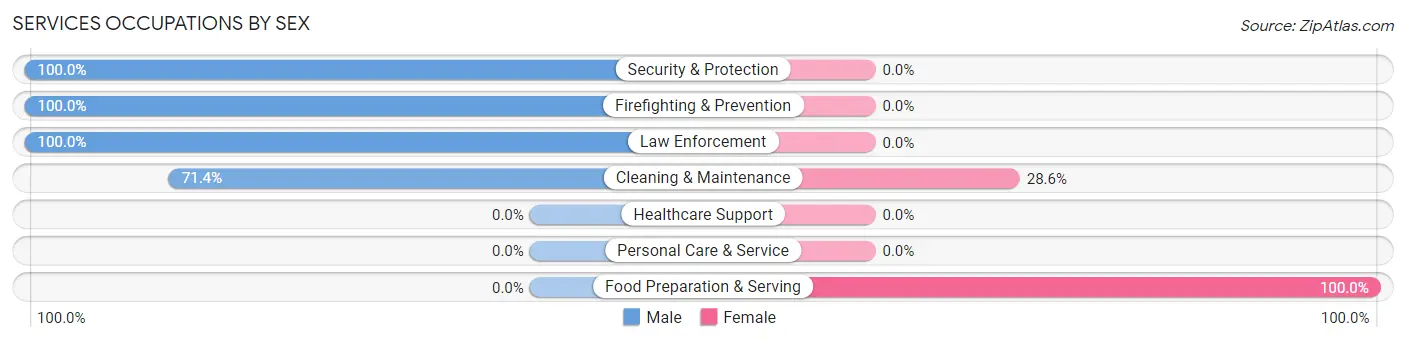
| Occupation | Male | Female |
| Healthcare Support | 0 (0.0%) | 0 (0.0%) |
| Security & Protection | 11 (100.0%) | 0 (0.0%) |
| Firefighting & Prevention | 1 (100.0%) | 0 (0.0%) |
| Law Enforcement | 10 (100.0%) | 0 (0.0%) |
| Food Preparation & Serving | 0 (0.0%) | 20 (100.0%) |
| Cleaning & Maintenance | 5 (71.4%) | 2 (28.6%) |
| Personal Care & Service | 0 (0.0%) | 0 (0.0%) |
| Total (Category) | 16 (42.1%) | 22 (57.9%) |
| Total (Overall) | 43 (39.5%) | 66 (60.6%) |
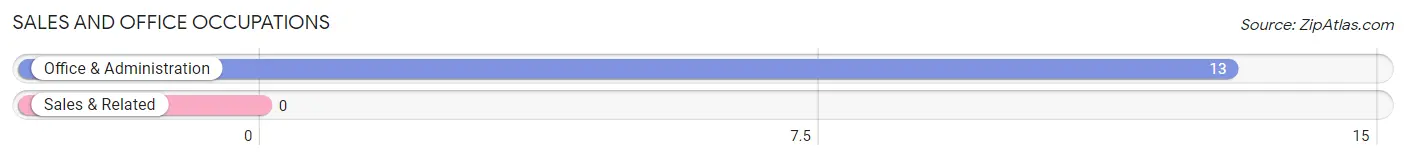
Sales and Office Occupations
The most common Sales and Office occupations in Stanford are , and Office & Administration (13 | 11.9%).
Sales and Office Occupations by Sex
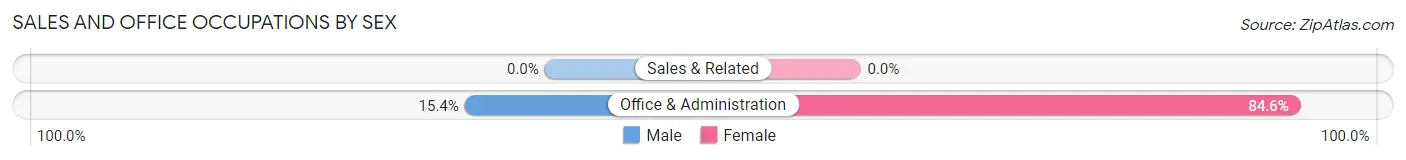
| Occupation | Male | Female |
| Sales & Related | 0 (0.0%) | 0 (0.0%) |
| Office & Administration | 2 (15.4%) | 11 (84.6%) |
| Total (Category) | 2 (15.4%) | 11 (84.6%) |
| Total (Overall) | 43 (39.5%) | 66 (60.6%) |
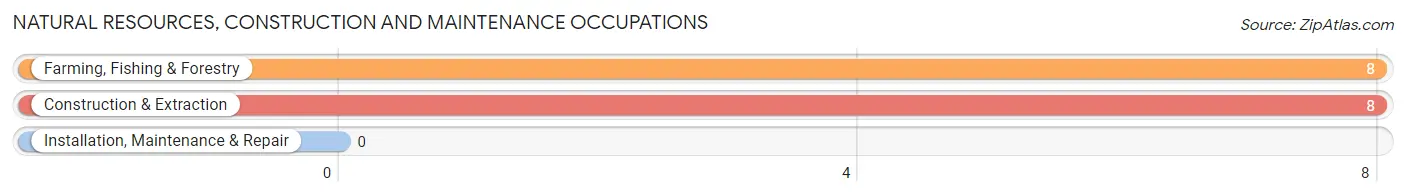
Natural Resources, Construction and Maintenance Occupations
The most common Natural Resources, Construction and Maintenance occupations in Stanford are Farming, Fishing & Forestry (8 | 7.3%), and Construction & Extraction (8 | 7.3%).
Natural Resources, Construction and Maintenance Occupations by Sex
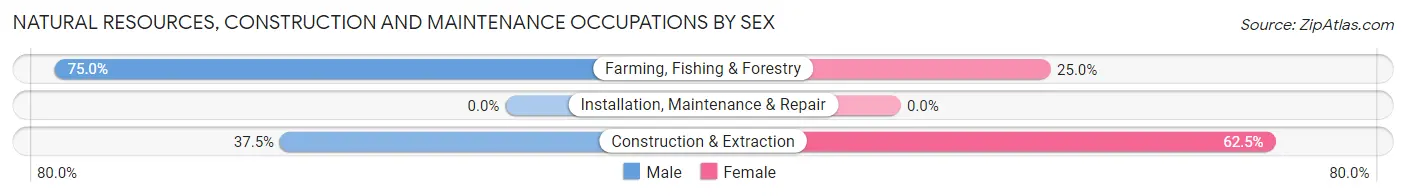
| Occupation | Male | Female |
| Farming, Fishing & Forestry | 6 (75.0%) | 2 (25.0%) |
| Construction & Extraction | 3 (37.5%) | 5 (62.5%) |
| Installation, Maintenance & Repair | 0 (0.0%) | 0 (0.0%) |
| Total (Category) | 9 (56.2%) | 7 (43.8%) |
| Total (Overall) | 43 (39.5%) | 66 (60.6%) |
Production, Transportation and Moving Occupations
The most common Production, Transportation and Moving occupations in Stanford are , and Material Moving (3 | 2.8%).
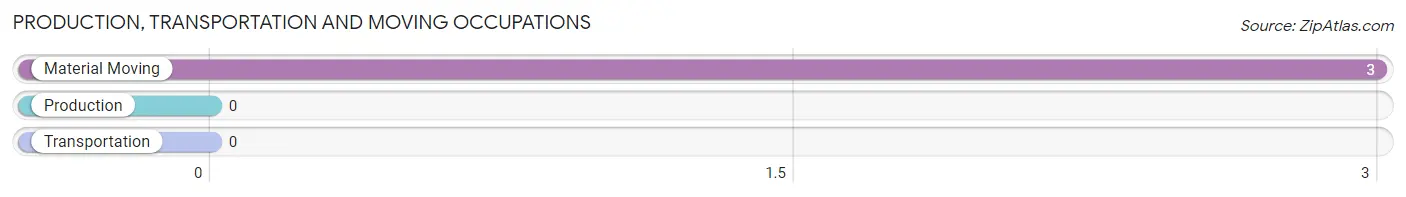
Production, Transportation and Moving Occupations by Sex
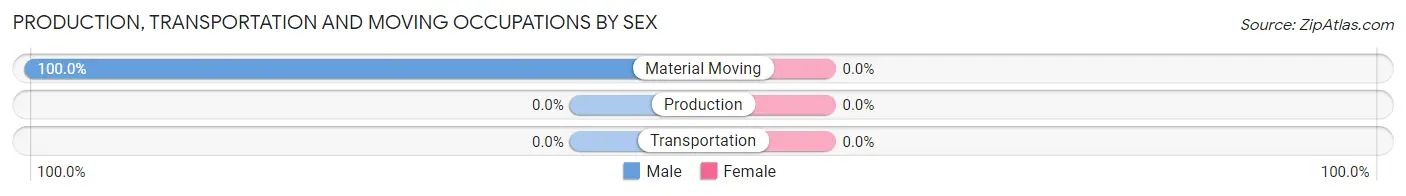
| Occupation | Male | Female |
| Production | 0 (0.0%) | 0 (0.0%) |
| Transportation | 0 (0.0%) | 0 (0.0%) |
| Material Moving | 3 (100.0%) | 0 (0.0%) |
| Total (Category) | 3 (100.0%) | 0 (0.0%) |
| Total (Overall) | 43 (39.5%) | 66 (60.6%) |
Employment Industries by Sex in Stanford
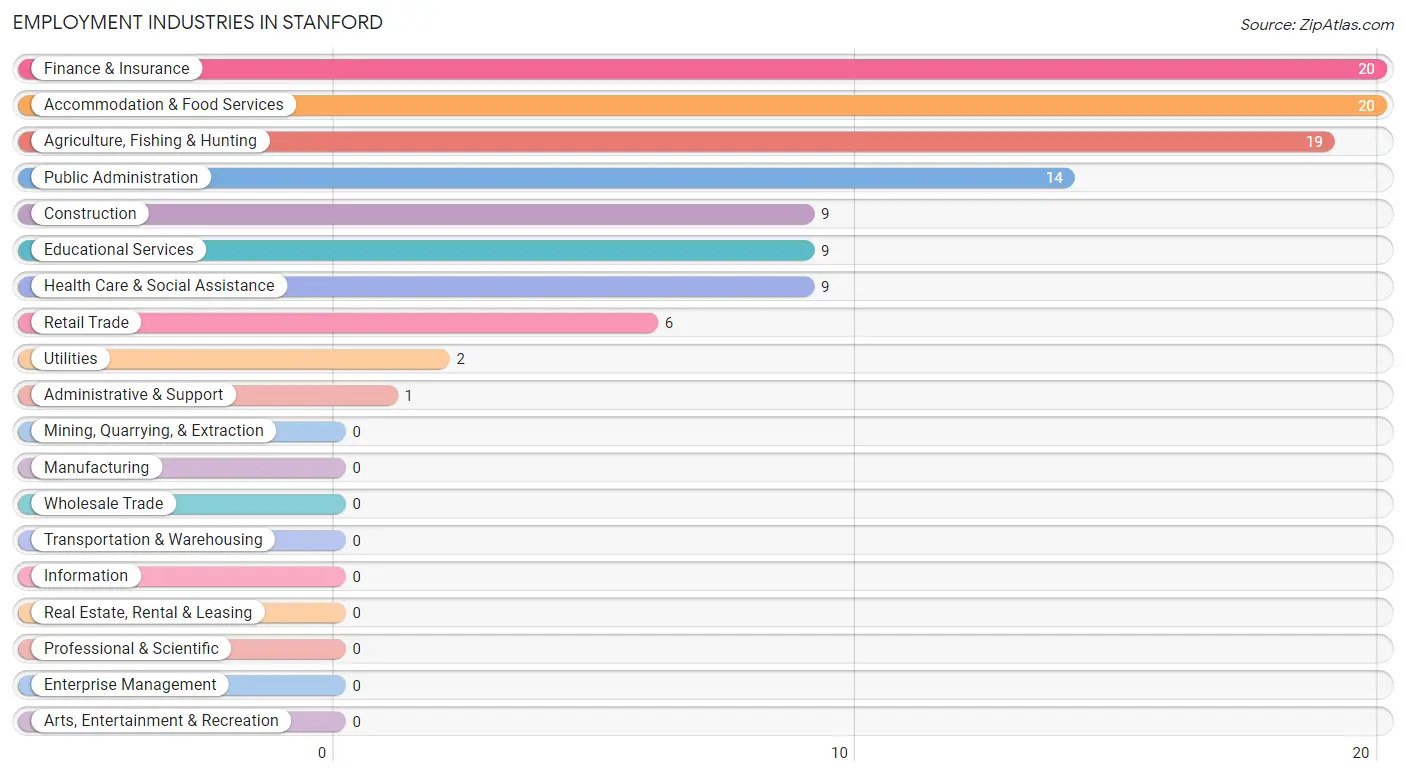
Employment Industries in Stanford
The major employment industries in Stanford include Finance & Insurance (20 | 18.3%), Accommodation & Food Services (20 | 18.3%), Agriculture, Fishing & Hunting (19 | 17.4%), Public Administration (14 | 12.8%), and Construction (9 | 8.3%).
Employment Industries by Sex in Stanford
The Stanford industries that see more men than women are Retail Trade (100.0%), Utilities (100.0%), and Administrative & Support (100.0%), whereas the industries that tend to have a higher number of women are Health Care & Social Assistance (100.0%), Accommodation & Food Services (100.0%), and Finance & Insurance (90.0%).
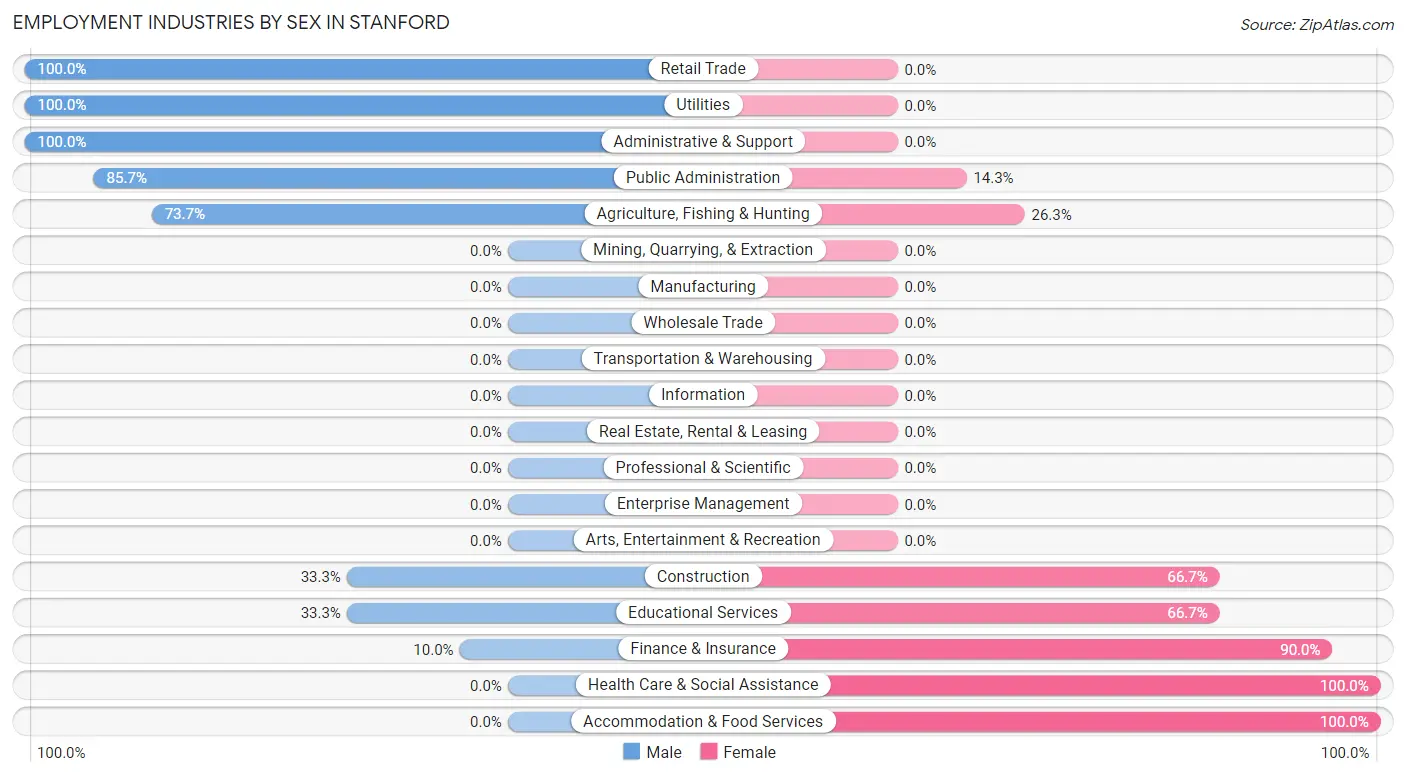
| Industry | Male | Female |
| Agriculture, Fishing & Hunting | 14 (73.7%) | 5 (26.3%) |
| Mining, Quarrying, & Extraction | 0 (0.0%) | 0 (0.0%) |
| Construction | 3 (33.3%) | 6 (66.7%) |
| Manufacturing | 0 (0.0%) | 0 (0.0%) |
| Wholesale Trade | 0 (0.0%) | 0 (0.0%) |
| Retail Trade | 6 (100.0%) | 0 (0.0%) |
| Transportation & Warehousing | 0 (0.0%) | 0 (0.0%) |
| Utilities | 2 (100.0%) | 0 (0.0%) |
| Information | 0 (0.0%) | 0 (0.0%) |
| Finance & Insurance | 2 (10.0%) | 18 (90.0%) |
| Real Estate, Rental & Leasing | 0 (0.0%) | 0 (0.0%) |
| Professional & Scientific | 0 (0.0%) | 0 (0.0%) |
| Enterprise Management | 0 (0.0%) | 0 (0.0%) |
| Administrative & Support | 1 (100.0%) | 0 (0.0%) |
| Educational Services | 3 (33.3%) | 6 (66.7%) |
| Health Care & Social Assistance | 0 (0.0%) | 9 (100.0%) |
| Arts, Entertainment & Recreation | 0 (0.0%) | 0 (0.0%) |
| Accommodation & Food Services | 0 (0.0%) | 20 (100.0%) |
| Public Administration | 12 (85.7%) | 2 (14.3%) |
| Total | 43 (39.5%) | 66 (60.6%) |
Education in Stanford
School Enrollment in Stanford
The most common levels of schooling among the 42 students in Stanford are middle school (20 | 47.6%), high school (20 | 47.6%), and elementary school (2 | 4.8%).
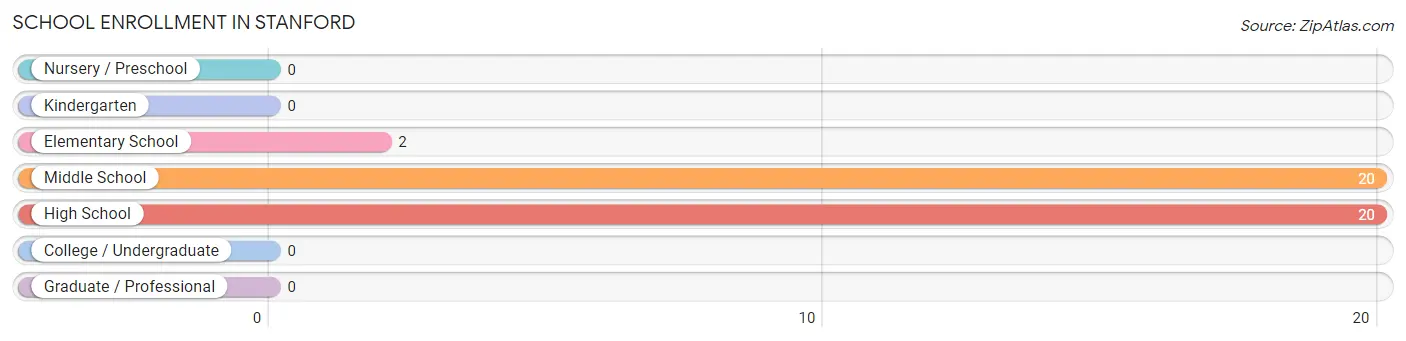
| School Level | # Students | % Students |
| Nursery / Preschool | 0 | 0.0% |
| Kindergarten | 0 | 0.0% |
| Elementary School | 2 | 4.8% |
| Middle School | 20 | 47.6% |
| High School | 20 | 47.6% |
| College / Undergraduate | 0 | 0.0% |
| Graduate / Professional | 0 | 0.0% |
| Total | 42 | 100.0% |
School Enrollment by Age by Funding Source in Stanford
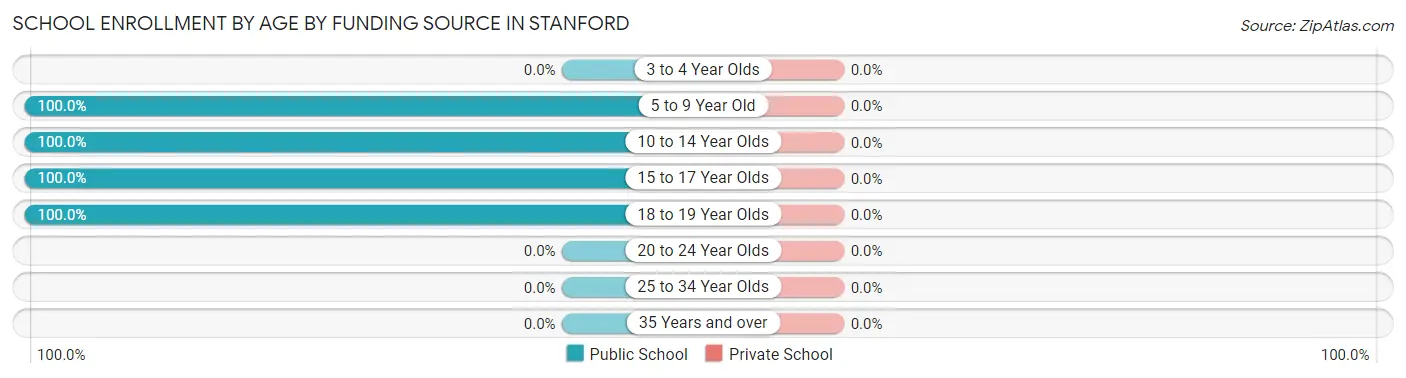
| Age Bracket | Public School | Private School |
| 3 to 4 Year Olds | 0 (0.0%) | 0 (0.0%) |
| 5 to 9 Year Old | 2 (100.0%) | 0 (0.0%) |
| 10 to 14 Year Olds | 20 (100.0%) | 0 (0.0%) |
| 15 to 17 Year Olds | 18 (100.0%) | 0 (0.0%) |
| 18 to 19 Year Olds | 2 (100.0%) | 0 (0.0%) |
| 20 to 24 Year Olds | 0 (0.0%) | 0 (0.0%) |
| 25 to 34 Year Olds | 0 (0.0%) | 0 (0.0%) |
| 35 Years and over | 0 (0.0%) | 0 (0.0%) |
| Total | 42 (100.0%) | 0 (0.0%) |
Educational Attainment by Field of Study in Stanford
Bio, nature & agricultural (11 | 37.9%), social sciences (5 | 17.2%), science & technology (5 | 17.2%), education (2 | 6.9%), and liberal arts & history (2 | 6.9%) are the most common fields of study among 29 individuals in Stanford who have obtained a bachelor's degree or higher.
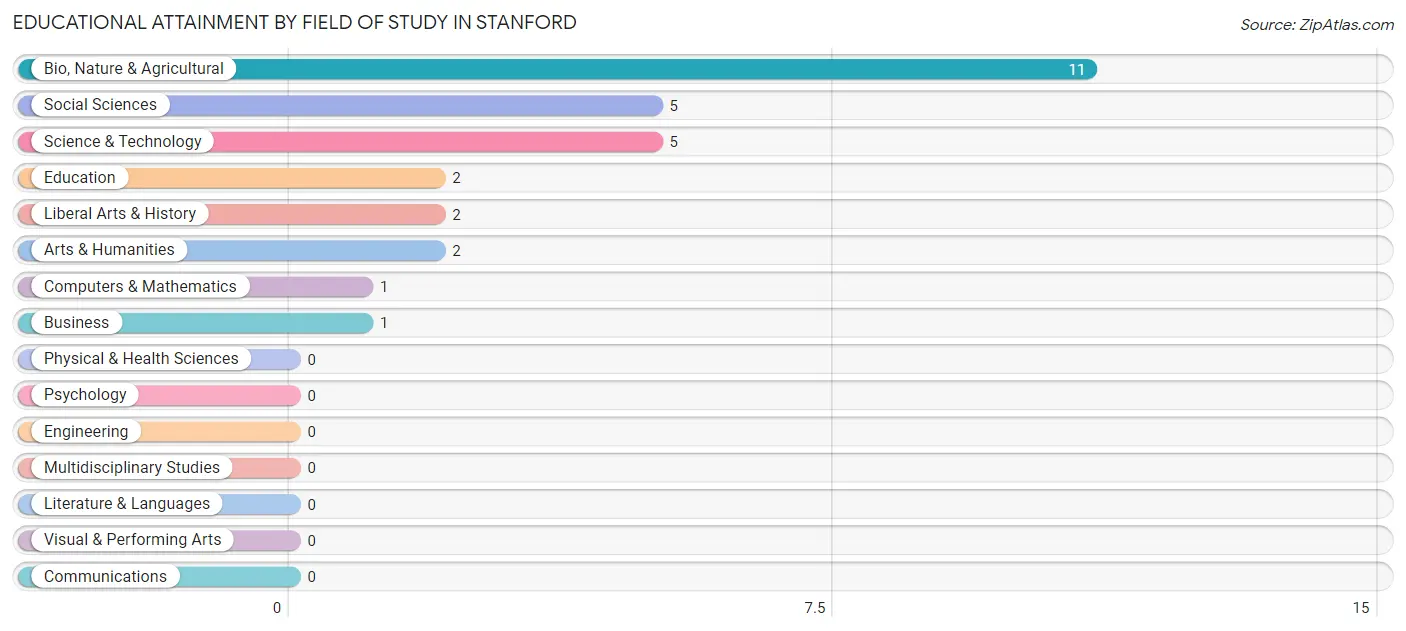
| Field of Study | # Graduates | % Graduates |
| Computers & Mathematics | 1 | 3.5% |
| Bio, Nature & Agricultural | 11 | 37.9% |
| Physical & Health Sciences | 0 | 0.0% |
| Psychology | 0 | 0.0% |
| Social Sciences | 5 | 17.2% |
| Engineering | 0 | 0.0% |
| Multidisciplinary Studies | 0 | 0.0% |
| Science & Technology | 5 | 17.2% |
| Business | 1 | 3.5% |
| Education | 2 | 6.9% |
| Literature & Languages | 0 | 0.0% |
| Liberal Arts & History | 2 | 6.9% |
| Visual & Performing Arts | 0 | 0.0% |
| Communications | 0 | 0.0% |
| Arts & Humanities | 2 | 6.9% |
| Total | 29 | 100.0% |
Transportation & Commute in Stanford
Vehicle Availability by Sex in Stanford
The most prevalent vehicle ownership categories in Stanford are males with 3 vehicles (20, accounting for 46.5%) and females with 3 vehicles (17, making up 30.3%).
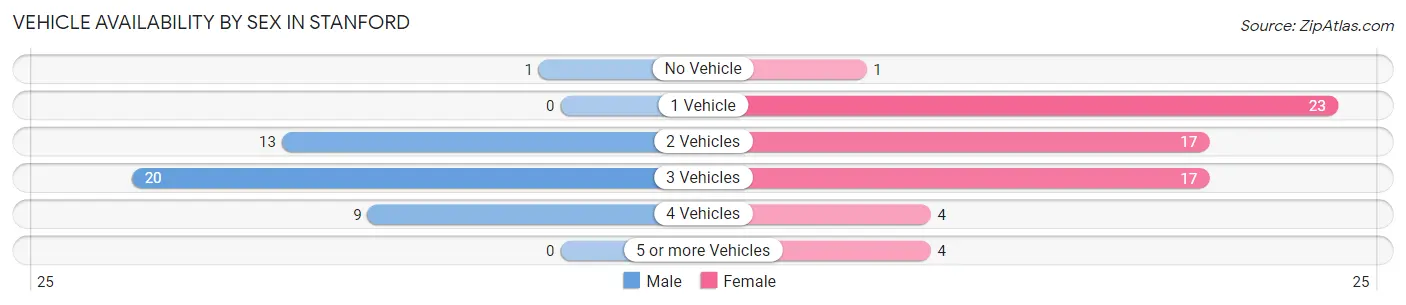
| Vehicles Available | Male | Female |
| No Vehicle | 1 (2.3%) | 1 (1.5%) |
| 1 Vehicle | 0 (0.0%) | 23 (34.8%) |
| 2 Vehicles | 13 (30.2%) | 17 (25.8%) |
| 3 Vehicles | 20 (46.5%) | 17 (25.8%) |
| 4 Vehicles | 9 (20.9%) | 4 (6.1%) |
| 5 or more Vehicles | 0 (0.0%) | 4 (6.1%) |
| Total | 43 (100.0%) | 66 (100.0%) |
Commute Time in Stanford
The most frequently occuring commute durations in Stanford are 5 to 9 minutes (51 commuters, 50.0%), less than 5 minutes (18 commuters, 17.6%), and 10 to 14 minutes (13 commuters, 12.8%).
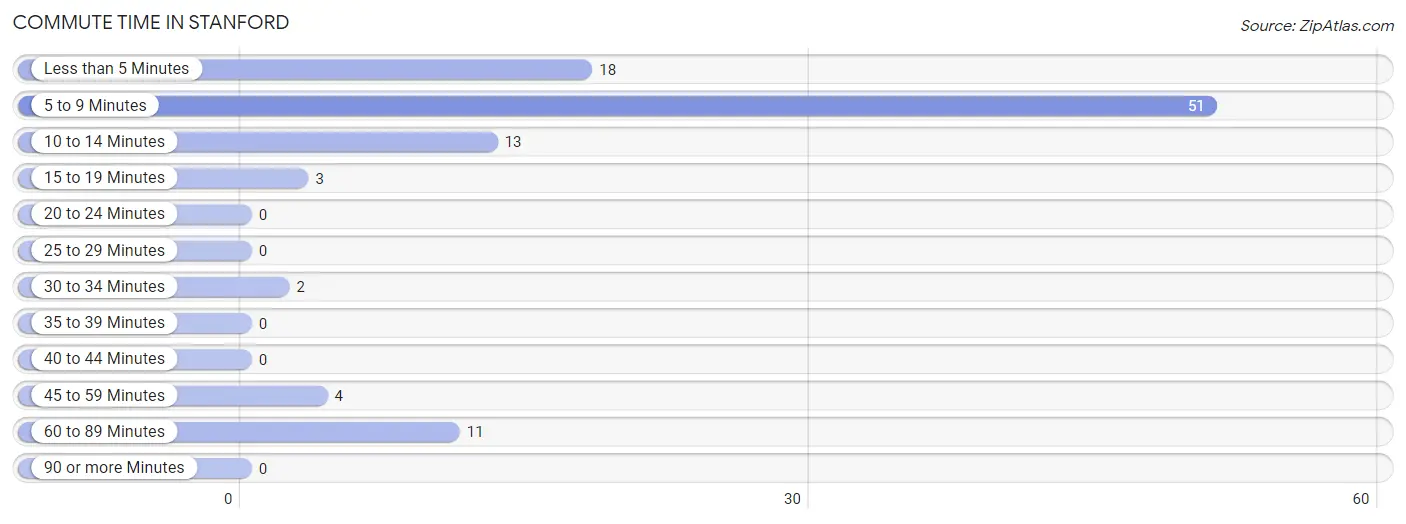
| Commute Time | # Commuters | % Commuters |
| Less than 5 Minutes | 18 | 17.6% |
| 5 to 9 Minutes | 51 | 50.0% |
| 10 to 14 Minutes | 13 | 12.8% |
| 15 to 19 Minutes | 3 | 2.9% |
| 20 to 24 Minutes | 0 | 0.0% |
| 25 to 29 Minutes | 0 | 0.0% |
| 30 to 34 Minutes | 2 | 2.0% |
| 35 to 39 Minutes | 0 | 0.0% |
| 40 to 44 Minutes | 0 | 0.0% |
| 45 to 59 Minutes | 4 | 3.9% |
| 60 to 89 Minutes | 11 | 10.8% |
| 90 or more Minutes | 0 | 0.0% |
Commute Time by Sex in Stanford
The most common commute times in Stanford are 5 to 9 minutes (16 commuters, 37.2%) for males and 5 to 9 minutes (35 commuters, 59.3%) for females.
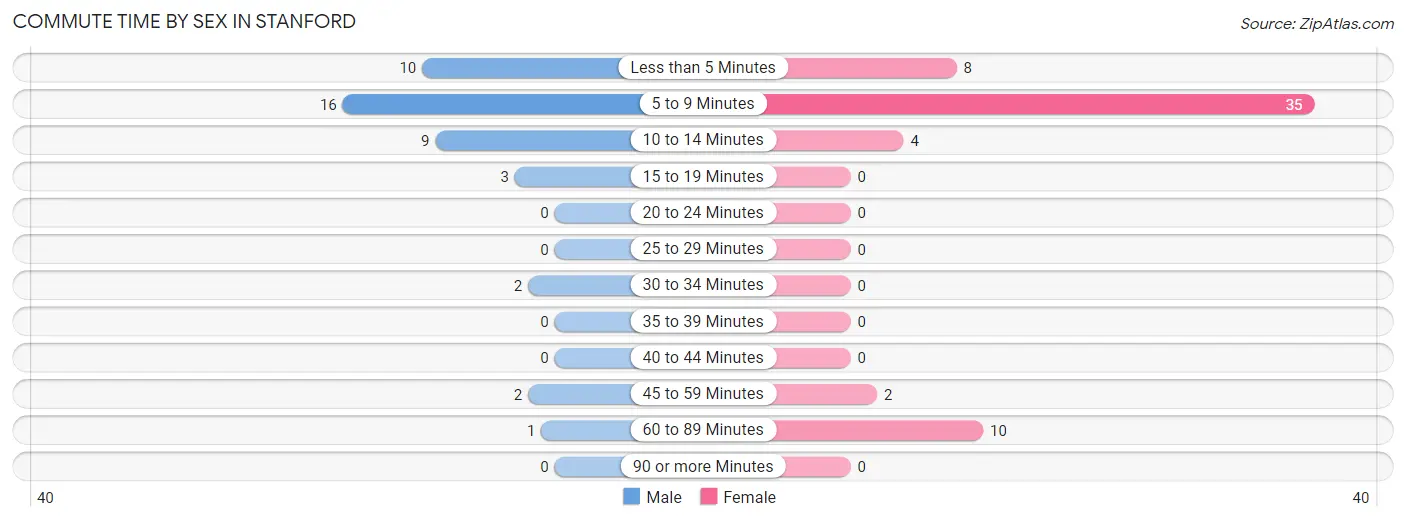
| Commute Time | Male | Female |
| Less than 5 Minutes | 10 (23.3%) | 8 (13.6%) |
| 5 to 9 Minutes | 16 (37.2%) | 35 (59.3%) |
| 10 to 14 Minutes | 9 (20.9%) | 4 (6.8%) |
| 15 to 19 Minutes | 3 (7.0%) | 0 (0.0%) |
| 20 to 24 Minutes | 0 (0.0%) | 0 (0.0%) |
| 25 to 29 Minutes | 0 (0.0%) | 0 (0.0%) |
| 30 to 34 Minutes | 2 (4.6%) | 0 (0.0%) |
| 35 to 39 Minutes | 0 (0.0%) | 0 (0.0%) |
| 40 to 44 Minutes | 0 (0.0%) | 0 (0.0%) |
| 45 to 59 Minutes | 2 (4.6%) | 2 (3.4%) |
| 60 to 89 Minutes | 1 (2.3%) | 10 (17.0%) |
| 90 or more Minutes | 0 (0.0%) | 0 (0.0%) |
Time of Departure to Work by Sex in Stanford
The most frequent times of departure to work in Stanford are 9:00 AM to 9:59 AM (10, 23.3%) for males and 7:00 AM to 7:29 AM (13, 22.0%) for females.
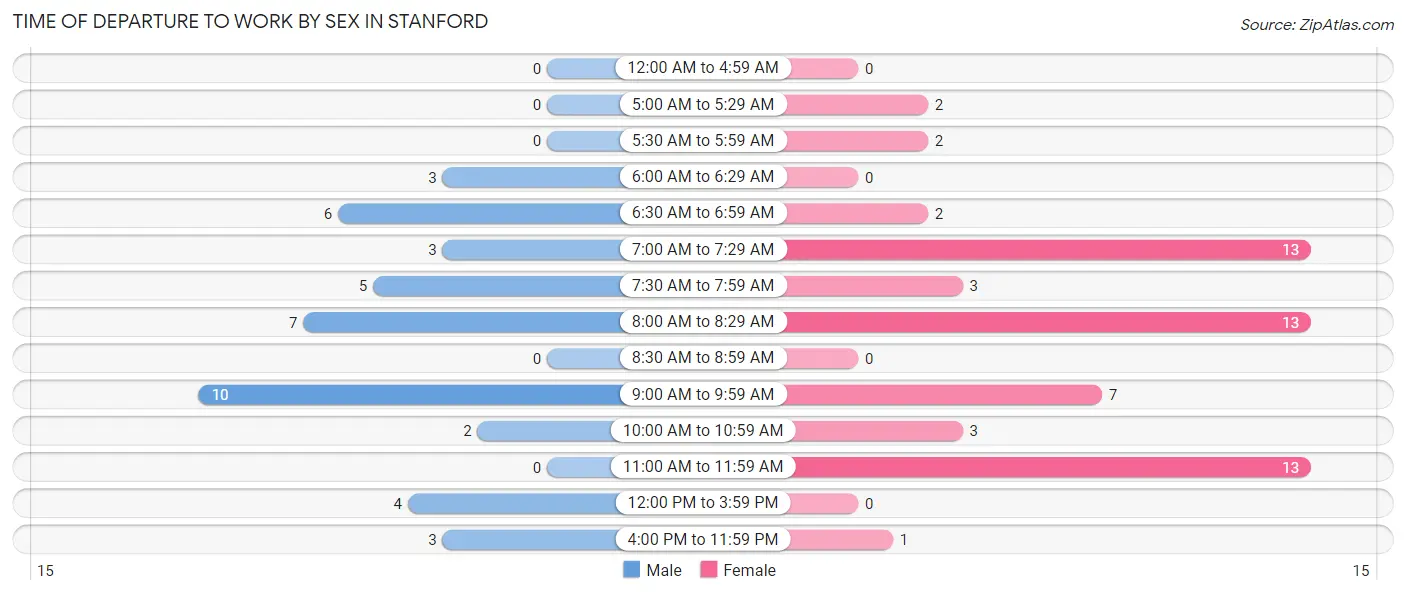
| Time of Departure | Male | Female |
| 12:00 AM to 4:59 AM | 0 (0.0%) | 0 (0.0%) |
| 5:00 AM to 5:29 AM | 0 (0.0%) | 2 (3.4%) |
| 5:30 AM to 5:59 AM | 0 (0.0%) | 2 (3.4%) |
| 6:00 AM to 6:29 AM | 3 (7.0%) | 0 (0.0%) |
| 6:30 AM to 6:59 AM | 6 (14.0%) | 2 (3.4%) |
| 7:00 AM to 7:29 AM | 3 (7.0%) | 13 (22.0%) |
| 7:30 AM to 7:59 AM | 5 (11.6%) | 3 (5.1%) |
| 8:00 AM to 8:29 AM | 7 (16.3%) | 13 (22.0%) |
| 8:30 AM to 8:59 AM | 0 (0.0%) | 0 (0.0%) |
| 9:00 AM to 9:59 AM | 10 (23.3%) | 7 (11.9%) |
| 10:00 AM to 10:59 AM | 2 (4.6%) | 3 (5.1%) |
| 11:00 AM to 11:59 AM | 0 (0.0%) | 13 (22.0%) |
| 12:00 PM to 3:59 PM | 4 (9.3%) | 0 (0.0%) |
| 4:00 PM to 11:59 PM | 3 (7.0%) | 1 (1.7%) |
| Total | 43 (100.0%) | 59 (100.0%) |
Housing Occupancy in Stanford
Occupancy by Ownership in Stanford
Of the total 126 dwellings in Stanford, owner-occupied units account for 98 (77.8%), while renter-occupied units make up 28 (22.2%).
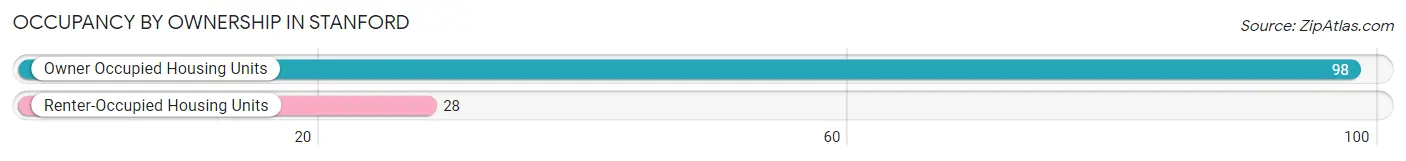
| Occupancy | # Housing Units | % Housing Units |
| Owner Occupied Housing Units | 98 | 77.8% |
| Renter-Occupied Housing Units | 28 | 22.2% |
| Total Occupied Housing Units | 126 | 100.0% |
Occupancy by Household Size in Stanford
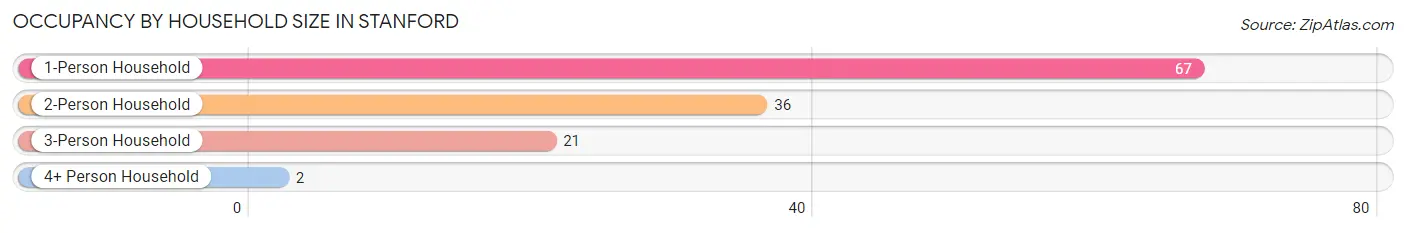
| Household Size | # Housing Units | % Housing Units |
| 1-Person Household | 67 | 53.2% |
| 2-Person Household | 36 | 28.6% |
| 3-Person Household | 21 | 16.7% |
| 4+ Person Household | 2 | 1.6% |
| Total Housing Units | 126 | 100.0% |
Occupancy by Ownership by Household Size in Stanford
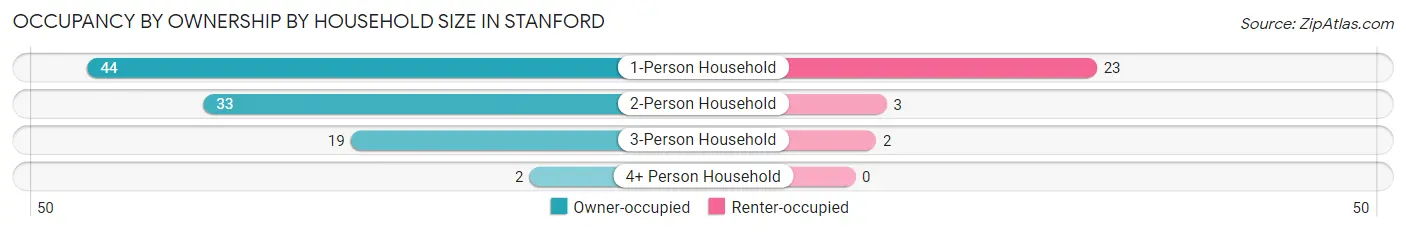
| Household Size | Owner-occupied | Renter-occupied |
| 1-Person Household | 44 (65.7%) | 23 (34.3%) |
| 2-Person Household | 33 (91.7%) | 3 (8.3%) |
| 3-Person Household | 19 (90.5%) | 2 (9.5%) |
| 4+ Person Household | 2 (100.0%) | 0 (0.0%) |
| Total Housing Units | 98 (77.8%) | 28 (22.2%) |
Occupancy by Educational Attainment in Stanford
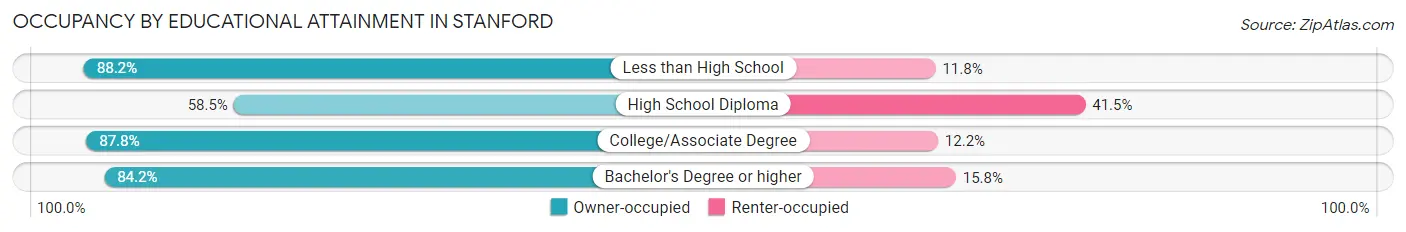
| Household Size | Owner-occupied | Renter-occupied |
| Less than High School | 15 (88.2%) | 2 (11.8%) |
| High School Diploma | 24 (58.5%) | 17 (41.5%) |
| College/Associate Degree | 43 (87.8%) | 6 (12.2%) |
| Bachelor's Degree or higher | 16 (84.2%) | 3 (15.8%) |
Occupancy by Age of Householder in Stanford
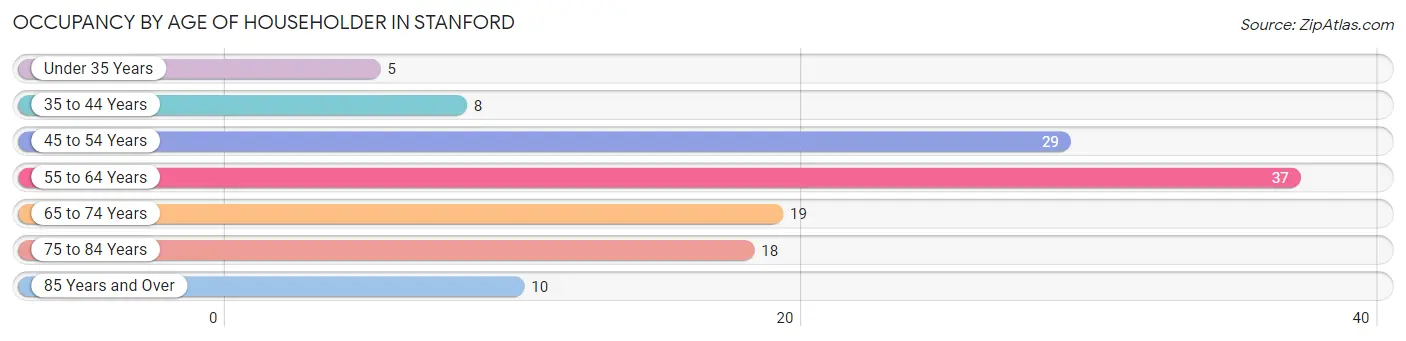
| Age Bracket | # Households | % Households |
| Under 35 Years | 5 | 4.0% |
| 35 to 44 Years | 8 | 6.4% |
| 45 to 54 Years | 29 | 23.0% |
| 55 to 64 Years | 37 | 29.4% |
| 65 to 74 Years | 19 | 15.1% |
| 75 to 84 Years | 18 | 14.3% |
| 85 Years and Over | 10 | 7.9% |
| Total | 126 | 100.0% |
Housing Finances in Stanford
Median Income by Occupancy in Stanford
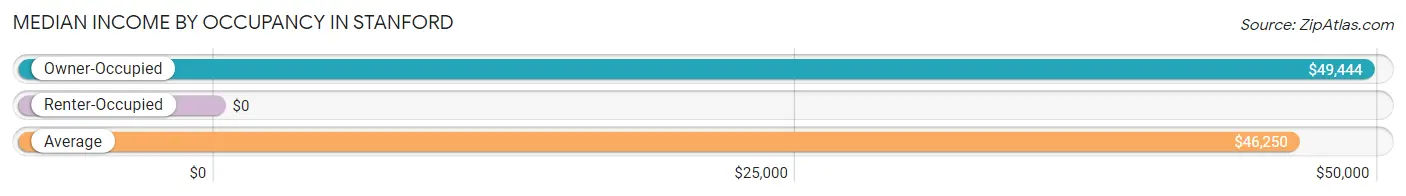
| Occupancy Type | # Households | Median Income |
| Owner-Occupied | 98 (77.8%) | $49,444 |
| Renter-Occupied | 28 (22.2%) | $0 |
| Average | 126 (100.0%) | $46,250 |
Occupancy by Householder Income Bracket in Stanford
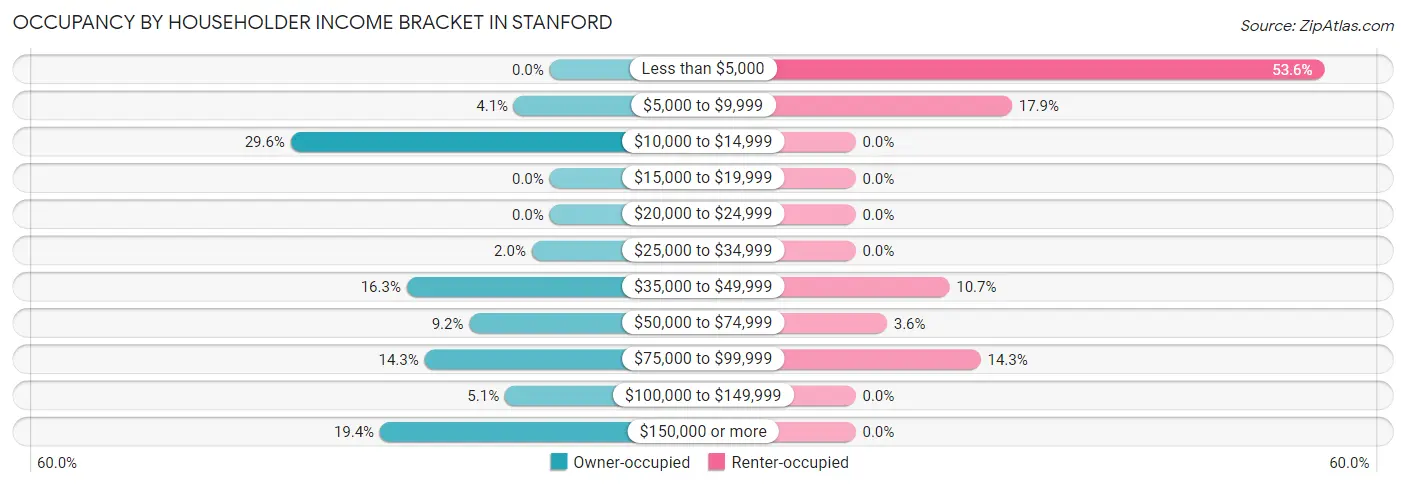
| Income Bracket | Owner-occupied | Renter-occupied |
| Less than $5,000 | 0 (0.0%) | 15 (53.6%) |
| $5,000 to $9,999 | 4 (4.1%) | 5 (17.9%) |
| $10,000 to $14,999 | 29 (29.6%) | 0 (0.0%) |
| $15,000 to $19,999 | 0 (0.0%) | 0 (0.0%) |
| $20,000 to $24,999 | 0 (0.0%) | 0 (0.0%) |
| $25,000 to $34,999 | 2 (2.0%) | 0 (0.0%) |
| $35,000 to $49,999 | 16 (16.3%) | 3 (10.7%) |
| $50,000 to $74,999 | 9 (9.2%) | 1 (3.6%) |
| $75,000 to $99,999 | 14 (14.3%) | 4 (14.3%) |
| $100,000 to $149,999 | 5 (5.1%) | 0 (0.0%) |
| $150,000 or more | 19 (19.4%) | 0 (0.0%) |
| Total | 98 (100.0%) | 28 (100.0%) |
Monthly Housing Cost Tiers in Stanford
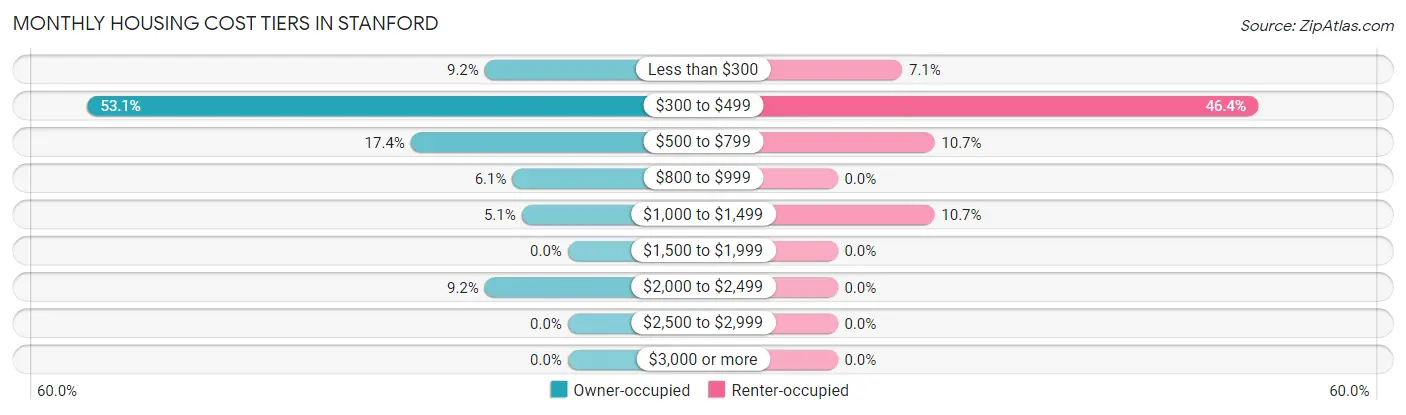
| Monthly Cost | Owner-occupied | Renter-occupied |
| Less than $300 | 9 (9.2%) | 2 (7.1%) |
| $300 to $499 | 52 (53.1%) | 13 (46.4%) |
| $500 to $799 | 17 (17.3%) | 3 (10.7%) |
| $800 to $999 | 6 (6.1%) | 0 (0.0%) |
| $1,000 to $1,499 | 5 (5.1%) | 3 (10.7%) |
| $1,500 to $1,999 | 0 (0.0%) | 0 (0.0%) |
| $2,000 to $2,499 | 9 (9.2%) | 0 (0.0%) |
| $2,500 to $2,999 | 0 (0.0%) | 0 (0.0%) |
| $3,000 or more | 0 (0.0%) | 0 (0.0%) |
| Total | 98 (100.0%) | 28 (100.0%) |
Physical Housing Characteristics in Stanford
Housing Structures in Stanford
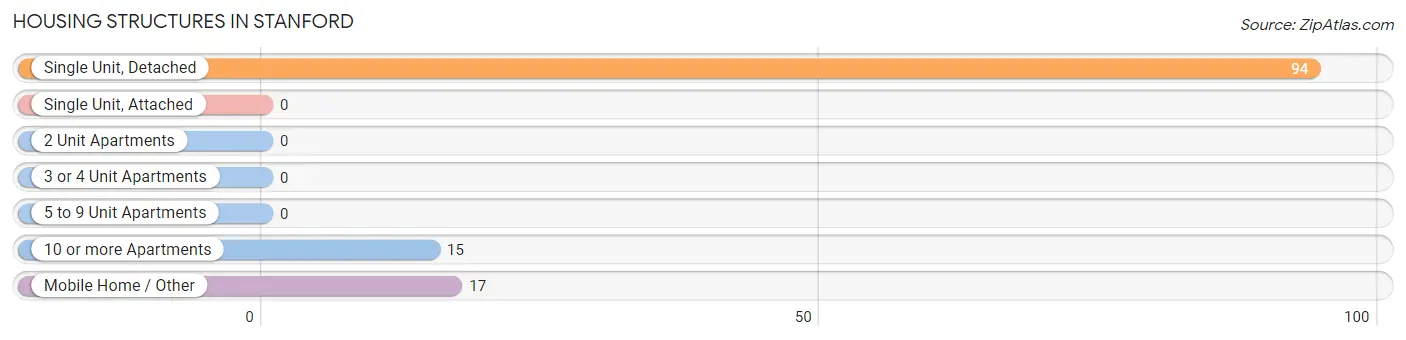
| Structure Type | # Housing Units | % Housing Units |
| Single Unit, Detached | 94 | 74.6% |
| Single Unit, Attached | 0 | 0.0% |
| 2 Unit Apartments | 0 | 0.0% |
| 3 or 4 Unit Apartments | 0 | 0.0% |
| 5 to 9 Unit Apartments | 0 | 0.0% |
| 10 or more Apartments | 15 | 11.9% |
| Mobile Home / Other | 17 | 13.5% |
| Total | 126 | 100.0% |
Housing Structures by Occupancy in Stanford
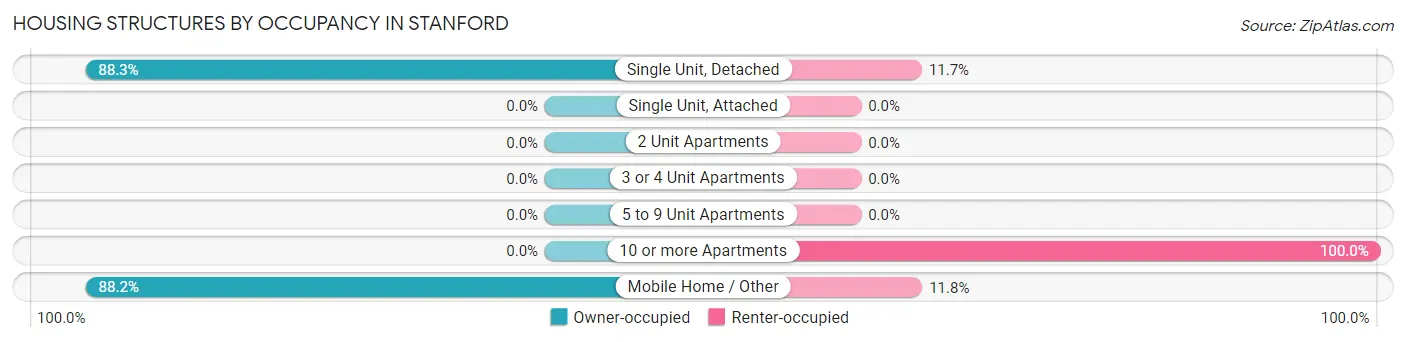
| Structure Type | Owner-occupied | Renter-occupied |
| Single Unit, Detached | 83 (88.3%) | 11 (11.7%) |
| Single Unit, Attached | 0 (0.0%) | 0 (0.0%) |
| 2 Unit Apartments | 0 (0.0%) | 0 (0.0%) |
| 3 or 4 Unit Apartments | 0 (0.0%) | 0 (0.0%) |
| 5 to 9 Unit Apartments | 0 (0.0%) | 0 (0.0%) |
| 10 or more Apartments | 0 (0.0%) | 15 (100.0%) |
| Mobile Home / Other | 15 (88.2%) | 2 (11.8%) |
| Total | 98 (77.8%) | 28 (22.2%) |
Housing Structures by Number of Rooms in Stanford
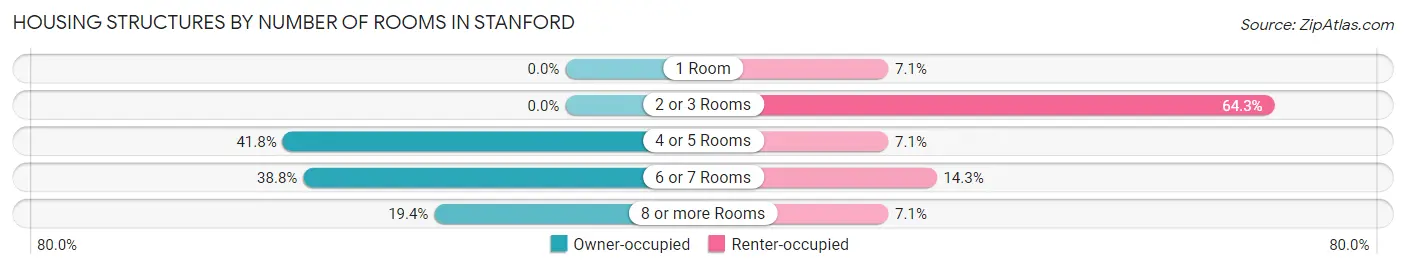
| Number of Rooms | Owner-occupied | Renter-occupied |
| 1 Room | 0 (0.0%) | 2 (7.1%) |
| 2 or 3 Rooms | 0 (0.0%) | 18 (64.3%) |
| 4 or 5 Rooms | 41 (41.8%) | 2 (7.1%) |
| 6 or 7 Rooms | 38 (38.8%) | 4 (14.3%) |
| 8 or more Rooms | 19 (19.4%) | 2 (7.1%) |
| Total | 98 (100.0%) | 28 (100.0%) |
Housing Structure by Heating Type in Stanford
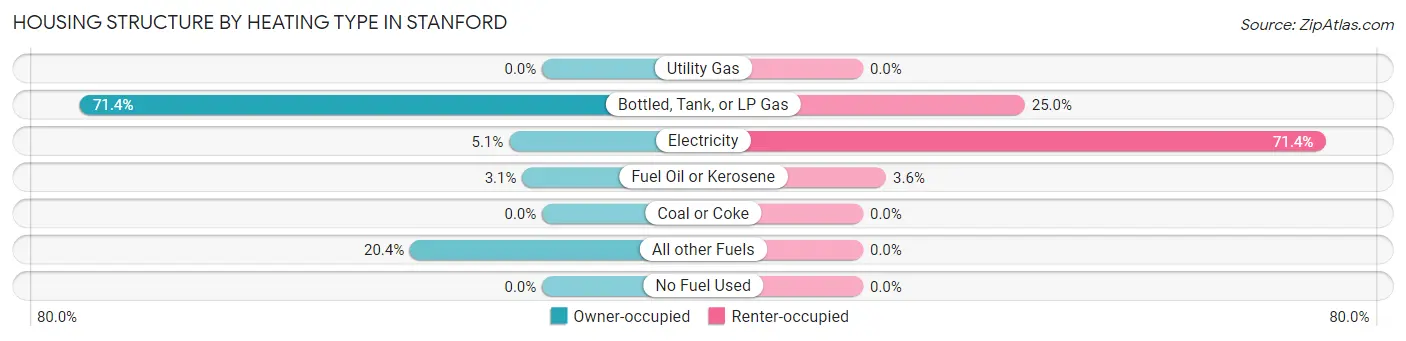
| Heating Type | Owner-occupied | Renter-occupied |
| Utility Gas | 0 (0.0%) | 0 (0.0%) |
| Bottled, Tank, or LP Gas | 70 (71.4%) | 7 (25.0%) |
| Electricity | 5 (5.1%) | 20 (71.4%) |
| Fuel Oil or Kerosene | 3 (3.1%) | 1 (3.6%) |
| Coal or Coke | 0 (0.0%) | 0 (0.0%) |
| All other Fuels | 20 (20.4%) | 0 (0.0%) |
| No Fuel Used | 0 (0.0%) | 0 (0.0%) |
| Total | 98 (100.0%) | 28 (100.0%) |
Household Vehicle Usage in Stanford
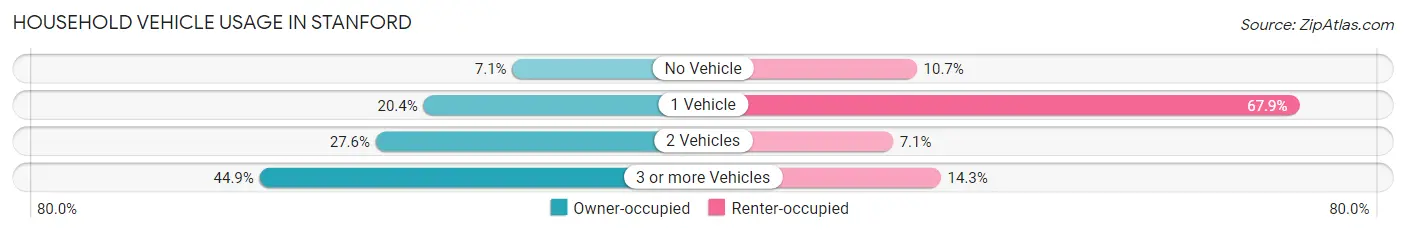
| Vehicles per Household | Owner-occupied | Renter-occupied |
| No Vehicle | 7 (7.1%) | 3 (10.7%) |
| 1 Vehicle | 20 (20.4%) | 19 (67.9%) |
| 2 Vehicles | 27 (27.6%) | 2 (7.1%) |
| 3 or more Vehicles | 44 (44.9%) | 4 (14.3%) |
| Total | 98 (100.0%) | 28 (100.0%) |
Real Estate & Mortgages in Stanford
Real Estate and Mortgage Overview in Stanford
| Characteristic | Without Mortgage | With Mortgage |
| Housing Units | 78 | 20 |
| Median Property Value | $98,400 | $205,600 |
| Median Household Income | - | - |
| Monthly Housing Costs | $421 | $0 |
| Real Estate Taxes | $738 | $0 |
Property Value by Mortgage Status in Stanford
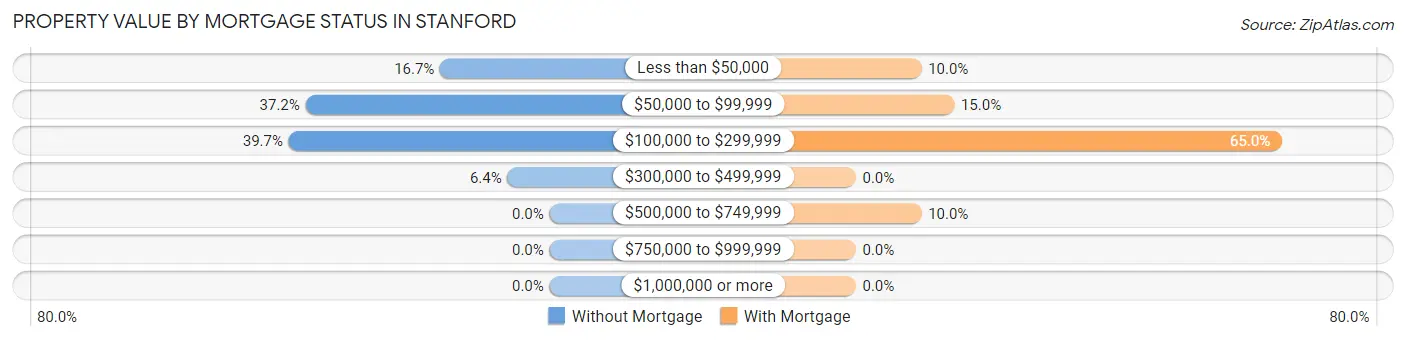
| Property Value | Without Mortgage | With Mortgage |
| Less than $50,000 | 13 (16.7%) | 2 (10.0%) |
| $50,000 to $99,999 | 29 (37.2%) | 3 (15.0%) |
| $100,000 to $299,999 | 31 (39.7%) | 13 (65.0%) |
| $300,000 to $499,999 | 5 (6.4%) | 0 (0.0%) |
| $500,000 to $749,999 | 0 (0.0%) | 2 (10.0%) |
| $750,000 to $999,999 | 0 (0.0%) | 0 (0.0%) |
| $1,000,000 or more | 0 (0.0%) | 0 (0.0%) |
| Total | 78 (100.0%) | 20 (100.0%) |
Household Income by Mortgage Status in Stanford
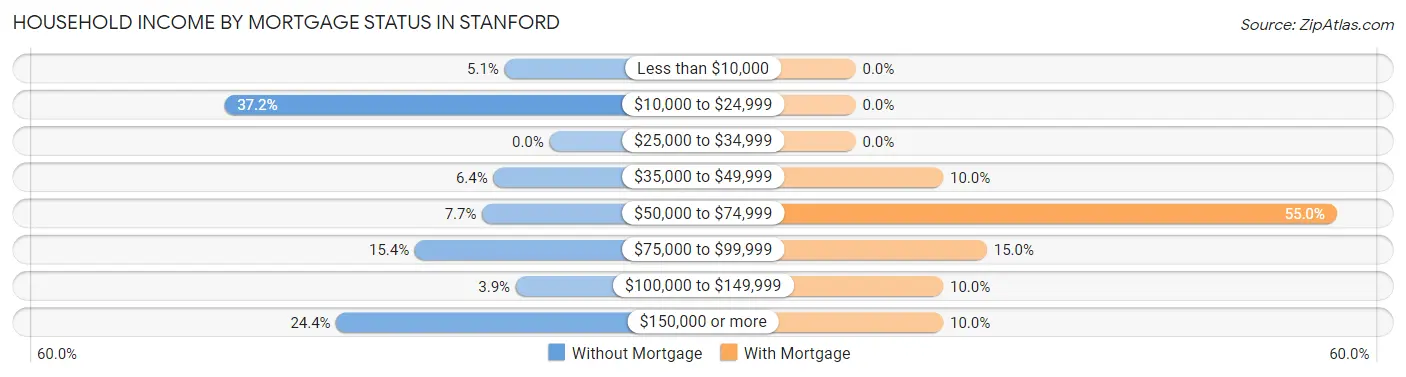
| Household Income | Without Mortgage | With Mortgage |
| Less than $10,000 | 4 (5.1%) | 0 (0.0%) |
| $10,000 to $24,999 | 29 (37.2%) | 0 (0.0%) |
| $25,000 to $34,999 | 0 (0.0%) | 0 (0.0%) |
| $35,000 to $49,999 | 5 (6.4%) | 2 (10.0%) |
| $50,000 to $74,999 | 6 (7.7%) | 11 (55.0%) |
| $75,000 to $99,999 | 12 (15.4%) | 3 (15.0%) |
| $100,000 to $149,999 | 3 (3.8%) | 2 (10.0%) |
| $150,000 or more | 19 (24.4%) | 2 (10.0%) |
| Total | 78 (100.0%) | 20 (100.0%) |
Property Value to Household Income Ratio in Stanford
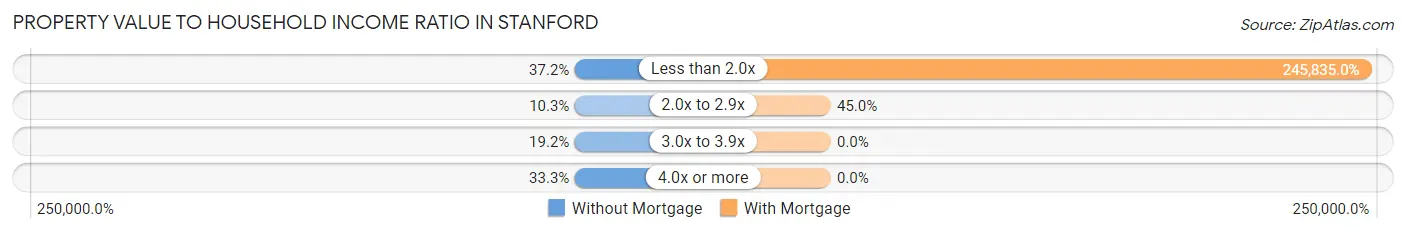
| Value-to-Income Ratio | Without Mortgage | With Mortgage |
| Less than 2.0x | 29 (37.2%) | 49,167 (245,835.0%) |
| 2.0x to 2.9x | 8 (10.3%) | 9 (45.0%) |
| 3.0x to 3.9x | 15 (19.2%) | 0 (0.0%) |
| 4.0x or more | 26 (33.3%) | 0 (0.0%) |
| Total | 78 (100.0%) | 20 (100.0%) |
Real Estate Taxes by Mortgage Status in Stanford
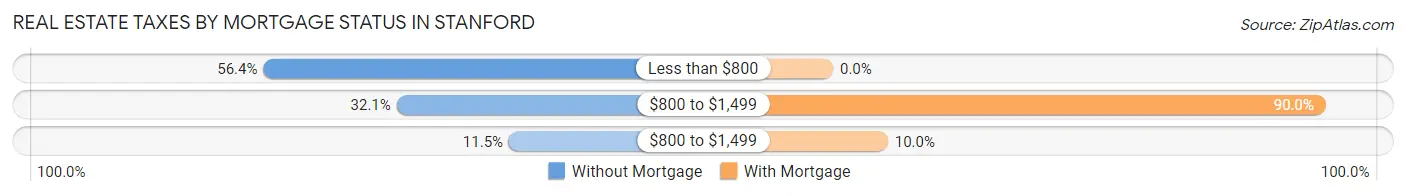
| Property Taxes | Without Mortgage | With Mortgage |
| Less than $800 | 44 (56.4%) | 0 (0.0%) |
| $800 to $1,499 | 25 (32.1%) | 18 (90.0%) |
| $800 to $1,499 | 9 (11.5%) | 2 (10.0%) |
| Total | 78 (100.0%) | 20 (100.0%) |
Health & Disability in Stanford
Health Insurance Coverage by Age in Stanford
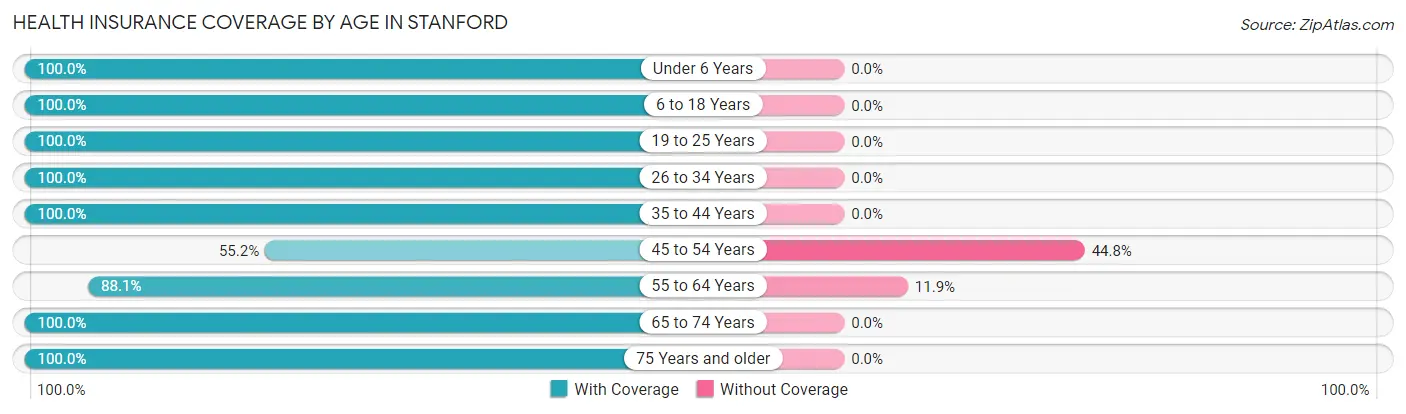
| Age Bracket | With Coverage | Without Coverage |
| Under 6 Years | 2 (100.0%) | 0 (0.0%) |
| 6 to 18 Years | 40 (100.0%) | 0 (0.0%) |
| 19 to 25 Years | 8 (100.0%) | 0 (0.0%) |
| 26 to 34 Years | 2 (100.0%) | 0 (0.0%) |
| 35 to 44 Years | 13 (100.0%) | 0 (0.0%) |
| 45 to 54 Years | 16 (55.2%) | 13 (44.8%) |
| 55 to 64 Years | 52 (88.1%) | 7 (11.9%) |
| 65 to 74 Years | 32 (100.0%) | 0 (0.0%) |
| 75 Years and older | 44 (100.0%) | 0 (0.0%) |
| Total | 209 (91.3%) | 20 (8.7%) |
Health Insurance Coverage by Citizenship Status in Stanford
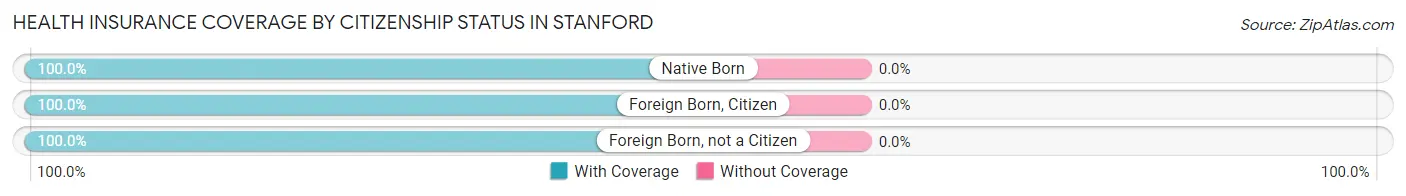
| Citizenship Status | With Coverage | Without Coverage |
| Native Born | 2 (100.0%) | 0 (0.0%) |
| Foreign Born, Citizen | 40 (100.0%) | 0 (0.0%) |
| Foreign Born, not a Citizen | 8 (100.0%) | 0 (0.0%) |
Health Insurance Coverage by Household Income in Stanford
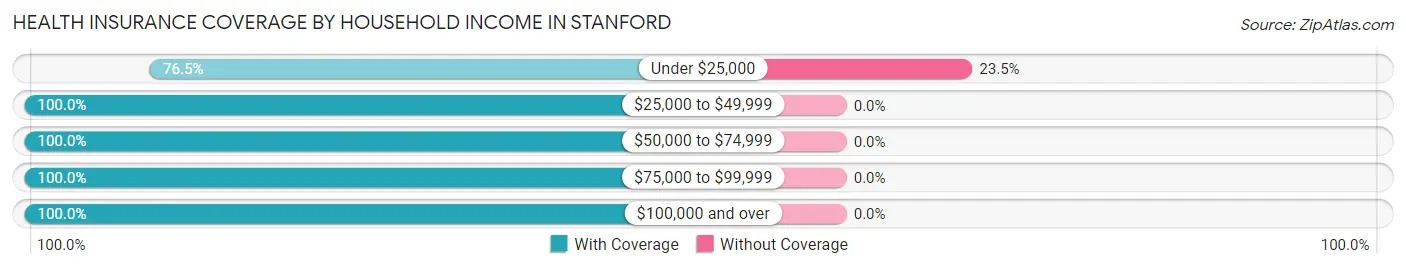
| Household Income | With Coverage | Without Coverage |
| Under $25,000 | 65 (76.5%) | 20 (23.5%) |
| $25,000 to $49,999 | 29 (100.0%) | 0 (0.0%) |
| $50,000 to $74,999 | 19 (100.0%) | 0 (0.0%) |
| $75,000 to $99,999 | 48 (100.0%) | 0 (0.0%) |
| $100,000 and over | 48 (100.0%) | 0 (0.0%) |
Public vs Private Health Insurance Coverage by Age in Stanford
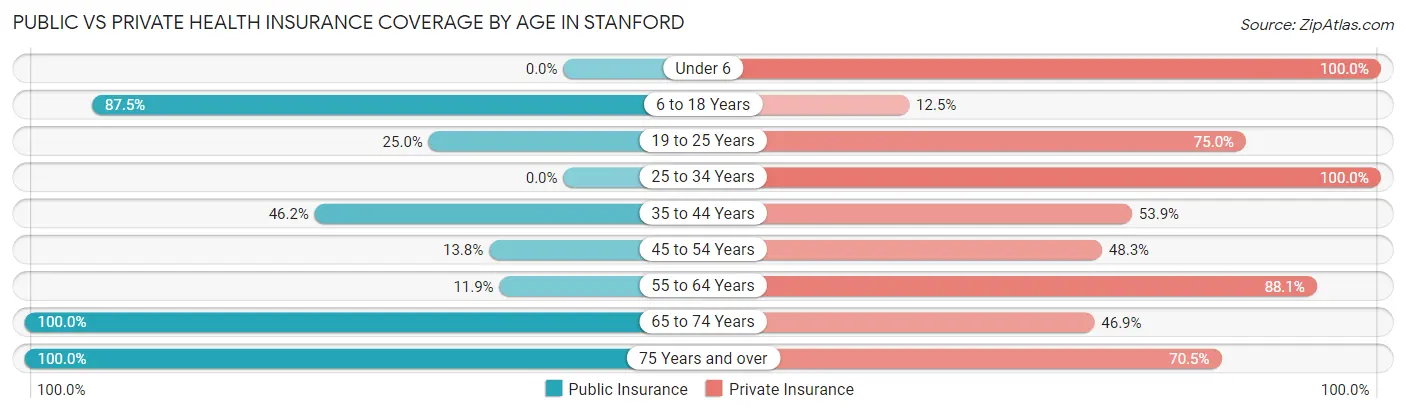
| Age Bracket | Public Insurance | Private Insurance |
| Under 6 | 0 (0.0%) | 2 (100.0%) |
| 6 to 18 Years | 35 (87.5%) | 5 (12.5%) |
| 19 to 25 Years | 2 (25.0%) | 6 (75.0%) |
| 25 to 34 Years | 0 (0.0%) | 2 (100.0%) |
| 35 to 44 Years | 6 (46.2%) | 7 (53.8%) |
| 45 to 54 Years | 4 (13.8%) | 14 (48.3%) |
| 55 to 64 Years | 7 (11.9%) | 52 (88.1%) |
| 65 to 74 Years | 32 (100.0%) | 15 (46.9%) |
| 75 Years and over | 44 (100.0%) | 31 (70.5%) |
| Total | 130 (56.8%) | 134 (58.5%) |
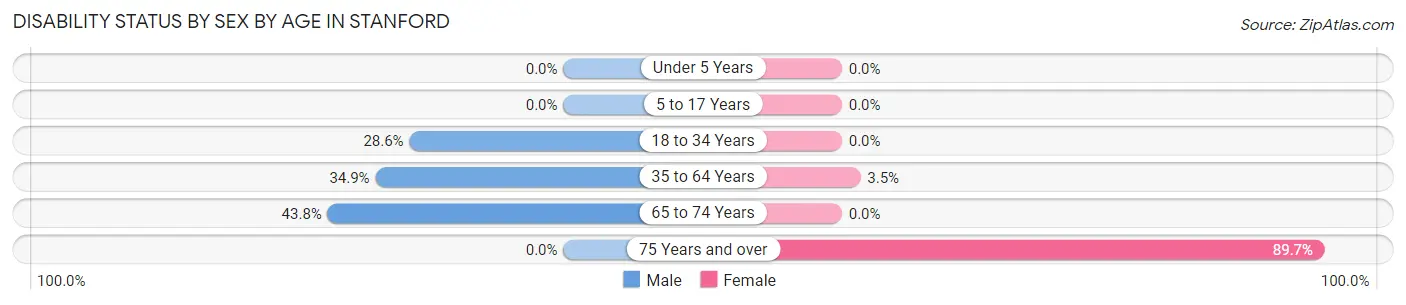
Disability Status by Sex by Age in Stanford
| Age Bracket | Male | Female |
| Under 5 Years | 0 (0.0%) | 0 (0.0%) |
| 5 to 17 Years | 0 (0.0%) | 0 (0.0%) |
| 18 to 34 Years | 2 (28.6%) | 0 (0.0%) |
| 35 to 64 Years | 15 (34.9%) | 2 (3.5%) |
| 65 to 74 Years | 7 (43.8%) | 0 (0.0%) |
| 75 Years and over | 0 (0.0%) | 26 (89.7%) |
Disability Class by Sex by Age in Stanford
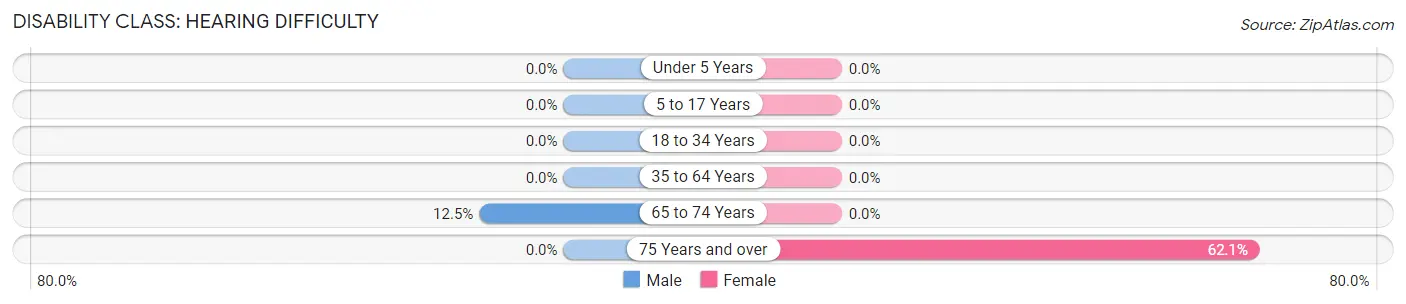
Disability Class: Hearing Difficulty
| Age Bracket | Male | Female |
| Under 5 Years | 0 (0.0%) | 0 (0.0%) |
| 5 to 17 Years | 0 (0.0%) | 0 (0.0%) |
| 18 to 34 Years | 0 (0.0%) | 0 (0.0%) |
| 35 to 64 Years | 0 (0.0%) | 0 (0.0%) |
| 65 to 74 Years | 2 (12.5%) | 0 (0.0%) |
| 75 Years and over | 0 (0.0%) | 18 (62.1%) |
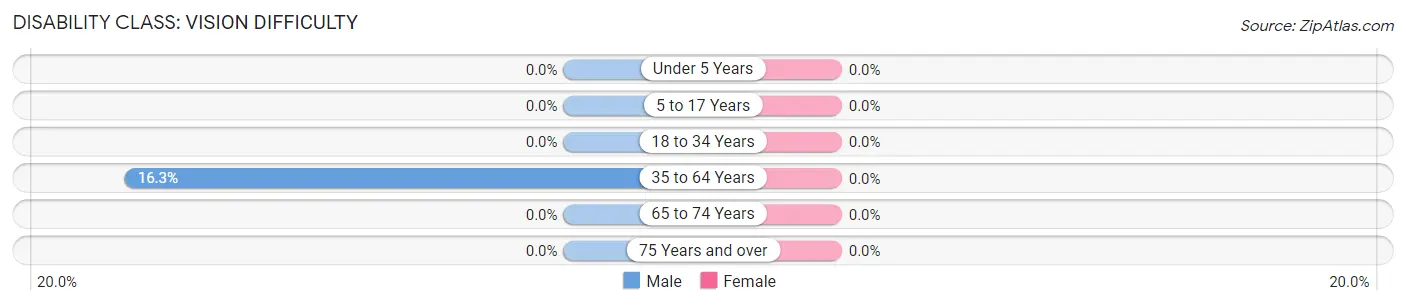
Disability Class: Vision Difficulty
| Age Bracket | Male | Female |
| Under 5 Years | 0 (0.0%) | 0 (0.0%) |
| 5 to 17 Years | 0 (0.0%) | 0 (0.0%) |
| 18 to 34 Years | 0 (0.0%) | 0 (0.0%) |
| 35 to 64 Years | 7 (16.3%) | 0 (0.0%) |
| 65 to 74 Years | 0 (0.0%) | 0 (0.0%) |
| 75 Years and over | 0 (0.0%) | 0 (0.0%) |
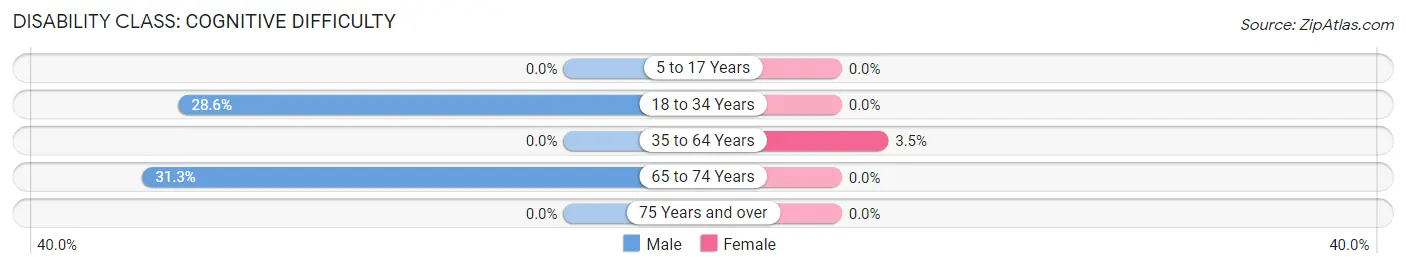
Disability Class: Cognitive Difficulty
| Age Bracket | Male | Female |
| 5 to 17 Years | 0 (0.0%) | 0 (0.0%) |
| 18 to 34 Years | 2 (28.6%) | 0 (0.0%) |
| 35 to 64 Years | 0 (0.0%) | 2 (3.5%) |
| 65 to 74 Years | 5 (31.2%) | 0 (0.0%) |
| 75 Years and over | 0 (0.0%) | 0 (0.0%) |
Disability Class: Ambulatory Difficulty
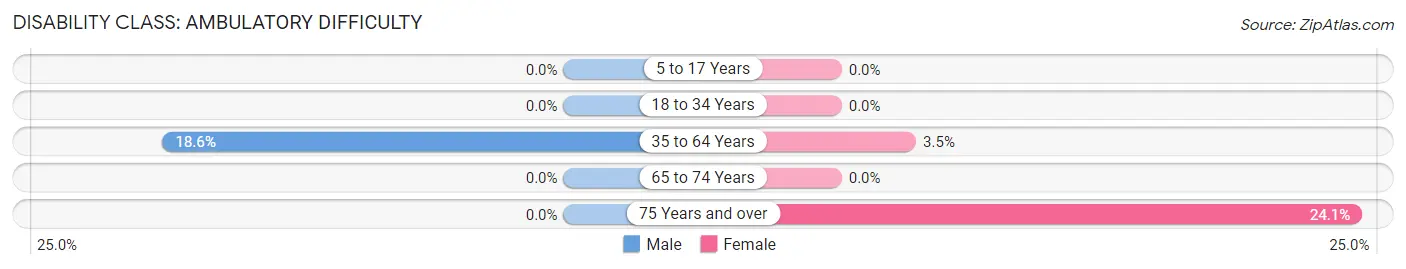
| Age Bracket | Male | Female |
| 5 to 17 Years | 0 (0.0%) | 0 (0.0%) |
| 18 to 34 Years | 0 (0.0%) | 0 (0.0%) |
| 35 to 64 Years | 8 (18.6%) | 2 (3.5%) |
| 65 to 74 Years | 0 (0.0%) | 0 (0.0%) |
| 75 Years and over | 0 (0.0%) | 7 (24.1%) |
Disability Class: Self-Care Difficulty
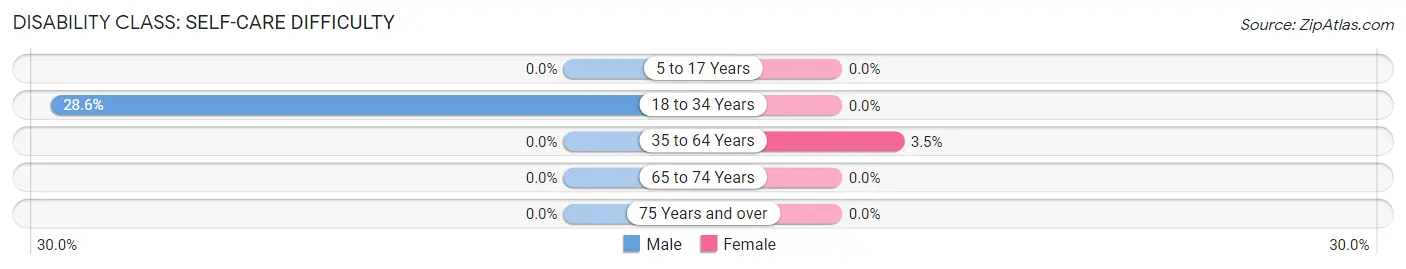
| Age Bracket | Male | Female |
| 5 to 17 Years | 0 (0.0%) | 0 (0.0%) |
| 18 to 34 Years | 2 (28.6%) | 0 (0.0%) |
| 35 to 64 Years | 0 (0.0%) | 2 (3.5%) |
| 65 to 74 Years | 0 (0.0%) | 0 (0.0%) |
| 75 Years and over | 0 (0.0%) | 0 (0.0%) |
Technology Access in Stanford
Computing Device Access in Stanford
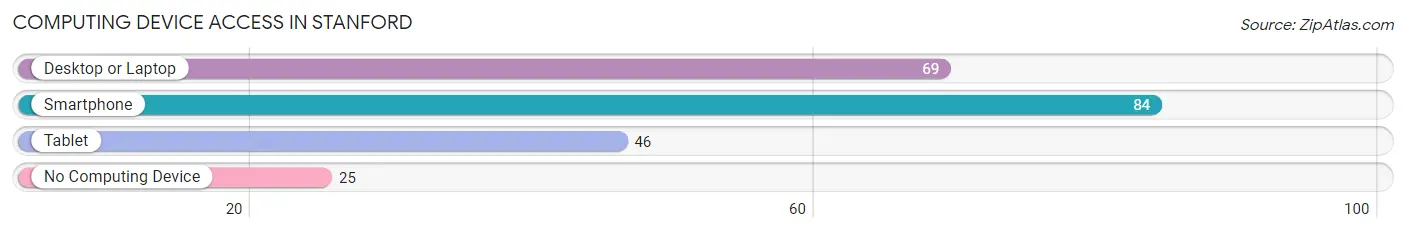
| Device Type | # Households | % Households |
| Desktop or Laptop | 69 | 54.8% |
| Smartphone | 84 | 66.7% |
| Tablet | 46 | 36.5% |
| No Computing Device | 25 | 19.8% |
| Total | 126 | 100.0% |
Internet Access in Stanford
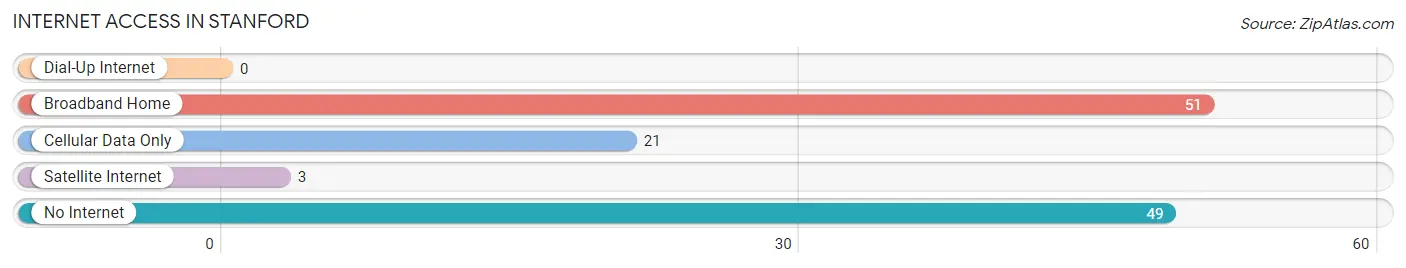
| Internet Type | # Households | % Households |
| Dial-Up Internet | 0 | 0.0% |
| Broadband Home | 51 | 40.5% |
| Cellular Data Only | 21 | 16.7% |
| Satellite Internet | 3 | 2.4% |
| No Internet | 49 | 38.9% |
| Total | 126 | 100.0% |
Stanford Summary
Stanford, Montana is a small town located in Judith Basin County in the north-central part of the state. It is situated on the banks of the Missouri River, and is surrounded by rolling hills and prairies. The town was founded in 1883 by the Northern Pacific Railroad, and was named after Leland Stanford, the railroad’s president.
Geography
Stanford is located in the north-central part of Montana, in Judith Basin County. It is situated on the banks of the Missouri River, and is surrounded by rolling hills and prairies. The town is located at an elevation of 3,400 feet, and has a total area of 0.7 square miles. The climate is semi-arid, with hot summers and cold winters.
Economy
The economy of Stanford is largely based on agriculture and ranching. The town is home to several large ranches, and the surrounding area is used for cattle and sheep grazing. The town also has a small manufacturing sector, with several small businesses producing a variety of products. Tourism is also an important part of the local economy, with visitors coming to the area to enjoy the natural beauty and outdoor activities.
Demographics
As of the 2010 census, Stanford had a population of 545 people. The racial makeup of the town was 95.3% White, 0.2% African American, 0.7% Native American, 0.2% Asian, 0.2% Pacific Islander, and 3.6% from other races. The median household income was $31,250, and the median family income was $37,500. The per capita income was $17,845.
History
Stanford was founded in 1883 by the Northern Pacific Railroad. The town was named after Leland Stanford, the railroad’s president. The town quickly grew, and by the early 1900s it had become a bustling center of commerce and industry. The town was home to several large ranches, and the surrounding area was used for cattle and sheep grazing.
In the early 1900s, Stanford was also home to a large Chinese population. The Chinese immigrants had come to the area to work on the railroad, and many of them stayed and opened businesses in the town. The Chinese population peaked in the 1920s, but declined in the following decades due to anti-Chinese sentiment and restrictive immigration laws.
In the late 20th century, Stanford experienced a period of economic decline. Many of the town’s businesses closed, and the population began to decline. In recent years, however, the town has seen a resurgence in economic activity. The town is now home to several small businesses, and the surrounding area is used for cattle and sheep grazing. Tourism is also an important part of the local economy, with visitors coming to the area to enjoy the natural beauty and outdoor activities.
Common Questions
What is Per Capita Income in Stanford?
Per Capita income in Stanford is $49,310.
What is the Median Family Income in Stanford?
Median Family Income in Stanford is $88,438.
What is the Median Household income in Stanford?
Median Household Income in Stanford is $46,250.
What is Inequality or Gini Index in Stanford?
Inequality or Gini Index in Stanford is 0.66.
What is the Total Population of Stanford?
Total Population of Stanford is 229.
What is the Total Male Population of Stanford?
Total Male Population of Stanford is 111.
What is the Total Female Population of Stanford?
Total Female Population of Stanford is 118.
What is the Ratio of Males per 100 Females in Stanford?
There are 94.07 Males per 100 Females in Stanford.
What is the Ratio of Females per 100 Males in Stanford?
There are 106.31 Females per 100 Males in Stanford.
What is the Median Population Age in Stanford?
Median Population Age in Stanford is 56.3 Years.
What is the Average Family Size in Stanford
Average Family Size in Stanford is 3.0 People.
What is the Average Household Size in Stanford
Average Household Size in Stanford is 1.8 People.
How Large is the Labor Force in Stanford?
There are 109 People in the Labor Forcein in Stanford.
What is the Percentage of People in the Labor Force in Stanford?
54.0% of People are in the Labor Force in Stanford.