St Ignatius, MT Map & Demographics
St Ignatius Map
St Ignatius Overview
$16,472
PER CAPITA INCOME
$54,861
AVG FAMILY INCOME
$46,250
AVG HOUSEHOLD INCOME
9.4%
WAGE / INCOME GAP [ % ]
90.6¢/ $1
WAGE / INCOME GAP [ $ ]
0.37
INEQUALITY / GINI INDEX
1,019
TOTAL POPULATION
488
MALE POPULATION
531
FEMALE POPULATION
91.90
MALES / 100 FEMALES
108.81
FEMALES / 100 MALES
28.7
MEDIAN AGE
4.0
AVG FAMILY SIZE
3.3
AVG HOUSEHOLD SIZE
350
LABOR FORCE [ PEOPLE ]
52.8%
PERCENT IN LABOR FORCE
6.9%
UNEMPLOYMENT RATE
St Ignatius Area Codes
Income in St Ignatius
Income Overview in St Ignatius
Per Capita Income in St Ignatius is $16,472, while median incomes of families and households are $54,861 and $46,250 respectively.
| Characteristic | Number | Measure |
| Per Capita Income | 1,019 | $16,472 |
| Median Family Income | 195 | $54,861 |
| Mean Family Income | 195 | $58,595 |
| Median Household Income | 307 | $46,250 |
| Mean Household Income | 307 | $49,278 |
| Income Deficit | 195 | $0 |
| Wage / Income Gap (%) | 1,019 | 9.43% |
| Wage / Income Gap ($) | 1,019 | 90.57¢ per $1 |
| Gini / Inequality Index | 1,019 | 0.37 |
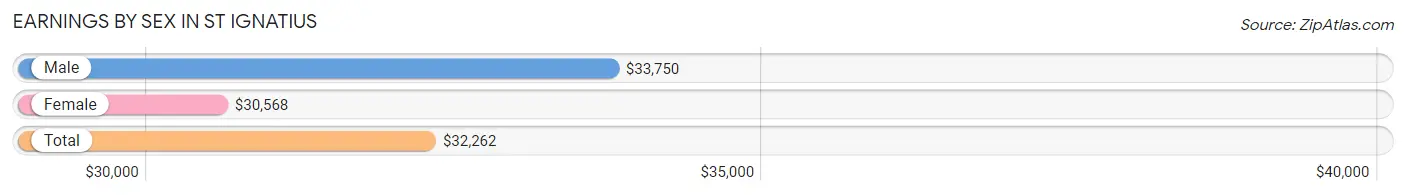
Earnings by Sex in St Ignatius
Average Earnings in St Ignatius are $32,262, $33,750 for men and $30,568 for women, a difference of 9.4%.
| Sex | Number | Average Earnings |
| Male | 169 (44.7%) | $33,750 |
| Female | 209 (55.3%) | $30,568 |
| Total | 378 (100.0%) | $32,262 |
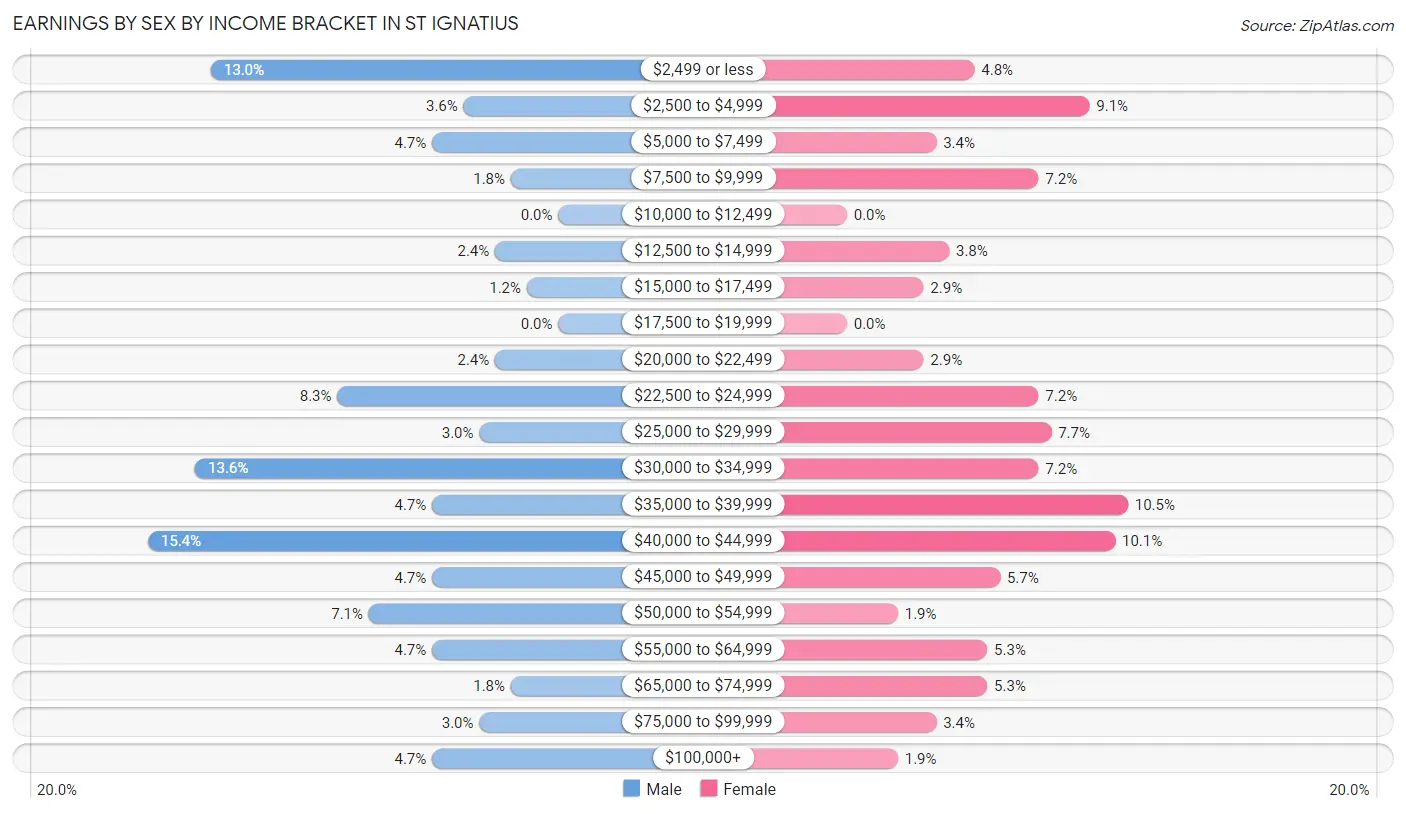
Earnings by Sex by Income Bracket in St Ignatius
The most common earnings brackets in St Ignatius are $40,000 to $44,999 for men (26 | 15.4%) and $35,000 to $39,999 for women (22 | 10.5%).
| Income | Male | Female |
| $2,499 or less | 22 (13.0%) | 10 (4.8%) |
| $2,500 to $4,999 | 6 (3.5%) | 19 (9.1%) |
| $5,000 to $7,499 | 8 (4.7%) | 7 (3.4%) |
| $7,500 to $9,999 | 3 (1.8%) | 15 (7.2%) |
| $10,000 to $12,499 | 0 (0.0%) | 0 (0.0%) |
| $12,500 to $14,999 | 4 (2.4%) | 8 (3.8%) |
| $15,000 to $17,499 | 2 (1.2%) | 6 (2.9%) |
| $17,500 to $19,999 | 0 (0.0%) | 0 (0.0%) |
| $20,000 to $22,499 | 4 (2.4%) | 6 (2.9%) |
| $22,500 to $24,999 | 14 (8.3%) | 15 (7.2%) |
| $25,000 to $29,999 | 5 (3.0%) | 16 (7.7%) |
| $30,000 to $34,999 | 23 (13.6%) | 15 (7.2%) |
| $35,000 to $39,999 | 8 (4.7%) | 22 (10.5%) |
| $40,000 to $44,999 | 26 (15.4%) | 21 (10.1%) |
| $45,000 to $49,999 | 8 (4.7%) | 12 (5.7%) |
| $50,000 to $54,999 | 12 (7.1%) | 4 (1.9%) |
| $55,000 to $64,999 | 8 (4.7%) | 11 (5.3%) |
| $65,000 to $74,999 | 3 (1.8%) | 11 (5.3%) |
| $75,000 to $99,999 | 5 (3.0%) | 7 (3.4%) |
| $100,000+ | 8 (4.7%) | 4 (1.9%) |
| Total | 169 (100.0%) | 209 (100.0%) |
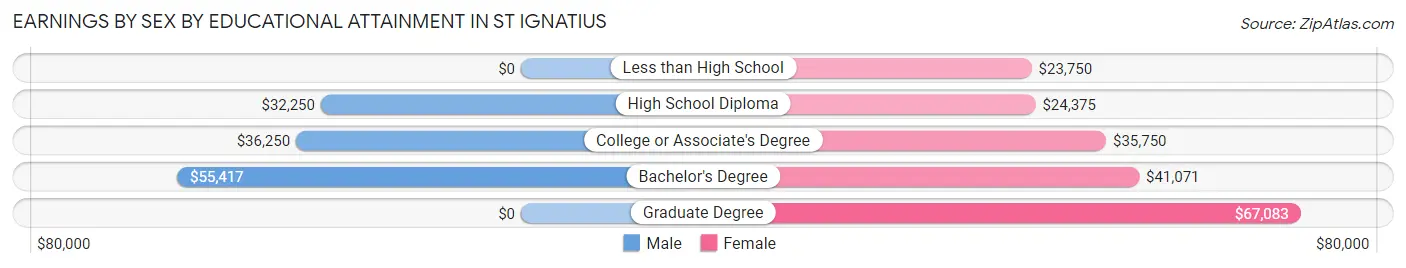
Earnings by Sex by Educational Attainment in St Ignatius
Average earnings in St Ignatius are $35,625 for men and $36,250 for women, a difference of 1.7%. Men with an educational attainment of bachelor's degree enjoy the highest average annual earnings of $55,417, while those with high school diploma education earn the least with $32,250. Women with an educational attainment of graduate degree earn the most with the average annual earnings of $67,083, while those with less than high school education have the smallest earnings of $23,750.
| Educational Attainment | Male Income | Female Income |
| Less than High School | - | - |
| High School Diploma | $32,250 | $24,375 |
| College or Associate's Degree | $36,250 | $35,750 |
| Bachelor's Degree | $55,417 | $41,071 |
| Graduate Degree | - | - |
| Total | $35,625 | $36,250 |
Family Income in St Ignatius
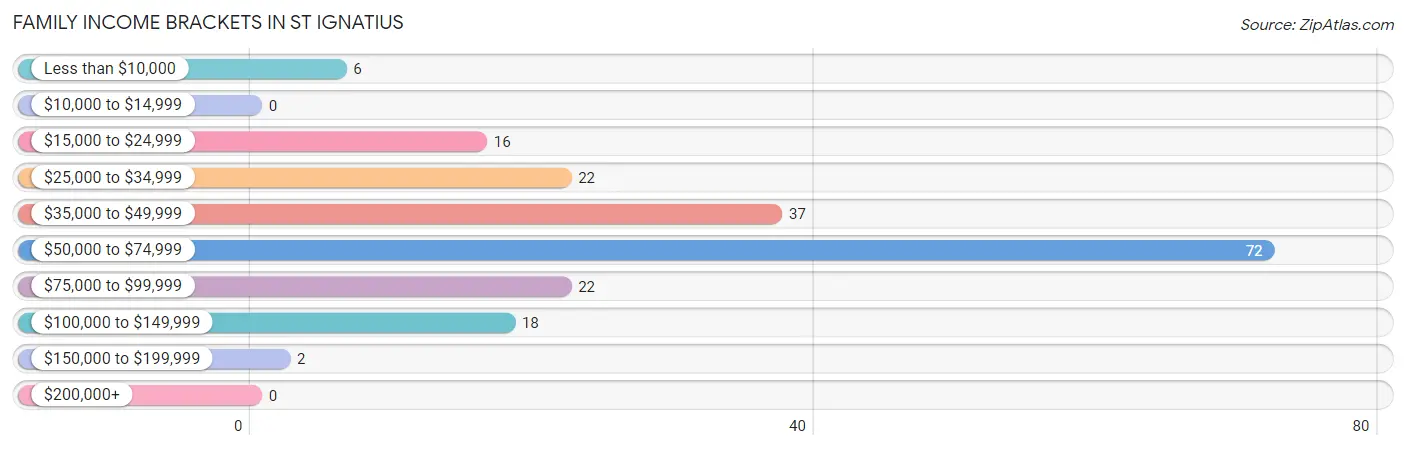
Family Income Brackets in St Ignatius
According to the St Ignatius family income data, there are 72 families falling into the $50,000 to $74,999 income range, which is the most common income bracket and makes up 36.9% of all families.
| Income Bracket | # Families | % Families |
| Less than $10,000 | 6 | 3.1% |
| $10,000 to $14,999 | 0 | 0.0% |
| $15,000 to $24,999 | 16 | 8.2% |
| $25,000 to $34,999 | 22 | 11.3% |
| $35,000 to $49,999 | 37 | 19.0% |
| $50,000 to $74,999 | 72 | 36.9% |
| $75,000 to $99,999 | 22 | 11.3% |
| $100,000 to $149,999 | 18 | 9.2% |
| $150,000 to $199,999 | 2 | 1.0% |
| $200,000+ | 0 | 0.0% |
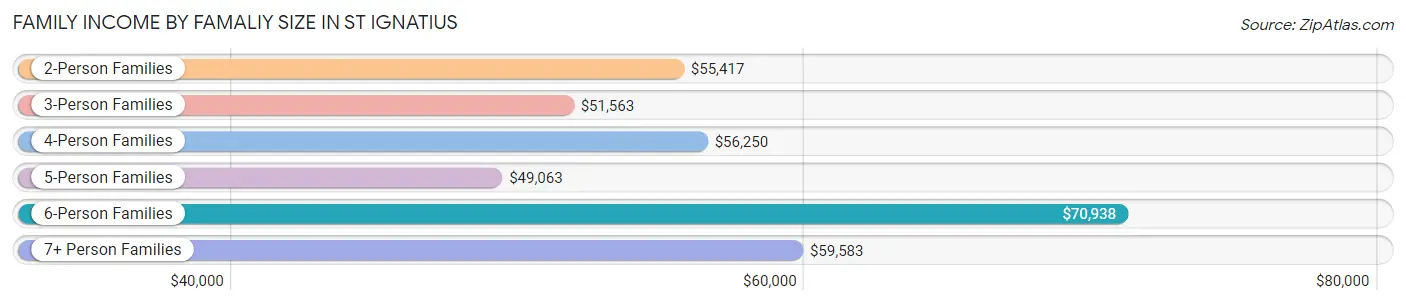
Family Income by Famaliy Size in St Ignatius
6-person families (14 | 7.2%) account for the highest median family income in St Ignatius with $70,938 per family, while 2-person families (84 | 43.1%) have the highest median income of $27,708 per family member.
| Income Bracket | # Families | Median Income |
| 2-Person Families | 84 (43.1%) | $55,417 |
| 3-Person Families | 39 (20.0%) | $51,563 |
| 4-Person Families | 24 (12.3%) | $56,250 |
| 5-Person Families | 25 (12.8%) | $49,063 |
| 6-Person Families | 14 (7.2%) | $70,938 |
| 7+ Person Families | 9 (4.6%) | $59,583 |
| Total | 195 (100.0%) | $54,861 |
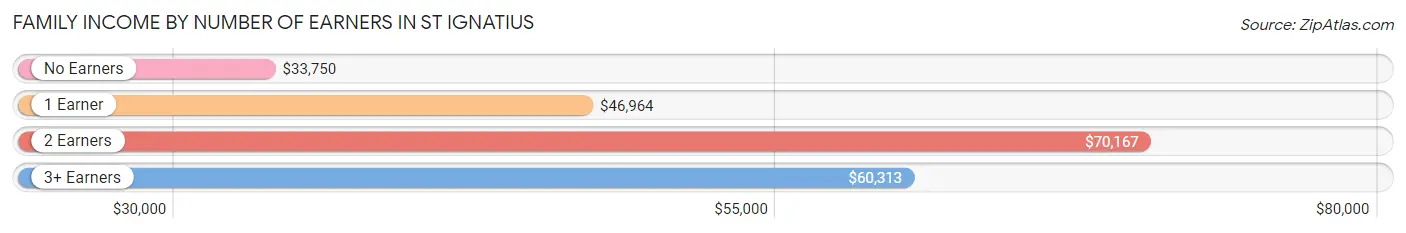
Family Income by Number of Earners in St Ignatius
The median family income in St Ignatius is $54,861, with families comprising 2 earners (70) having the highest median family income of $70,167, while families with no earners (35) have the lowest median family income of $33,750, accounting for 35.9% and 17.9% of families, respectively.
| Number of Earners | # Families | Median Income |
| No Earners | 35 (17.9%) | $33,750 |
| 1 Earner | 75 (38.5%) | $46,964 |
| 2 Earners | 70 (35.9%) | $70,167 |
| 3+ Earners | 15 (7.7%) | $60,313 |
| Total | 195 (100.0%) | $54,861 |
Household Income in St Ignatius
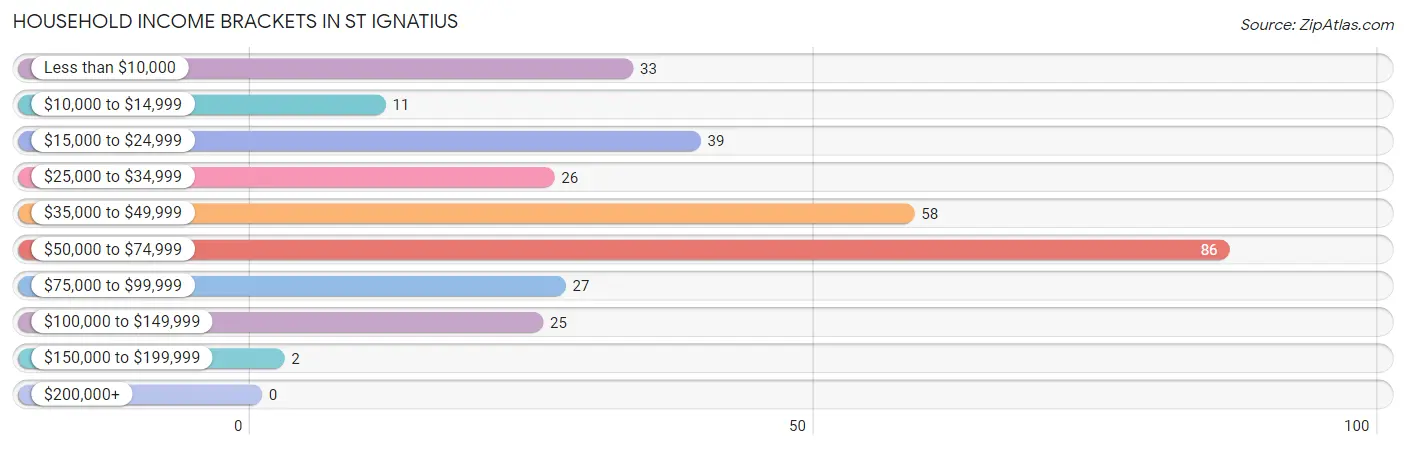
Household Income Brackets in St Ignatius
With 86 households falling in the category, the $50,000 to $74,999 income range is the most frequent in St Ignatius, accounting for 28.0% of all households.
| Income Bracket | # Households | % Households |
| Less than $10,000 | 33 | 10.7% |
| $10,000 to $14,999 | 11 | 3.6% |
| $15,000 to $24,999 | 39 | 12.7% |
| $25,000 to $34,999 | 26 | 8.5% |
| $35,000 to $49,999 | 58 | 18.9% |
| $50,000 to $74,999 | 86 | 28.0% |
| $75,000 to $99,999 | 27 | 8.8% |
| $100,000 to $149,999 | 25 | 8.1% |
| $150,000 to $199,999 | 2 | 0.7% |
| $200,000+ | 0 | 0.0% |
Household Income by Householder Age in St Ignatius
The median household income in St Ignatius is $46,250, with the highest median household income of $55,833 found in the 25 to 44 years age bracket for the primary householder. A total of 110 households (35.8%) fall into this category. Meanwhile, the 65+ years age bracket for the primary householder has the lowest median household income of $27,813, with 93 households (30.3%) in this group.
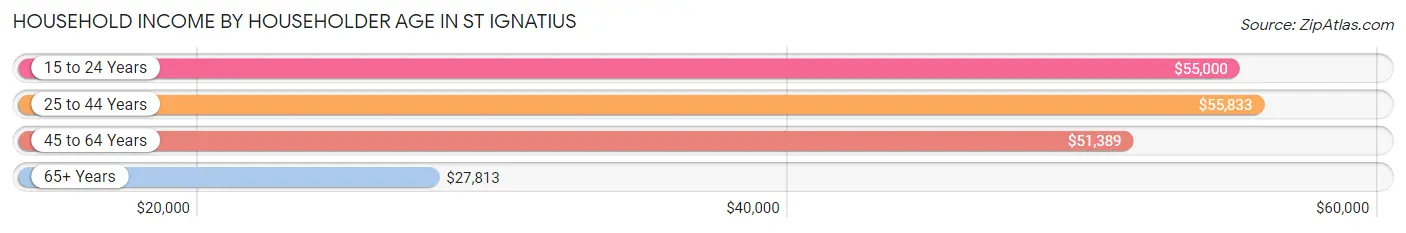
| Income Bracket | # Households | Median Income |
| 15 to 24 Years | 22 (7.2%) | $55,000 |
| 25 to 44 Years | 110 (35.8%) | $55,833 |
| 45 to 64 Years | 82 (26.7%) | $51,389 |
| 65+ Years | 93 (30.3%) | $27,813 |
| Total | 307 (100.0%) | $46,250 |
Poverty in St Ignatius
Income Below Poverty by Sex and Age in St Ignatius
With 15.0% poverty level for males and 17.6% for females among the residents of St Ignatius, 12 to 14 year old males and 16 and 17 year old females are the most vulnerable to poverty, with 8 males (44.4%) and 3 females (60.0%) in their respective age groups living below the poverty level.
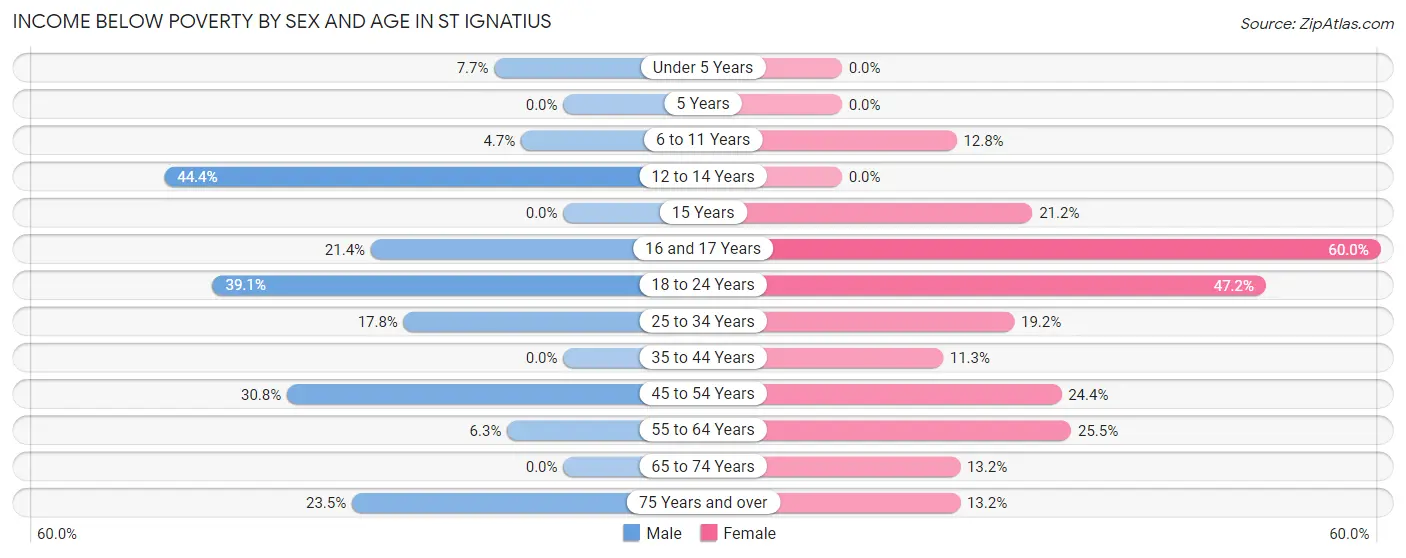
| Age Bracket | Male | Female |
| Under 5 Years | 4 (7.7%) | 0 (0.0%) |
| 5 Years | 0 (0.0%) | 0 (0.0%) |
| 6 to 11 Years | 4 (4.7%) | 6 (12.8%) |
| 12 to 14 Years | 8 (44.4%) | 0 (0.0%) |
| 15 Years | 0 (0.0%) | 7 (21.2%) |
| 16 and 17 Years | 3 (21.4%) | 3 (60.0%) |
| 18 to 24 Years | 25 (39.1%) | 17 (47.2%) |
| 25 to 34 Years | 8 (17.8%) | 14 (19.2%) |
| 35 to 44 Years | 0 (0.0%) | 9 (11.3%) |
| 45 to 54 Years | 8 (30.8%) | 11 (24.4%) |
| 55 to 64 Years | 2 (6.2%) | 12 (25.5%) |
| 65 to 74 Years | 0 (0.0%) | 5 (13.2%) |
| 75 Years and over | 8 (23.5%) | 5 (13.2%) |
| Total | 70 (15.0%) | 89 (17.6%) |
Income Above Poverty by Sex and Age in St Ignatius
According to the poverty statistics in St Ignatius, males aged 5 years and females aged under 5 years are the age groups that are most secure financially, with 100.0% of males and 100.0% of females in these age groups living above the poverty line.
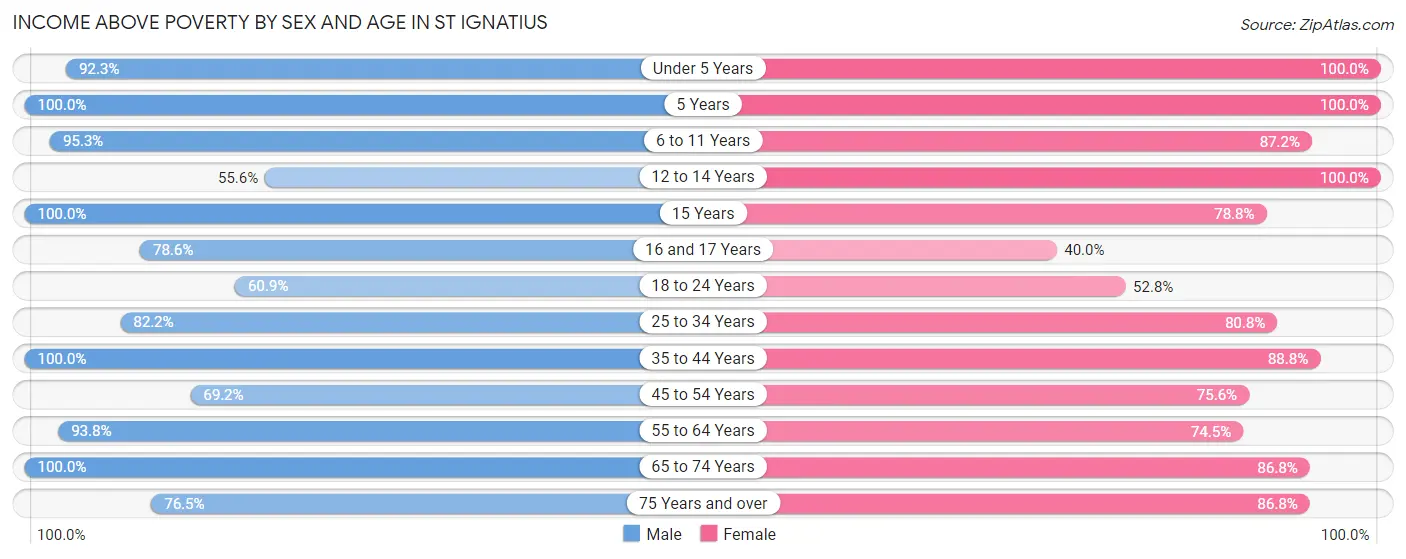
| Age Bracket | Male | Female |
| Under 5 Years | 48 (92.3%) | 20 (100.0%) |
| 5 Years | 6 (100.0%) | 15 (100.0%) |
| 6 to 11 Years | 81 (95.3%) | 41 (87.2%) |
| 12 to 14 Years | 10 (55.6%) | 28 (100.0%) |
| 15 Years | 5 (100.0%) | 26 (78.8%) |
| 16 and 17 Years | 11 (78.6%) | 2 (40.0%) |
| 18 to 24 Years | 39 (60.9%) | 19 (52.8%) |
| 25 to 34 Years | 37 (82.2%) | 59 (80.8%) |
| 35 to 44 Years | 58 (100.0%) | 71 (88.7%) |
| 45 to 54 Years | 18 (69.2%) | 34 (75.6%) |
| 55 to 64 Years | 30 (93.8%) | 35 (74.5%) |
| 65 to 74 Years | 28 (100.0%) | 33 (86.8%) |
| 75 Years and over | 26 (76.5%) | 33 (86.8%) |
| Total | 397 (85.0%) | 416 (82.4%) |
Income Below Poverty Among Married-Couple Families in St Ignatius
The poverty statistics for married-couple families in St Ignatius show that 4.2% or 5 of the total 118 families live below the poverty line. Families with 3 or 4 children have the highest poverty rate of 15.1%, comprising of 5 families. On the other hand, families with no children have the lowest poverty rate of 0.0%, which includes 0 families.
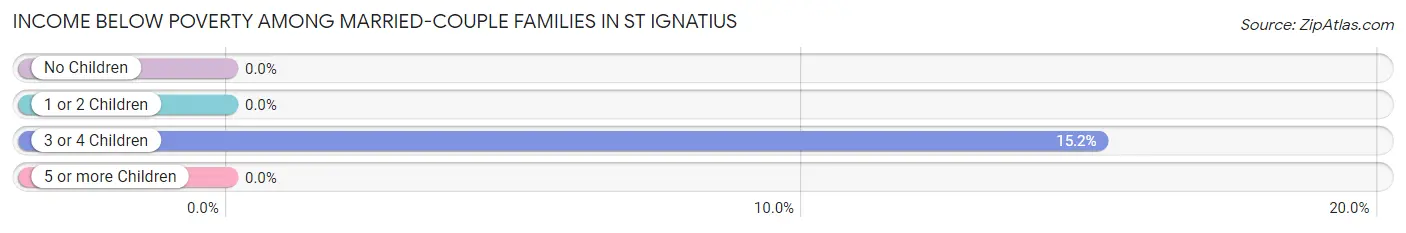
| Children | Above Poverty | Below Poverty |
| No Children | 46 (100.0%) | 0 (0.0%) |
| 1 or 2 Children | 35 (100.0%) | 0 (0.0%) |
| 3 or 4 Children | 28 (84.9%) | 5 (15.1%) |
| 5 or more Children | 4 (100.0%) | 0 (0.0%) |
| Total | 113 (95.8%) | 5 (4.2%) |
Income Below Poverty Among Single-Parent Households in St Ignatius
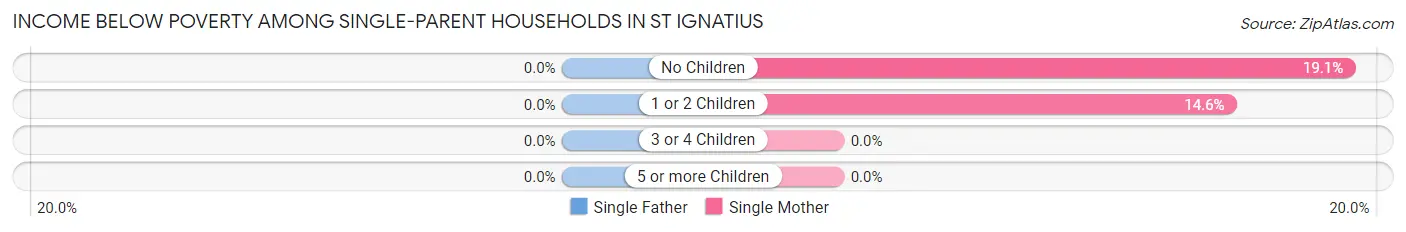
| Children | Single Father | Single Mother |
| No Children | 0 (0.0%) | 4 (19.1%) |
| 1 or 2 Children | 0 (0.0%) | 6 (14.6%) |
| 3 or 4 Children | 0 (0.0%) | 0 (0.0%) |
| 5 or more Children | 0 (0.0%) | 0 (0.0%) |
| Total | 0 (0.0%) | 10 (15.4%) |
Income Below Poverty Among Married-Couple vs Single-Parent Households in St Ignatius
The poverty data for St Ignatius shows that 5 of the married-couple family households (4.2%) and 10 of the single-parent households (13.0%) are living below the poverty level. Within the married-couple family households, those with 3 or 4 children have the highest poverty rate, with 5 households (15.1%) falling below the poverty line. Among the single-parent households, those with no children have the highest poverty rate, with 4 household (16.7%) living below poverty.
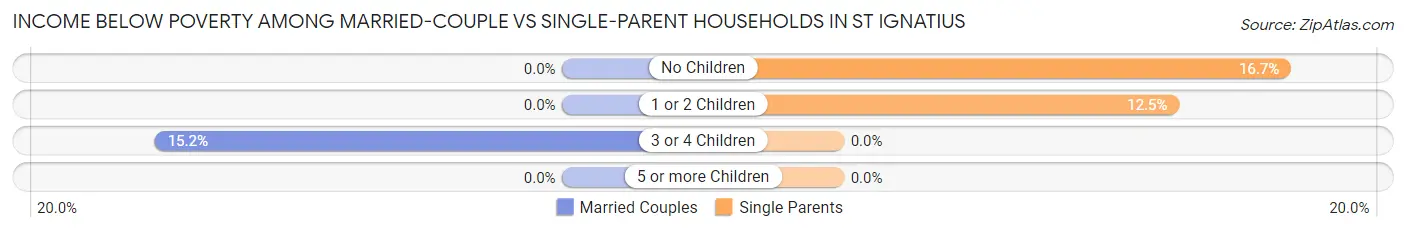
| Children | Married-Couple Families | Single-Parent Households |
| No Children | 0 (0.0%) | 4 (16.7%) |
| 1 or 2 Children | 0 (0.0%) | 6 (12.5%) |
| 3 or 4 Children | 5 (15.1%) | 0 (0.0%) |
| 5 or more Children | 0 (0.0%) | 0 (0.0%) |
| Total | 5 (4.2%) | 10 (13.0%) |
Race in St Ignatius
The most populous races in St Ignatius are White / Caucasian (512 | 50.2%), Native / Alaskan (371 | 36.4%), and Two or more Races (127 | 12.5%).
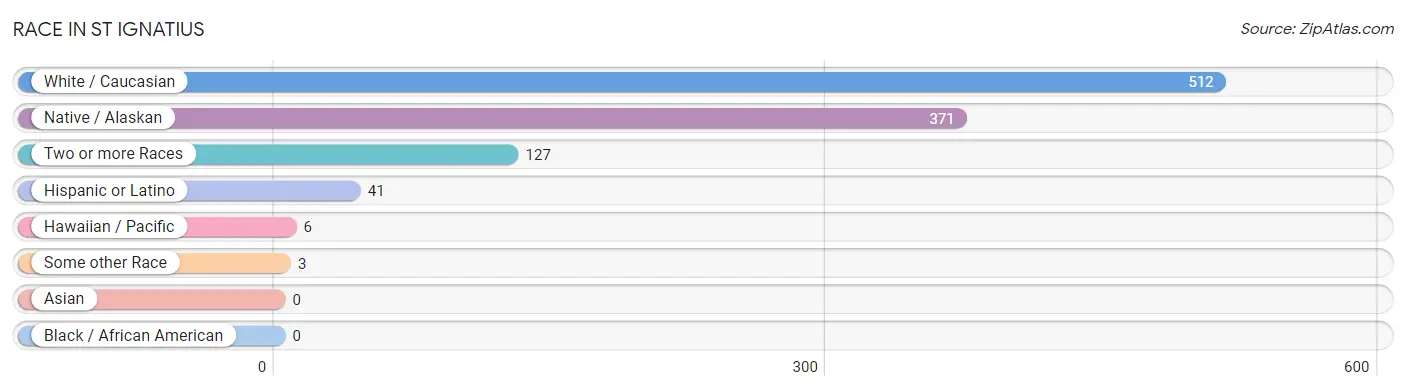
| Race | # Population | % Population |
| Asian | 0 | 0.0% |
| Black / African American | 0 | 0.0% |
| Hawaiian / Pacific | 6 | 0.6% |
| Hispanic or Latino | 41 | 4.0% |
| Native / Alaskan | 371 | 36.4% |
| White / Caucasian | 512 | 50.2% |
| Two or more Races | 127 | 12.5% |
| Some other Race | 3 | 0.3% |
| Total | 1,019 | 100.0% |
Ancestry in St Ignatius
The most populous ancestries reported in St Ignatius are German (111 | 10.9%), Irish (111 | 10.9%), English (60 | 5.9%), Crow (52 | 5.1%), and French (52 | 5.1%), together accounting for 37.9% of all St Ignatius residents.
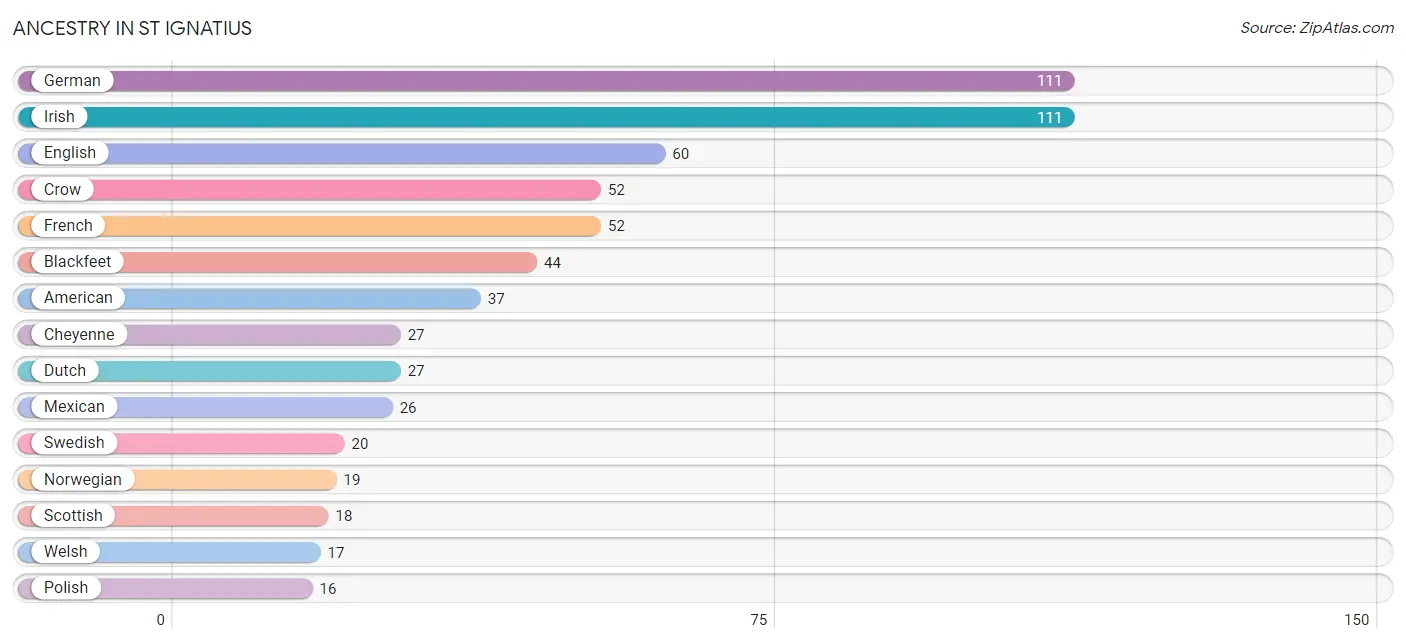
| Ancestry | # Population | % Population |
| Alaska Native | 8 | 0.8% |
| American | 37 | 3.6% |
| Apache | 6 | 0.6% |
| Blackfeet | 44 | 4.3% |
| British | 5 | 0.5% |
| Cherokee | 4 | 0.4% |
| Cheyenne | 27 | 2.6% |
| Chippewa | 12 | 1.2% |
| Crow | 52 | 5.1% |
| Danish | 2 | 0.2% |
| Dutch | 27 | 2.6% |
| English | 60 | 5.9% |
| European | 15 | 1.5% |
| French | 52 | 5.1% |
| German | 111 | 10.9% |
| Hungarian | 2 | 0.2% |
| Irish | 111 | 10.9% |
| Italian | 5 | 0.5% |
| Mexican | 26 | 2.5% |
| Norwegian | 19 | 1.9% |
| Polish | 16 | 1.6% |
| Puerto Rican | 5 | 0.5% |
| Russian | 11 | 1.1% |
| Samoan | 3 | 0.3% |
| Scottish | 18 | 1.8% |
| Sioux | 2 | 0.2% |
| South American Indian | 2 | 0.2% |
| Spaniard | 1 | 0.1% |
| Spanish | 4 | 0.4% |
| Swedish | 20 | 2.0% |
| Welsh | 17 | 1.7% |
| West Indian | 3 | 0.3% |
| Yup'ik | 12 | 1.2% | View All 33 Rows |
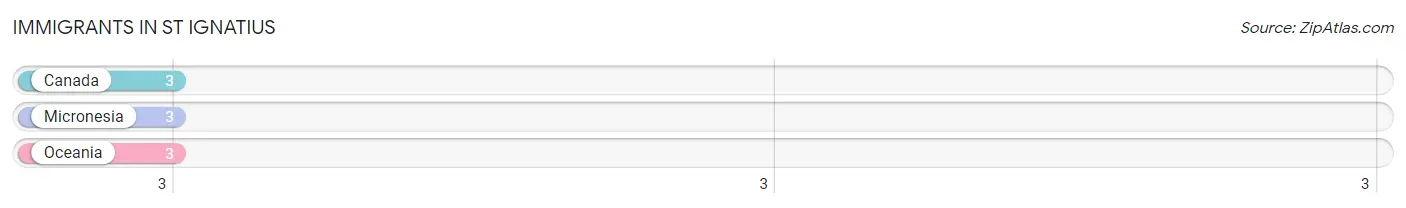
Immigrants in St Ignatius
The most numerous immigrant groups reported in St Ignatius came from Canada (3 | 0.3%), Micronesia (3 | 0.3%), and Oceania (3 | 0.3%), together accounting for 0.9% of all St Ignatius residents.
| Immigration Origin | # Population | % Population |
| Canada | 3 | 0.3% |
| Micronesia | 3 | 0.3% |
| Oceania | 3 | 0.3% | View All 3 Rows |
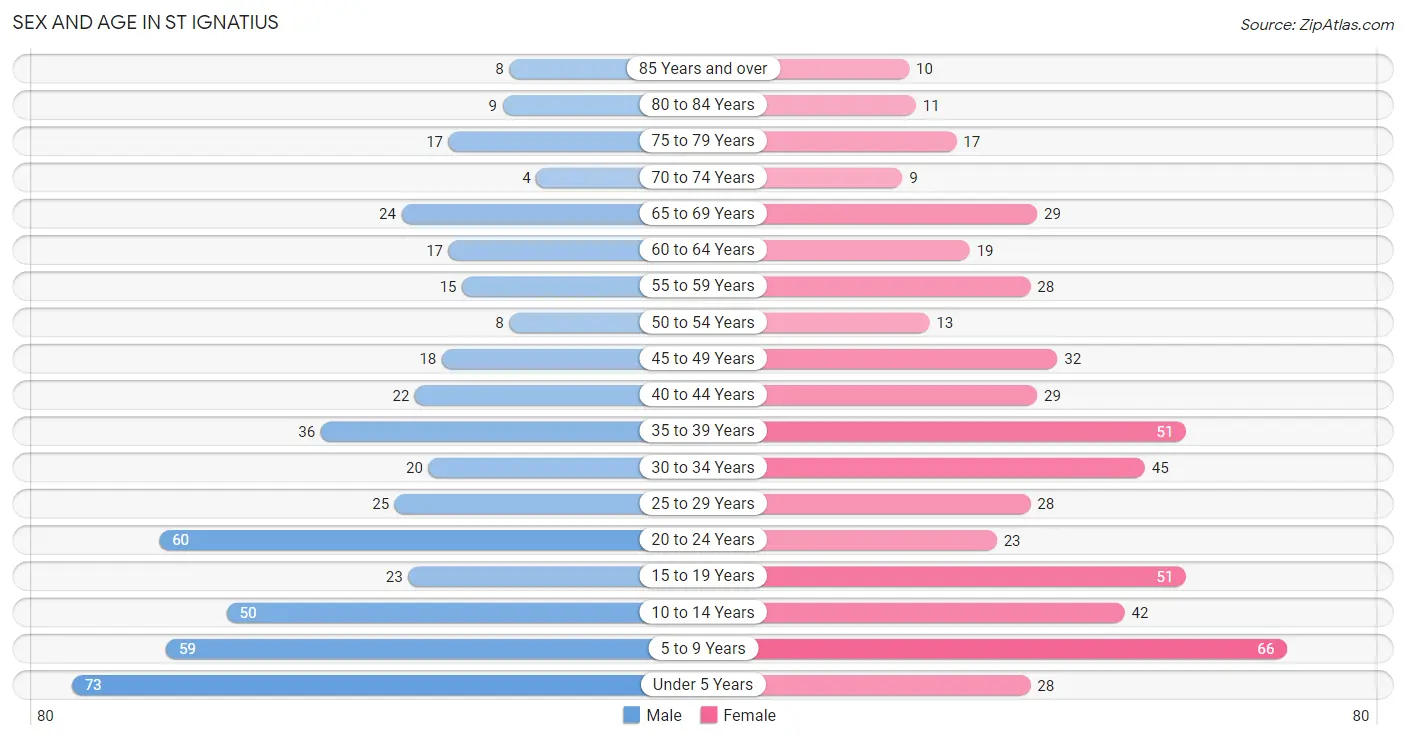
Sex and Age in St Ignatius
Sex and Age in St Ignatius
The most populous age groups in St Ignatius are Under 5 Years (73 | 15.0%) for men and 5 to 9 Years (66 | 12.4%) for women.
| Age Bracket | Male | Female |
| Under 5 Years | 73 (15.0%) | 28 (5.3%) |
| 5 to 9 Years | 59 (12.1%) | 66 (12.4%) |
| 10 to 14 Years | 50 (10.2%) | 42 (7.9%) |
| 15 to 19 Years | 23 (4.7%) | 51 (9.6%) |
| 20 to 24 Years | 60 (12.3%) | 23 (4.3%) |
| 25 to 29 Years | 25 (5.1%) | 28 (5.3%) |
| 30 to 34 Years | 20 (4.1%) | 45 (8.5%) |
| 35 to 39 Years | 36 (7.4%) | 51 (9.6%) |
| 40 to 44 Years | 22 (4.5%) | 29 (5.5%) |
| 45 to 49 Years | 18 (3.7%) | 32 (6.0%) |
| 50 to 54 Years | 8 (1.6%) | 13 (2.5%) |
| 55 to 59 Years | 15 (3.1%) | 28 (5.3%) |
| 60 to 64 Years | 17 (3.5%) | 19 (3.6%) |
| 65 to 69 Years | 24 (4.9%) | 29 (5.5%) |
| 70 to 74 Years | 4 (0.8%) | 9 (1.7%) |
| 75 to 79 Years | 17 (3.5%) | 17 (3.2%) |
| 80 to 84 Years | 9 (1.8%) | 11 (2.1%) |
| 85 Years and over | 8 (1.6%) | 10 (1.9%) |
| Total | 488 (100.0%) | 531 (100.0%) |
Families and Households in St Ignatius
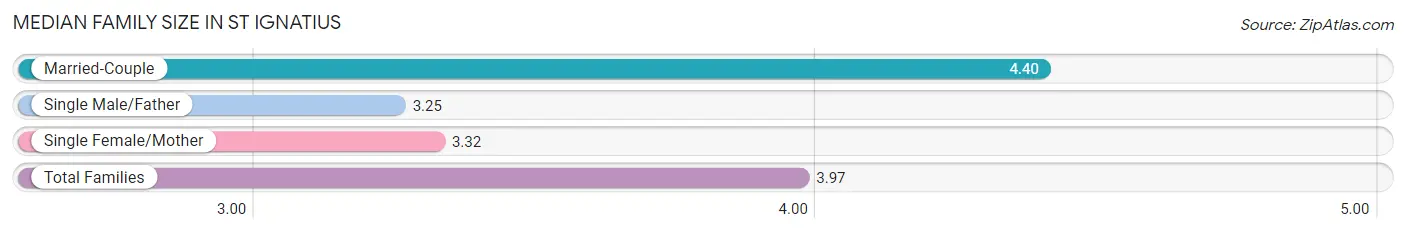
Median Family Size in St Ignatius
The median family size in St Ignatius is 3.97 persons per family, with married-couple families (118 | 60.5%) accounting for the largest median family size of 4.4 persons per family. On the other hand, single male/father families (12 | 6.1%) represent the smallest median family size with 3.25 persons per family.
| Family Type | # Families | Family Size |
| Married-Couple | 118 (60.5%) | 4.40 |
| Single Male/Father | 12 (6.1%) | 3.25 |
| Single Female/Mother | 65 (33.3%) | 3.32 |
| Total Families | 195 (100.0%) | 3.97 |
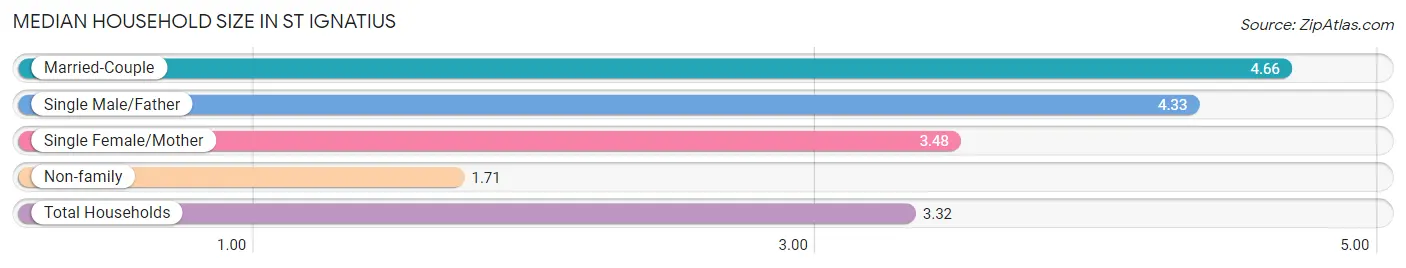
Median Household Size in St Ignatius
The median household size in St Ignatius is 3.32 persons per household, with married-couple households (118 | 38.4%) accounting for the largest median household size of 4.66 persons per household. non-family households (112 | 36.5%) represent the smallest median household size with 1.71 persons per household.
| Household Type | # Households | Household Size |
| Married-Couple | 118 (38.4%) | 4.66 |
| Single Male/Father | 12 (3.9%) | 4.33 |
| Single Female/Mother | 65 (21.2%) | 3.48 |
| Non-family | 112 (36.5%) | 1.71 |
| Total Households | 307 (100.0%) | 3.32 |
Household Size by Marriage Status in St Ignatius
Out of a total of 307 households in St Ignatius, 195 (63.5%) are family households, while 112 (36.5%) are nonfamily households. The most numerous type of family households are 2-person households, comprising 72, and the most common type of nonfamily households are 1-person households, comprising 98.
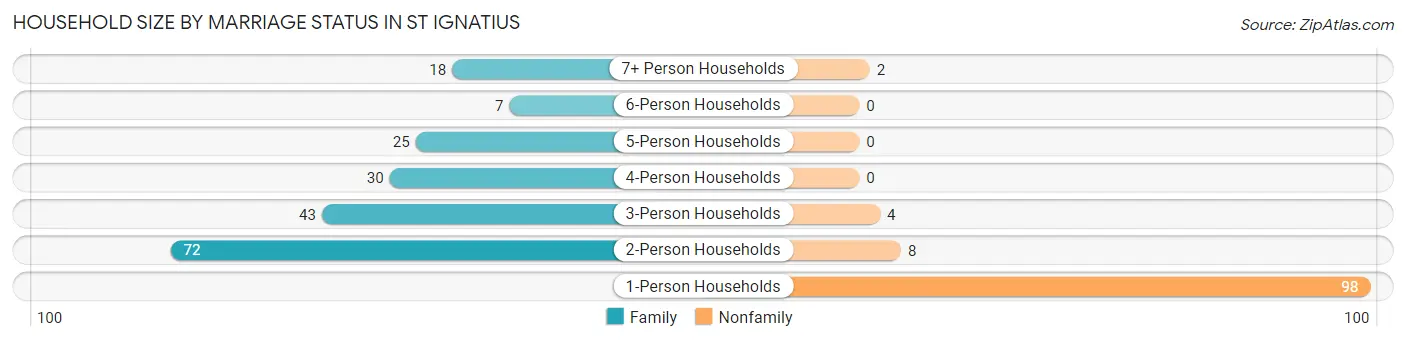
| Household Size | Family Households | Nonfamily Households |
| 1-Person Households | - | 98 (31.9%) |
| 2-Person Households | 72 (23.4%) | 8 (2.6%) |
| 3-Person Households | 43 (14.0%) | 4 (1.3%) |
| 4-Person Households | 30 (9.8%) | 0 (0.0%) |
| 5-Person Households | 25 (8.1%) | 0 (0.0%) |
| 6-Person Households | 7 (2.3%) | 0 (0.0%) |
| 7+ Person Households | 18 (5.9%) | 2 (0.6%) |
| Total | 195 (63.5%) | 112 (36.5%) |
Female Fertility in St Ignatius
Fertility by Age in St Ignatius
Average fertility rate in St Ignatius is 54.0 births per 1,000 women. Women in the age bracket of 20 to 34 years have the highest fertility rate with 146.0 births per 1,000 women. Women in the age bracket of 20 to 34 years acount for 100.0% of all women with births.
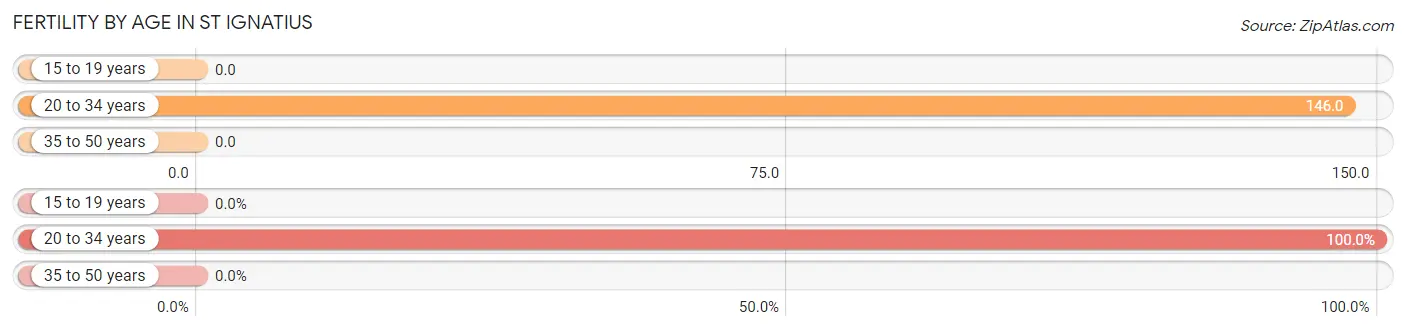
| Age Bracket | Women with Births | Births / 1,000 Women |
| 15 to 19 years | 0 (0.0%) | 0.0 |
| 20 to 34 years | 14 (100.0%) | 146.0 |
| 35 to 50 years | 0 (0.0%) | 0.0 |
| Total | 14 (100.0%) | 54.0 |
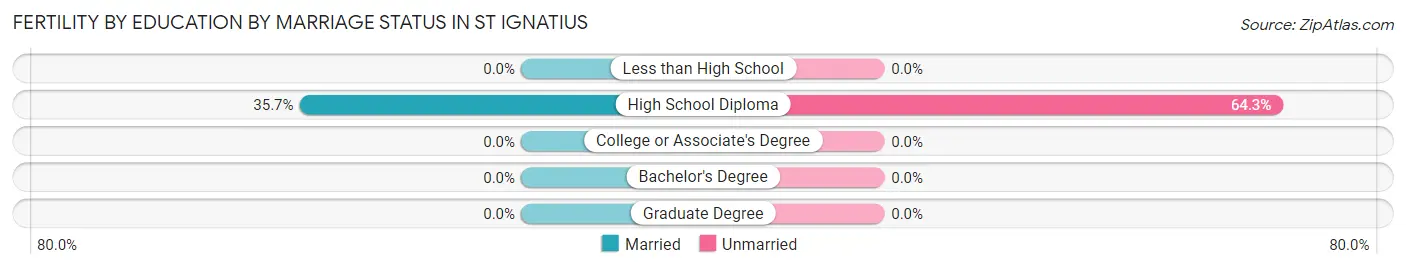
Fertility by Age by Marriage Status in St Ignatius
35.7% of women with births (14) in St Ignatius are married. The highest percentage of unmarried women with births falls into 20 to 34 years age bracket with 64.3% of them unmarried at the time of birth, while the lowest percentage of unmarried women with births belong to 20 to 34 years age bracket with 64.3% of them unmarried.
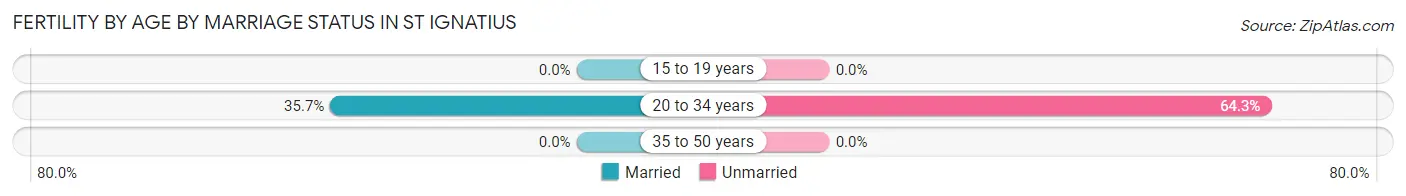
| Age Bracket | Married | Unmarried |
| 15 to 19 years | 0 (0.0%) | 0 (0.0%) |
| 20 to 34 years | 5 (35.7%) | 9 (64.3%) |
| 35 to 50 years | 0 (0.0%) | 0 (0.0%) |
| Total | 5 (35.7%) | 9 (64.3%) |
Fertility by Education in St Ignatius
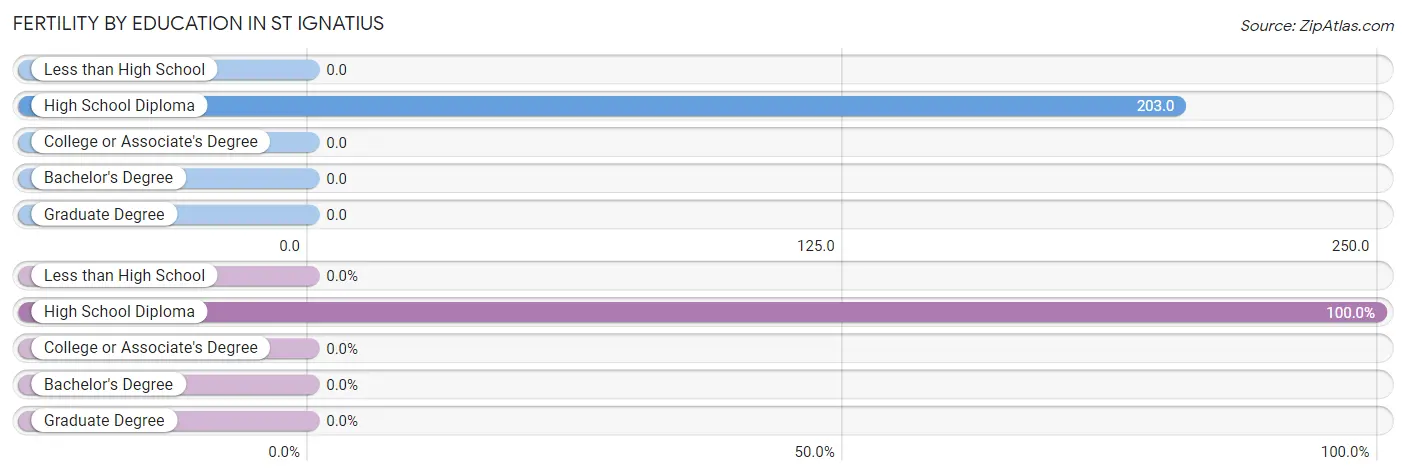
| Educational Attainment | Women with Births | Births / 1,000 Women |
| Less than High School | 0 (0.0%) | 0.0 |
| High School Diploma | 14 (100.0%) | 203.0 |
| College or Associate's Degree | 0 (0.0%) | 0.0 |
| Bachelor's Degree | 0 (0.0%) | 0.0 |
| Graduate Degree | 0 (0.0%) | 0.0 |
| Total | 14 (100.0%) | 54.0 |
Fertility by Education by Marriage Status in St Ignatius
64.3% of women with births in St Ignatius are unmarried. Women with the educational attainment of high school diploma are most likely to be married with 35.7% of them married at childbirth, while women with the educational attainment of high school diploma are least likely to be married with 64.3% of them unmarried at childbirth.
| Educational Attainment | Married | Unmarried |
| Less than High School | 0 (0.0%) | 0 (0.0%) |
| High School Diploma | 5 (35.7%) | 9 (64.3%) |
| College or Associate's Degree | 0 (0.0%) | 0 (0.0%) |
| Bachelor's Degree | 0 (0.0%) | 0 (0.0%) |
| Graduate Degree | 0 (0.0%) | 0 (0.0%) |
| Total | 5 (35.7%) | 9 (64.3%) |
Employment Characteristics in St Ignatius
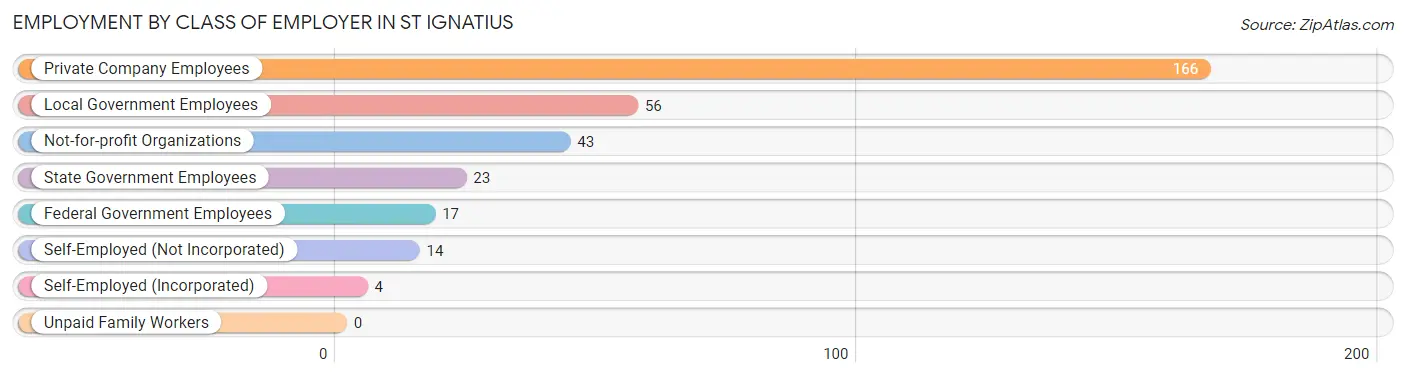
Employment by Class of Employer in St Ignatius
Among the 323 employed individuals in St Ignatius, private company employees (166 | 51.4%), local government employees (56 | 17.3%), and not-for-profit organizations (43 | 13.3%) make up the most common classes of employment.
| Employer Class | # Employees | % Employees |
| Private Company Employees | 166 | 51.4% |
| Self-Employed (Incorporated) | 4 | 1.2% |
| Self-Employed (Not Incorporated) | 14 | 4.3% |
| Not-for-profit Organizations | 43 | 13.3% |
| Local Government Employees | 56 | 17.3% |
| State Government Employees | 23 | 7.1% |
| Federal Government Employees | 17 | 5.3% |
| Unpaid Family Workers | 0 | 0.0% |
| Total | 323 | 100.0% |
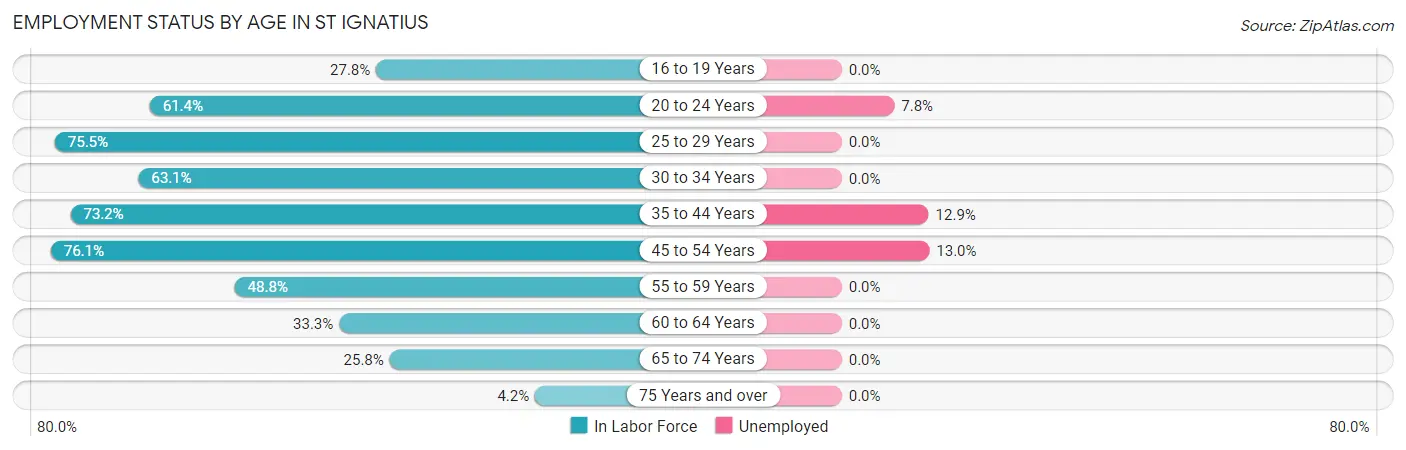
Employment Status by Age in St Ignatius
According to the labor force statistics for St Ignatius, out of the total population over 16 years of age (663), 52.8% or 350 individuals are in the labor force, with 6.9% or 24 of them unemployed. The age group with the highest labor force participation rate is 45 to 54 years, with 76.1% or 54 individuals in the labor force. Within the labor force, the 45 to 54 years age range has the highest percentage of unemployed individuals, with 13.0% or 7 of them being unemployed.
| Age Bracket | In Labor Force | Unemployed |
| 16 to 19 Years | 10 (27.8%) | 0 (0.0%) |
| 20 to 24 Years | 51 (61.4%) | 4 (7.8%) |
| 25 to 29 Years | 40 (75.5%) | 0 (0.0%) |
| 30 to 34 Years | 41 (63.1%) | 0 (0.0%) |
| 35 to 44 Years | 101 (73.2%) | 13 (12.9%) |
| 45 to 54 Years | 54 (76.1%) | 7 (13.0%) |
| 55 to 59 Years | 21 (48.8%) | 0 (0.0%) |
| 60 to 64 Years | 12 (33.3%) | 0 (0.0%) |
| 65 to 74 Years | 17 (25.8%) | 0 (0.0%) |
| 75 Years and over | 3 (4.2%) | 0 (0.0%) |
| Total | 350 (52.8%) | 24 (6.9%) |
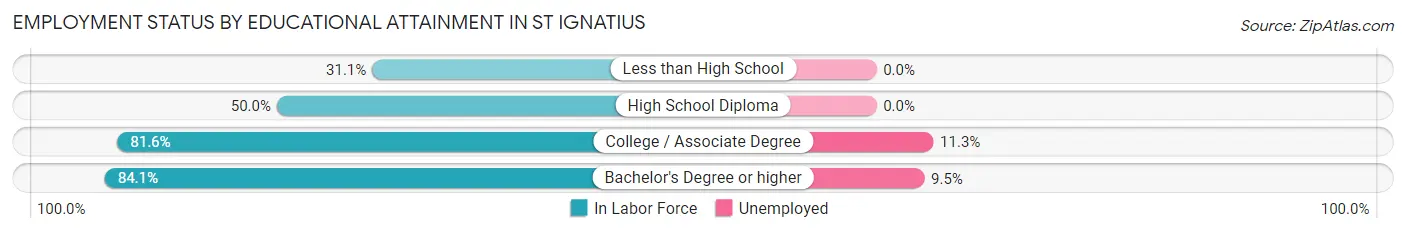
Employment Status by Educational Attainment in St Ignatius
According to labor force statistics for St Ignatius, 66.3% of individuals (269) out of the total population between 25 and 64 years of age (406) are in the labor force, with 7.4% or 20 of them being unemployed. The group with the highest labor force participation rate are those with the educational attainment of bachelor's degree or higher, with 84.1% or 74 individuals in the labor force. Within the labor force, individuals with college / associate degree education have the highest percentage of unemployment, with 11.3% or 13 of them being unemployed.
| Educational Attainment | In Labor Force | Unemployed |
| Less than High School | 14 (31.1%) | 0 (0.0%) |
| High School Diploma | 66 (50.0%) | 0 (0.0%) |
| College / Associate Degree | 115 (81.6%) | 16 (11.3%) |
| Bachelor's Degree or higher | 74 (84.1%) | 8 (9.5%) |
| Total | 269 (66.3%) | 30 (7.4%) |
Employment Occupations by Sex in St Ignatius
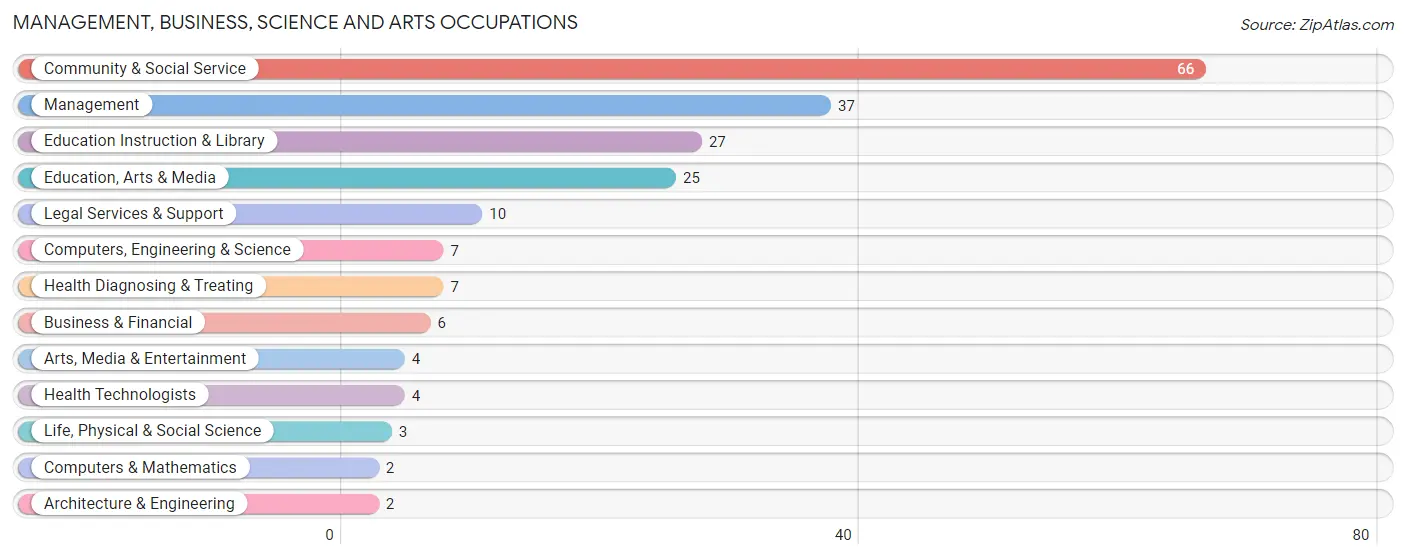
Management, Business, Science and Arts Occupations
The most common Management, Business, Science and Arts occupations in St Ignatius are Community & Social Service (66 | 20.3%), Management (37 | 11.4%), Education Instruction & Library (27 | 8.3%), Education, Arts & Media (25 | 7.7%), and Legal Services & Support (10 | 3.1%).
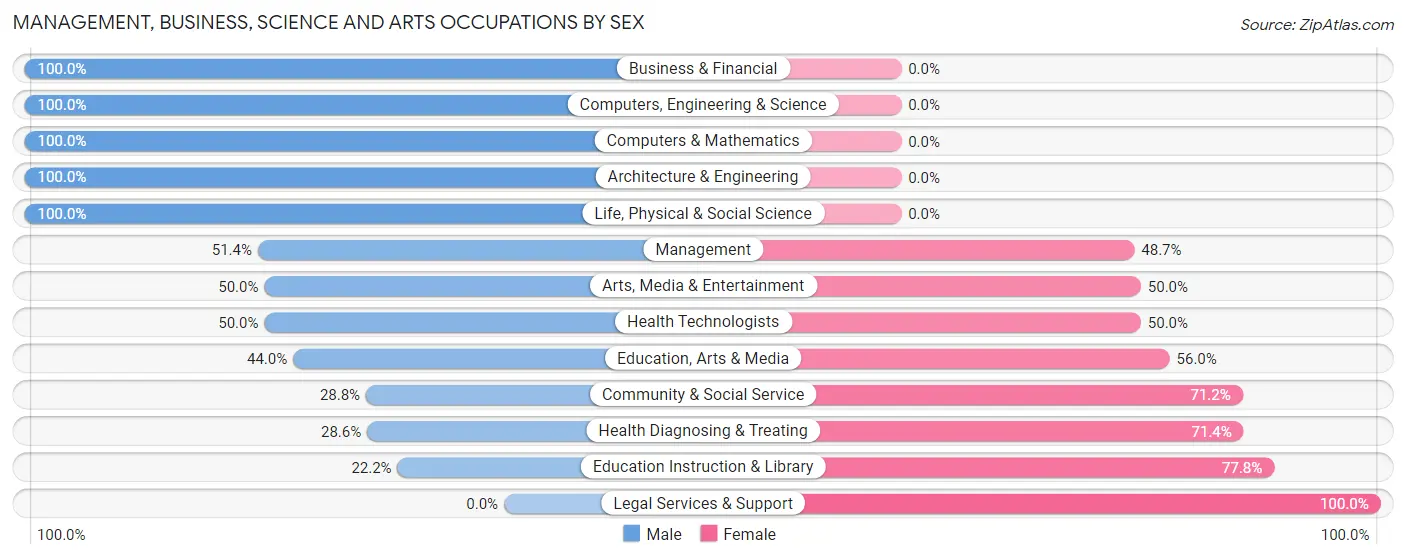
Management, Business, Science and Arts Occupations by Sex
Within the Management, Business, Science and Arts occupations in St Ignatius, the most male-oriented occupations are Business & Financial (100.0%), Computers, Engineering & Science (100.0%), and Computers & Mathematics (100.0%), while the most female-oriented occupations are Legal Services & Support (100.0%), Education Instruction & Library (77.8%), and Health Diagnosing & Treating (71.4%).
| Occupation | Male | Female |
| Management | 19 (51.3%) | 18 (48.6%) |
| Business & Financial | 6 (100.0%) | 0 (0.0%) |
| Computers, Engineering & Science | 7 (100.0%) | 0 (0.0%) |
| Computers & Mathematics | 2 (100.0%) | 0 (0.0%) |
| Architecture & Engineering | 2 (100.0%) | 0 (0.0%) |
| Life, Physical & Social Science | 3 (100.0%) | 0 (0.0%) |
| Community & Social Service | 19 (28.8%) | 47 (71.2%) |
| Education, Arts & Media | 11 (44.0%) | 14 (56.0%) |
| Legal Services & Support | 0 (0.0%) | 10 (100.0%) |
| Education Instruction & Library | 6 (22.2%) | 21 (77.8%) |
| Arts, Media & Entertainment | 2 (50.0%) | 2 (50.0%) |
| Health Diagnosing & Treating | 2 (28.6%) | 5 (71.4%) |
| Health Technologists | 2 (50.0%) | 2 (50.0%) |
| Total (Category) | 53 (43.1%) | 70 (56.9%) |
| Total (Overall) | 146 (44.8%) | 180 (55.2%) |
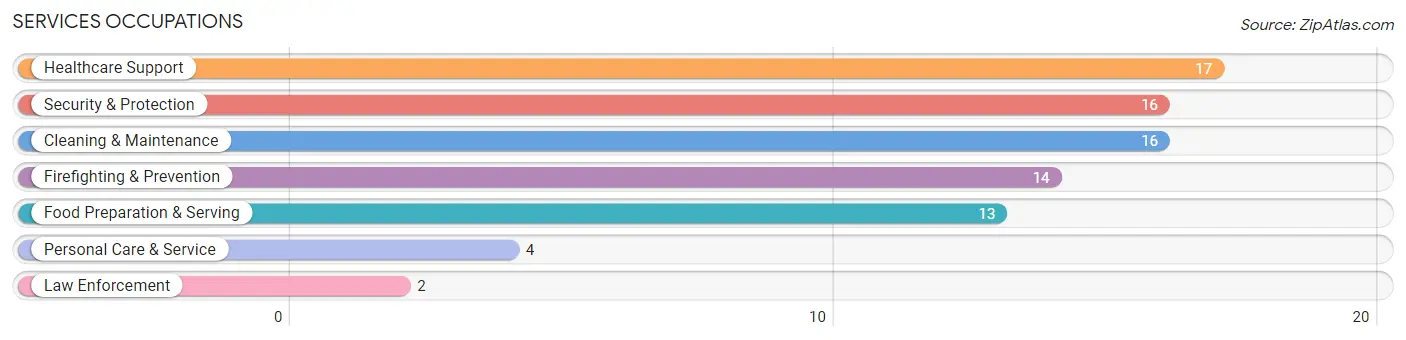
Services Occupations
The most common Services occupations in St Ignatius are Healthcare Support (17 | 5.2%), Security & Protection (16 | 4.9%), Cleaning & Maintenance (16 | 4.9%), Firefighting & Prevention (14 | 4.3%), and Food Preparation & Serving (13 | 4.0%).
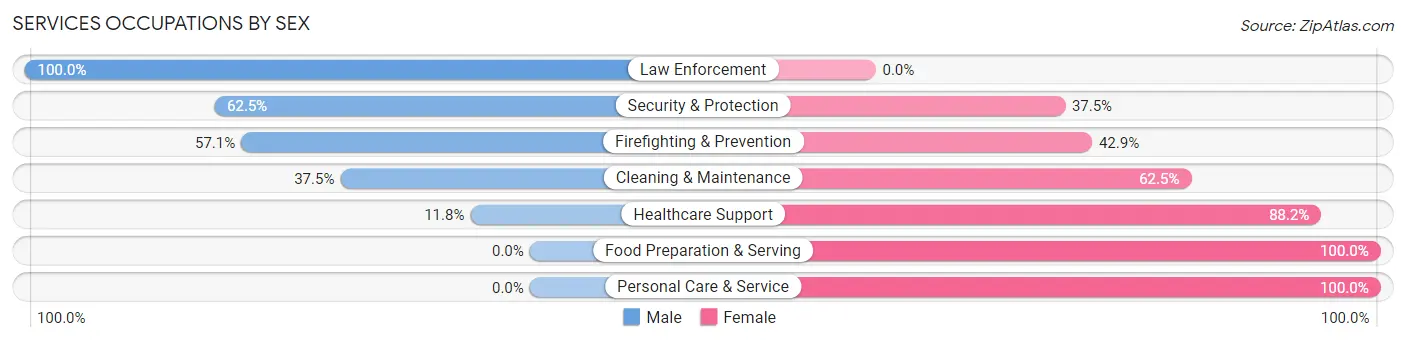
Services Occupations by Sex
Within the Services occupations in St Ignatius, the most male-oriented occupations are Law Enforcement (100.0%), Security & Protection (62.5%), and Firefighting & Prevention (57.1%), while the most female-oriented occupations are Food Preparation & Serving (100.0%), Personal Care & Service (100.0%), and Healthcare Support (88.2%).
| Occupation | Male | Female |
| Healthcare Support | 2 (11.8%) | 15 (88.2%) |
| Security & Protection | 10 (62.5%) | 6 (37.5%) |
| Firefighting & Prevention | 8 (57.1%) | 6 (42.9%) |
| Law Enforcement | 2 (100.0%) | 0 (0.0%) |
| Food Preparation & Serving | 0 (0.0%) | 13 (100.0%) |
| Cleaning & Maintenance | 6 (37.5%) | 10 (62.5%) |
| Personal Care & Service | 0 (0.0%) | 4 (100.0%) |
| Total (Category) | 18 (27.3%) | 48 (72.7%) |
| Total (Overall) | 146 (44.8%) | 180 (55.2%) |
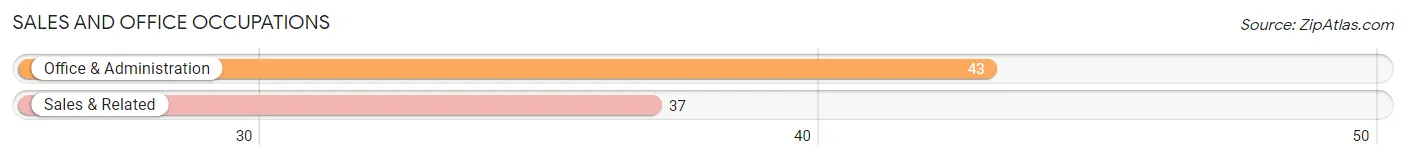
Sales and Office Occupations
The most common Sales and Office occupations in St Ignatius are Office & Administration (43 | 13.2%), and Sales & Related (37 | 11.4%).
Sales and Office Occupations by Sex
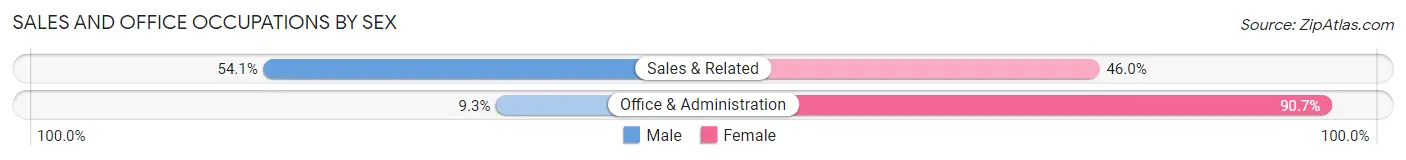
| Occupation | Male | Female |
| Sales & Related | 20 (54.0%) | 17 (46.0%) |
| Office & Administration | 4 (9.3%) | 39 (90.7%) |
| Total (Category) | 24 (30.0%) | 56 (70.0%) |
| Total (Overall) | 146 (44.8%) | 180 (55.2%) |
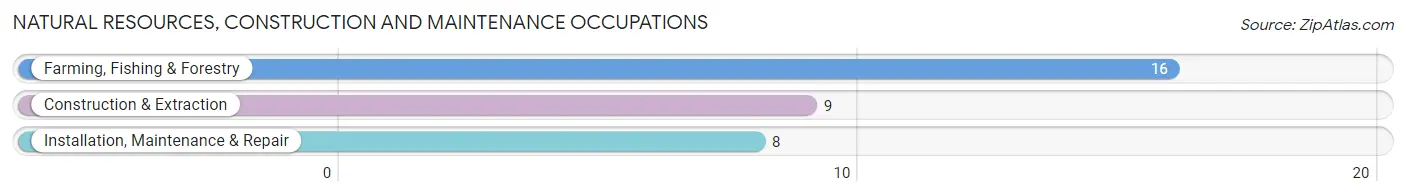
Natural Resources, Construction and Maintenance Occupations
The most common Natural Resources, Construction and Maintenance occupations in St Ignatius are Farming, Fishing & Forestry (16 | 4.9%), Construction & Extraction (9 | 2.8%), and Installation, Maintenance & Repair (8 | 2.5%).
Natural Resources, Construction and Maintenance Occupations by Sex
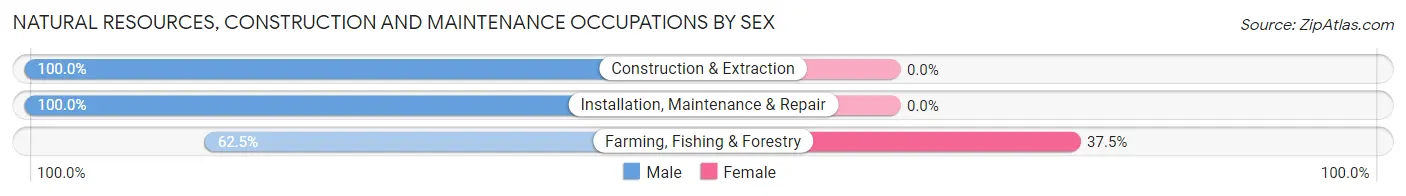
| Occupation | Male | Female |
| Farming, Fishing & Forestry | 10 (62.5%) | 6 (37.5%) |
| Construction & Extraction | 9 (100.0%) | 0 (0.0%) |
| Installation, Maintenance & Repair | 8 (100.0%) | 0 (0.0%) |
| Total (Category) | 27 (81.8%) | 6 (18.2%) |
| Total (Overall) | 146 (44.8%) | 180 (55.2%) |
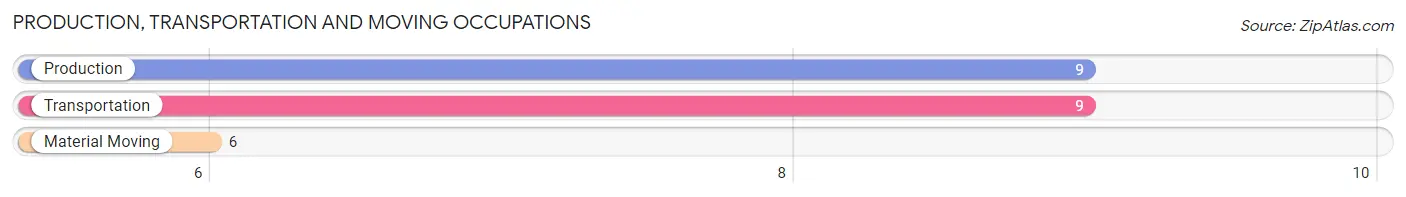
Production, Transportation and Moving Occupations
The most common Production, Transportation and Moving occupations in St Ignatius are Production (9 | 2.8%), Transportation (9 | 2.8%), and Material Moving (6 | 1.8%).
Production, Transportation and Moving Occupations by Sex
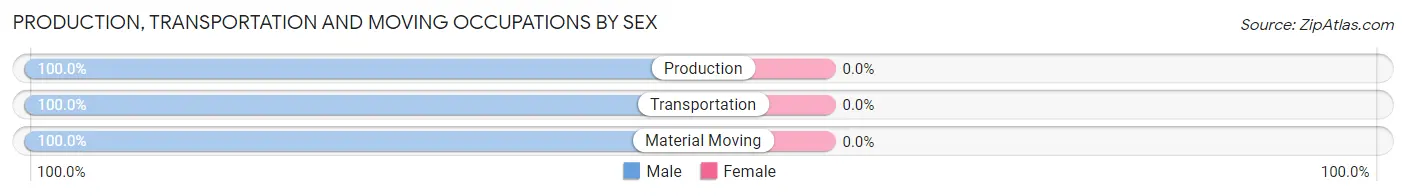
| Occupation | Male | Female |
| Production | 9 (100.0%) | 0 (0.0%) |
| Transportation | 9 (100.0%) | 0 (0.0%) |
| Material Moving | 6 (100.0%) | 0 (0.0%) |
| Total (Category) | 24 (100.0%) | 0 (0.0%) |
| Total (Overall) | 146 (44.8%) | 180 (55.2%) |
Employment Industries by Sex in St Ignatius
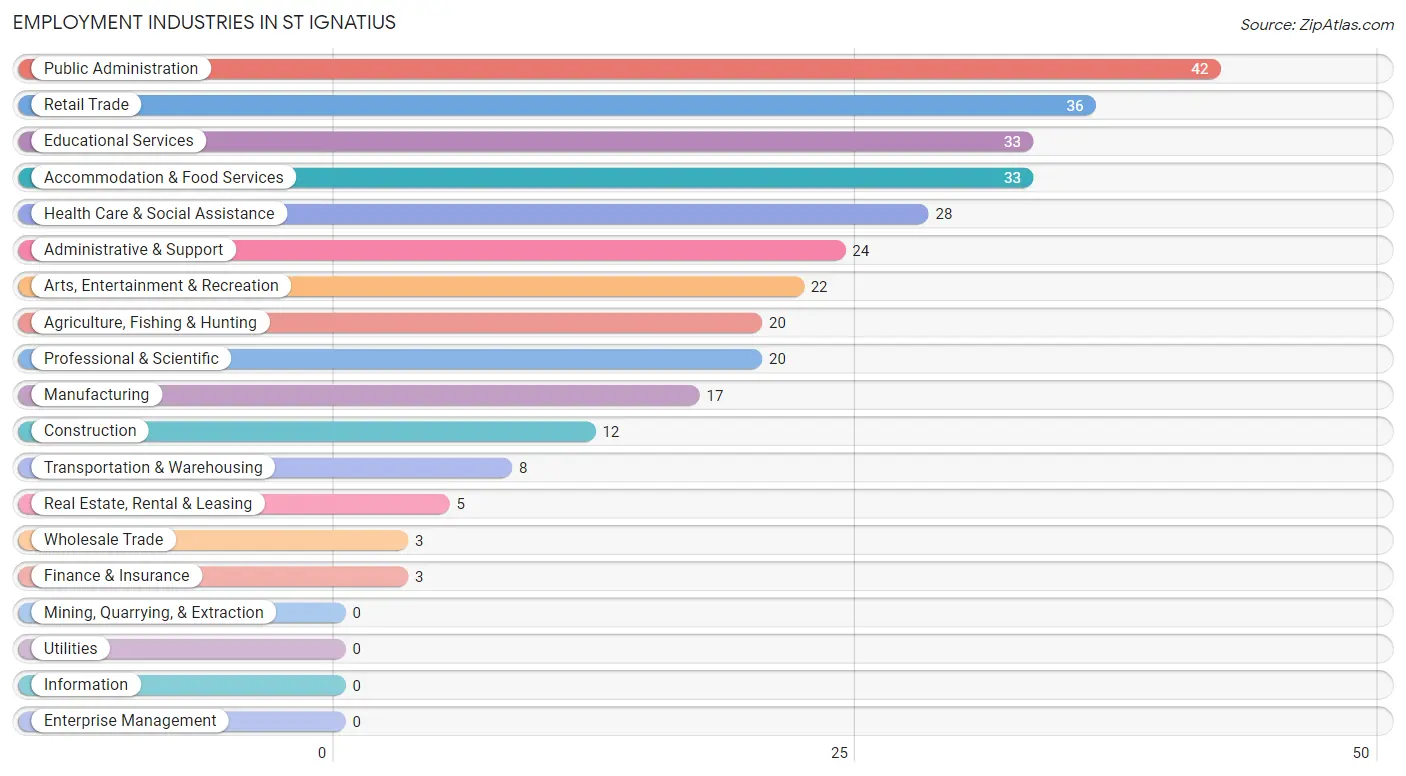
Employment Industries in St Ignatius
The major employment industries in St Ignatius include Public Administration (42 | 12.9%), Retail Trade (36 | 11.0%), Educational Services (33 | 10.1%), Accommodation & Food Services (33 | 10.1%), and Health Care & Social Assistance (28 | 8.6%).
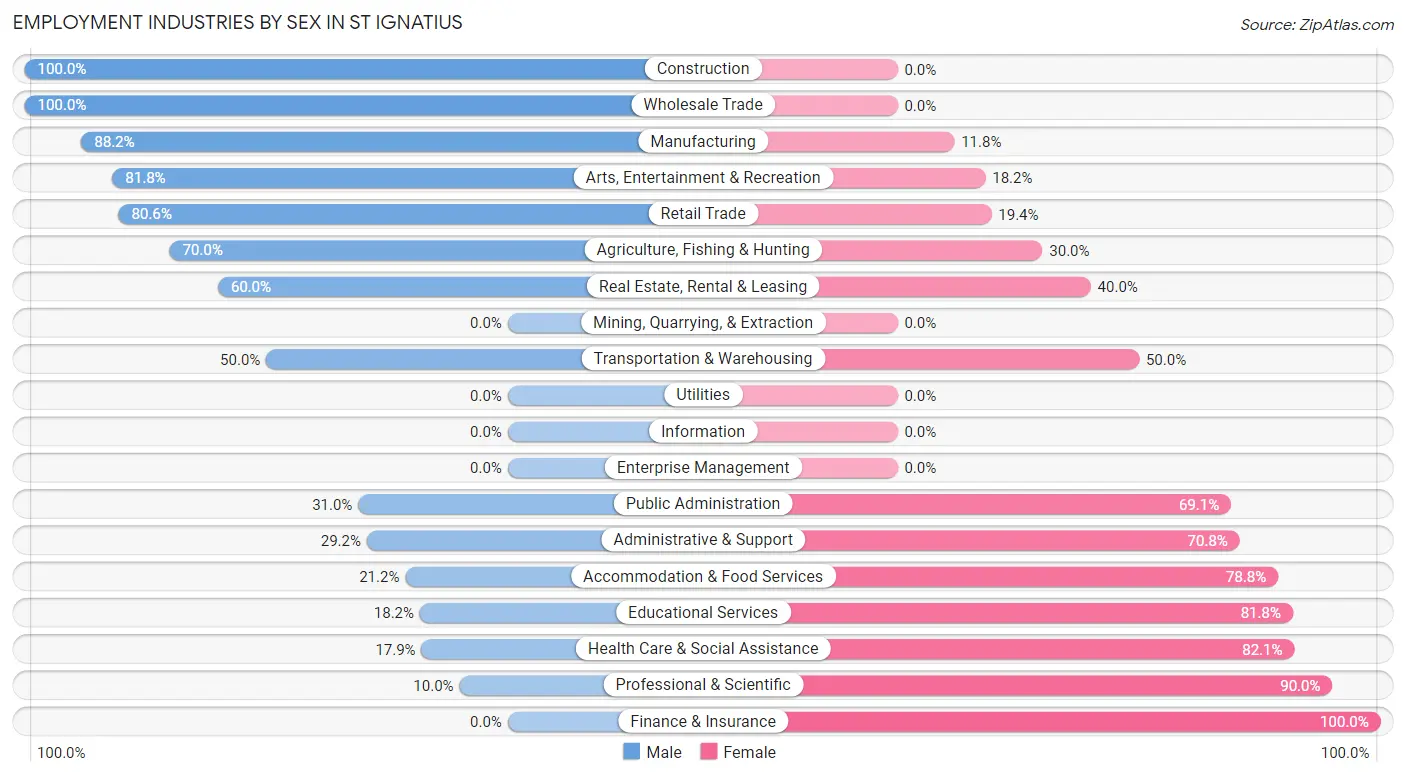
Employment Industries by Sex in St Ignatius
The St Ignatius industries that see more men than women are Construction (100.0%), Wholesale Trade (100.0%), and Manufacturing (88.2%), whereas the industries that tend to have a higher number of women are Finance & Insurance (100.0%), Professional & Scientific (90.0%), and Health Care & Social Assistance (82.1%).
| Industry | Male | Female |
| Agriculture, Fishing & Hunting | 14 (70.0%) | 6 (30.0%) |
| Mining, Quarrying, & Extraction | 0 (0.0%) | 0 (0.0%) |
| Construction | 12 (100.0%) | 0 (0.0%) |
| Manufacturing | 15 (88.2%) | 2 (11.8%) |
| Wholesale Trade | 3 (100.0%) | 0 (0.0%) |
| Retail Trade | 29 (80.6%) | 7 (19.4%) |
| Transportation & Warehousing | 4 (50.0%) | 4 (50.0%) |
| Utilities | 0 (0.0%) | 0 (0.0%) |
| Information | 0 (0.0%) | 0 (0.0%) |
| Finance & Insurance | 0 (0.0%) | 3 (100.0%) |
| Real Estate, Rental & Leasing | 3 (60.0%) | 2 (40.0%) |
| Professional & Scientific | 2 (10.0%) | 18 (90.0%) |
| Enterprise Management | 0 (0.0%) | 0 (0.0%) |
| Administrative & Support | 7 (29.2%) | 17 (70.8%) |
| Educational Services | 6 (18.2%) | 27 (81.8%) |
| Health Care & Social Assistance | 5 (17.9%) | 23 (82.1%) |
| Arts, Entertainment & Recreation | 18 (81.8%) | 4 (18.2%) |
| Accommodation & Food Services | 7 (21.2%) | 26 (78.8%) |
| Public Administration | 13 (30.9%) | 29 (69.1%) |
| Total | 146 (44.8%) | 180 (55.2%) |
Education in St Ignatius
School Enrollment in St Ignatius
The most common levels of schooling among the 319 students in St Ignatius are elementary school (108 | 33.9%), high school (74 | 23.2%), and middle school (63 | 19.8%).
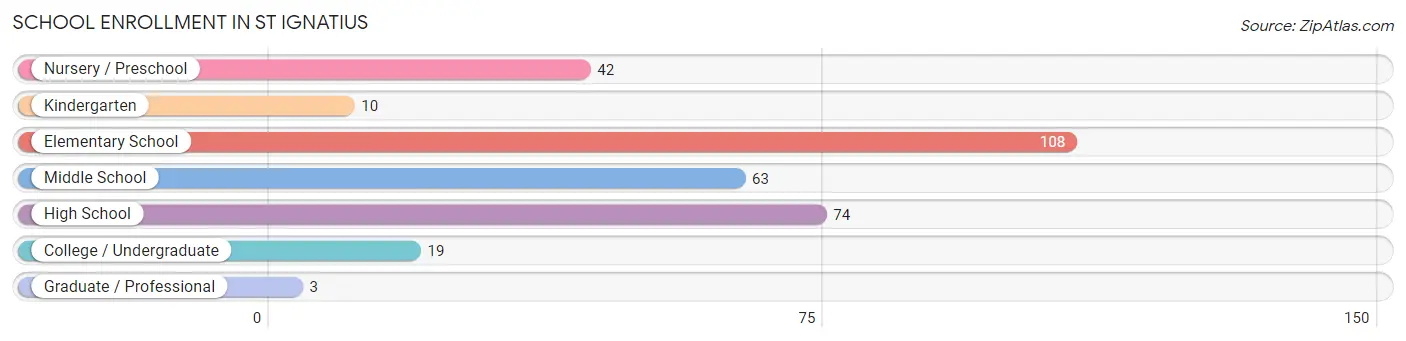
| School Level | # Students | % Students |
| Nursery / Preschool | 42 | 13.2% |
| Kindergarten | 10 | 3.1% |
| Elementary School | 108 | 33.9% |
| Middle School | 63 | 19.8% |
| High School | 74 | 23.2% |
| College / Undergraduate | 19 | 6.0% |
| Graduate / Professional | 3 | 0.9% |
| Total | 319 | 100.0% |
School Enrollment by Age by Funding Source in St Ignatius
Out of a total of 319 students who are enrolled in schools in St Ignatius, 10 (3.1%) attend a private institution, while the remaining 309 (96.9%) are enrolled in public schools. The age group of 10 to 14 year olds has the highest likelihood of being enrolled in private schools, with 8 (8.7% in the age bracket) enrolled. Conversely, the age group of 3 to 4 year olds has the lowest likelihood of being enrolled in a private school, with 23 (100.0% in the age bracket) attending a public institution.
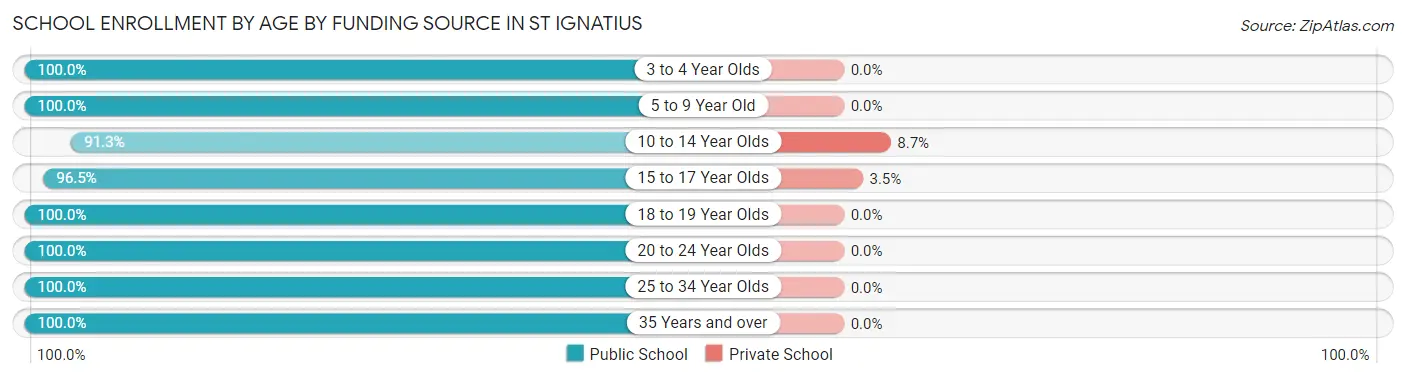
| Age Bracket | Public School | Private School |
| 3 to 4 Year Olds | 23 (100.0%) | 0 (0.0%) |
| 5 to 9 Year Old | 119 (100.0%) | 0 (0.0%) |
| 10 to 14 Year Olds | 84 (91.3%) | 8 (8.7%) |
| 15 to 17 Year Olds | 55 (96.5%) | 2 (3.5%) |
| 18 to 19 Year Olds | 10 (100.0%) | 0 (0.0%) |
| 20 to 24 Year Olds | 4 (100.0%) | 0 (0.0%) |
| 25 to 34 Year Olds | 9 (100.0%) | 0 (0.0%) |
| 35 Years and over | 5 (100.0%) | 0 (0.0%) |
| Total | 309 (96.9%) | 10 (3.1%) |
Educational Attainment by Field of Study in St Ignatius
Education (30 | 22.7%), business (20 | 15.1%), science & technology (17 | 12.9%), psychology (15 | 11.4%), and social sciences (13 | 9.9%) are the most common fields of study among 132 individuals in St Ignatius who have obtained a bachelor's degree or higher.
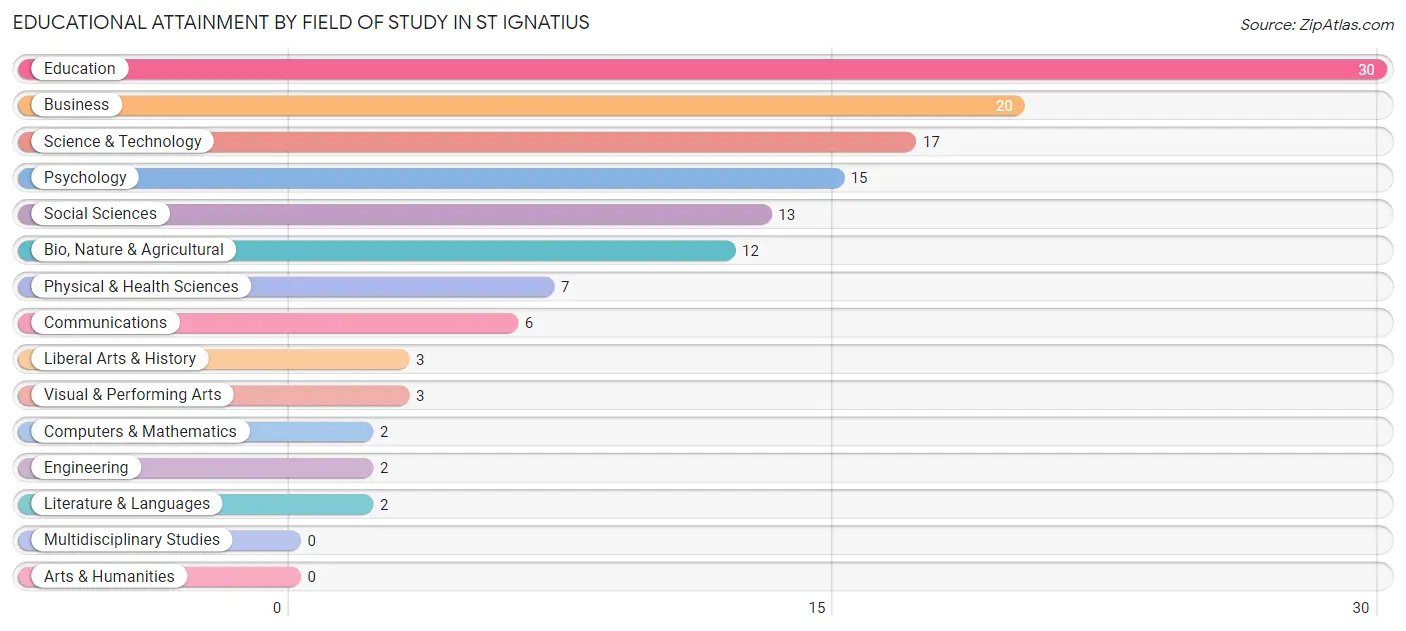
| Field of Study | # Graduates | % Graduates |
| Computers & Mathematics | 2 | 1.5% |
| Bio, Nature & Agricultural | 12 | 9.1% |
| Physical & Health Sciences | 7 | 5.3% |
| Psychology | 15 | 11.4% |
| Social Sciences | 13 | 9.9% |
| Engineering | 2 | 1.5% |
| Multidisciplinary Studies | 0 | 0.0% |
| Science & Technology | 17 | 12.9% |
| Business | 20 | 15.1% |
| Education | 30 | 22.7% |
| Literature & Languages | 2 | 1.5% |
| Liberal Arts & History | 3 | 2.3% |
| Visual & Performing Arts | 3 | 2.3% |
| Communications | 6 | 4.5% |
| Arts & Humanities | 0 | 0.0% |
| Total | 132 | 100.0% |
Transportation & Commute in St Ignatius
Vehicle Availability by Sex in St Ignatius
The most prevalent vehicle ownership categories in St Ignatius are males with 2 vehicles (49, accounting for 33.6%) and females with 2 vehicles (69, making up 27.7%).
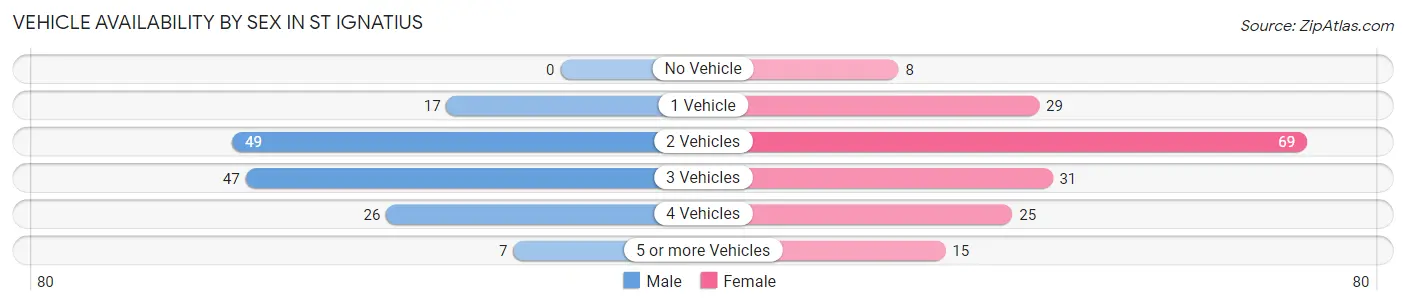
| Vehicles Available | Male | Female |
| No Vehicle | 0 (0.0%) | 8 (4.5%) |
| 1 Vehicle | 17 (11.6%) | 29 (16.4%) |
| 2 Vehicles | 49 (33.6%) | 69 (39.0%) |
| 3 Vehicles | 47 (32.2%) | 31 (17.5%) |
| 4 Vehicles | 26 (17.8%) | 25 (14.1%) |
| 5 or more Vehicles | 7 (4.8%) | 15 (8.5%) |
| Total | 146 (100.0%) | 177 (100.0%) |
Commute Time in St Ignatius
The most frequently occuring commute durations in St Ignatius are less than 5 minutes (64 commuters, 20.6%), 30 to 34 minutes (48 commuters, 15.4%), and 5 to 9 minutes (33 commuters, 10.6%).
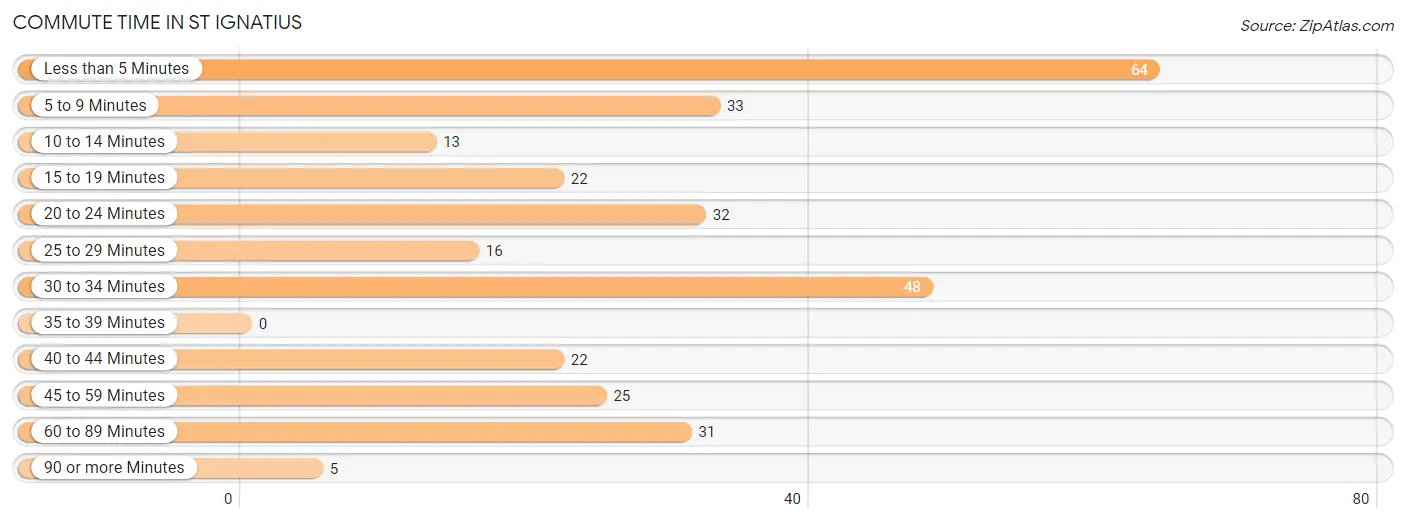
| Commute Time | # Commuters | % Commuters |
| Less than 5 Minutes | 64 | 20.6% |
| 5 to 9 Minutes | 33 | 10.6% |
| 10 to 14 Minutes | 13 | 4.2% |
| 15 to 19 Minutes | 22 | 7.1% |
| 20 to 24 Minutes | 32 | 10.3% |
| 25 to 29 Minutes | 16 | 5.1% |
| 30 to 34 Minutes | 48 | 15.4% |
| 35 to 39 Minutes | 0 | 0.0% |
| 40 to 44 Minutes | 22 | 7.1% |
| 45 to 59 Minutes | 25 | 8.0% |
| 60 to 89 Minutes | 31 | 10.0% |
| 90 or more Minutes | 5 | 1.6% |
Commute Time by Sex in St Ignatius
The most common commute times in St Ignatius are 30 to 34 minutes (28 commuters, 19.4%) for males and less than 5 minutes (37 commuters, 22.2%) for females.
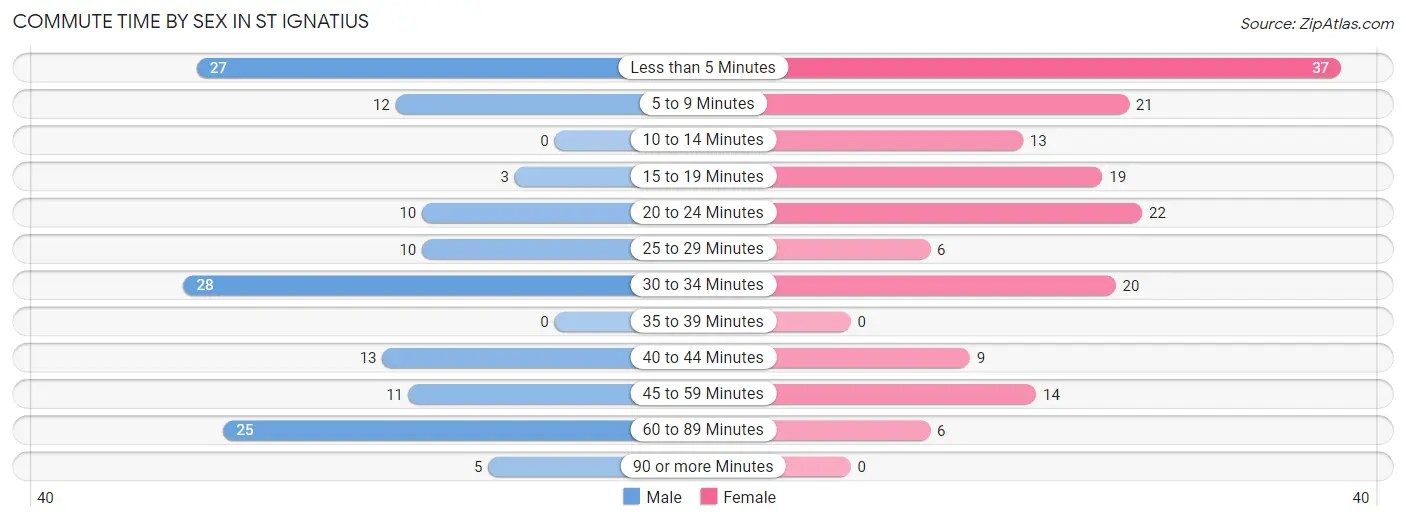
| Commute Time | Male | Female |
| Less than 5 Minutes | 27 (18.8%) | 37 (22.2%) |
| 5 to 9 Minutes | 12 (8.3%) | 21 (12.6%) |
| 10 to 14 Minutes | 0 (0.0%) | 13 (7.8%) |
| 15 to 19 Minutes | 3 (2.1%) | 19 (11.4%) |
| 20 to 24 Minutes | 10 (6.9%) | 22 (13.2%) |
| 25 to 29 Minutes | 10 (6.9%) | 6 (3.6%) |
| 30 to 34 Minutes | 28 (19.4%) | 20 (12.0%) |
| 35 to 39 Minutes | 0 (0.0%) | 0 (0.0%) |
| 40 to 44 Minutes | 13 (9.0%) | 9 (5.4%) |
| 45 to 59 Minutes | 11 (7.6%) | 14 (8.4%) |
| 60 to 89 Minutes | 25 (17.4%) | 6 (3.6%) |
| 90 or more Minutes | 5 (3.5%) | 0 (0.0%) |
Time of Departure to Work by Sex in St Ignatius
The most frequent times of departure to work in St Ignatius are 7:30 AM to 7:59 AM (28, 19.4%) for males and 7:30 AM to 7:59 AM (41, 24.5%) for females.
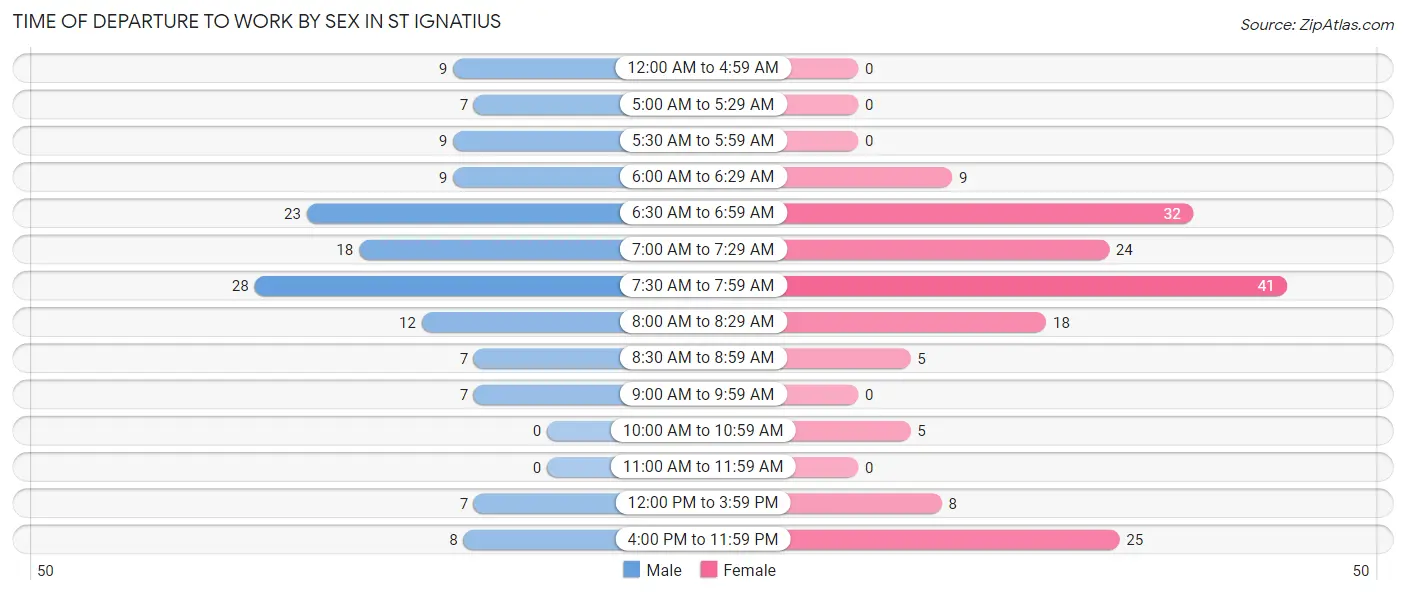
| Time of Departure | Male | Female |
| 12:00 AM to 4:59 AM | 9 (6.2%) | 0 (0.0%) |
| 5:00 AM to 5:29 AM | 7 (4.9%) | 0 (0.0%) |
| 5:30 AM to 5:59 AM | 9 (6.2%) | 0 (0.0%) |
| 6:00 AM to 6:29 AM | 9 (6.2%) | 9 (5.4%) |
| 6:30 AM to 6:59 AM | 23 (16.0%) | 32 (19.2%) |
| 7:00 AM to 7:29 AM | 18 (12.5%) | 24 (14.4%) |
| 7:30 AM to 7:59 AM | 28 (19.4%) | 41 (24.5%) |
| 8:00 AM to 8:29 AM | 12 (8.3%) | 18 (10.8%) |
| 8:30 AM to 8:59 AM | 7 (4.9%) | 5 (3.0%) |
| 9:00 AM to 9:59 AM | 7 (4.9%) | 0 (0.0%) |
| 10:00 AM to 10:59 AM | 0 (0.0%) | 5 (3.0%) |
| 11:00 AM to 11:59 AM | 0 (0.0%) | 0 (0.0%) |
| 12:00 PM to 3:59 PM | 7 (4.9%) | 8 (4.8%) |
| 4:00 PM to 11:59 PM | 8 (5.6%) | 25 (15.0%) |
| Total | 144 (100.0%) | 167 (100.0%) |
Housing Occupancy in St Ignatius
Occupancy by Ownership in St Ignatius
Of the total 307 dwellings in St Ignatius, owner-occupied units account for 200 (65.1%), while renter-occupied units make up 107 (34.8%).
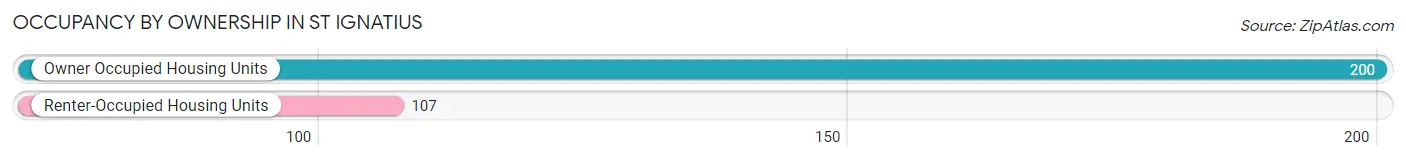
| Occupancy | # Housing Units | % Housing Units |
| Owner Occupied Housing Units | 200 | 65.1% |
| Renter-Occupied Housing Units | 107 | 34.8% |
| Total Occupied Housing Units | 307 | 100.0% |
Occupancy by Household Size in St Ignatius
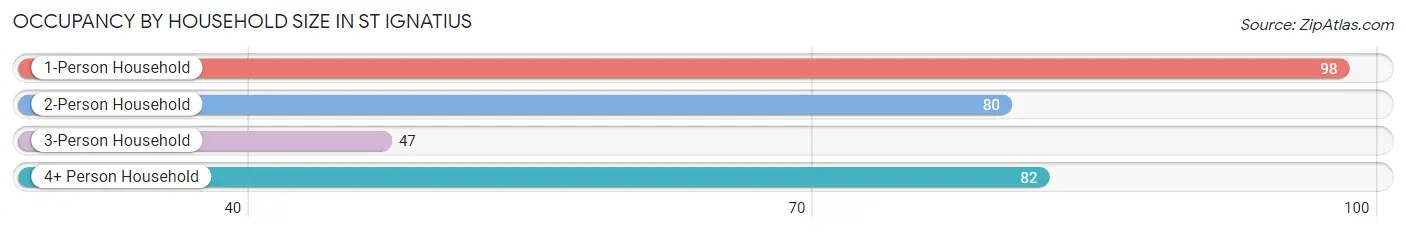
| Household Size | # Housing Units | % Housing Units |
| 1-Person Household | 98 | 31.9% |
| 2-Person Household | 80 | 26.1% |
| 3-Person Household | 47 | 15.3% |
| 4+ Person Household | 82 | 26.7% |
| Total Housing Units | 307 | 100.0% |
Occupancy by Ownership by Household Size in St Ignatius
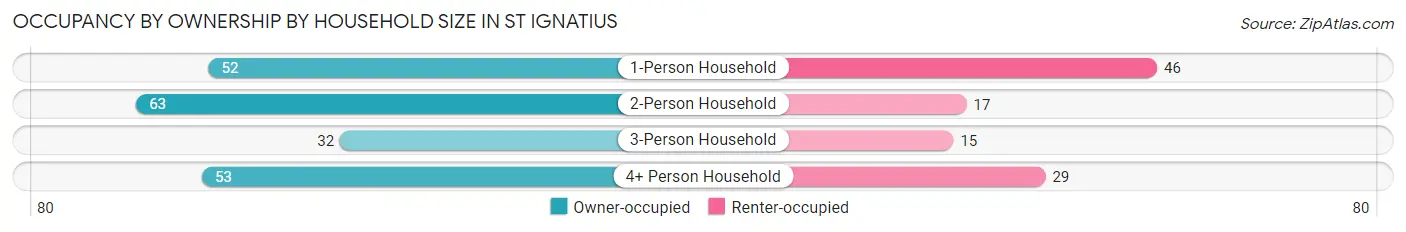
| Household Size | Owner-occupied | Renter-occupied |
| 1-Person Household | 52 (53.1%) | 46 (46.9%) |
| 2-Person Household | 63 (78.7%) | 17 (21.2%) |
| 3-Person Household | 32 (68.1%) | 15 (31.9%) |
| 4+ Person Household | 53 (64.6%) | 29 (35.4%) |
| Total Housing Units | 200 (65.1%) | 107 (34.8%) |
Occupancy by Educational Attainment in St Ignatius
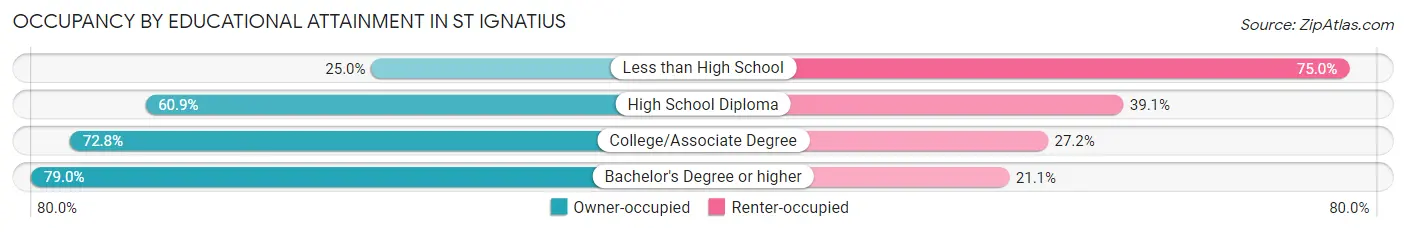
| Household Size | Owner-occupied | Renter-occupied |
| Less than High School | 9 (25.0%) | 27 (75.0%) |
| High School Diploma | 56 (60.9%) | 36 (39.1%) |
| College/Associate Degree | 75 (72.8%) | 28 (27.2%) |
| Bachelor's Degree or higher | 60 (78.9%) | 16 (21.0%) |
Occupancy by Age of Householder in St Ignatius
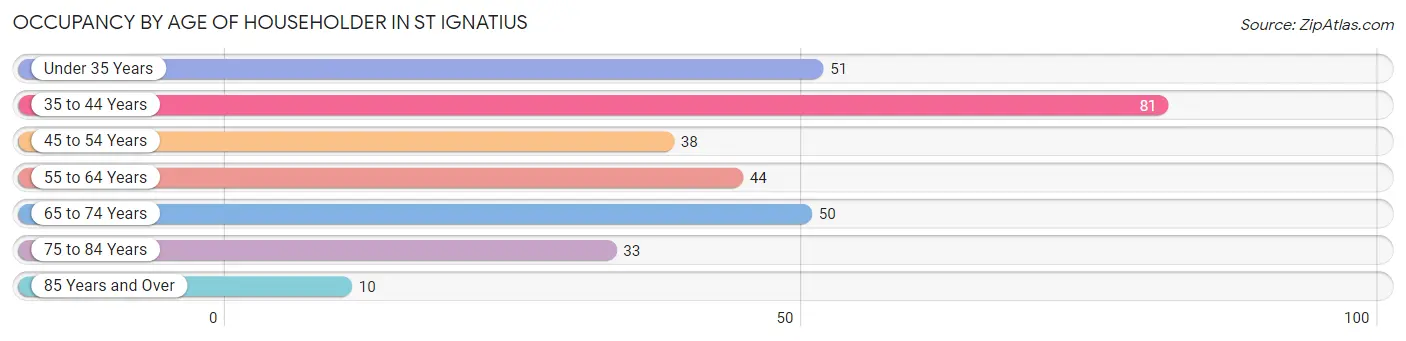
| Age Bracket | # Households | % Households |
| Under 35 Years | 51 | 16.6% |
| 35 to 44 Years | 81 | 26.4% |
| 45 to 54 Years | 38 | 12.4% |
| 55 to 64 Years | 44 | 14.3% |
| 65 to 74 Years | 50 | 16.3% |
| 75 to 84 Years | 33 | 10.7% |
| 85 Years and Over | 10 | 3.3% |
| Total | 307 | 100.0% |
Housing Finances in St Ignatius
Median Income by Occupancy in St Ignatius
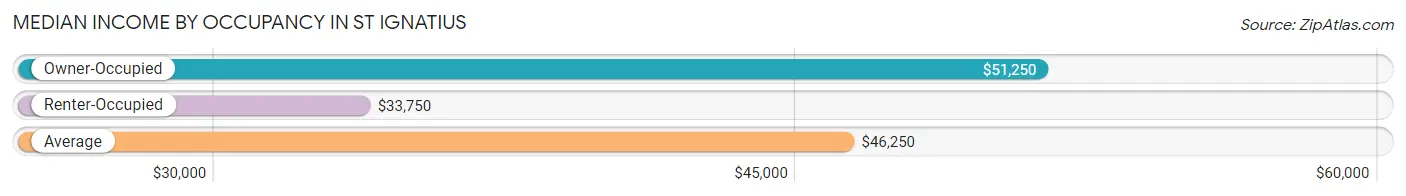
| Occupancy Type | # Households | Median Income |
| Owner-Occupied | 200 (65.1%) | $51,250 |
| Renter-Occupied | 107 (34.8%) | $33,750 |
| Average | 307 (100.0%) | $46,250 |
Occupancy by Householder Income Bracket in St Ignatius
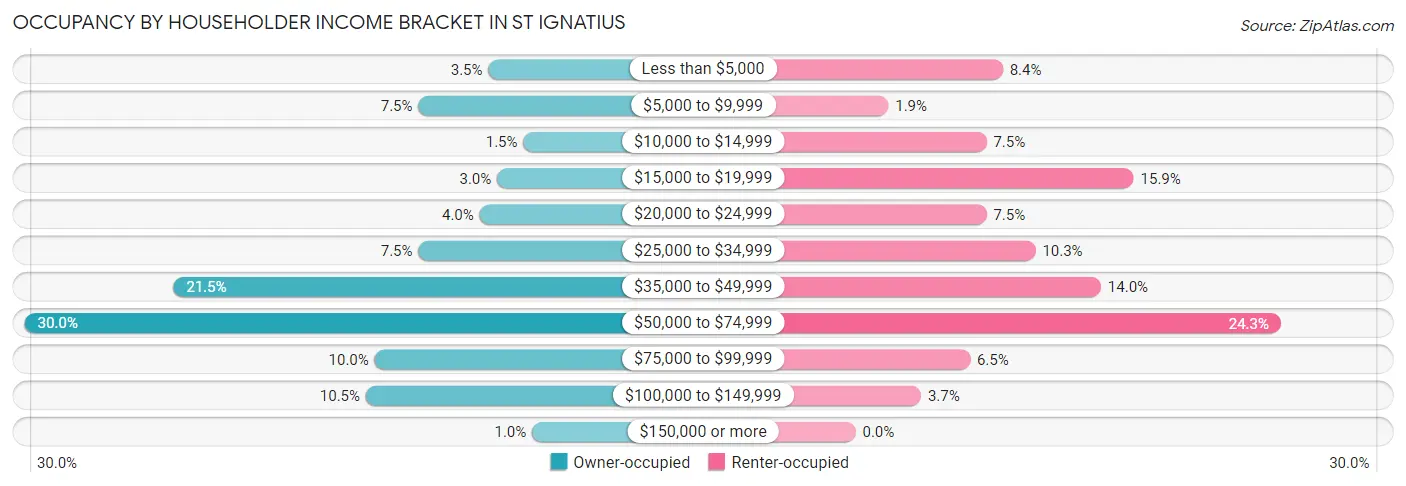
| Income Bracket | Owner-occupied | Renter-occupied |
| Less than $5,000 | 7 (3.5%) | 9 (8.4%) |
| $5,000 to $9,999 | 15 (7.5%) | 2 (1.9%) |
| $10,000 to $14,999 | 3 (1.5%) | 8 (7.5%) |
| $15,000 to $19,999 | 6 (3.0%) | 17 (15.9%) |
| $20,000 to $24,999 | 8 (4.0%) | 8 (7.5%) |
| $25,000 to $34,999 | 15 (7.5%) | 11 (10.3%) |
| $35,000 to $49,999 | 43 (21.5%) | 15 (14.0%) |
| $50,000 to $74,999 | 60 (30.0%) | 26 (24.3%) |
| $75,000 to $99,999 | 20 (10.0%) | 7 (6.5%) |
| $100,000 to $149,999 | 21 (10.5%) | 4 (3.7%) |
| $150,000 or more | 2 (1.0%) | 0 (0.0%) |
| Total | 200 (100.0%) | 107 (100.0%) |
Monthly Housing Cost Tiers in St Ignatius
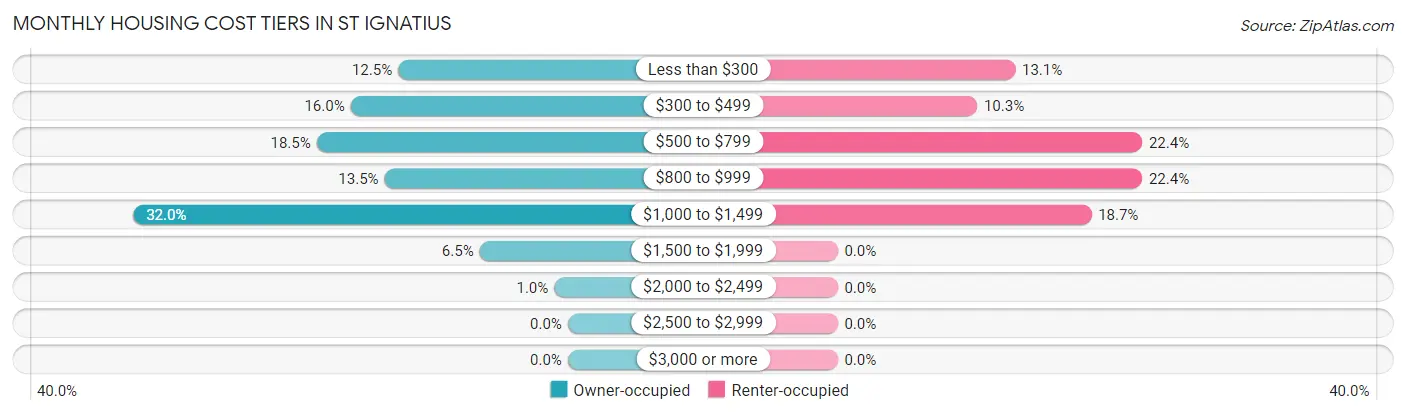
| Monthly Cost | Owner-occupied | Renter-occupied |
| Less than $300 | 25 (12.5%) | 14 (13.1%) |
| $300 to $499 | 32 (16.0%) | 11 (10.3%) |
| $500 to $799 | 37 (18.5%) | 24 (22.4%) |
| $800 to $999 | 27 (13.5%) | 24 (22.4%) |
| $1,000 to $1,499 | 64 (32.0%) | 20 (18.7%) |
| $1,500 to $1,999 | 13 (6.5%) | 0 (0.0%) |
| $2,000 to $2,499 | 2 (1.0%) | 0 (0.0%) |
| $2,500 to $2,999 | 0 (0.0%) | 0 (0.0%) |
| $3,000 or more | 0 (0.0%) | 0 (0.0%) |
| Total | 200 (100.0%) | 107 (100.0%) |
Physical Housing Characteristics in St Ignatius
Housing Structures in St Ignatius
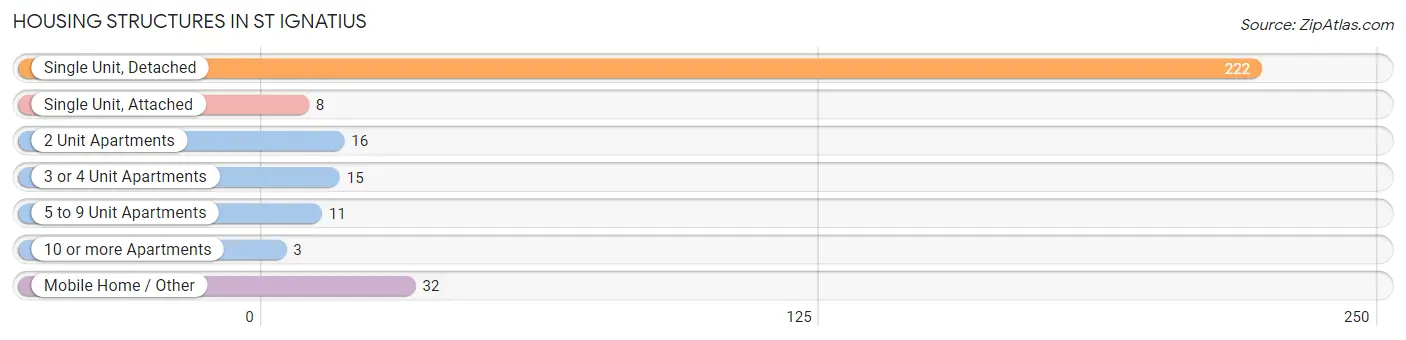
| Structure Type | # Housing Units | % Housing Units |
| Single Unit, Detached | 222 | 72.3% |
| Single Unit, Attached | 8 | 2.6% |
| 2 Unit Apartments | 16 | 5.2% |
| 3 or 4 Unit Apartments | 15 | 4.9% |
| 5 to 9 Unit Apartments | 11 | 3.6% |
| 10 or more Apartments | 3 | 1.0% |
| Mobile Home / Other | 32 | 10.4% |
| Total | 307 | 100.0% |
Housing Structures by Occupancy in St Ignatius
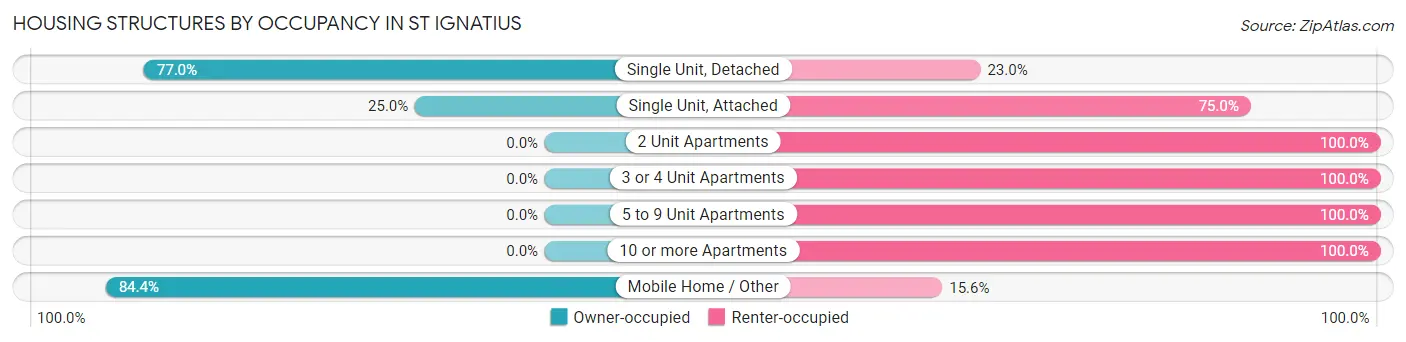
| Structure Type | Owner-occupied | Renter-occupied |
| Single Unit, Detached | 171 (77.0%) | 51 (23.0%) |
| Single Unit, Attached | 2 (25.0%) | 6 (75.0%) |
| 2 Unit Apartments | 0 (0.0%) | 16 (100.0%) |
| 3 or 4 Unit Apartments | 0 (0.0%) | 15 (100.0%) |
| 5 to 9 Unit Apartments | 0 (0.0%) | 11 (100.0%) |
| 10 or more Apartments | 0 (0.0%) | 3 (100.0%) |
| Mobile Home / Other | 27 (84.4%) | 5 (15.6%) |
| Total | 200 (65.1%) | 107 (34.8%) |
Housing Structures by Number of Rooms in St Ignatius
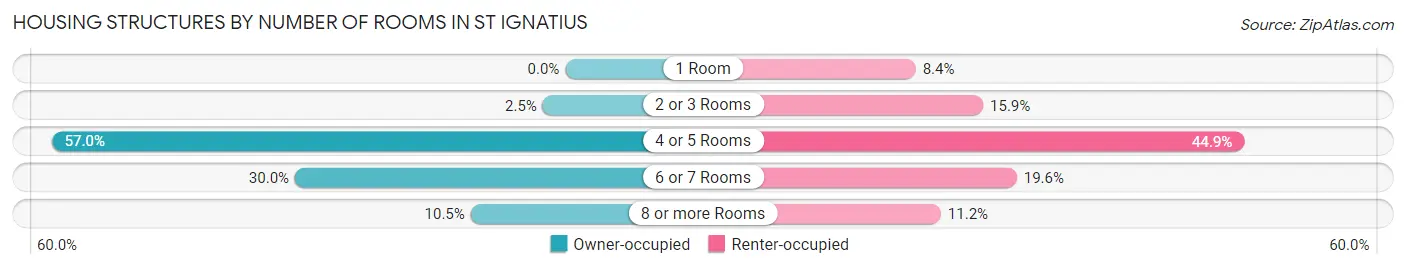
| Number of Rooms | Owner-occupied | Renter-occupied |
| 1 Room | 0 (0.0%) | 9 (8.4%) |
| 2 or 3 Rooms | 5 (2.5%) | 17 (15.9%) |
| 4 or 5 Rooms | 114 (57.0%) | 48 (44.9%) |
| 6 or 7 Rooms | 60 (30.0%) | 21 (19.6%) |
| 8 or more Rooms | 21 (10.5%) | 12 (11.2%) |
| Total | 200 (100.0%) | 107 (100.0%) |
Housing Structure by Heating Type in St Ignatius
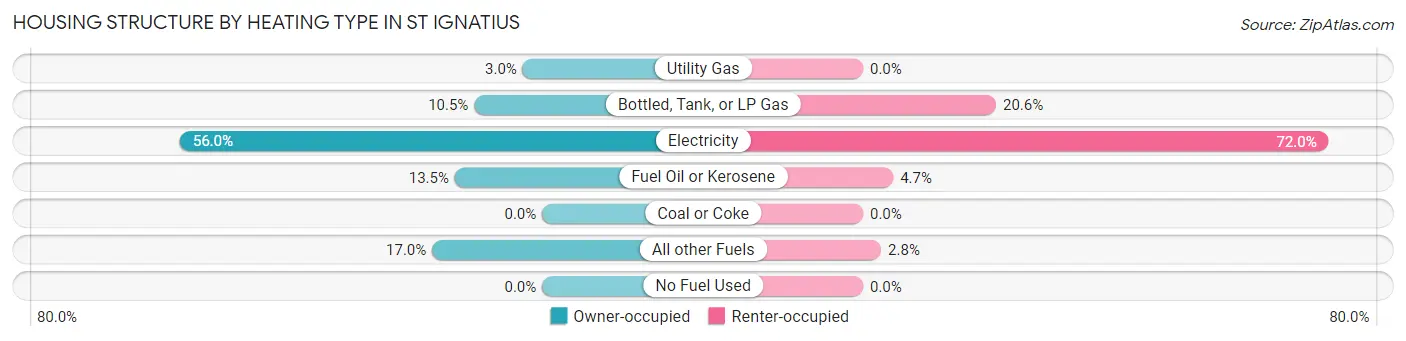
| Heating Type | Owner-occupied | Renter-occupied |
| Utility Gas | 6 (3.0%) | 0 (0.0%) |
| Bottled, Tank, or LP Gas | 21 (10.5%) | 22 (20.6%) |
| Electricity | 112 (56.0%) | 77 (72.0%) |
| Fuel Oil or Kerosene | 27 (13.5%) | 5 (4.7%) |
| Coal or Coke | 0 (0.0%) | 0 (0.0%) |
| All other Fuels | 34 (17.0%) | 3 (2.8%) |
| No Fuel Used | 0 (0.0%) | 0 (0.0%) |
| Total | 200 (100.0%) | 107 (100.0%) |
Household Vehicle Usage in St Ignatius
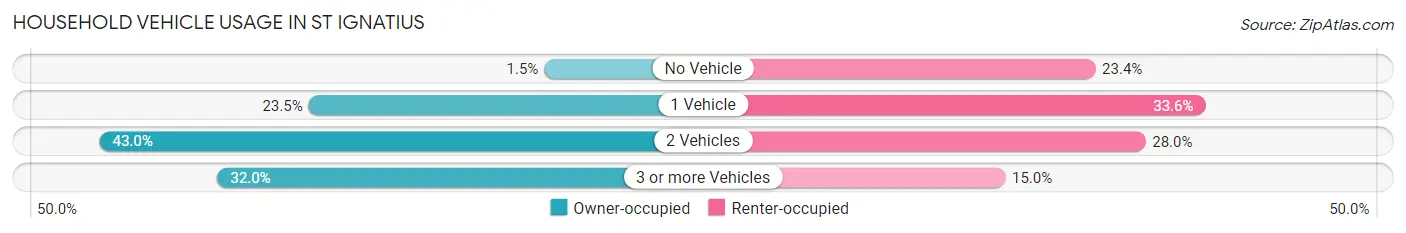
| Vehicles per Household | Owner-occupied | Renter-occupied |
| No Vehicle | 3 (1.5%) | 25 (23.4%) |
| 1 Vehicle | 47 (23.5%) | 36 (33.6%) |
| 2 Vehicles | 86 (43.0%) | 30 (28.0%) |
| 3 or more Vehicles | 64 (32.0%) | 16 (14.9%) |
| Total | 200 (100.0%) | 107 (100.0%) |
Real Estate & Mortgages in St Ignatius
Real Estate and Mortgage Overview in St Ignatius
| Characteristic | Without Mortgage | With Mortgage |
| Housing Units | 82 | 118 |
| Median Property Value | $165,800 | $167,700 |
| Median Household Income | $28,333 | $2 |
| Monthly Housing Costs | $367 | $0 |
| Real Estate Taxes | $1,179 | $21 |
Property Value by Mortgage Status in St Ignatius
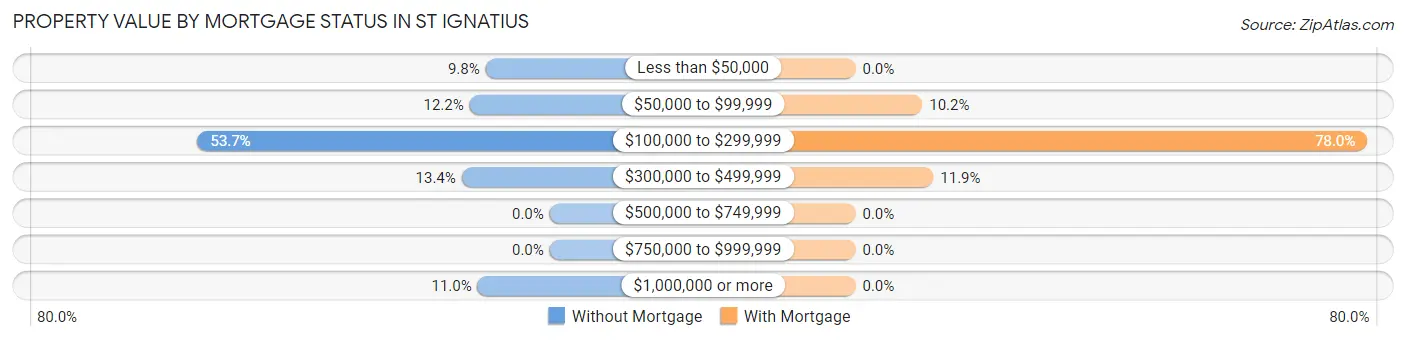
| Property Value | Without Mortgage | With Mortgage |
| Less than $50,000 | 8 (9.8%) | 0 (0.0%) |
| $50,000 to $99,999 | 10 (12.2%) | 12 (10.2%) |
| $100,000 to $299,999 | 44 (53.7%) | 92 (78.0%) |
| $300,000 to $499,999 | 11 (13.4%) | 14 (11.9%) |
| $500,000 to $749,999 | 0 (0.0%) | 0 (0.0%) |
| $750,000 to $999,999 | 0 (0.0%) | 0 (0.0%) |
| $1,000,000 or more | 9 (11.0%) | 0 (0.0%) |
| Total | 82 (100.0%) | 118 (100.0%) |
Household Income by Mortgage Status in St Ignatius
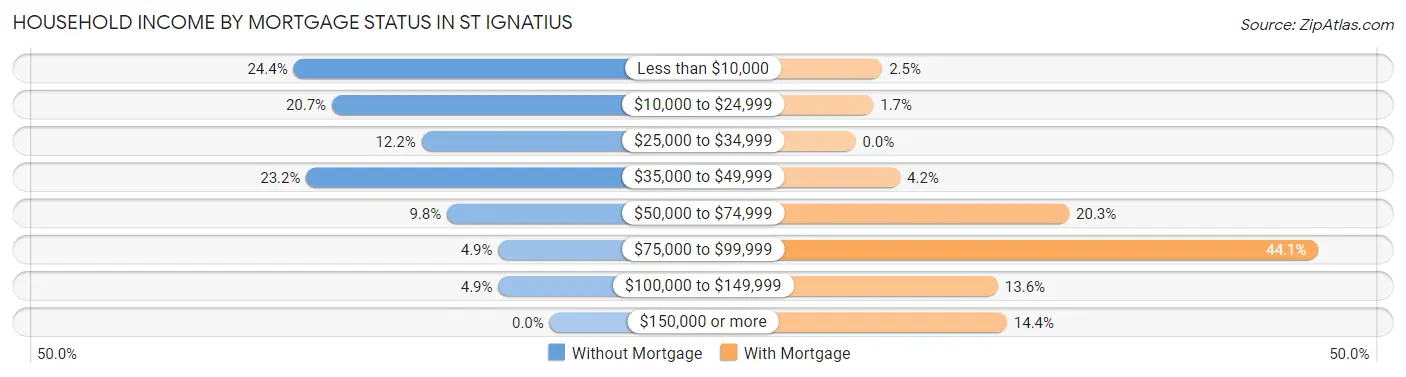
| Household Income | Without Mortgage | With Mortgage |
| Less than $10,000 | 20 (24.4%) | 3 (2.5%) |
| $10,000 to $24,999 | 17 (20.7%) | 2 (1.7%) |
| $25,000 to $34,999 | 10 (12.2%) | 0 (0.0%) |
| $35,000 to $49,999 | 19 (23.2%) | 5 (4.2%) |
| $50,000 to $74,999 | 8 (9.8%) | 24 (20.3%) |
| $75,000 to $99,999 | 4 (4.9%) | 52 (44.1%) |
| $100,000 to $149,999 | 4 (4.9%) | 16 (13.6%) |
| $150,000 or more | 0 (0.0%) | 17 (14.4%) |
| Total | 82 (100.0%) | 118 (100.0%) |
Property Value to Household Income Ratio in St Ignatius
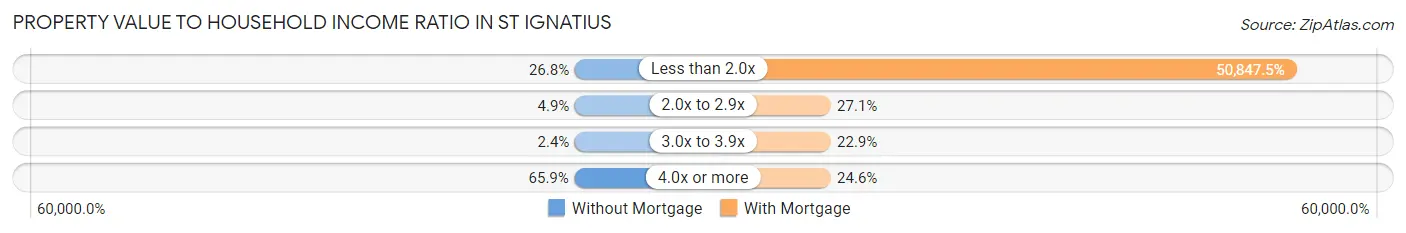
| Value-to-Income Ratio | Without Mortgage | With Mortgage |
| Less than 2.0x | 22 (26.8%) | 60,000 (50,847.5%) |
| 2.0x to 2.9x | 4 (4.9%) | 32 (27.1%) |
| 3.0x to 3.9x | 2 (2.4%) | 27 (22.9%) |
| 4.0x or more | 54 (65.8%) | 29 (24.6%) |
| Total | 82 (100.0%) | 118 (100.0%) |
Real Estate Taxes by Mortgage Status in St Ignatius
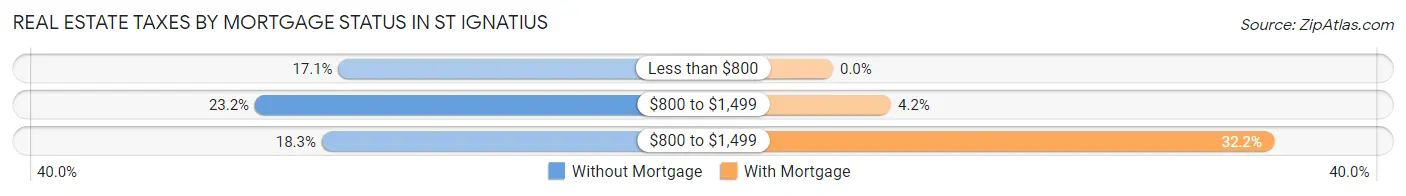
| Property Taxes | Without Mortgage | With Mortgage |
| Less than $800 | 14 (17.1%) | 0 (0.0%) |
| $800 to $1,499 | 19 (23.2%) | 5 (4.2%) |
| $800 to $1,499 | 15 (18.3%) | 38 (32.2%) |
| Total | 82 (100.0%) | 118 (100.0%) |
Health & Disability in St Ignatius
Health Insurance Coverage by Age in St Ignatius
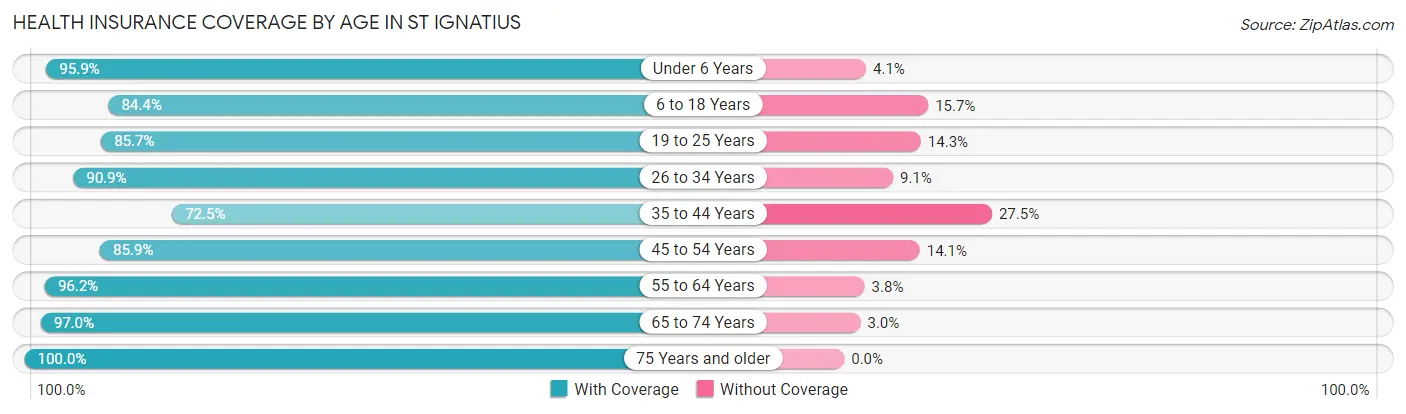
| Age Bracket | With Coverage | Without Coverage |
| Under 6 Years | 118 (95.9%) | 5 (4.1%) |
| 6 to 18 Years | 221 (84.4%) | 41 (15.7%) |
| 19 to 25 Years | 84 (85.7%) | 14 (14.3%) |
| 26 to 34 Years | 100 (90.9%) | 10 (9.1%) |
| 35 to 44 Years | 100 (72.5%) | 38 (27.5%) |
| 45 to 54 Years | 61 (85.9%) | 10 (14.1%) |
| 55 to 64 Years | 76 (96.2%) | 3 (3.8%) |
| 65 to 74 Years | 64 (97.0%) | 2 (3.0%) |
| 75 Years and older | 72 (100.0%) | 0 (0.0%) |
| Total | 896 (87.9%) | 123 (12.1%) |
Health Insurance Coverage by Citizenship Status in St Ignatius
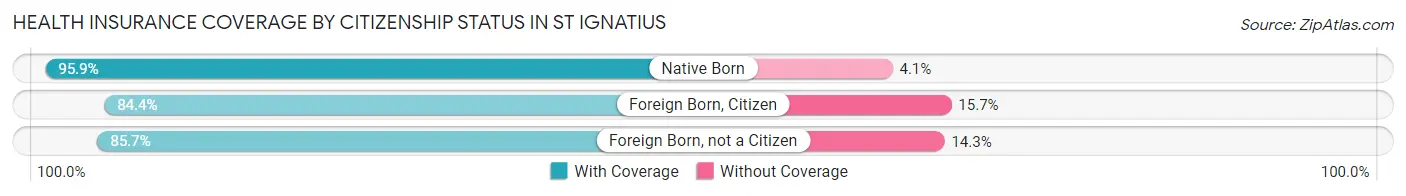
| Citizenship Status | With Coverage | Without Coverage |
| Native Born | 118 (95.9%) | 5 (4.1%) |
| Foreign Born, Citizen | 221 (84.4%) | 41 (15.7%) |
| Foreign Born, not a Citizen | 84 (85.7%) | 14 (14.3%) |
Health Insurance Coverage by Household Income in St Ignatius
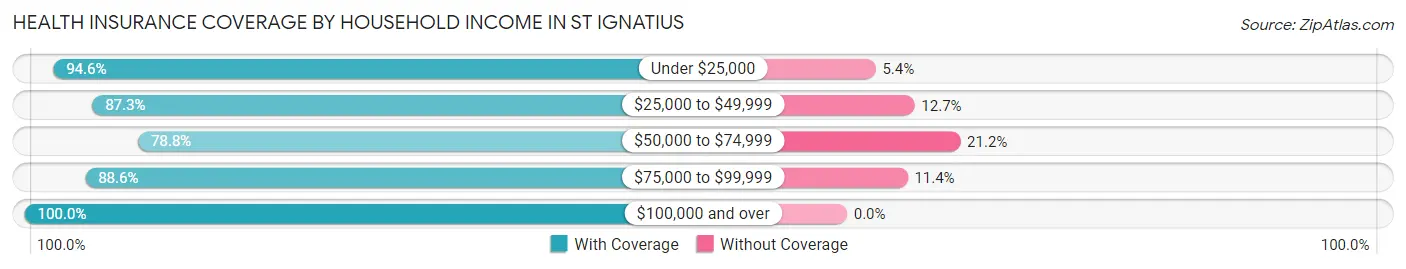
| Household Income | With Coverage | Without Coverage |
| Under $25,000 | 141 (94.6%) | 8 (5.4%) |
| $25,000 to $49,999 | 193 (87.3%) | 28 (12.7%) |
| $50,000 to $74,999 | 267 (78.8%) | 72 (21.2%) |
| $75,000 to $99,999 | 117 (88.6%) | 15 (11.4%) |
| $100,000 and over | 178 (100.0%) | 0 (0.0%) |
Public vs Private Health Insurance Coverage by Age in St Ignatius
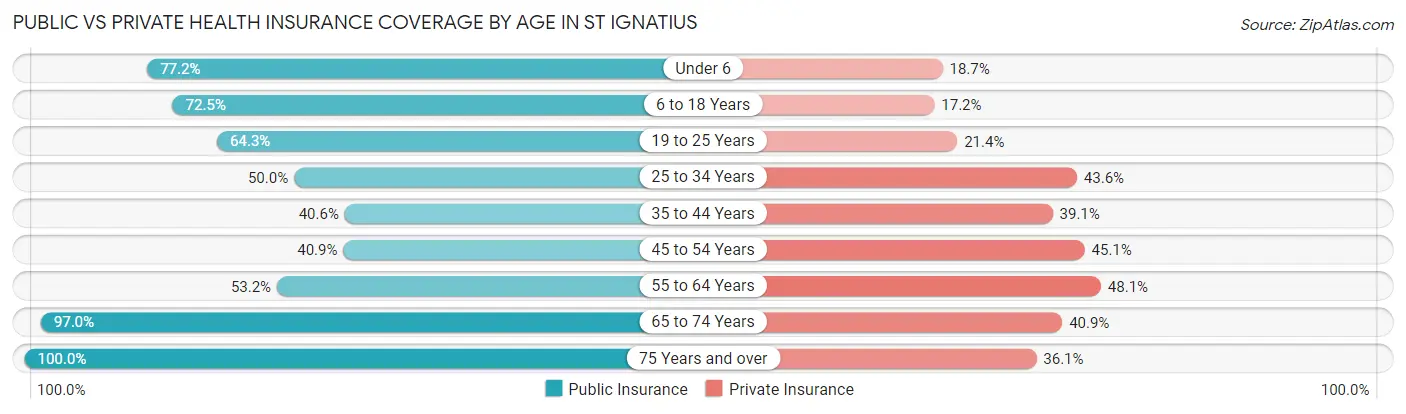
| Age Bracket | Public Insurance | Private Insurance |
| Under 6 | 95 (77.2%) | 23 (18.7%) |
| 6 to 18 Years | 190 (72.5%) | 45 (17.2%) |
| 19 to 25 Years | 63 (64.3%) | 21 (21.4%) |
| 25 to 34 Years | 55 (50.0%) | 48 (43.6%) |
| 35 to 44 Years | 56 (40.6%) | 54 (39.1%) |
| 45 to 54 Years | 29 (40.8%) | 32 (45.1%) |
| 55 to 64 Years | 42 (53.2%) | 38 (48.1%) |
| 65 to 74 Years | 64 (97.0%) | 27 (40.9%) |
| 75 Years and over | 72 (100.0%) | 26 (36.1%) |
| Total | 666 (65.4%) | 314 (30.8%) |
Disability Status by Sex by Age in St Ignatius
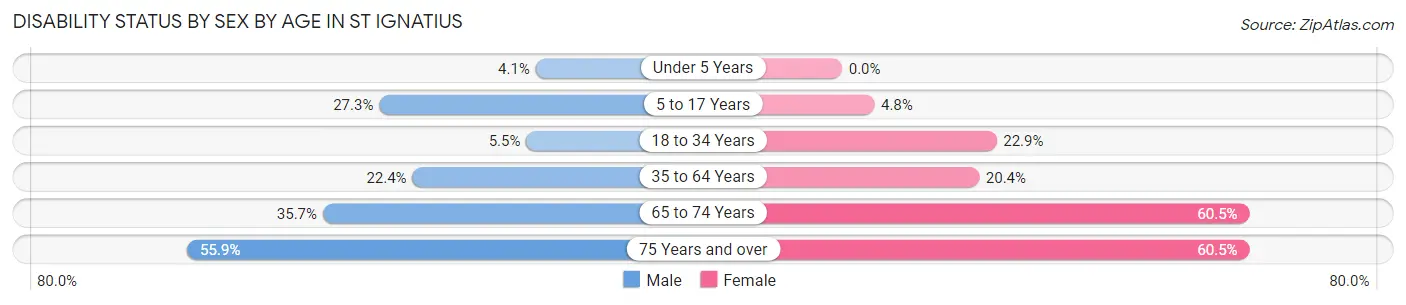
| Age Bracket | Male | Female |
| Under 5 Years | 3 (4.1%) | 0 (0.0%) |
| 5 to 17 Years | 35 (27.3%) | 7 (4.8%) |
| 18 to 34 Years | 6 (5.5%) | 25 (22.9%) |
| 35 to 64 Years | 26 (22.4%) | 35 (20.3%) |
| 65 to 74 Years | 10 (35.7%) | 23 (60.5%) |
| 75 Years and over | 19 (55.9%) | 23 (60.5%) |
Disability Class by Sex by Age in St Ignatius
Disability Class: Hearing Difficulty
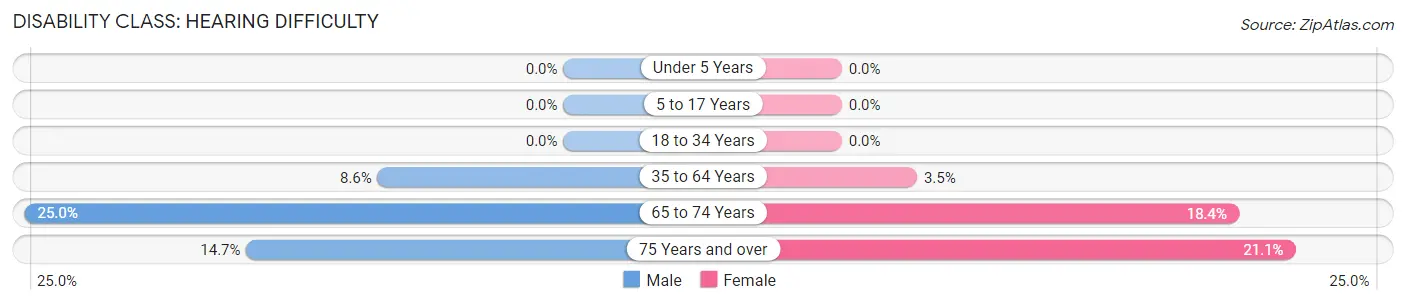
| Age Bracket | Male | Female |
| Under 5 Years | 0 (0.0%) | 0 (0.0%) |
| 5 to 17 Years | 0 (0.0%) | 0 (0.0%) |
| 18 to 34 Years | 0 (0.0%) | 0 (0.0%) |
| 35 to 64 Years | 10 (8.6%) | 6 (3.5%) |
| 65 to 74 Years | 7 (25.0%) | 7 (18.4%) |
| 75 Years and over | 5 (14.7%) | 8 (21.0%) |
Disability Class: Vision Difficulty
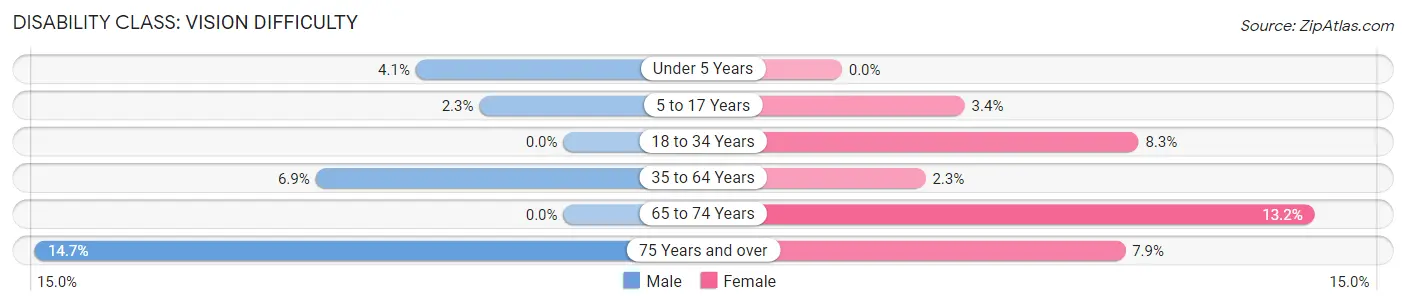
| Age Bracket | Male | Female |
| Under 5 Years | 3 (4.1%) | 0 (0.0%) |
| 5 to 17 Years | 3 (2.3%) | 5 (3.4%) |
| 18 to 34 Years | 0 (0.0%) | 9 (8.3%) |
| 35 to 64 Years | 8 (6.9%) | 4 (2.3%) |
| 65 to 74 Years | 0 (0.0%) | 5 (13.2%) |
| 75 Years and over | 5 (14.7%) | 3 (7.9%) |
Disability Class: Cognitive Difficulty
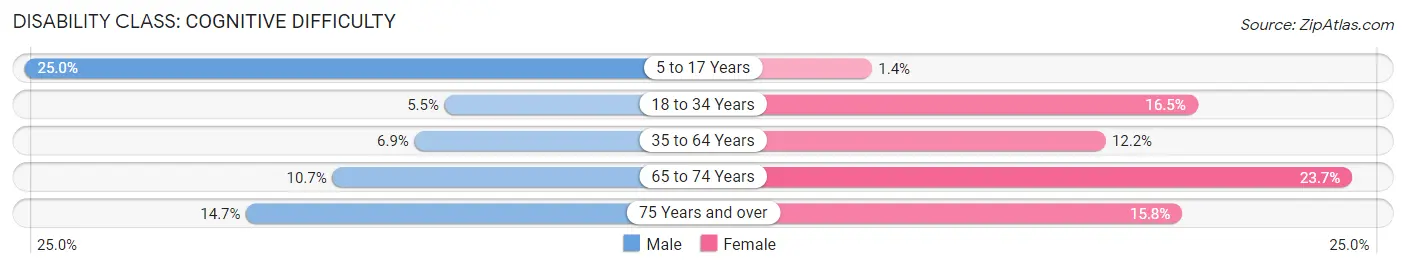
| Age Bracket | Male | Female |
| 5 to 17 Years | 32 (25.0%) | 2 (1.4%) |
| 18 to 34 Years | 6 (5.5%) | 18 (16.5%) |
| 35 to 64 Years | 8 (6.9%) | 21 (12.2%) |
| 65 to 74 Years | 3 (10.7%) | 9 (23.7%) |
| 75 Years and over | 5 (14.7%) | 6 (15.8%) |
Disability Class: Ambulatory Difficulty
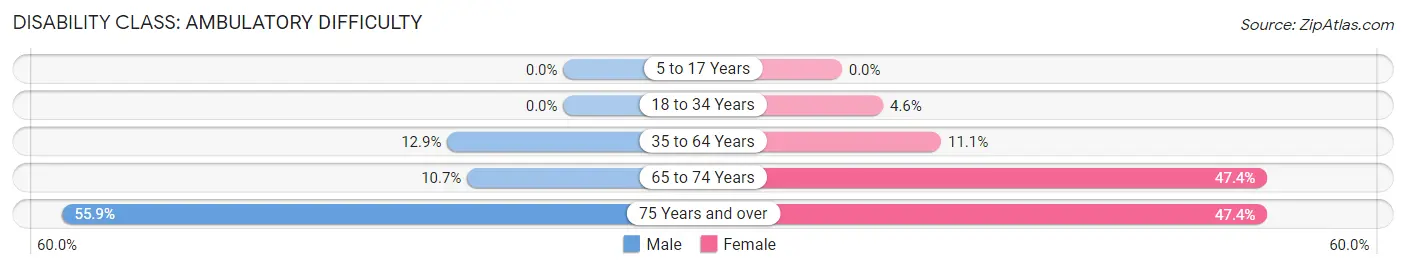
| Age Bracket | Male | Female |
| 5 to 17 Years | 0 (0.0%) | 0 (0.0%) |
| 18 to 34 Years | 0 (0.0%) | 5 (4.6%) |
| 35 to 64 Years | 15 (12.9%) | 19 (11.1%) |
| 65 to 74 Years | 3 (10.7%) | 18 (47.4%) |
| 75 Years and over | 19 (55.9%) | 18 (47.4%) |
Disability Class: Self-Care Difficulty
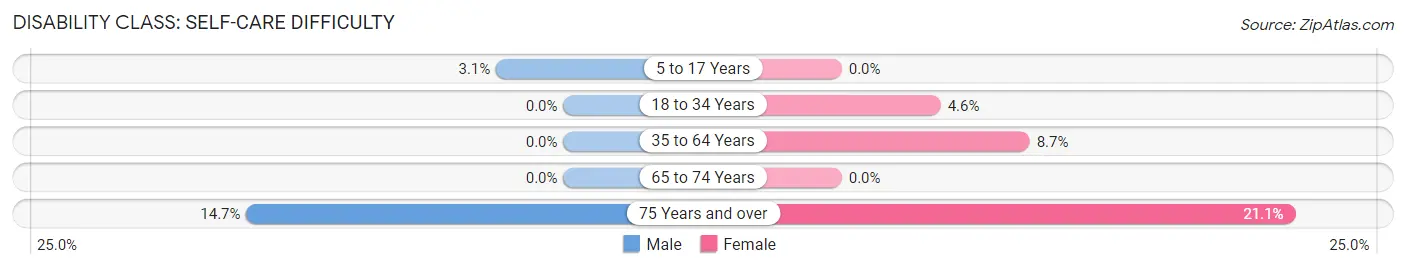
| Age Bracket | Male | Female |
| 5 to 17 Years | 4 (3.1%) | 0 (0.0%) |
| 18 to 34 Years | 0 (0.0%) | 5 (4.6%) |
| 35 to 64 Years | 0 (0.0%) | 15 (8.7%) |
| 65 to 74 Years | 0 (0.0%) | 0 (0.0%) |
| 75 Years and over | 5 (14.7%) | 8 (21.0%) |
Technology Access in St Ignatius
Computing Device Access in St Ignatius
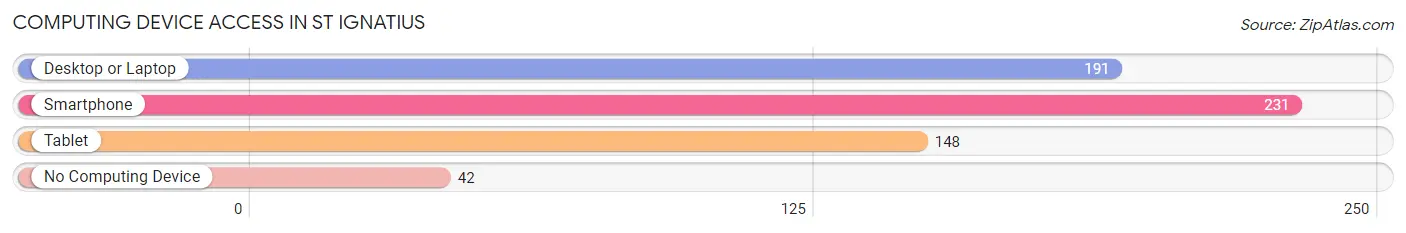
| Device Type | # Households | % Households |
| Desktop or Laptop | 191 | 62.2% |
| Smartphone | 231 | 75.2% |
| Tablet | 148 | 48.2% |
| No Computing Device | 42 | 13.7% |
| Total | 307 | 100.0% |
Internet Access in St Ignatius
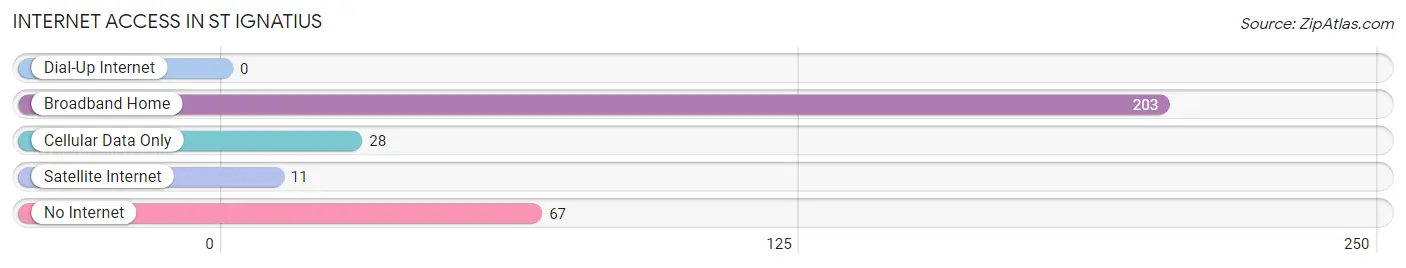
| Internet Type | # Households | % Households |
| Dial-Up Internet | 0 | 0.0% |
| Broadband Home | 203 | 66.1% |
| Cellular Data Only | 28 | 9.1% |
| Satellite Internet | 11 | 3.6% |
| No Internet | 67 | 21.8% |
| Total | 307 | 100.0% |
St Ignatius Summary
St Ignatius is a small town located in the western part of Montana, in the United States. It is situated in Lake County, and is the county seat. The town is located on the Flathead Indian Reservation, and is home to the Confederated Salish and Kootenai Tribes. The town has a population of 1,039, according to the 2010 census.
History
St Ignatius was founded in 1891 by Father Pierre-Jean De Smet, a Jesuit missionary. He named the town after St Ignatius of Loyola, the founder of the Jesuit order. The town was originally a mission for the Flathead Indians, and was the first permanent settlement in the area. The mission was established to provide education and religious instruction to the local Native Americans.
In the early 1900s, the town began to grow as more settlers moved into the area. The town was incorporated in 1909, and the first mayor was elected in 1910. The town continued to grow, and by the 1920s, it had become a thriving agricultural and commercial center.
Geography
St Ignatius is located in western Montana, in Lake County. It is situated on the Flathead Indian Reservation, and is surrounded by the Mission Mountains to the east and the Flathead River to the west. The town is located at an elevation of 3,400 feet, and has a total area of 1.2 square miles.
The climate in St Ignatius is semi-arid, with hot summers and cold winters. The average annual temperature is 44 degrees Fahrenheit, and the average annual precipitation is 16 inches.
Economy
The economy of St Ignatius is largely based on agriculture and tourism. The town is home to several farms, which produce a variety of crops, including wheat, barley, oats, and hay. The town is also home to several tourist attractions, including the St Ignatius Mission, the National Bison Range, and the Ninepipe Wildlife Refuge.
Demographics
As of the 2010 census, the population of St Ignatius was 1,039. The racial makeup of the town was 94.3% White, 0.7% Native American, 0.2% Asian, 0.1% African American, and 4.7% from other races. The median household income was $31,250, and the median family income was $37,500. The per capita income was $17,845.
St Ignatius is home to a large Native American population, with the Confederated Salish and Kootenai Tribes making up the majority of the population. The town is also home to a small Hispanic population, with the majority of the population being of Mexican descent.
Conclusion
St Ignatius is a small town located in western Montana, in the United States. It is situated in Lake County, and is the county seat. The town is located on the Flathead Indian Reservation, and is home to the Confederated Salish and Kootenai Tribes. The town has a population of 1,039, according to the 2010 census. The economy of St Ignatius is largely based on agriculture and tourism, and the town is home to a large Native American population.
Common Questions
What is Per Capita Income in St Ignatius?
Per Capita income in St Ignatius is $16,472.
What is the Median Family Income in St Ignatius?
Median Family Income in St Ignatius is $54,861.
What is the Median Household income in St Ignatius?
Median Household Income in St Ignatius is $46,250.
What is Income or Wage Gap in St Ignatius?
Income or Wage Gap in St Ignatius is 9.4%.
Women in St Ignatius earn 90.6 cents for every dollar earned by a man.
What is Inequality or Gini Index in St Ignatius?
Inequality or Gini Index in St Ignatius is 0.37.
What is the Total Population of St Ignatius?
Total Population of St Ignatius is 1,019.
What is the Total Male Population of St Ignatius?
Total Male Population of St Ignatius is 488.
What is the Total Female Population of St Ignatius?
Total Female Population of St Ignatius is 531.
What is the Ratio of Males per 100 Females in St Ignatius?
There are 91.90 Males per 100 Females in St Ignatius.
What is the Ratio of Females per 100 Males in St Ignatius?
There are 108.81 Females per 100 Males in St Ignatius.
What is the Median Population Age in St Ignatius?
Median Population Age in St Ignatius is 28.7 Years.
What is the Average Family Size in St Ignatius
Average Family Size in St Ignatius is 4.0 People.
What is the Average Household Size in St Ignatius
Average Household Size in St Ignatius is 3.3 People.
How Large is the Labor Force in St Ignatius?
There are 350 People in the Labor Forcein in St Ignatius.
What is the Percentage of People in the Labor Force in St Ignatius?
52.8% of People are in the Labor Force in St Ignatius.
What is the Unemployment Rate in St Ignatius?
Unemployment Rate in St Ignatius is 6.9%.