South Glastonbury, MT Map & Demographics
South Glastonbury Map
South Glastonbury Overview
$41,262
PER CAPITA INCOME
$55,278
AVG HOUSEHOLD INCOME
0.40
INEQUALITY / GINI INDEX
276
TOTAL POPULATION
125
MALE POPULATION
151
FEMALE POPULATION
82.78
MALES / 100 FEMALES
120.80
FEMALES / 100 MALES
59.8
MEDIAN AGE
1.9
AVG FAMILY SIZE
1.4
AVG HOUSEHOLD SIZE
110
LABOR FORCE [ PEOPLE ]
40.6%
PERCENT IN LABOR FORCE
Income in South Glastonbury
Income Overview in South Glastonbury
| Characteristic | Number | Measure |
| Per Capita Income | 276 | $41,262 |
| Median Family Income | 80 | $0 |
| Mean Family Income | 80 | $70,678 |
| Median Household Income | 196 | $55,278 |
| Mean Household Income | 196 | $58,791 |
| Income Deficit | 80 | $0 |
| Wage / Income Gap (%) | 276 | 0.00% |
| Wage / Income Gap ($) | 276 | 100.00¢ per $1 |
| Gini / Inequality Index | 276 | 0.40 |
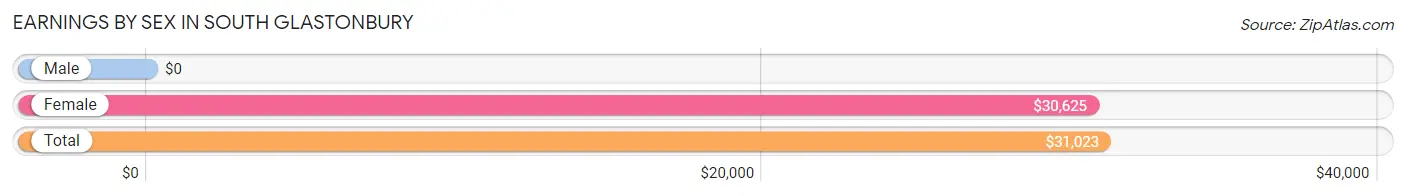
Earnings by Sex in South Glastonbury
| Sex | Number | Average Earnings |
| Male | 71 (50.0%) | $0 |
| Female | 71 (50.0%) | $30,625 |
| Total | 142 (100.0%) | $31,023 |
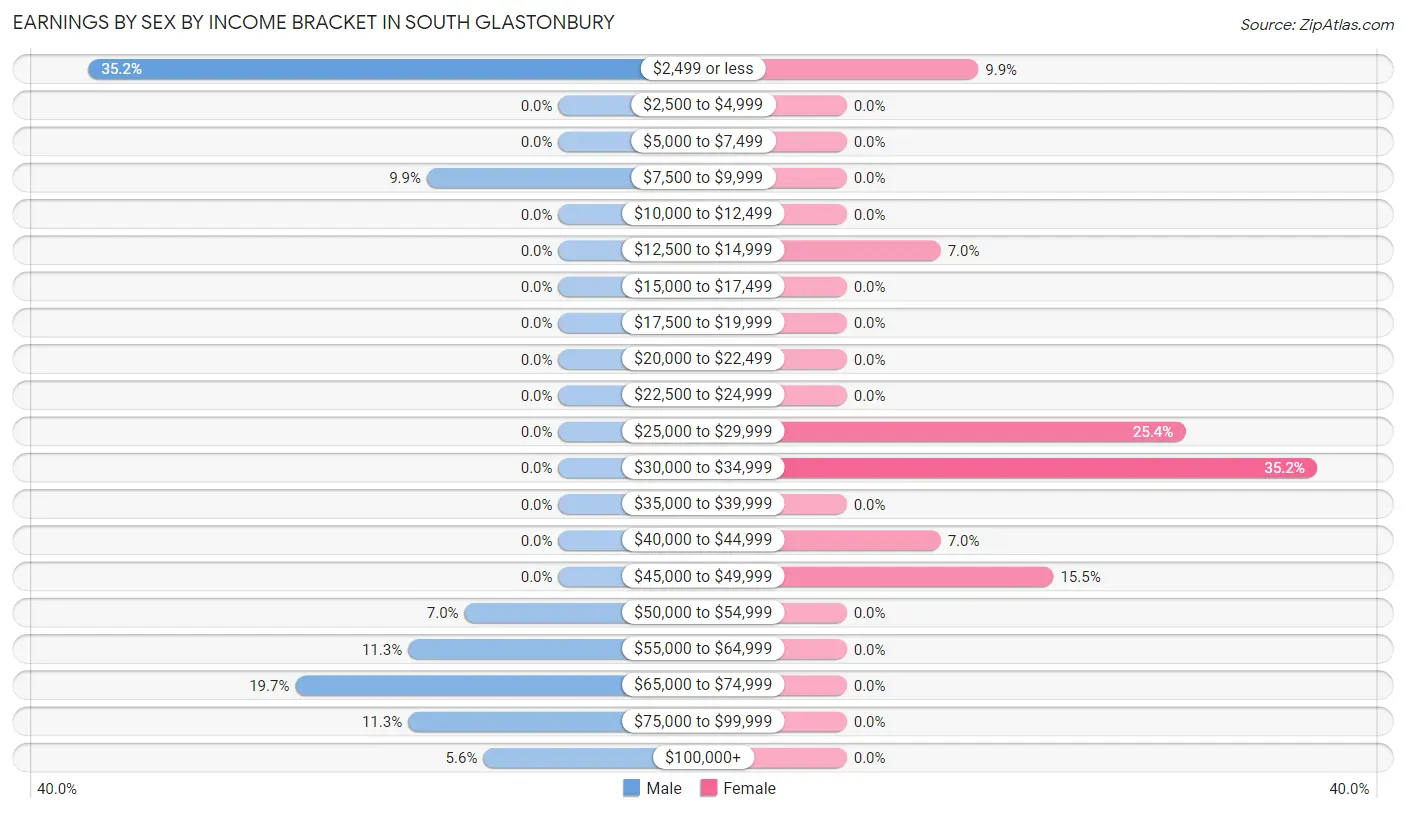
Earnings by Sex by Income Bracket in South Glastonbury
The most common earnings brackets in South Glastonbury are $2,499 or less for men (25 | 35.2%) and $30,000 to $34,999 for women (25 | 35.2%).
| Income | Male | Female |
| $2,499 or less | 25 (35.2%) | 7 (9.9%) |
| $2,500 to $4,999 | 0 (0.0%) | 0 (0.0%) |
| $5,000 to $7,499 | 0 (0.0%) | 0 (0.0%) |
| $7,500 to $9,999 | 7 (9.9%) | 0 (0.0%) |
| $10,000 to $12,499 | 0 (0.0%) | 0 (0.0%) |
| $12,500 to $14,999 | 0 (0.0%) | 5 (7.0%) |
| $15,000 to $17,499 | 0 (0.0%) | 0 (0.0%) |
| $17,500 to $19,999 | 0 (0.0%) | 0 (0.0%) |
| $20,000 to $22,499 | 0 (0.0%) | 0 (0.0%) |
| $22,500 to $24,999 | 0 (0.0%) | 0 (0.0%) |
| $25,000 to $29,999 | 0 (0.0%) | 18 (25.4%) |
| $30,000 to $34,999 | 0 (0.0%) | 25 (35.2%) |
| $35,000 to $39,999 | 0 (0.0%) | 0 (0.0%) |
| $40,000 to $44,999 | 0 (0.0%) | 5 (7.0%) |
| $45,000 to $49,999 | 0 (0.0%) | 11 (15.5%) |
| $50,000 to $54,999 | 5 (7.0%) | 0 (0.0%) |
| $55,000 to $64,999 | 8 (11.3%) | 0 (0.0%) |
| $65,000 to $74,999 | 14 (19.7%) | 0 (0.0%) |
| $75,000 to $99,999 | 8 (11.3%) | 0 (0.0%) |
| $100,000+ | 4 (5.6%) | 0 (0.0%) |
| Total | 71 (100.0%) | 71 (100.0%) |
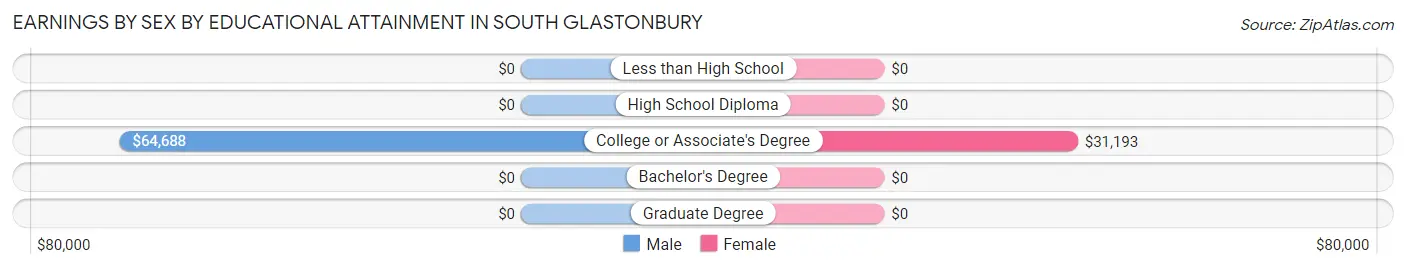
Earnings by Sex by Educational Attainment in South Glastonbury
| Educational Attainment | Male Income | Female Income |
| Less than High School | - | - |
| High School Diploma | - | - |
| College or Associate's Degree | $64,688 | $31,193 |
| Bachelor's Degree | - | - |
| Graduate Degree | - | - |
| Total | - | - |
Family Income in South Glastonbury
Family Income Brackets in South Glastonbury
According to the South Glastonbury family income data, there are 25 families falling into the $100,000 to $149,999 income range, which is the most common income bracket and makes up 31.2% of all families.
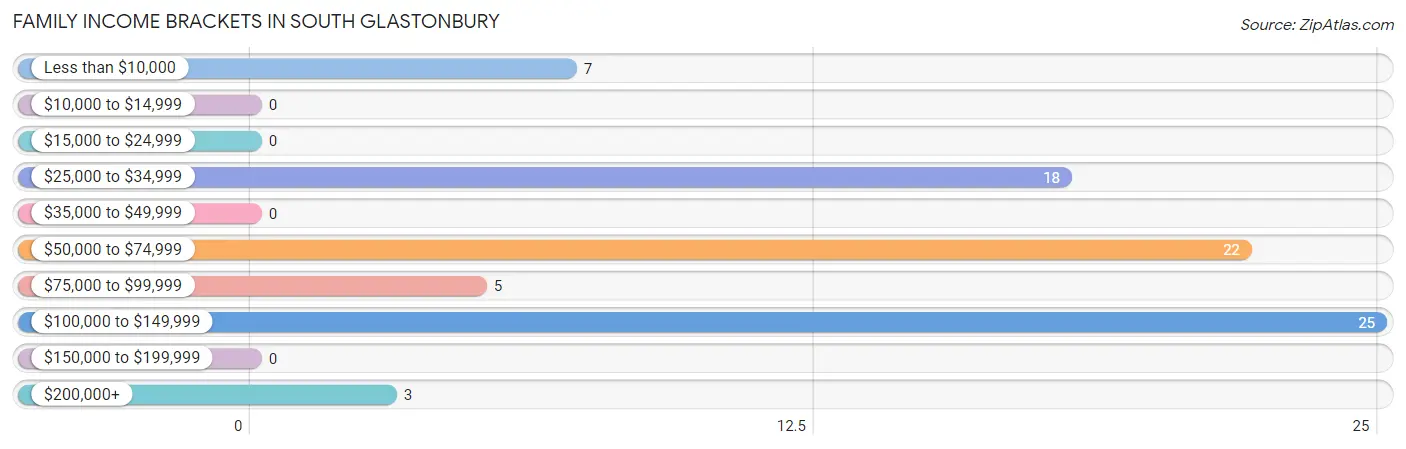
| Income Bracket | # Families | % Families |
| Less than $10,000 | 7 | 8.8% |
| $10,000 to $14,999 | 0 | 0.0% |
| $15,000 to $24,999 | 0 | 0.0% |
| $25,000 to $34,999 | 18 | 22.5% |
| $35,000 to $49,999 | 0 | 0.0% |
| $50,000 to $74,999 | 22 | 27.5% |
| $75,000 to $99,999 | 5 | 6.3% |
| $100,000 to $149,999 | 25 | 31.3% |
| $150,000 to $199,999 | 0 | 0.0% |
| $200,000+ | 3 | 3.8% |
Family Income by Famaliy Size in South Glastonbury
| Income Bracket | # Families | Median Income |
| 2-Person Families | 80 (100.0%) | $0 |
| 3-Person Families | 0 (0.0%) | $0 |
| 4-Person Families | 0 (0.0%) | $0 |
| 5-Person Families | 0 (0.0%) | $0 |
| 6-Person Families | 0 (0.0%) | $0 |
| 7+ Person Families | 0 (0.0%) | $0 |
| Total | 80 (100.0%) | $0 |
Family Income by Number of Earners in South Glastonbury
| Number of Earners | # Families | Median Income |
| No Earners | 39 (48.7%) | $0 |
| 1 Earner | 4 (5.0%) | $0 |
| 2 Earners | 37 (46.3%) | $0 |
| 3+ Earners | 0 (0.0%) | $0 |
| Total | 80 (100.0%) | $0 |
Household Income in South Glastonbury
Household Income Brackets in South Glastonbury
With 65 households falling in the category, the $50,000 to $74,999 income range is the most frequent in South Glastonbury, accounting for 33.2% of all households.
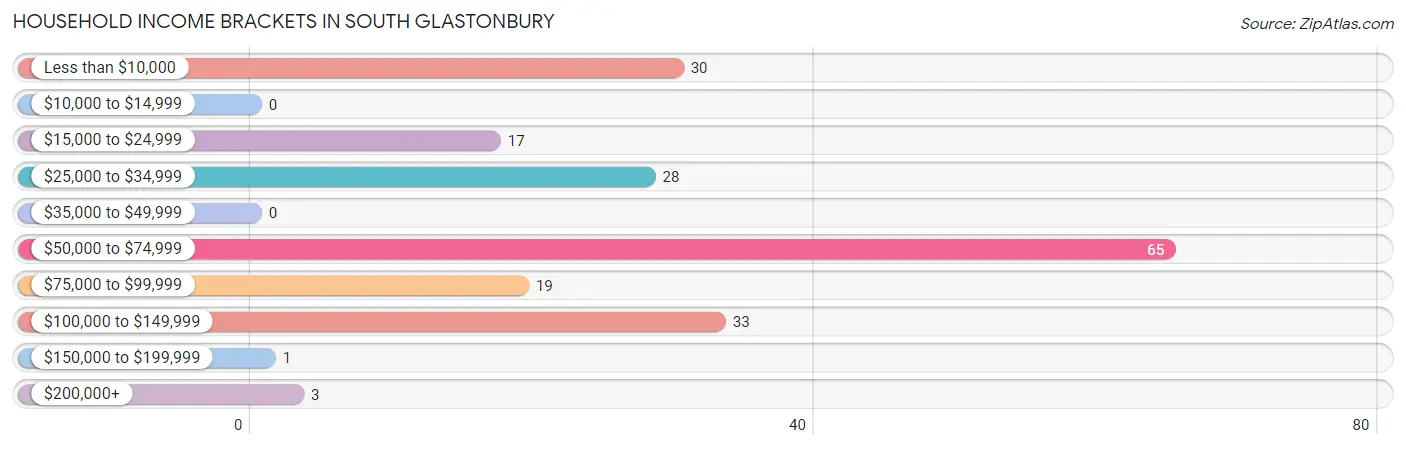
| Income Bracket | # Households | % Households |
| Less than $10,000 | 30 | 15.3% |
| $10,000 to $14,999 | 0 | 0.0% |
| $15,000 to $24,999 | 17 | 8.7% |
| $25,000 to $34,999 | 28 | 14.3% |
| $35,000 to $49,999 | 0 | 0.0% |
| $50,000 to $74,999 | 65 | 33.2% |
| $75,000 to $99,999 | 19 | 9.7% |
| $100,000 to $149,999 | 33 | 16.8% |
| $150,000 to $199,999 | 1 | 0.5% |
| $200,000+ | 3 | 1.5% |
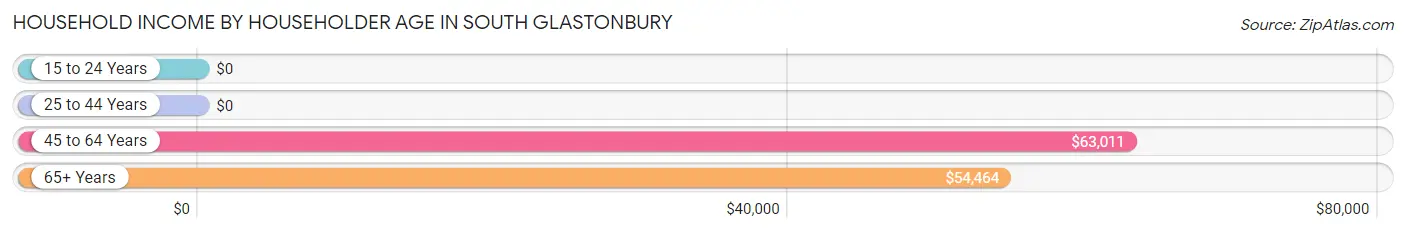
Household Income by Householder Age in South Glastonbury
The median household income in South Glastonbury is $55,278, with the highest median household income of $63,011 found in the 45 to 64 years age bracket for the primary householder. A total of 105 households (53.6%) fall into this category.
| Income Bracket | # Households | Median Income |
| 15 to 24 Years | 0 (0.0%) | $0 |
| 25 to 44 Years | 4 (2.0%) | $0 |
| 45 to 64 Years | 105 (53.6%) | $63,011 |
| 65+ Years | 87 (44.4%) | $54,464 |
| Total | 196 (100.0%) | $55,278 |
Poverty in South Glastonbury
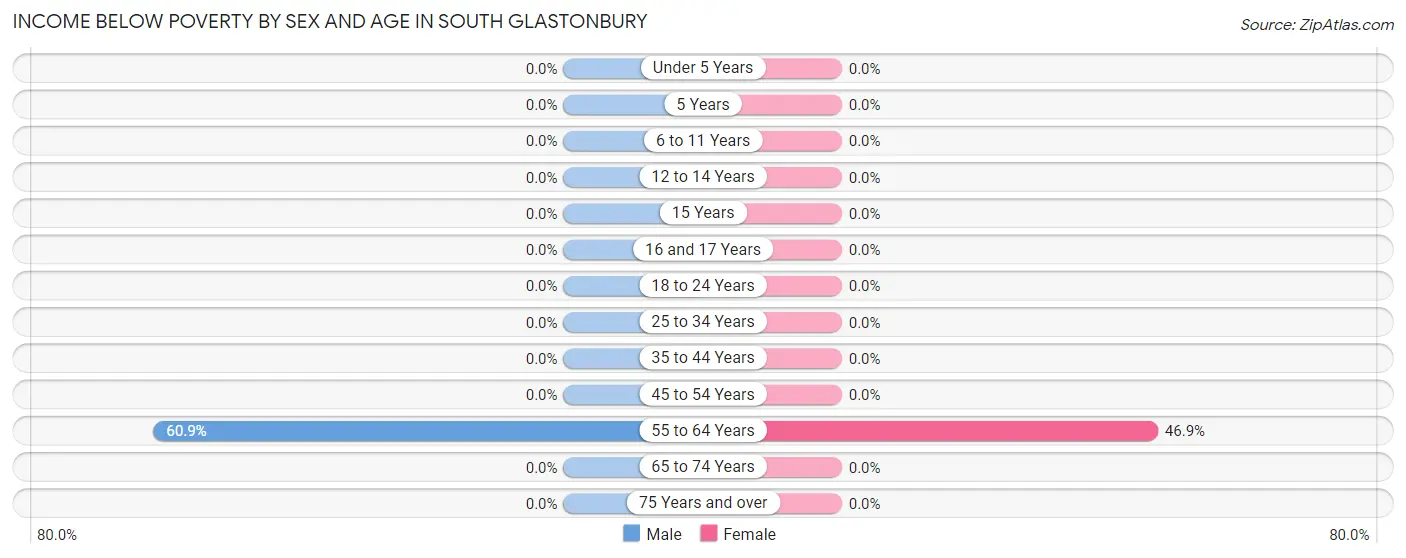
Income Below Poverty by Sex and Age in South Glastonbury
With 11.2% poverty level for males and 15.2% for females among the residents of South Glastonbury, 55 to 64 year old males and 55 to 64 year old females are the most vulnerable to poverty, with 14 males (60.9%) and 23 females (46.9%) in their respective age groups living below the poverty level.
| Age Bracket | Male | Female |
| Under 5 Years | 0 (0.0%) | 0 (0.0%) |
| 5 Years | 0 (0.0%) | 0 (0.0%) |
| 6 to 11 Years | 0 (0.0%) | 0 (0.0%) |
| 12 to 14 Years | 0 (0.0%) | 0 (0.0%) |
| 15 Years | 0 (0.0%) | 0 (0.0%) |
| 16 and 17 Years | 0 (0.0%) | 0 (0.0%) |
| 18 to 24 Years | 0 (0.0%) | 0 (0.0%) |
| 25 to 34 Years | 0 (0.0%) | 0 (0.0%) |
| 35 to 44 Years | 0 (0.0%) | 0 (0.0%) |
| 45 to 54 Years | 0 (0.0%) | 0 (0.0%) |
| 55 to 64 Years | 14 (60.9%) | 23 (46.9%) |
| 65 to 74 Years | 0 (0.0%) | 0 (0.0%) |
| 75 Years and over | 0 (0.0%) | 0 (0.0%) |
| Total | 14 (11.2%) | 23 (15.2%) |
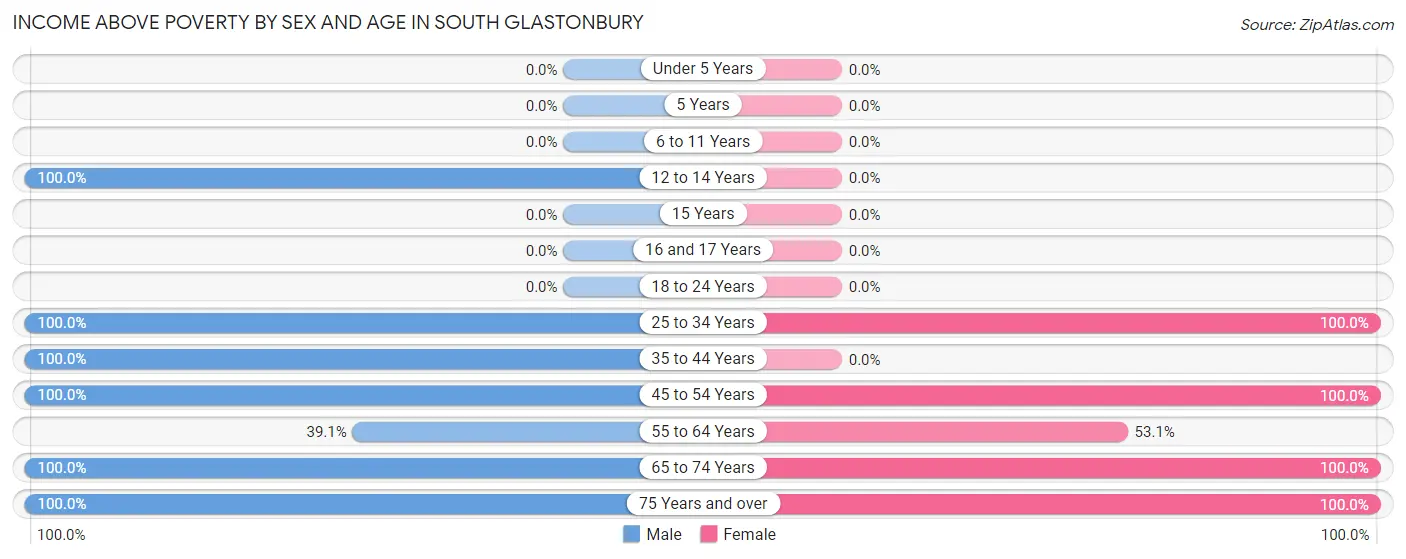
Income Above Poverty by Sex and Age in South Glastonbury
According to the poverty statistics in South Glastonbury, males aged 12 to 14 years and females aged 25 to 34 years are the age groups that are most secure financially, with 100.0% of males and 100.0% of females in these age groups living above the poverty line.
| Age Bracket | Male | Female |
| Under 5 Years | 0 (0.0%) | 0 (0.0%) |
| 5 Years | 0 (0.0%) | 0 (0.0%) |
| 6 to 11 Years | 0 (0.0%) | 0 (0.0%) |
| 12 to 14 Years | 5 (100.0%) | 0 (0.0%) |
| 15 Years | 0 (0.0%) | 0 (0.0%) |
| 16 and 17 Years | 0 (0.0%) | 0 (0.0%) |
| 18 to 24 Years | 0 (0.0%) | 0 (0.0%) |
| 25 to 34 Years | 18 (100.0%) | 1 (100.0%) |
| 35 to 44 Years | 4 (100.0%) | 0 (0.0%) |
| 45 to 54 Years | 26 (100.0%) | 37 (100.0%) |
| 55 to 64 Years | 9 (39.1%) | 26 (53.1%) |
| 65 to 74 Years | 10 (100.0%) | 21 (100.0%) |
| 75 Years and over | 39 (100.0%) | 43 (100.0%) |
| Total | 111 (88.8%) | 128 (84.8%) |
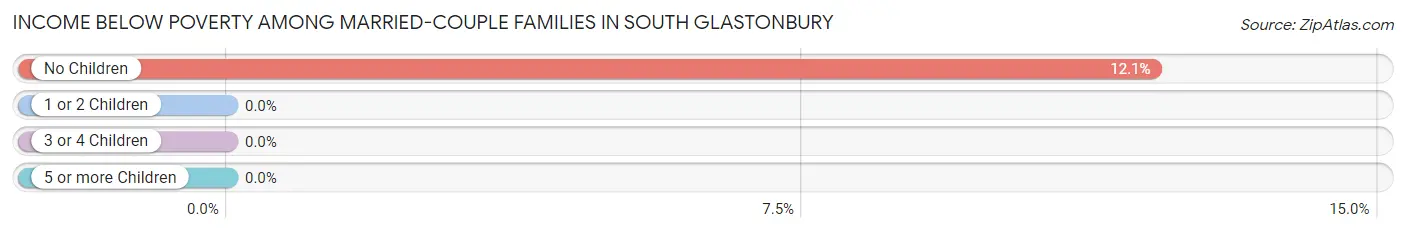
Income Below Poverty Among Married-Couple Families in South Glastonbury
The poverty statistics for married-couple families in South Glastonbury show that 12.1% or 7 of the total 58 families live below the poverty line. Families with no children have the highest poverty rate of 12.1%, comprising of 7 families. On the other hand, families with no children have the lowest poverty rate of 12.1%, which includes 7 families.
| Children | Above Poverty | Below Poverty |
| No Children | 51 (87.9%) | 7 (12.1%) |
| 1 or 2 Children | 0 (0.0%) | 0 (0.0%) |
| 3 or 4 Children | 0 (0.0%) | 0 (0.0%) |
| 5 or more Children | 0 (0.0%) | 0 (0.0%) |
| Total | 51 (87.9%) | 7 (12.1%) |
Income Below Poverty Among Single-Parent Households in South Glastonbury
| Children | Single Father | Single Mother |
| No Children | 0 (0.0%) | 0 (0.0%) |
| 1 or 2 Children | 0 (0.0%) | 0 (0.0%) |
| 3 or 4 Children | 0 (0.0%) | 0 (0.0%) |
| 5 or more Children | 0 (0.0%) | 0 (0.0%) |
| Total | 0 (0.0%) | 0 (0.0%) |
Income Below Poverty Among Married-Couple vs Single-Parent Households in South Glastonbury
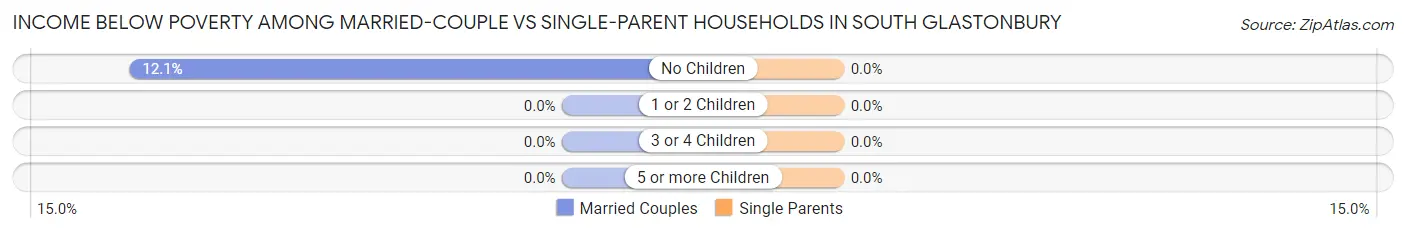
| Children | Married-Couple Families | Single-Parent Households |
| No Children | 7 (12.1%) | 0 (0.0%) |
| 1 or 2 Children | 0 (0.0%) | 0 (0.0%) |
| 3 or 4 Children | 0 (0.0%) | 0 (0.0%) |
| 5 or more Children | 0 (0.0%) | 0 (0.0%) |
| Total | 7 (12.1%) | 0 (0.0%) |
Race in South Glastonbury
The most populous races in South Glastonbury are , and White / Caucasian (276 | 100.0%).
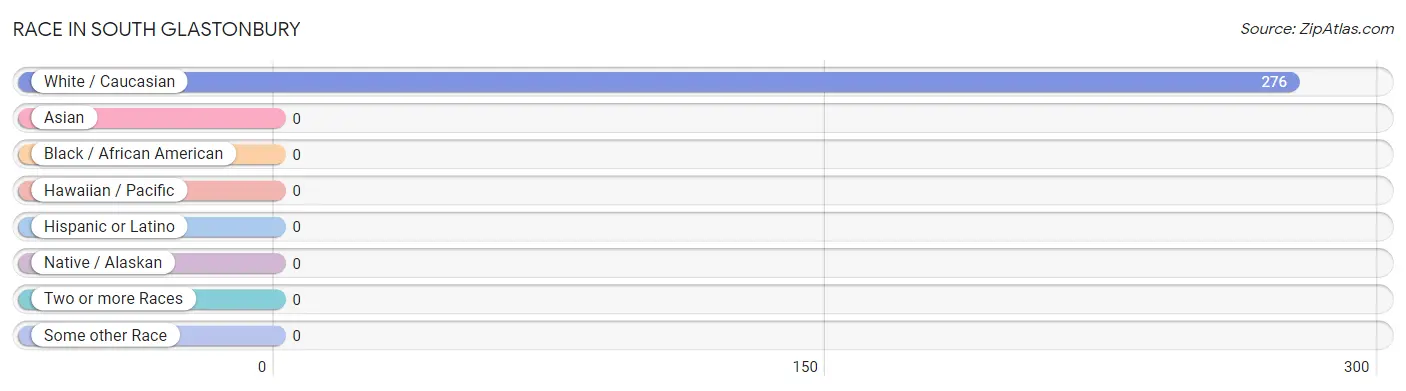
| Race | # Population | % Population |
| Asian | 0 | 0.0% |
| Black / African American | 0 | 0.0% |
| Hawaiian / Pacific | 0 | 0.0% |
| Hispanic or Latino | 0 | 0.0% |
| Native / Alaskan | 0 | 0.0% |
| White / Caucasian | 276 | 100.0% |
| Two or more Races | 0 | 0.0% |
| Some other Race | 0 | 0.0% |
| Total | 276 | 100.0% |
Ancestry in South Glastonbury
The most populous ancestries reported in South Glastonbury are Irish (65 | 23.5%), English (42 | 15.2%), German (37 | 13.4%), Norwegian (37 | 13.4%), and Dutch (36 | 13.0%), together accounting for 78.6% of all South Glastonbury residents.
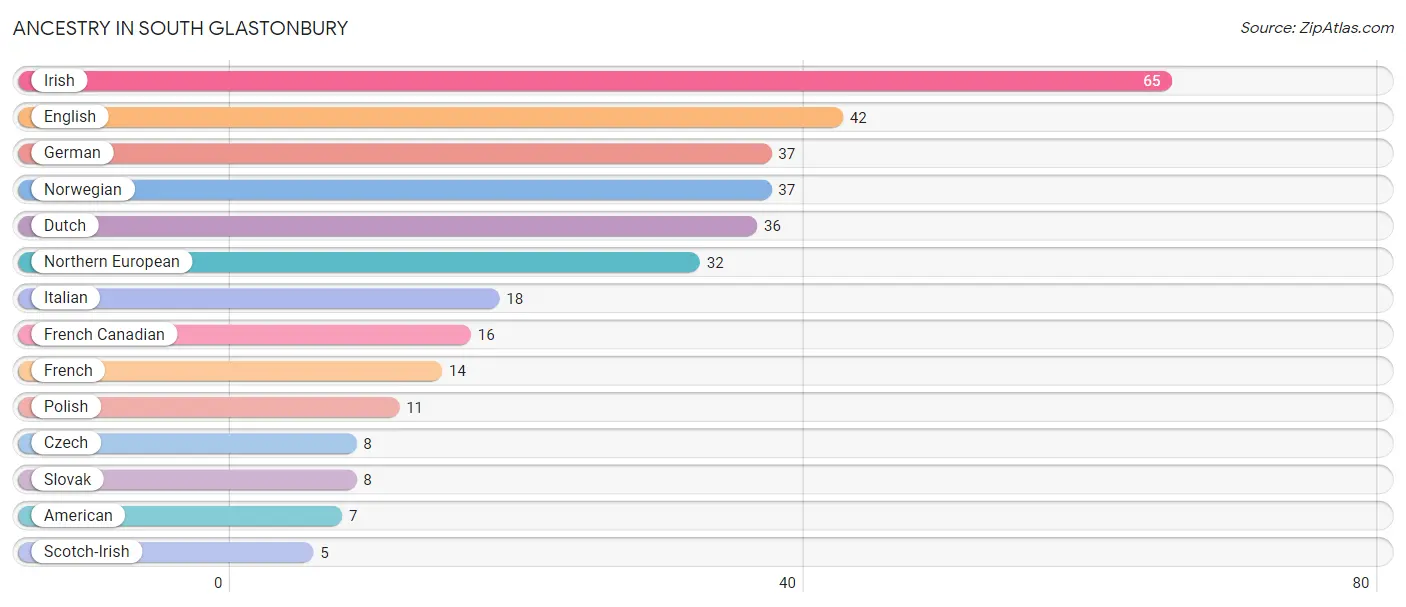
| Ancestry | # Population | % Population |
| American | 7 | 2.5% |
| Czech | 8 | 2.9% |
| Dutch | 36 | 13.0% |
| English | 42 | 15.2% |
| French | 14 | 5.1% |
| French Canadian | 16 | 5.8% |
| German | 37 | 13.4% |
| Irish | 65 | 23.5% |
| Italian | 18 | 6.5% |
| Northern European | 32 | 11.6% |
| Norwegian | 37 | 13.4% |
| Polish | 11 | 4.0% |
| Scotch-Irish | 5 | 1.8% |
| Slovak | 8 | 2.9% | View All 14 Rows |
Immigrants in South Glastonbury
The most numerous immigrant groups reported in South Glastonbury came from Europe (18 | 6.5%), Netherlands (18 | 6.5%), Western Europe (18 | 6.5%), Asia (1 | 0.4%), and Eastern Asia (1 | 0.4%), together accounting for 20.3% of all South Glastonbury residents.
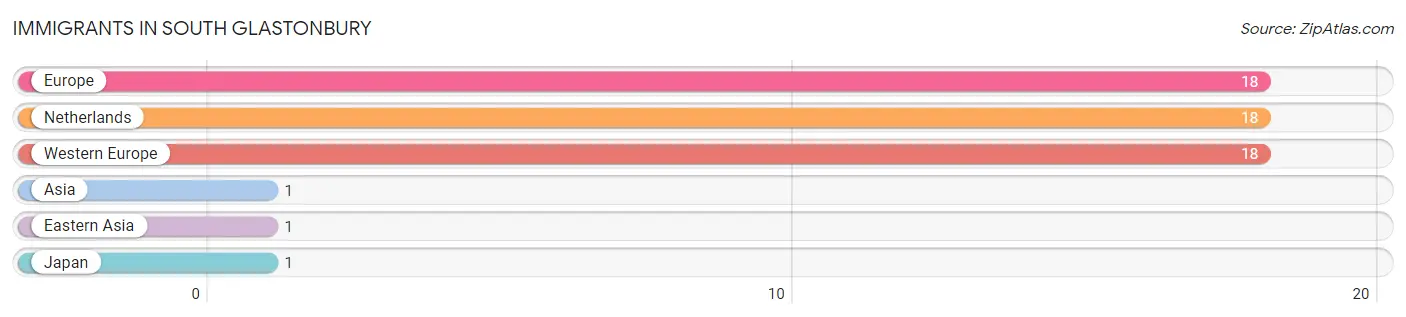
| Immigration Origin | # Population | % Population |
| Asia | 1 | 0.4% |
| Eastern Asia | 1 | 0.4% |
| Europe | 18 | 6.5% |
| Japan | 1 | 0.4% |
| Netherlands | 18 | 6.5% |
| Western Europe | 18 | 6.5% | View All 6 Rows |
Sex and Age in South Glastonbury
Sex and Age in South Glastonbury
The most populous age groups in South Glastonbury are 80 to 84 Years (39 | 31.2%) for men and 55 to 59 Years (44 | 29.1%) for women.
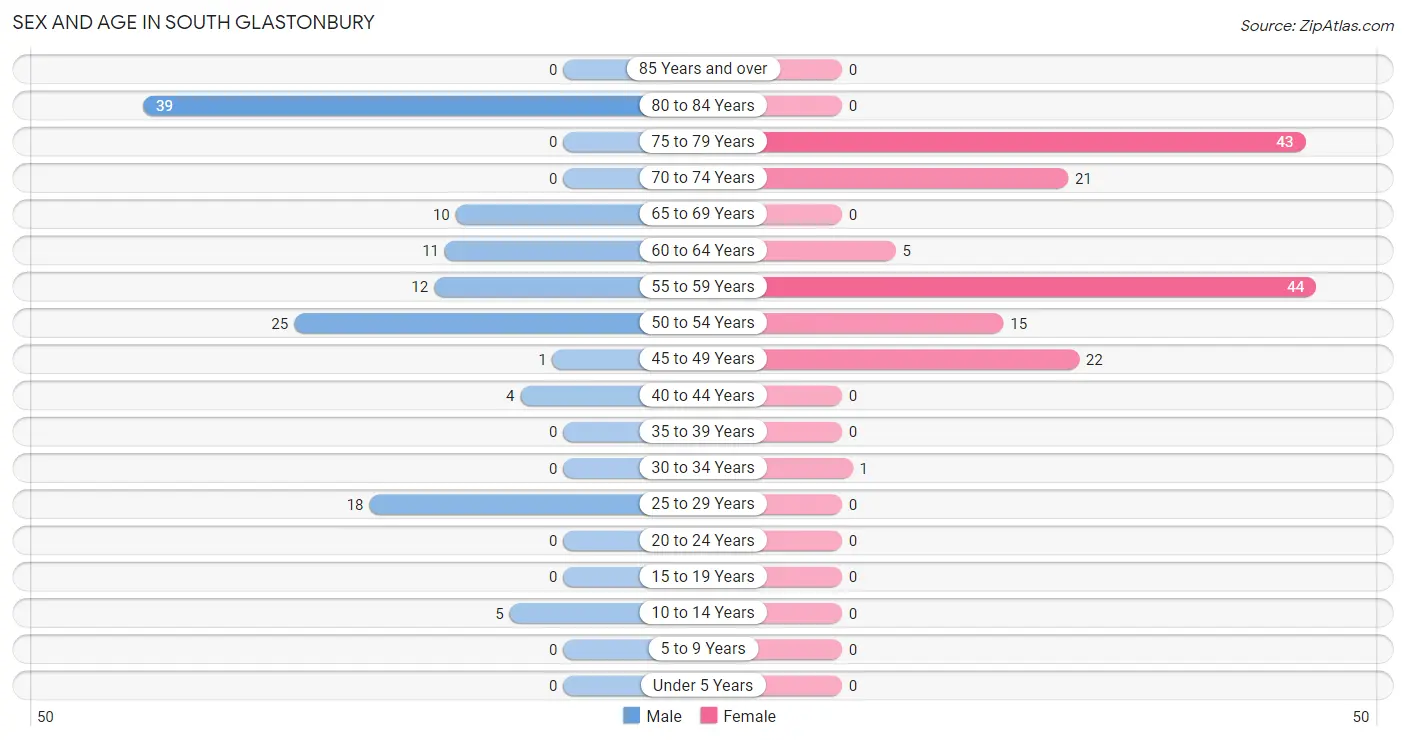
| Age Bracket | Male | Female |
| Under 5 Years | 0 (0.0%) | 0 (0.0%) |
| 5 to 9 Years | 0 (0.0%) | 0 (0.0%) |
| 10 to 14 Years | 5 (4.0%) | 0 (0.0%) |
| 15 to 19 Years | 0 (0.0%) | 0 (0.0%) |
| 20 to 24 Years | 0 (0.0%) | 0 (0.0%) |
| 25 to 29 Years | 18 (14.4%) | 0 (0.0%) |
| 30 to 34 Years | 0 (0.0%) | 1 (0.7%) |
| 35 to 39 Years | 0 (0.0%) | 0 (0.0%) |
| 40 to 44 Years | 4 (3.2%) | 0 (0.0%) |
| 45 to 49 Years | 1 (0.8%) | 22 (14.6%) |
| 50 to 54 Years | 25 (20.0%) | 15 (9.9%) |
| 55 to 59 Years | 12 (9.6%) | 44 (29.1%) |
| 60 to 64 Years | 11 (8.8%) | 5 (3.3%) |
| 65 to 69 Years | 10 (8.0%) | 0 (0.0%) |
| 70 to 74 Years | 0 (0.0%) | 21 (13.9%) |
| 75 to 79 Years | 0 (0.0%) | 43 (28.5%) |
| 80 to 84 Years | 39 (31.2%) | 0 (0.0%) |
| 85 Years and over | 0 (0.0%) | 0 (0.0%) |
| Total | 125 (100.0%) | 151 (100.0%) |
Families and Households in South Glastonbury
Median Family Size in South Glastonbury
The median family size in South Glastonbury is 1.85 persons per family, with single male/father families (4 | 5.0%) accounting for the largest median family size of 2.25 persons per family. On the other hand, married-couple families (58 | 72.5%) represent the smallest median family size with 1.78 persons per family.
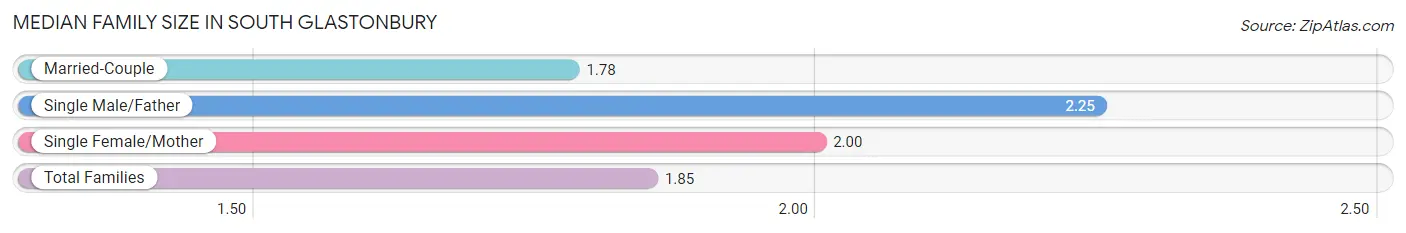
| Family Type | # Families | Family Size |
| Married-Couple | 58 (72.5%) | 1.78 |
| Single Male/Father | 4 (5.0%) | 2.25 |
| Single Female/Mother | 18 (22.5%) | 2.00 |
| Total Families | 80 (100.0%) | 1.85 |
Median Household Size in South Glastonbury
The median household size in South Glastonbury is 1.41 persons per household, with single male/father households (4 | 2.0%) accounting for the largest median household size of 2.25 persons per household. non-family households (116 | 59.2%) represent the smallest median household size with 1.10 persons per household.
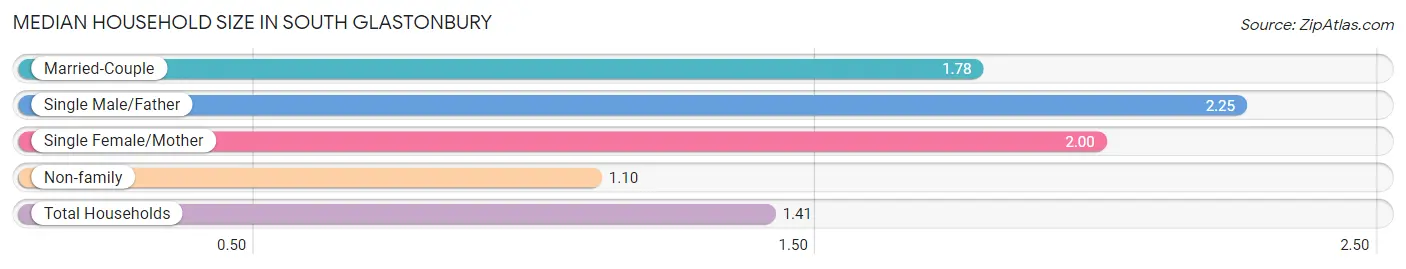
| Household Type | # Households | Household Size |
| Married-Couple | 58 (29.6%) | 1.78 |
| Single Male/Father | 4 (2.0%) | 2.25 |
| Single Female/Mother | 18 (9.2%) | 2.00 |
| Non-family | 116 (59.2%) | 1.10 |
| Total Households | 196 (100.0%) | 1.41 |
Household Size by Marriage Status in South Glastonbury
Out of a total of 196 households in South Glastonbury, 80 (40.8%) are family households, while 116 (59.2%) are nonfamily households. The most numerous type of family households are 2-person households, comprising 80, and the most common type of nonfamily households are 1-person households, comprising 107.
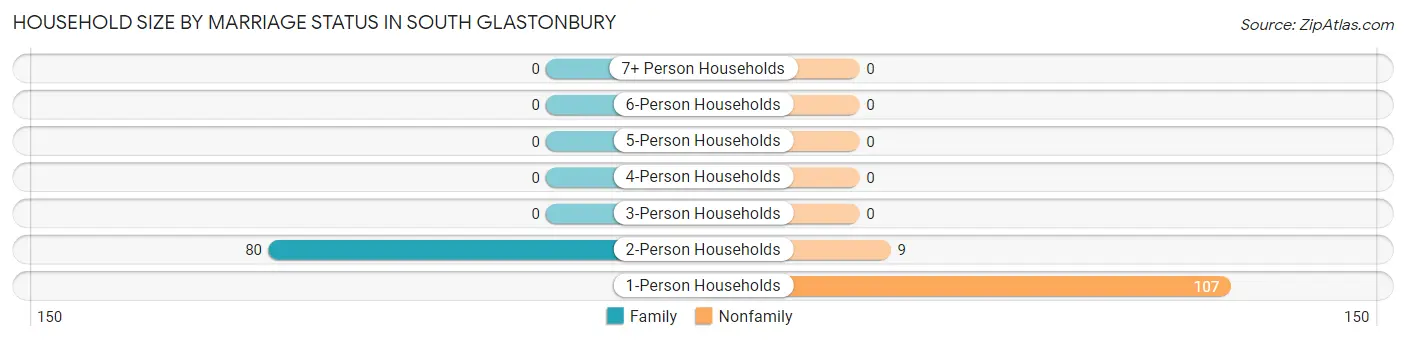
| Household Size | Family Households | Nonfamily Households |
| 1-Person Households | - | 107 (54.6%) |
| 2-Person Households | 80 (40.8%) | 9 (4.6%) |
| 3-Person Households | 0 (0.0%) | 0 (0.0%) |
| 4-Person Households | 0 (0.0%) | 0 (0.0%) |
| 5-Person Households | 0 (0.0%) | 0 (0.0%) |
| 6-Person Households | 0 (0.0%) | 0 (0.0%) |
| 7+ Person Households | 0 (0.0%) | 0 (0.0%) |
| Total | 80 (40.8%) | 116 (59.2%) |
Female Fertility in South Glastonbury
Fertility by Age in South Glastonbury
| Age Bracket | Women with Births | Births / 1,000 Women |
| 15 to 19 years | 0 (0.0%) | 0.0 |
| 20 to 34 years | 0 (0.0%) | 0.0 |
| 35 to 50 years | 0 (0.0%) | 0.0 |
| Total | 0 (0.0%) | 0.0 |
Fertility by Age by Marriage Status in South Glastonbury
| Age Bracket | Married | Unmarried |
| 15 to 19 years | 0 (0.0%) | 0 (0.0%) |
| 20 to 34 years | 0 (0.0%) | 0 (0.0%) |
| 35 to 50 years | 0 (0.0%) | 0 (0.0%) |
| Total | 0 (0.0%) | 0 (0.0%) |
Fertility by Education in South Glastonbury
| Educational Attainment | Women with Births | Births / 1,000 Women |
| Less than High School | 0 (0.0%) | 0.0 |
| High School Diploma | 0 (0.0%) | 0.0 |
| College or Associate's Degree | 0 (0.0%) | 0.0 |
| Bachelor's Degree | 0 (0.0%) | 0.0 |
| Graduate Degree | 0 (0.0%) | 0.0 |
| Total | 0 (0.0%) | 0.0 |
Fertility by Education by Marriage Status in South Glastonbury
| Educational Attainment | Married | Unmarried |
| Less than High School | 0 (0.0%) | 0 (0.0%) |
| High School Diploma | 0 (0.0%) | 0 (0.0%) |
| College or Associate's Degree | 0 (0.0%) | 0 (0.0%) |
| Bachelor's Degree | 0 (0.0%) | 0 (0.0%) |
| Graduate Degree | 0 (0.0%) | 0 (0.0%) |
| Total | 0 (0.0%) | 0 (0.0%) |
Employment Characteristics in South Glastonbury
Employment by Class of Employer in South Glastonbury
Among the 109 employed individuals in South Glastonbury, private company employees (71 | 65.1%), not-for-profit organizations (18 | 16.5%), and self-employed (incorporated) (14 | 12.8%) make up the most common classes of employment.
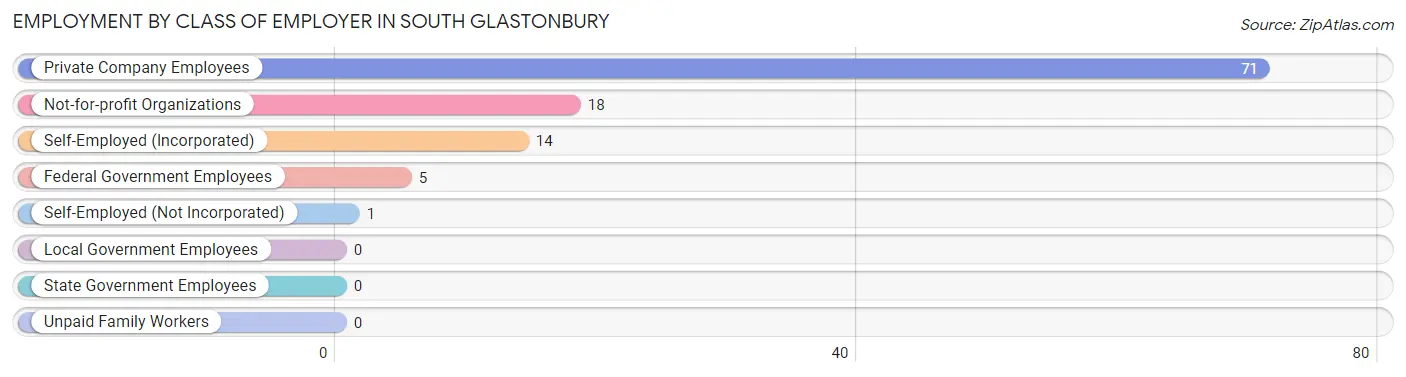
| Employer Class | # Employees | % Employees |
| Private Company Employees | 71 | 65.1% |
| Self-Employed (Incorporated) | 14 | 12.8% |
| Self-Employed (Not Incorporated) | 1 | 0.9% |
| Not-for-profit Organizations | 18 | 16.5% |
| Local Government Employees | 0 | 0.0% |
| State Government Employees | 0 | 0.0% |
| Federal Government Employees | 5 | 4.6% |
| Unpaid Family Workers | 0 | 0.0% |
| Total | 109 | 100.0% |
Employment Status by Age in South Glastonbury
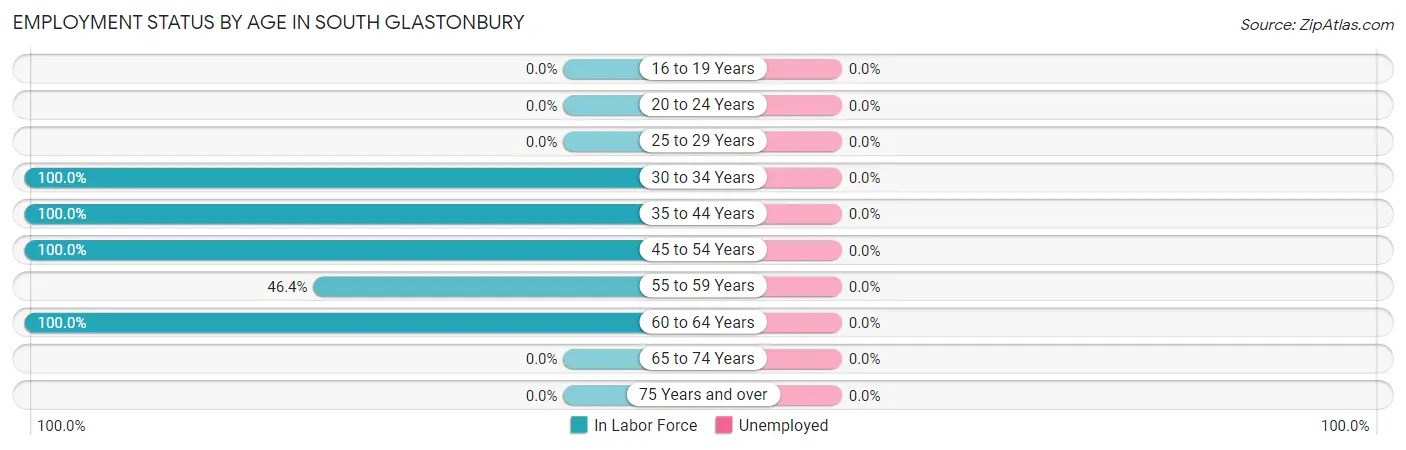
| Age Bracket | In Labor Force | Unemployed |
| 16 to 19 Years | 0 (0.0%) | 0 (0.0%) |
| 20 to 24 Years | 0 (0.0%) | 0 (0.0%) |
| 25 to 29 Years | 0 (0.0%) | 0 (0.0%) |
| 30 to 34 Years | 1 (100.0%) | 0 (0.0%) |
| 35 to 44 Years | 4 (100.0%) | 0 (0.0%) |
| 45 to 54 Years | 63 (100.0%) | 0 (0.0%) |
| 55 to 59 Years | 26 (46.4%) | 0 (0.0%) |
| 60 to 64 Years | 16 (100.0%) | 0 (0.0%) |
| 65 to 74 Years | 0 (0.0%) | 0 (0.0%) |
| 75 Years and over | 0 (0.0%) | 0 (0.0%) |
| Total | 110 (40.6%) | 0 (0.0%) |
Employment Status by Educational Attainment in South Glastonbury
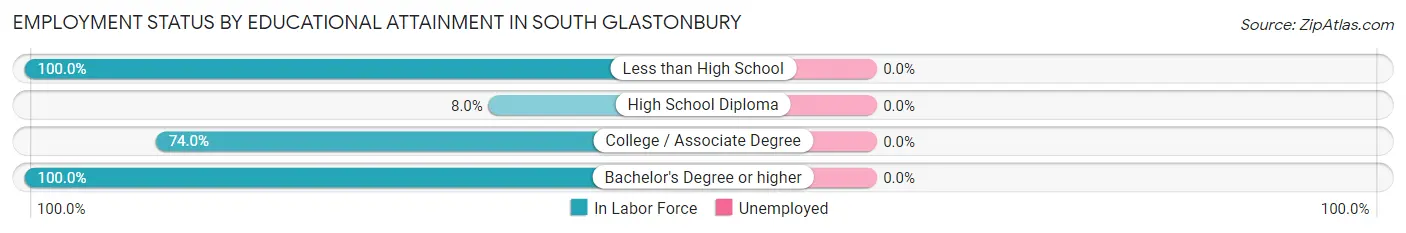
| Educational Attainment | In Labor Force | Unemployed |
| Less than High School | 10 (100.0%) | 0 (0.0%) |
| High School Diploma | 2 (8.0%) | 0 (0.0%) |
| College / Associate Degree | 71 (74.0%) | 0 (0.0%) |
| Bachelor's Degree or higher | 27 (100.0%) | 0 (0.0%) |
| Total | 110 (69.6%) | 0 (0.0%) |
Employment Occupations by Sex in South Glastonbury
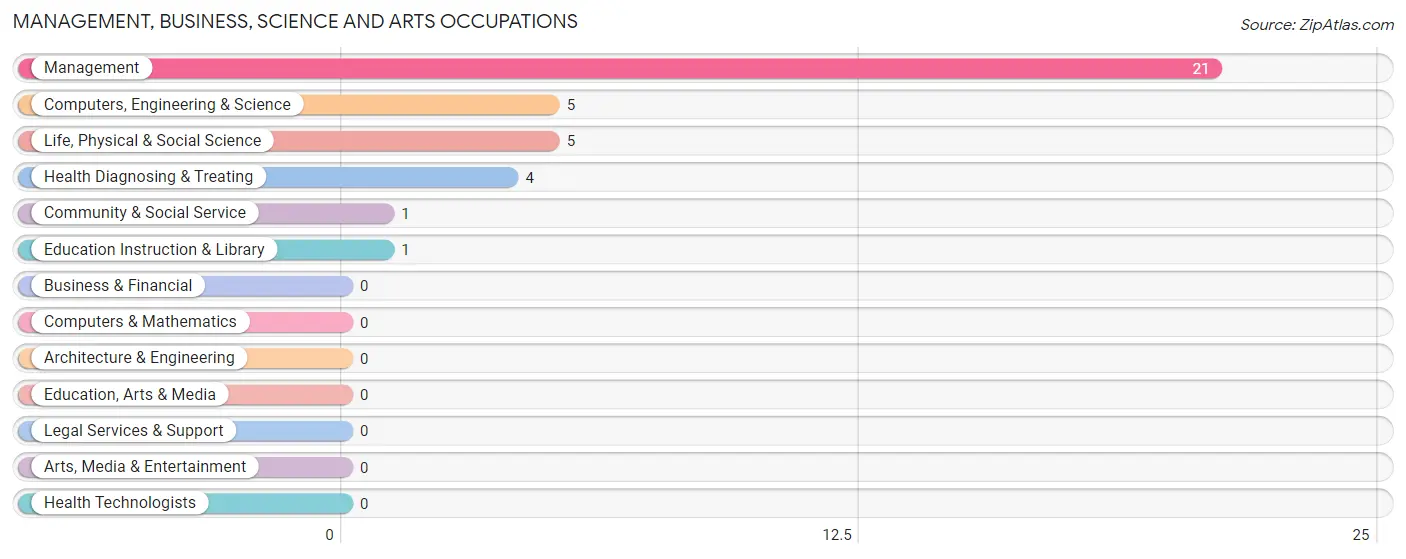
Management, Business, Science and Arts Occupations
The most common Management, Business, Science and Arts occupations in South Glastonbury are Management (21 | 19.1%), Computers, Engineering & Science (5 | 4.5%), Life, Physical & Social Science (5 | 4.5%), Health Diagnosing & Treating (4 | 3.6%), and Community & Social Service (1 | 0.9%).
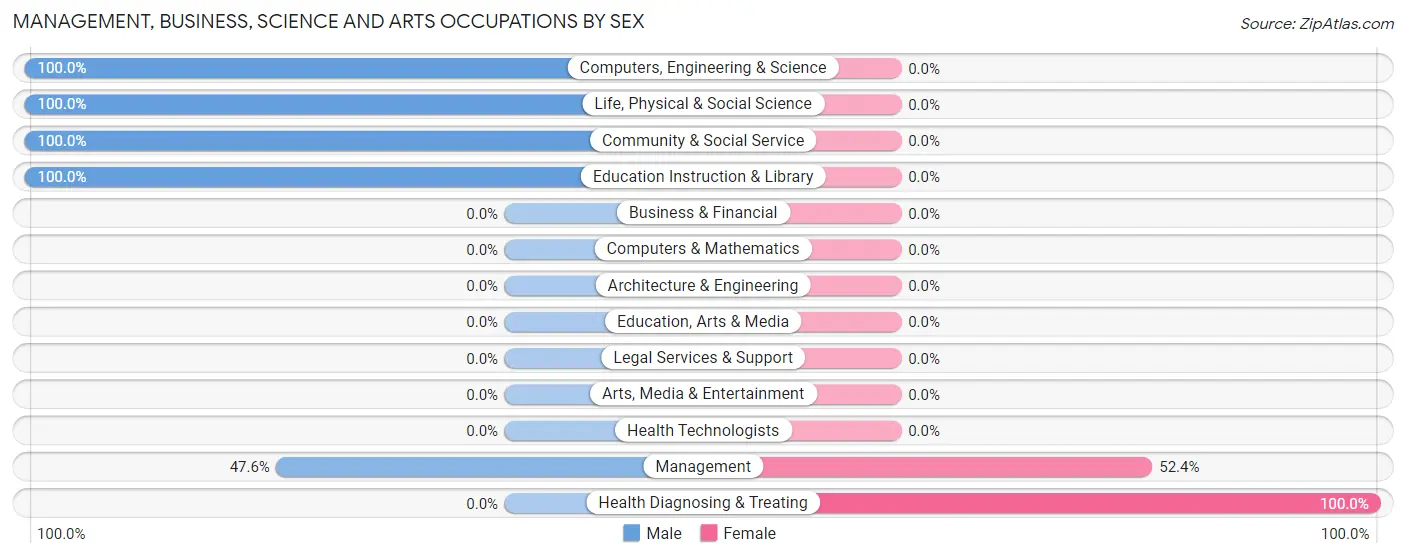
Management, Business, Science and Arts Occupations by Sex
Within the Management, Business, Science and Arts occupations in South Glastonbury, the most male-oriented occupations are Computers, Engineering & Science (100.0%), Life, Physical & Social Science (100.0%), and Community & Social Service (100.0%), while the most female-oriented occupations are Health Diagnosing & Treating (100.0%), and Management (52.4%).
| Occupation | Male | Female |
| Management | 10 (47.6%) | 11 (52.4%) |
| Business & Financial | 0 (0.0%) | 0 (0.0%) |
| Computers, Engineering & Science | 5 (100.0%) | 0 (0.0%) |
| Computers & Mathematics | 0 (0.0%) | 0 (0.0%) |
| Architecture & Engineering | 0 (0.0%) | 0 (0.0%) |
| Life, Physical & Social Science | 5 (100.0%) | 0 (0.0%) |
| Community & Social Service | 1 (100.0%) | 0 (0.0%) |
| Education, Arts & Media | 0 (0.0%) | 0 (0.0%) |
| Legal Services & Support | 0 (0.0%) | 0 (0.0%) |
| Education Instruction & Library | 1 (100.0%) | 0 (0.0%) |
| Arts, Media & Entertainment | 0 (0.0%) | 0 (0.0%) |
| Health Diagnosing & Treating | 0 (0.0%) | 4 (100.0%) |
| Health Technologists | 0 (0.0%) | 0 (0.0%) |
| Total (Category) | 16 (51.6%) | 15 (48.4%) |
| Total (Overall) | 46 (41.8%) | 64 (58.2%) |
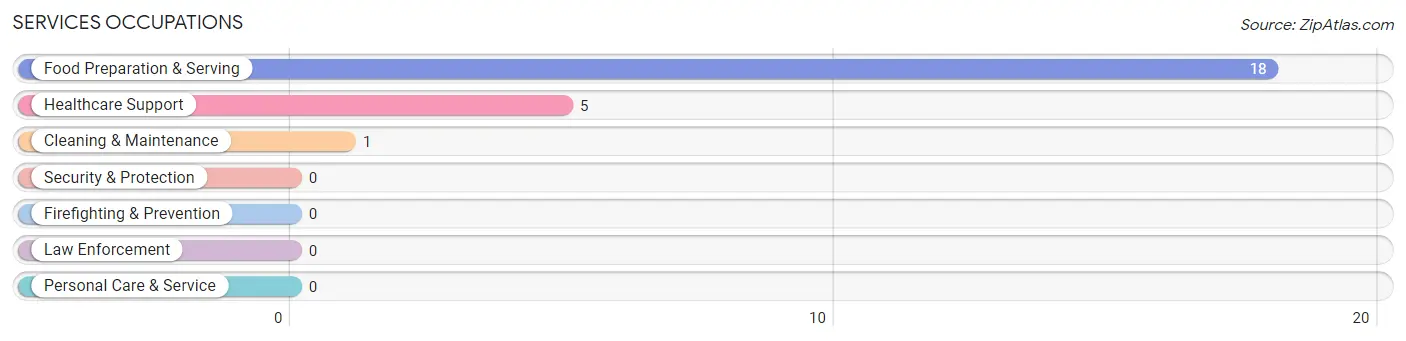
Services Occupations
The most common Services occupations in South Glastonbury are Food Preparation & Serving (18 | 16.4%), Healthcare Support (5 | 4.5%), and Cleaning & Maintenance (1 | 0.9%).
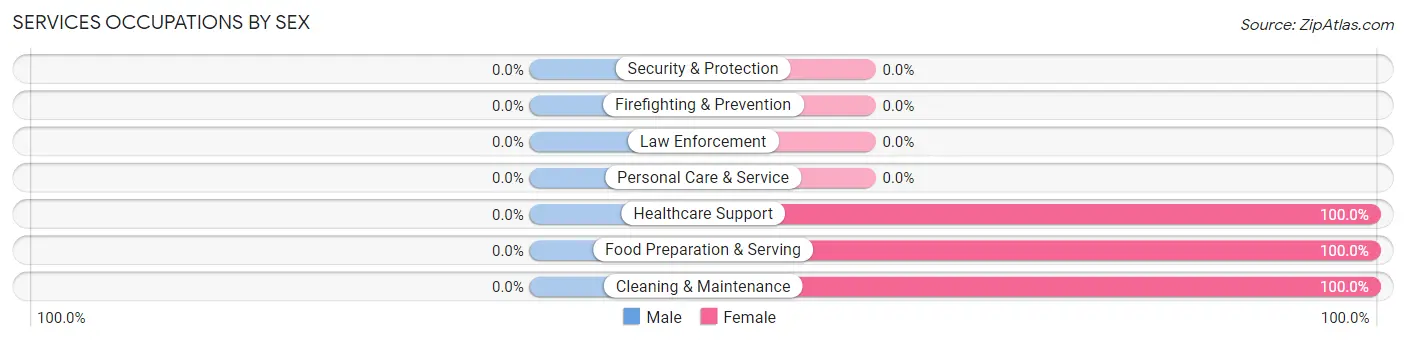
Services Occupations by Sex
| Occupation | Male | Female |
| Healthcare Support | 0 (0.0%) | 5 (100.0%) |
| Security & Protection | 0 (0.0%) | 0 (0.0%) |
| Firefighting & Prevention | 0 (0.0%) | 0 (0.0%) |
| Law Enforcement | 0 (0.0%) | 0 (0.0%) |
| Food Preparation & Serving | 0 (0.0%) | 18 (100.0%) |
| Cleaning & Maintenance | 0 (0.0%) | 1 (100.0%) |
| Personal Care & Service | 0 (0.0%) | 0 (0.0%) |
| Total (Category) | 0 (0.0%) | 24 (100.0%) |
| Total (Overall) | 46 (41.8%) | 64 (58.2%) |
Sales and Office Occupations
The most common Sales and Office occupations in South Glastonbury are Sales & Related (22 | 20.0%), and Office & Administration (3 | 2.7%).
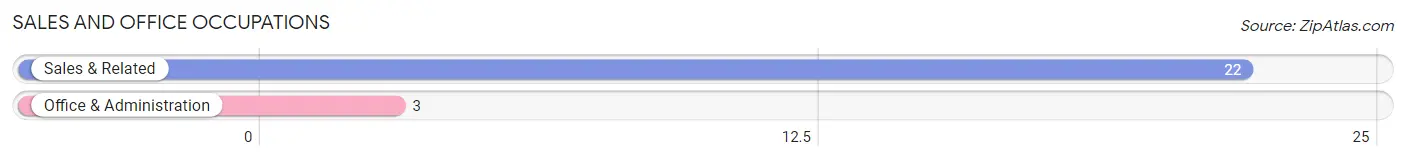
Sales and Office Occupations by Sex
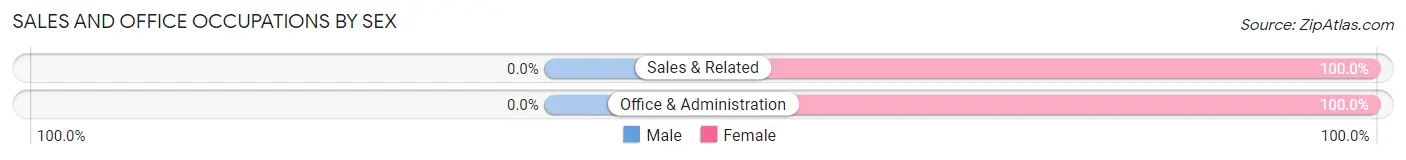
| Occupation | Male | Female |
| Sales & Related | 0 (0.0%) | 22 (100.0%) |
| Office & Administration | 0 (0.0%) | 3 (100.0%) |
| Total (Category) | 0 (0.0%) | 25 (100.0%) |
| Total (Overall) | 46 (41.8%) | 64 (58.2%) |
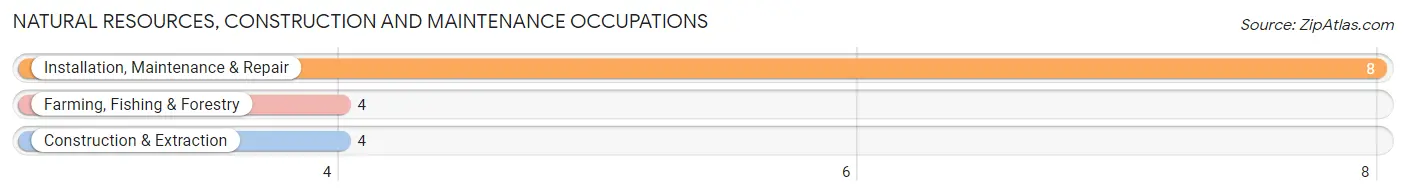
Natural Resources, Construction and Maintenance Occupations
The most common Natural Resources, Construction and Maintenance occupations in South Glastonbury are Installation, Maintenance & Repair (8 | 7.3%), Farming, Fishing & Forestry (4 | 3.6%), and Construction & Extraction (4 | 3.6%).
Natural Resources, Construction and Maintenance Occupations by Sex
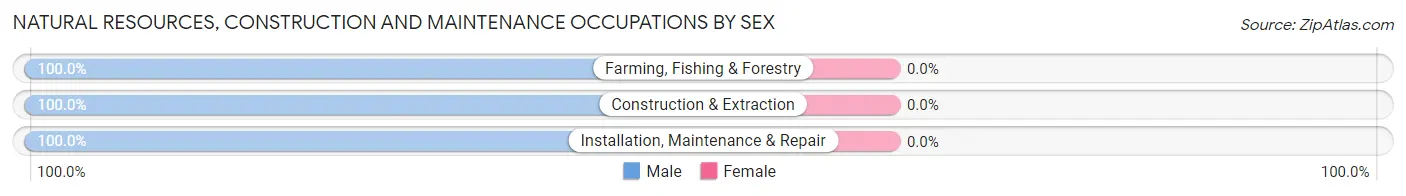
| Occupation | Male | Female |
| Farming, Fishing & Forestry | 4 (100.0%) | 0 (0.0%) |
| Construction & Extraction | 4 (100.0%) | 0 (0.0%) |
| Installation, Maintenance & Repair | 8 (100.0%) | 0 (0.0%) |
| Total (Category) | 16 (100.0%) | 0 (0.0%) |
| Total (Overall) | 46 (41.8%) | 64 (58.2%) |
Production, Transportation and Moving Occupations
The most common Production, Transportation and Moving occupations in South Glastonbury are , and Production (14 | 12.7%).
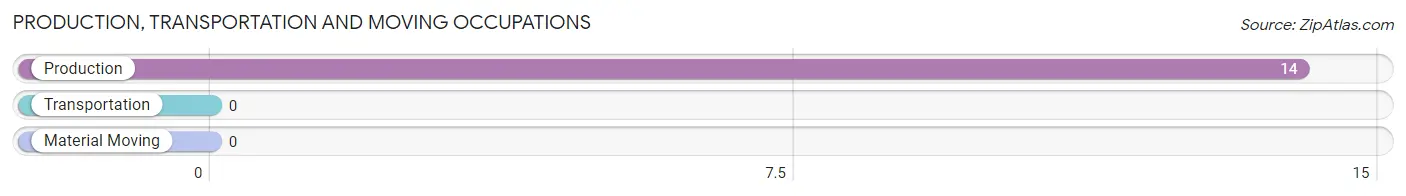
Production, Transportation and Moving Occupations by Sex
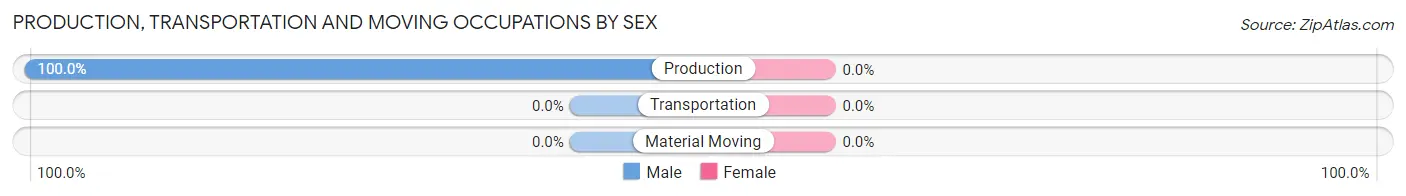
| Occupation | Male | Female |
| Production | 14 (100.0%) | 0 (0.0%) |
| Transportation | 0 (0.0%) | 0 (0.0%) |
| Material Moving | 0 (0.0%) | 0 (0.0%) |
| Total (Category) | 14 (100.0%) | 0 (0.0%) |
| Total (Overall) | 46 (41.8%) | 64 (58.2%) |
Employment Industries by Sex in South Glastonbury
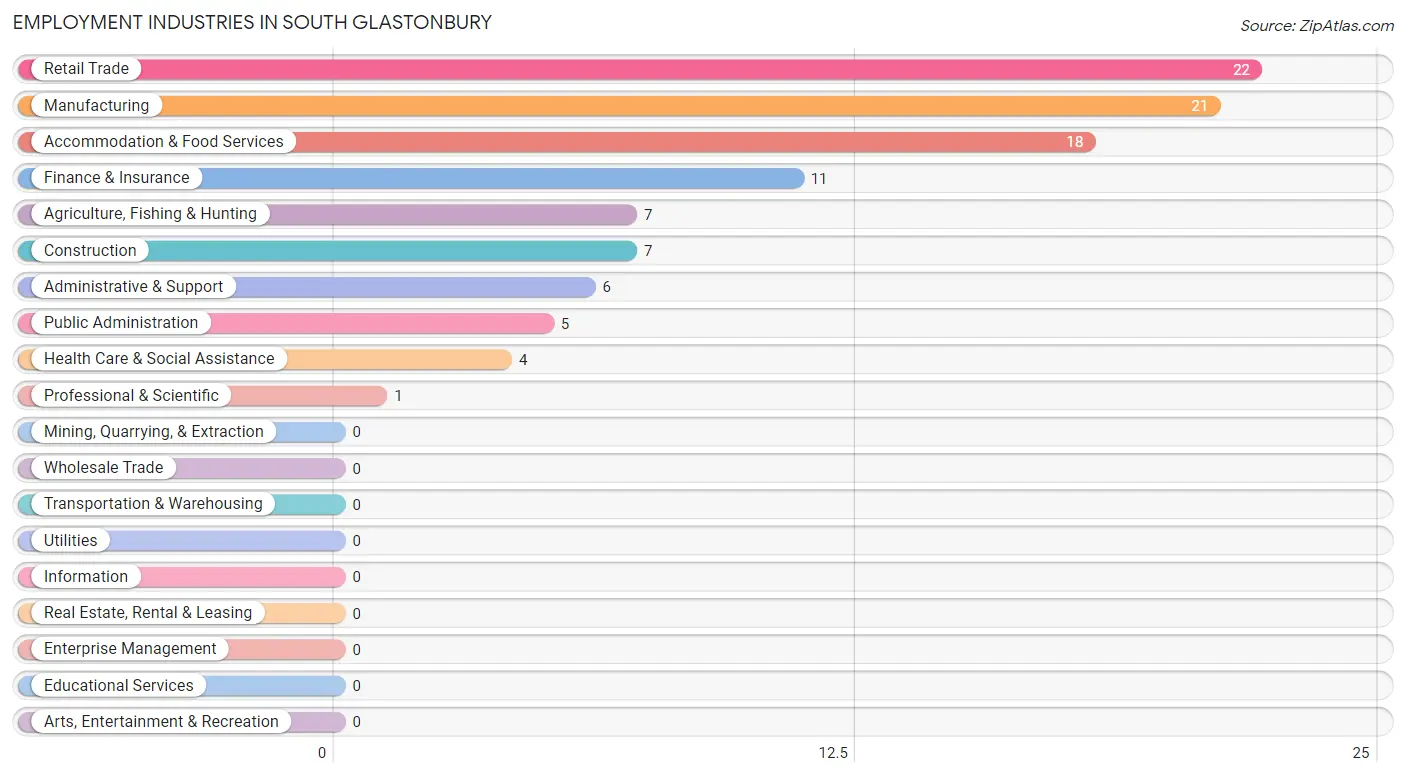
Employment Industries in South Glastonbury
The major employment industries in South Glastonbury include Retail Trade (22 | 20.0%), Manufacturing (21 | 19.1%), Accommodation & Food Services (18 | 16.4%), Finance & Insurance (11 | 10.0%), and Agriculture, Fishing & Hunting (7 | 6.4%).
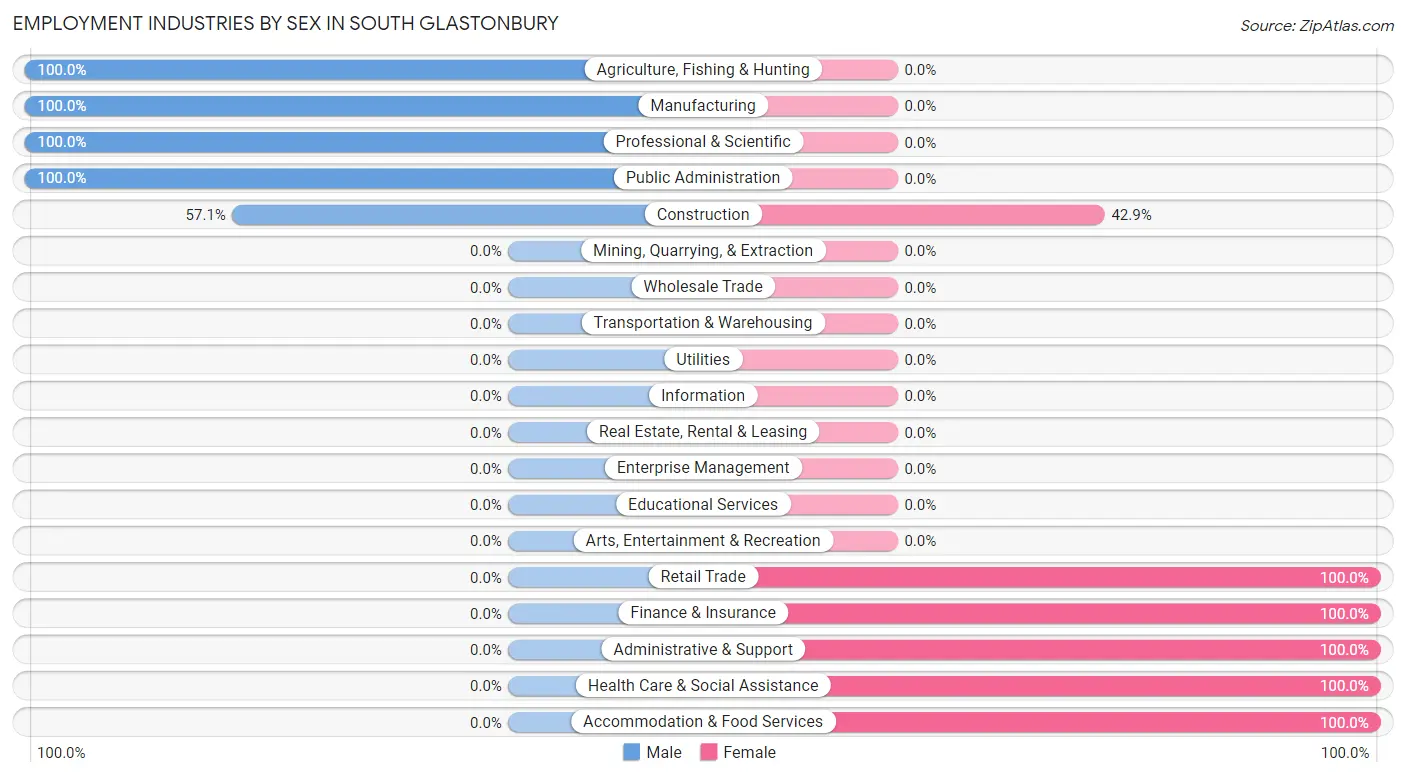
Employment Industries by Sex in South Glastonbury
The South Glastonbury industries that see more men than women are Agriculture, Fishing & Hunting (100.0%), Manufacturing (100.0%), and Professional & Scientific (100.0%), whereas the industries that tend to have a higher number of women are Retail Trade (100.0%), Finance & Insurance (100.0%), and Administrative & Support (100.0%).
| Industry | Male | Female |
| Agriculture, Fishing & Hunting | 7 (100.0%) | 0 (0.0%) |
| Mining, Quarrying, & Extraction | 0 (0.0%) | 0 (0.0%) |
| Construction | 4 (57.1%) | 3 (42.9%) |
| Manufacturing | 21 (100.0%) | 0 (0.0%) |
| Wholesale Trade | 0 (0.0%) | 0 (0.0%) |
| Retail Trade | 0 (0.0%) | 22 (100.0%) |
| Transportation & Warehousing | 0 (0.0%) | 0 (0.0%) |
| Utilities | 0 (0.0%) | 0 (0.0%) |
| Information | 0 (0.0%) | 0 (0.0%) |
| Finance & Insurance | 0 (0.0%) | 11 (100.0%) |
| Real Estate, Rental & Leasing | 0 (0.0%) | 0 (0.0%) |
| Professional & Scientific | 1 (100.0%) | 0 (0.0%) |
| Enterprise Management | 0 (0.0%) | 0 (0.0%) |
| Administrative & Support | 0 (0.0%) | 6 (100.0%) |
| Educational Services | 0 (0.0%) | 0 (0.0%) |
| Health Care & Social Assistance | 0 (0.0%) | 4 (100.0%) |
| Arts, Entertainment & Recreation | 0 (0.0%) | 0 (0.0%) |
| Accommodation & Food Services | 0 (0.0%) | 18 (100.0%) |
| Public Administration | 5 (100.0%) | 0 (0.0%) |
| Total | 46 (41.8%) | 64 (58.2%) |
Education in South Glastonbury
School Enrollment in South Glastonbury
The most common levels of schooling among the 23 students in South Glastonbury are college / undergraduate (18 | 78.3%), and middle school (5 | 21.7%).
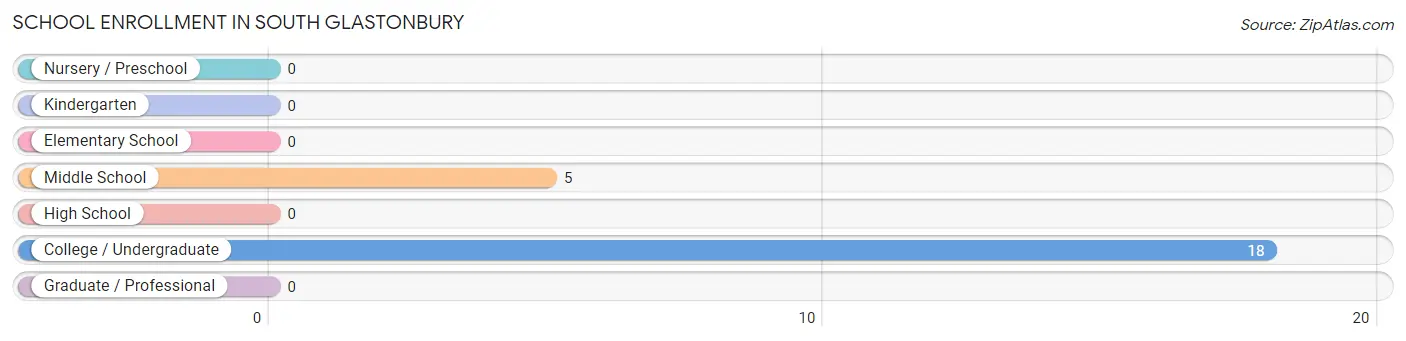
| School Level | # Students | % Students |
| Nursery / Preschool | 0 | 0.0% |
| Kindergarten | 0 | 0.0% |
| Elementary School | 0 | 0.0% |
| Middle School | 5 | 21.7% |
| High School | 0 | 0.0% |
| College / Undergraduate | 18 | 78.3% |
| Graduate / Professional | 0 | 0.0% |
| Total | 23 | 100.0% |
School Enrollment by Age by Funding Source in South Glastonbury
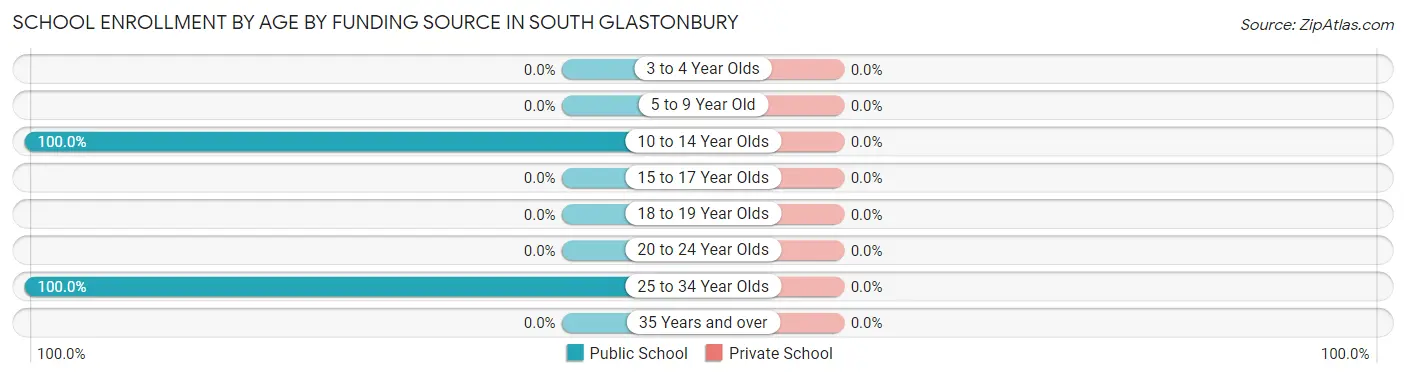
| Age Bracket | Public School | Private School |
| 3 to 4 Year Olds | 0 (0.0%) | 0 (0.0%) |
| 5 to 9 Year Old | 0 (0.0%) | 0 (0.0%) |
| 10 to 14 Year Olds | 5 (100.0%) | 0 (0.0%) |
| 15 to 17 Year Olds | 0 (0.0%) | 0 (0.0%) |
| 18 to 19 Year Olds | 0 (0.0%) | 0 (0.0%) |
| 20 to 24 Year Olds | 0 (0.0%) | 0 (0.0%) |
| 25 to 34 Year Olds | 18 (100.0%) | 0 (0.0%) |
| 35 Years and over | 0 (0.0%) | 0 (0.0%) |
| Total | 23 (100.0%) | 0 (0.0%) |
Educational Attainment by Field of Study in South Glastonbury
Education (39 | 42.4%), social sciences (18 | 19.6%), liberal arts & history (16 | 17.4%), bio, nature & agricultural (10 | 10.9%), and business (5 | 5.4%) are the most common fields of study among 92 individuals in South Glastonbury who have obtained a bachelor's degree or higher.
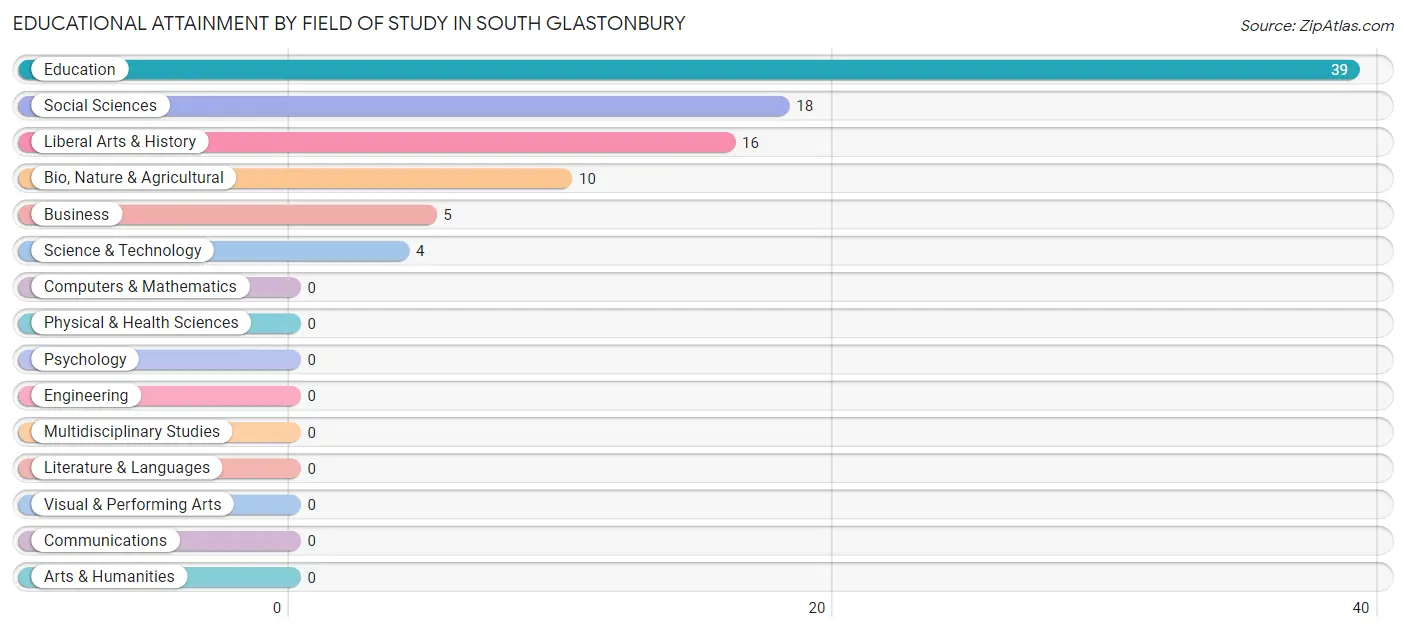
| Field of Study | # Graduates | % Graduates |
| Computers & Mathematics | 0 | 0.0% |
| Bio, Nature & Agricultural | 10 | 10.9% |
| Physical & Health Sciences | 0 | 0.0% |
| Psychology | 0 | 0.0% |
| Social Sciences | 18 | 19.6% |
| Engineering | 0 | 0.0% |
| Multidisciplinary Studies | 0 | 0.0% |
| Science & Technology | 4 | 4.3% |
| Business | 5 | 5.4% |
| Education | 39 | 42.4% |
| Literature & Languages | 0 | 0.0% |
| Liberal Arts & History | 16 | 17.4% |
| Visual & Performing Arts | 0 | 0.0% |
| Communications | 0 | 0.0% |
| Arts & Humanities | 0 | 0.0% |
| Total | 92 | 100.0% |
Transportation & Commute in South Glastonbury
Vehicle Availability by Sex in South Glastonbury
The most prevalent vehicle ownership categories in South Glastonbury are males with 2 vehicles (33, accounting for 73.3%) and females with 2 vehicles (11, making up 51.6%).
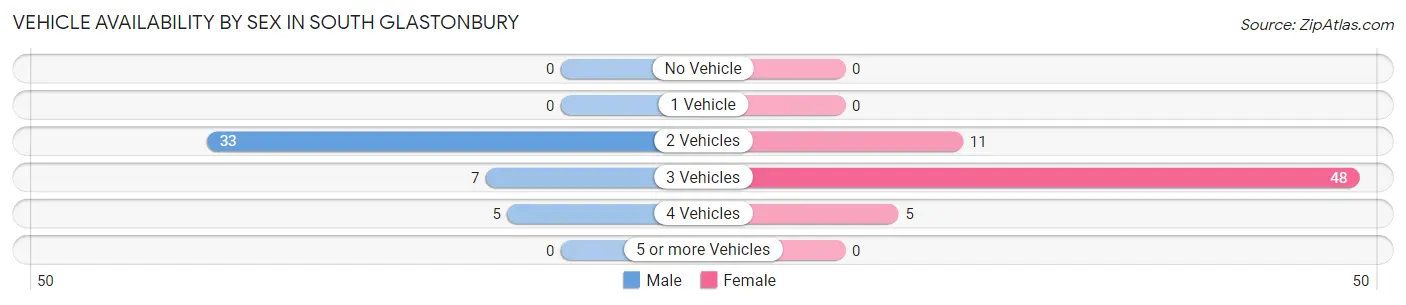
| Vehicles Available | Male | Female |
| No Vehicle | 0 (0.0%) | 0 (0.0%) |
| 1 Vehicle | 0 (0.0%) | 0 (0.0%) |
| 2 Vehicles | 33 (73.3%) | 11 (17.2%) |
| 3 Vehicles | 7 (15.6%) | 48 (75.0%) |
| 4 Vehicles | 5 (11.1%) | 5 (7.8%) |
| 5 or more Vehicles | 0 (0.0%) | 0 (0.0%) |
| Total | 45 (100.0%) | 64 (100.0%) |
Commute Time in South Glastonbury
The most frequently occuring commute durations in South Glastonbury are 40 to 44 minutes (22 commuters, 21.8%), less than 5 minutes (21 commuters, 20.8%), and 25 to 29 minutes (18 commuters, 17.8%).
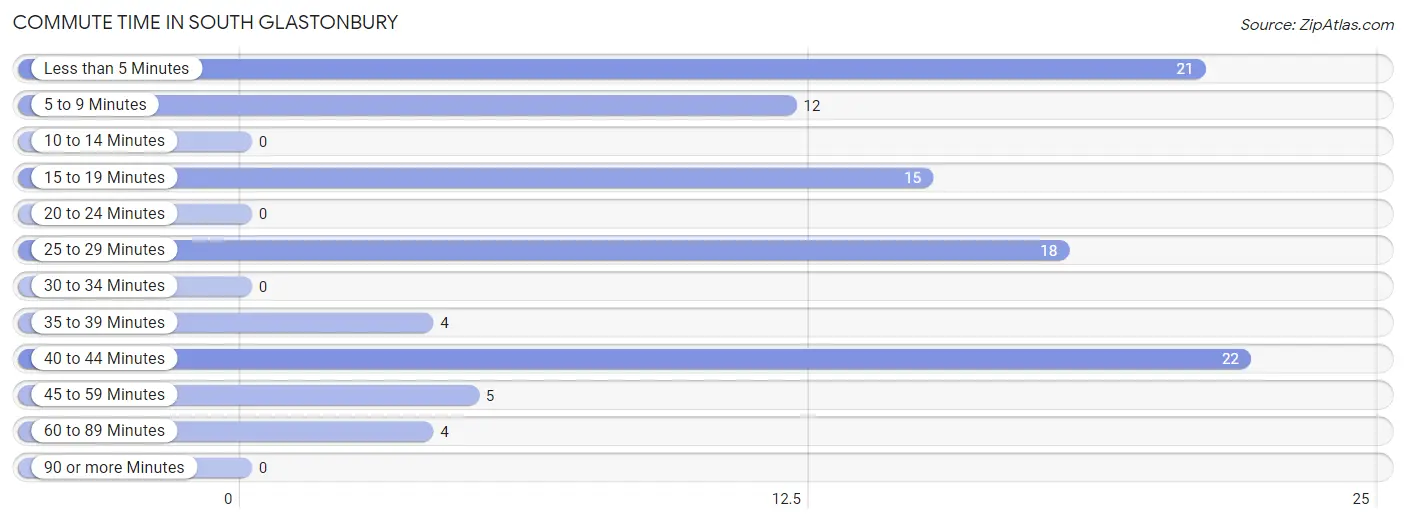
| Commute Time | # Commuters | % Commuters |
| Less than 5 Minutes | 21 | 20.8% |
| 5 to 9 Minutes | 12 | 11.9% |
| 10 to 14 Minutes | 0 | 0.0% |
| 15 to 19 Minutes | 15 | 14.8% |
| 20 to 24 Minutes | 0 | 0.0% |
| 25 to 29 Minutes | 18 | 17.8% |
| 30 to 34 Minutes | 0 | 0.0% |
| 35 to 39 Minutes | 4 | 4.0% |
| 40 to 44 Minutes | 22 | 21.8% |
| 45 to 59 Minutes | 5 | 5.0% |
| 60 to 89 Minutes | 4 | 4.0% |
| 90 or more Minutes | 0 | 0.0% |
Commute Time by Sex in South Glastonbury
The most common commute times in South Glastonbury are less than 5 minutes (21 commuters, 50.0%) for males and 40 to 44 minutes (22 commuters, 37.3%) for females.
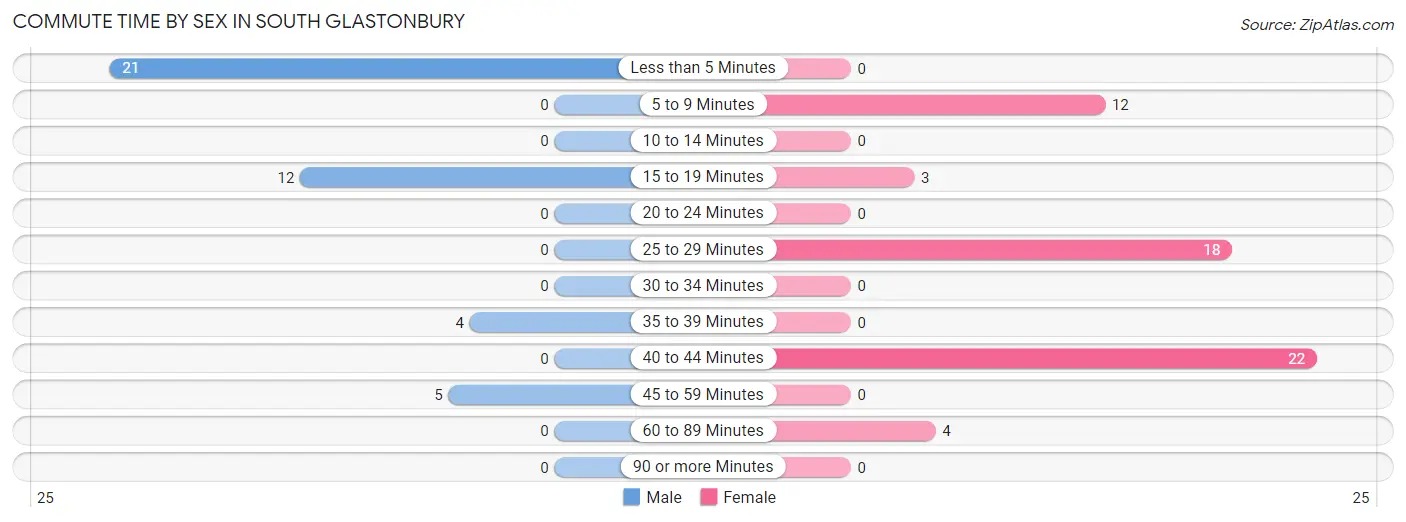
| Commute Time | Male | Female |
| Less than 5 Minutes | 21 (50.0%) | 0 (0.0%) |
| 5 to 9 Minutes | 0 (0.0%) | 12 (20.3%) |
| 10 to 14 Minutes | 0 (0.0%) | 0 (0.0%) |
| 15 to 19 Minutes | 12 (28.6%) | 3 (5.1%) |
| 20 to 24 Minutes | 0 (0.0%) | 0 (0.0%) |
| 25 to 29 Minutes | 0 (0.0%) | 18 (30.5%) |
| 30 to 34 Minutes | 0 (0.0%) | 0 (0.0%) |
| 35 to 39 Minutes | 4 (9.5%) | 0 (0.0%) |
| 40 to 44 Minutes | 0 (0.0%) | 22 (37.3%) |
| 45 to 59 Minutes | 5 (11.9%) | 0 (0.0%) |
| 60 to 89 Minutes | 0 (0.0%) | 4 (6.8%) |
| 90 or more Minutes | 0 (0.0%) | 0 (0.0%) |
Time of Departure to Work by Sex in South Glastonbury
The most frequent times of departure to work in South Glastonbury are 5:00 AM to 5:29 AM (21, 50.0%) for males and 7:00 AM to 7:29 AM (22, 37.3%) for females.
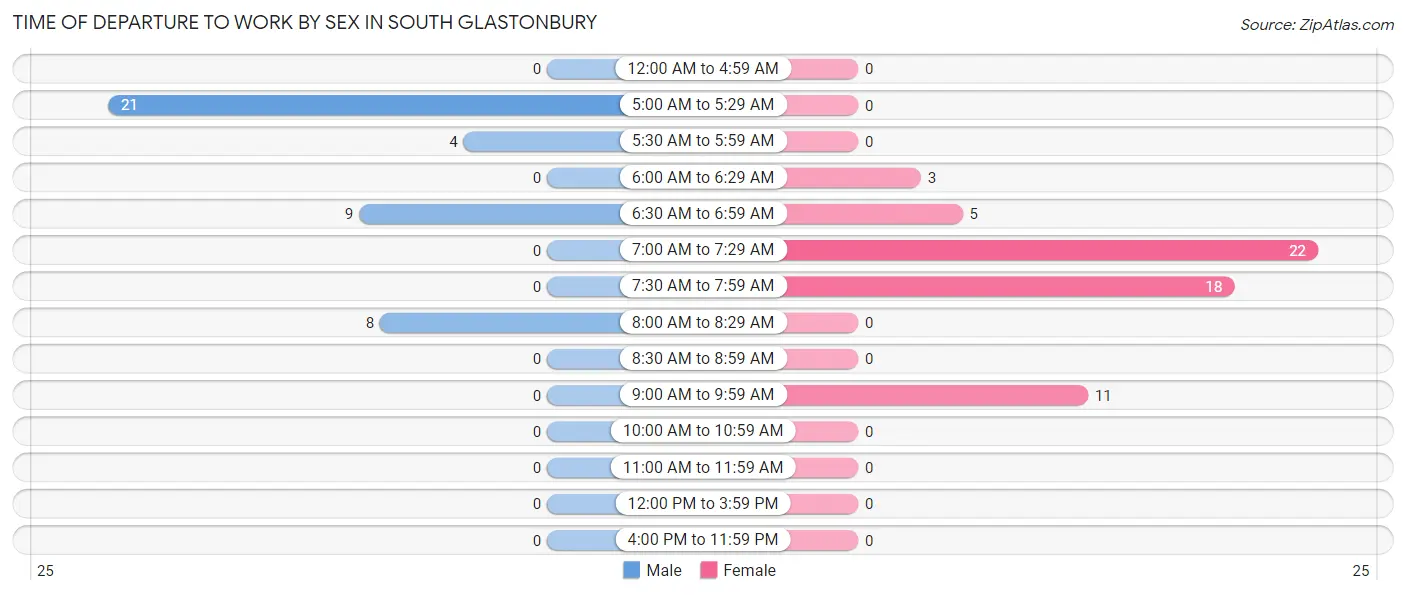
| Time of Departure | Male | Female |
| 12:00 AM to 4:59 AM | 0 (0.0%) | 0 (0.0%) |
| 5:00 AM to 5:29 AM | 21 (50.0%) | 0 (0.0%) |
| 5:30 AM to 5:59 AM | 4 (9.5%) | 0 (0.0%) |
| 6:00 AM to 6:29 AM | 0 (0.0%) | 3 (5.1%) |
| 6:30 AM to 6:59 AM | 9 (21.4%) | 5 (8.5%) |
| 7:00 AM to 7:29 AM | 0 (0.0%) | 22 (37.3%) |
| 7:30 AM to 7:59 AM | 0 (0.0%) | 18 (30.5%) |
| 8:00 AM to 8:29 AM | 8 (19.1%) | 0 (0.0%) |
| 8:30 AM to 8:59 AM | 0 (0.0%) | 0 (0.0%) |
| 9:00 AM to 9:59 AM | 0 (0.0%) | 11 (18.6%) |
| 10:00 AM to 10:59 AM | 0 (0.0%) | 0 (0.0%) |
| 11:00 AM to 11:59 AM | 0 (0.0%) | 0 (0.0%) |
| 12:00 PM to 3:59 PM | 0 (0.0%) | 0 (0.0%) |
| 4:00 PM to 11:59 PM | 0 (0.0%) | 0 (0.0%) |
| Total | 42 (100.0%) | 59 (100.0%) |
Housing Occupancy in South Glastonbury
Occupancy by Ownership in South Glastonbury
Of the total 196 dwellings in South Glastonbury, owner-occupied units account for 179 (91.3%), while renter-occupied units make up 17 (8.7%).
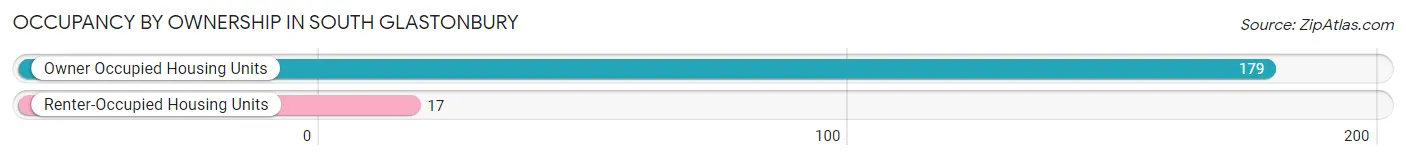
| Occupancy | # Housing Units | % Housing Units |
| Owner Occupied Housing Units | 179 | 91.3% |
| Renter-Occupied Housing Units | 17 | 8.7% |
| Total Occupied Housing Units | 196 | 100.0% |
Occupancy by Household Size in South Glastonbury
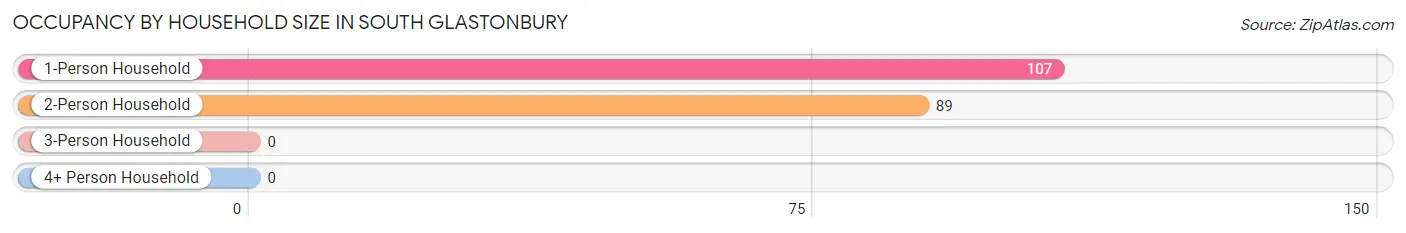
| Household Size | # Housing Units | % Housing Units |
| 1-Person Household | 107 | 54.6% |
| 2-Person Household | 89 | 45.4% |
| 3-Person Household | 0 | 0.0% |
| 4+ Person Household | 0 | 0.0% |
| Total Housing Units | 196 | 100.0% |
Occupancy by Ownership by Household Size in South Glastonbury
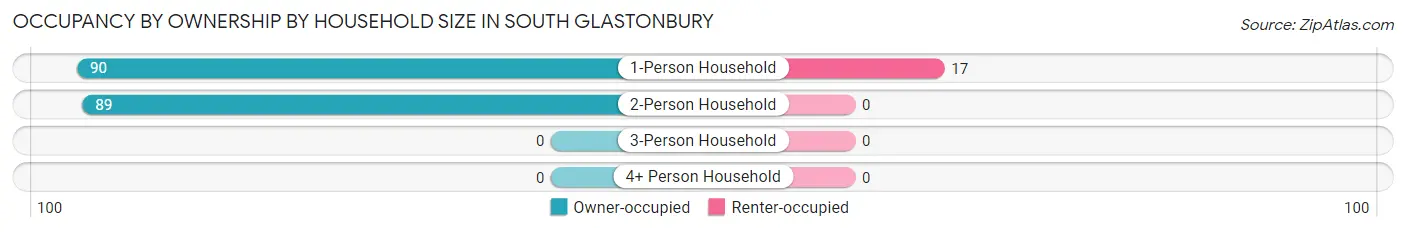
| Household Size | Owner-occupied | Renter-occupied |
| 1-Person Household | 90 (84.1%) | 17 (15.9%) |
| 2-Person Household | 89 (100.0%) | 0 (0.0%) |
| 3-Person Household | 0 (0.0%) | 0 (0.0%) |
| 4+ Person Household | 0 (0.0%) | 0 (0.0%) |
| Total Housing Units | 179 (91.3%) | 17 (8.7%) |
Occupancy by Educational Attainment in South Glastonbury
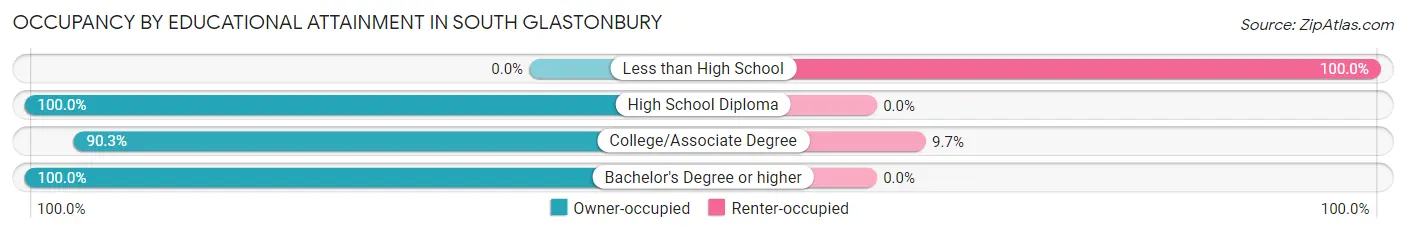
| Household Size | Owner-occupied | Renter-occupied |
| Less than High School | 0 (0.0%) | 7 (100.0%) |
| High School Diploma | 24 (100.0%) | 0 (0.0%) |
| College/Associate Degree | 93 (90.3%) | 10 (9.7%) |
| Bachelor's Degree or higher | 62 (100.0%) | 0 (0.0%) |
Occupancy by Age of Householder in South Glastonbury
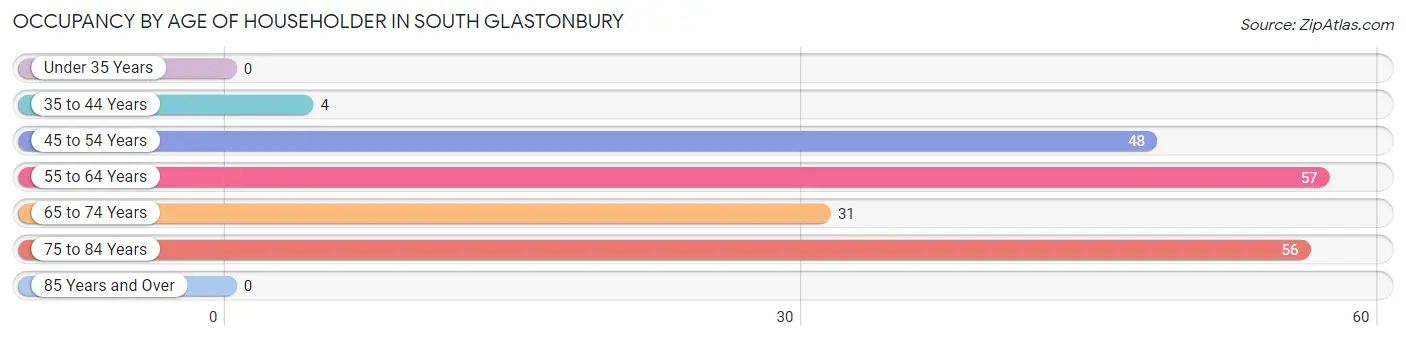
| Age Bracket | # Households | % Households |
| Under 35 Years | 0 | 0.0% |
| 35 to 44 Years | 4 | 2.0% |
| 45 to 54 Years | 48 | 24.5% |
| 55 to 64 Years | 57 | 29.1% |
| 65 to 74 Years | 31 | 15.8% |
| 75 to 84 Years | 56 | 28.6% |
| 85 Years and Over | 0 | 0.0% |
| Total | 196 | 100.0% |
Housing Finances in South Glastonbury
Median Income by Occupancy in South Glastonbury
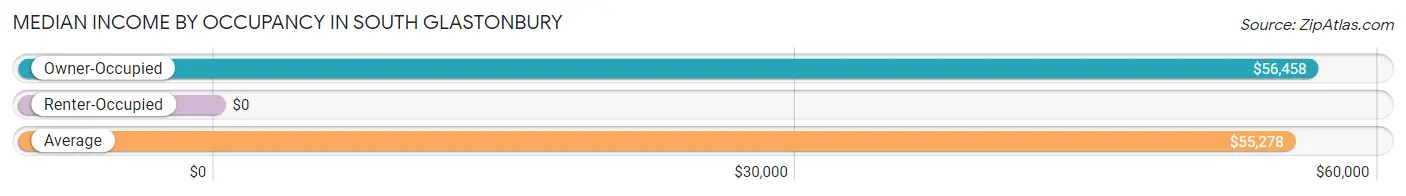
| Occupancy Type | # Households | Median Income |
| Owner-Occupied | 179 (91.3%) | $56,458 |
| Renter-Occupied | 17 (8.7%) | $0 |
| Average | 196 (100.0%) | $55,278 |
Occupancy by Householder Income Bracket in South Glastonbury
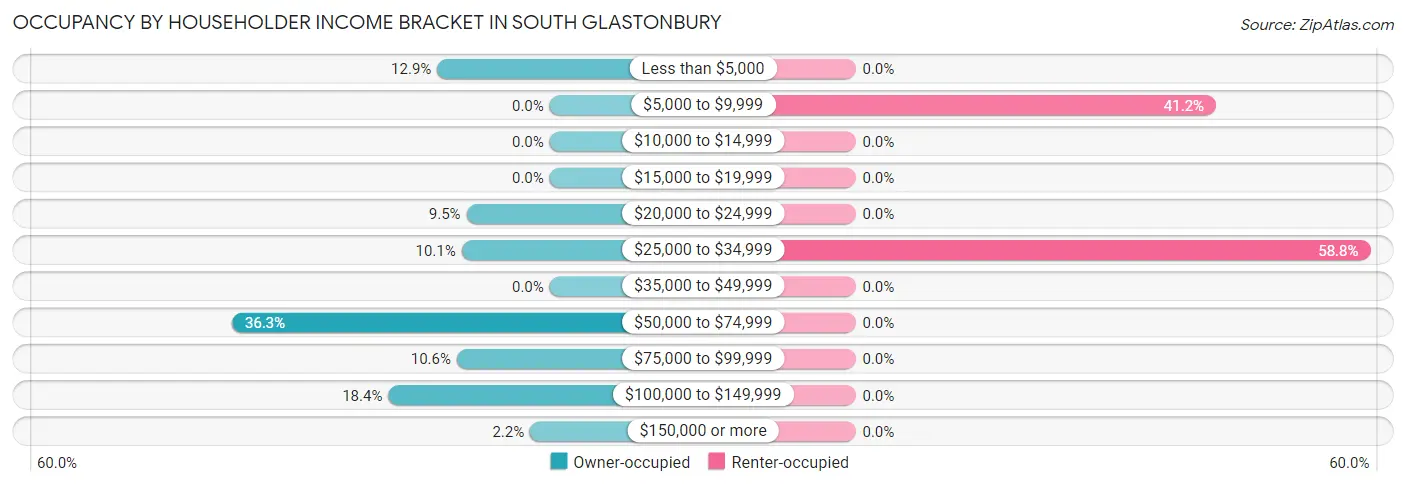
| Income Bracket | Owner-occupied | Renter-occupied |
| Less than $5,000 | 23 (12.9%) | 0 (0.0%) |
| $5,000 to $9,999 | 0 (0.0%) | 7 (41.2%) |
| $10,000 to $14,999 | 0 (0.0%) | 0 (0.0%) |
| $15,000 to $19,999 | 0 (0.0%) | 0 (0.0%) |
| $20,000 to $24,999 | 17 (9.5%) | 0 (0.0%) |
| $25,000 to $34,999 | 18 (10.1%) | 10 (58.8%) |
| $35,000 to $49,999 | 0 (0.0%) | 0 (0.0%) |
| $50,000 to $74,999 | 65 (36.3%) | 0 (0.0%) |
| $75,000 to $99,999 | 19 (10.6%) | 0 (0.0%) |
| $100,000 to $149,999 | 33 (18.4%) | 0 (0.0%) |
| $150,000 or more | 4 (2.2%) | 0 (0.0%) |
| Total | 179 (100.0%) | 17 (100.0%) |
Monthly Housing Cost Tiers in South Glastonbury
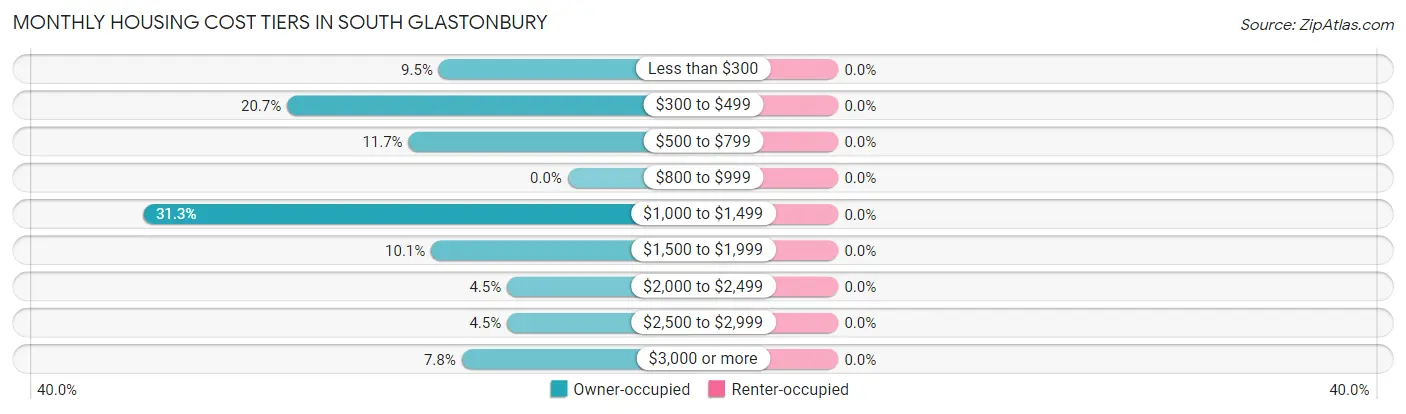
| Monthly Cost | Owner-occupied | Renter-occupied |
| Less than $300 | 17 (9.5%) | 0 (0.0%) |
| $300 to $499 | 37 (20.7%) | 0 (0.0%) |
| $500 to $799 | 21 (11.7%) | 0 (0.0%) |
| $800 to $999 | 0 (0.0%) | 0 (0.0%) |
| $1,000 to $1,499 | 56 (31.3%) | 0 (0.0%) |
| $1,500 to $1,999 | 18 (10.1%) | 0 (0.0%) |
| $2,000 to $2,499 | 8 (4.5%) | 0 (0.0%) |
| $2,500 to $2,999 | 8 (4.5%) | 0 (0.0%) |
| $3,000 or more | 14 (7.8%) | 0 (0.0%) |
| Total | 179 (100.0%) | 17 (100.0%) |
Physical Housing Characteristics in South Glastonbury
Housing Structures in South Glastonbury
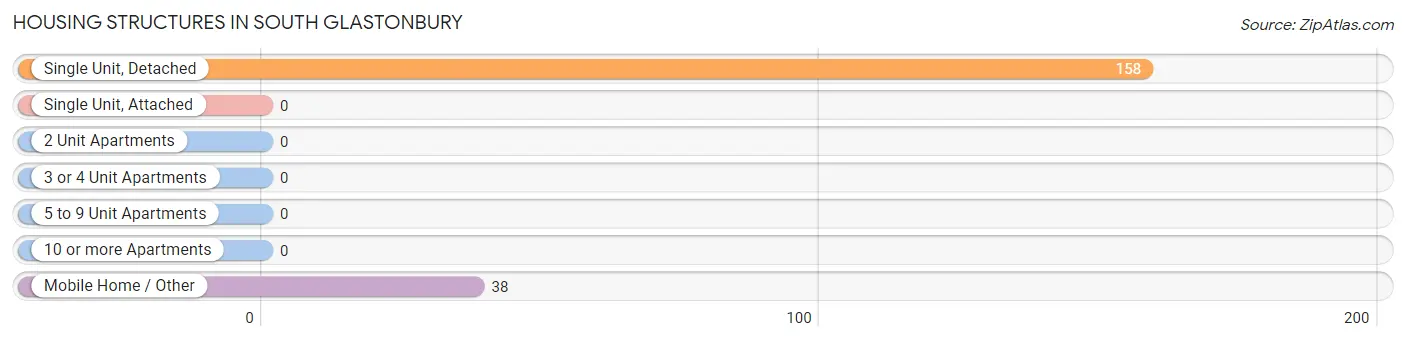
| Structure Type | # Housing Units | % Housing Units |
| Single Unit, Detached | 158 | 80.6% |
| Single Unit, Attached | 0 | 0.0% |
| 2 Unit Apartments | 0 | 0.0% |
| 3 or 4 Unit Apartments | 0 | 0.0% |
| 5 to 9 Unit Apartments | 0 | 0.0% |
| 10 or more Apartments | 0 | 0.0% |
| Mobile Home / Other | 38 | 19.4% |
| Total | 196 | 100.0% |
Housing Structures by Occupancy in South Glastonbury
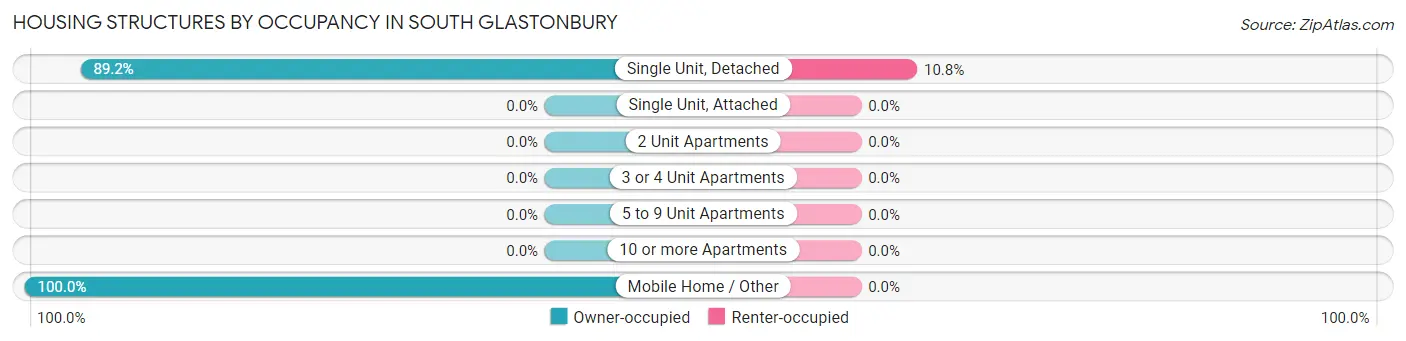
| Structure Type | Owner-occupied | Renter-occupied |
| Single Unit, Detached | 141 (89.2%) | 17 (10.8%) |
| Single Unit, Attached | 0 (0.0%) | 0 (0.0%) |
| 2 Unit Apartments | 0 (0.0%) | 0 (0.0%) |
| 3 or 4 Unit Apartments | 0 (0.0%) | 0 (0.0%) |
| 5 to 9 Unit Apartments | 0 (0.0%) | 0 (0.0%) |
| 10 or more Apartments | 0 (0.0%) | 0 (0.0%) |
| Mobile Home / Other | 38 (100.0%) | 0 (0.0%) |
| Total | 179 (91.3%) | 17 (8.7%) |
Housing Structures by Number of Rooms in South Glastonbury
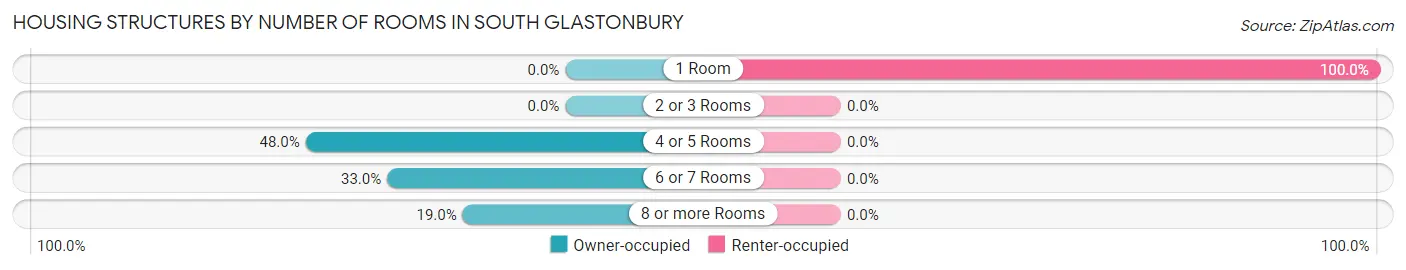
| Number of Rooms | Owner-occupied | Renter-occupied |
| 1 Room | 0 (0.0%) | 17 (100.0%) |
| 2 or 3 Rooms | 0 (0.0%) | 0 (0.0%) |
| 4 or 5 Rooms | 86 (48.0%) | 0 (0.0%) |
| 6 or 7 Rooms | 59 (33.0%) | 0 (0.0%) |
| 8 or more Rooms | 34 (19.0%) | 0 (0.0%) |
| Total | 179 (100.0%) | 17 (100.0%) |
Housing Structure by Heating Type in South Glastonbury
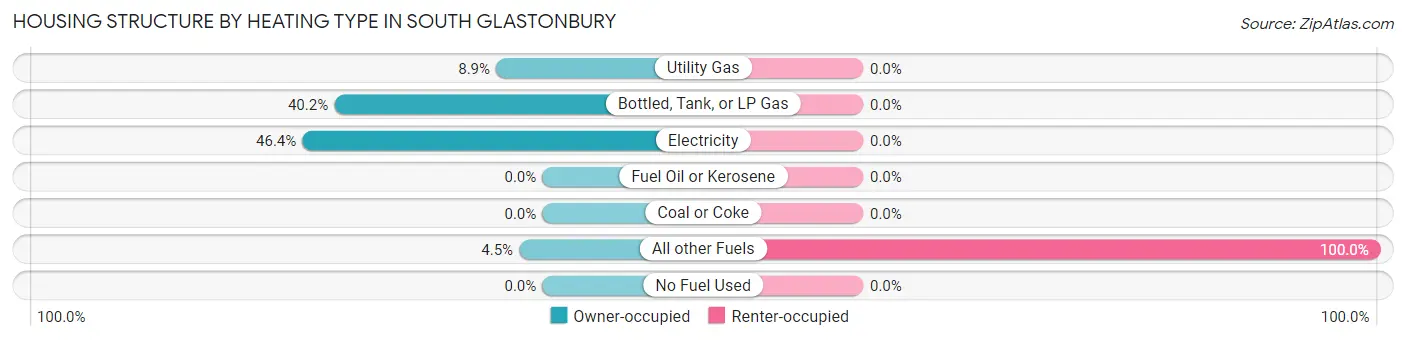
| Heating Type | Owner-occupied | Renter-occupied |
| Utility Gas | 16 (8.9%) | 0 (0.0%) |
| Bottled, Tank, or LP Gas | 72 (40.2%) | 0 (0.0%) |
| Electricity | 83 (46.4%) | 0 (0.0%) |
| Fuel Oil or Kerosene | 0 (0.0%) | 0 (0.0%) |
| Coal or Coke | 0 (0.0%) | 0 (0.0%) |
| All other Fuels | 8 (4.5%) | 17 (100.0%) |
| No Fuel Used | 0 (0.0%) | 0 (0.0%) |
| Total | 179 (100.0%) | 17 (100.0%) |
Household Vehicle Usage in South Glastonbury
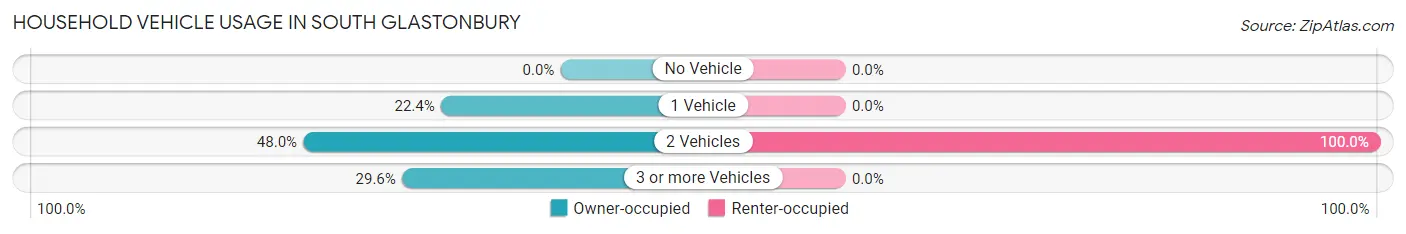
| Vehicles per Household | Owner-occupied | Renter-occupied |
| No Vehicle | 0 (0.0%) | 0 (0.0%) |
| 1 Vehicle | 40 (22.4%) | 0 (0.0%) |
| 2 Vehicles | 86 (48.0%) | 17 (100.0%) |
| 3 or more Vehicles | 53 (29.6%) | 0 (0.0%) |
| Total | 179 (100.0%) | 17 (100.0%) |
Real Estate & Mortgages in South Glastonbury
Real Estate and Mortgage Overview in South Glastonbury
| Characteristic | Without Mortgage | With Mortgage |
| Housing Units | 90 | 89 |
| Median Property Value | $421,100 | $475,000 |
| Median Household Income | - | - |
| Monthly Housing Costs | - | - |
| Real Estate Taxes | $2,763 | $0 |
Property Value by Mortgage Status in South Glastonbury
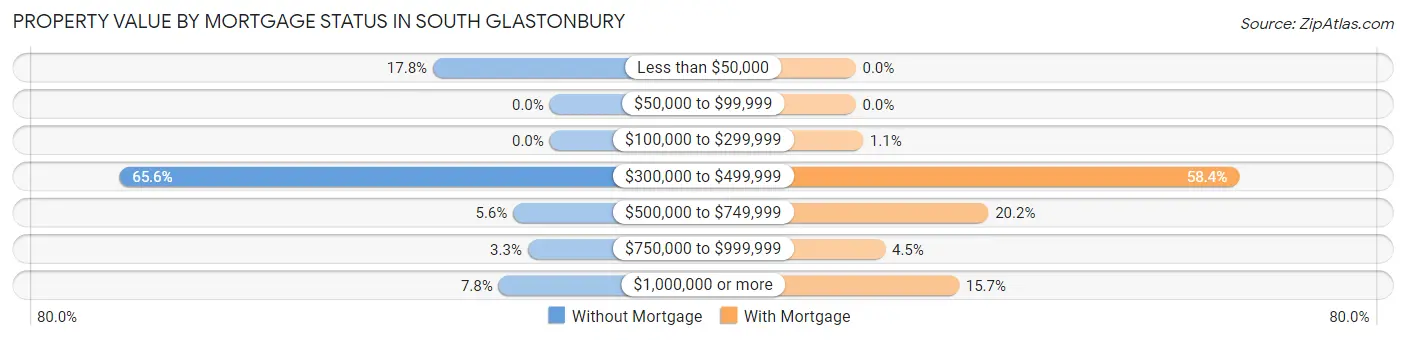
| Property Value | Without Mortgage | With Mortgage |
| Less than $50,000 | 16 (17.8%) | 0 (0.0%) |
| $50,000 to $99,999 | 0 (0.0%) | 0 (0.0%) |
| $100,000 to $299,999 | 0 (0.0%) | 1 (1.1%) |
| $300,000 to $499,999 | 59 (65.6%) | 52 (58.4%) |
| $500,000 to $749,999 | 5 (5.6%) | 18 (20.2%) |
| $750,000 to $999,999 | 3 (3.3%) | 4 (4.5%) |
| $1,000,000 or more | 7 (7.8%) | 14 (15.7%) |
| Total | 90 (100.0%) | 89 (100.0%) |
Household Income by Mortgage Status in South Glastonbury
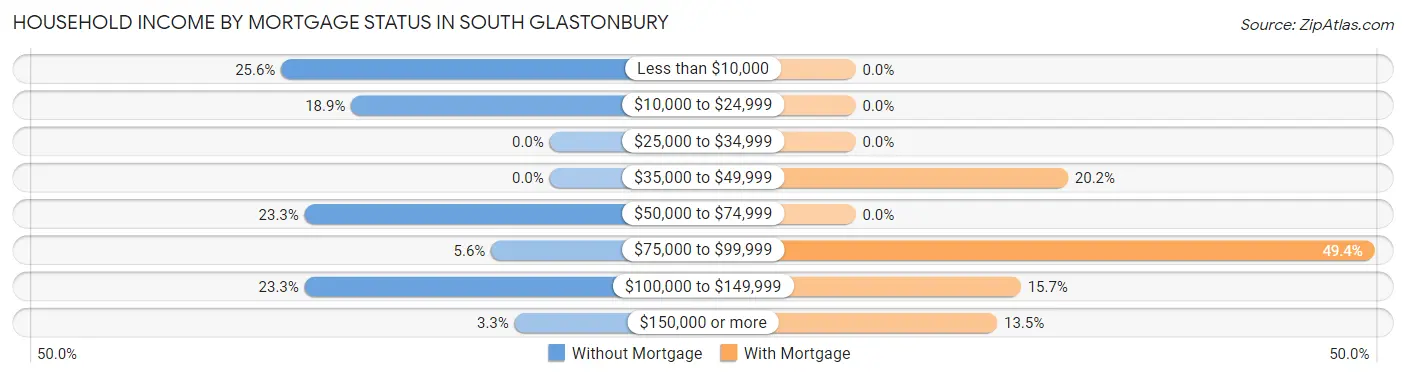
| Household Income | Without Mortgage | With Mortgage |
| Less than $10,000 | 23 (25.6%) | 0 (0.0%) |
| $10,000 to $24,999 | 17 (18.9%) | 0 (0.0%) |
| $25,000 to $34,999 | 0 (0.0%) | 0 (0.0%) |
| $35,000 to $49,999 | 0 (0.0%) | 18 (20.2%) |
| $50,000 to $74,999 | 21 (23.3%) | 0 (0.0%) |
| $75,000 to $99,999 | 5 (5.6%) | 44 (49.4%) |
| $100,000 to $149,999 | 21 (23.3%) | 14 (15.7%) |
| $150,000 or more | 3 (3.3%) | 12 (13.5%) |
| Total | 90 (100.0%) | 89 (100.0%) |
Property Value to Household Income Ratio in South Glastonbury
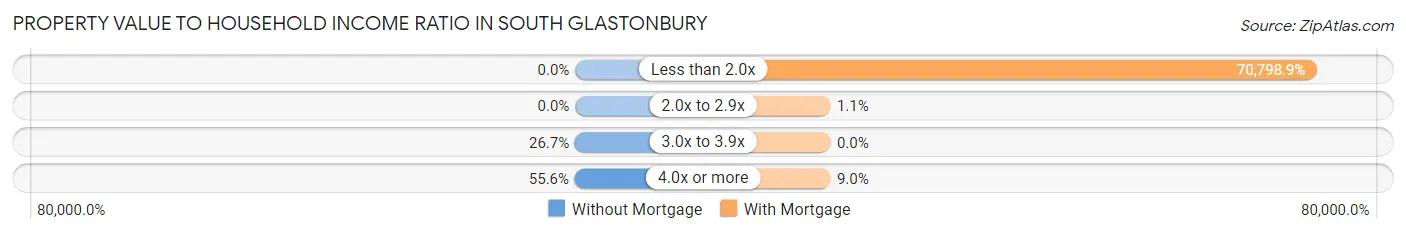
| Value-to-Income Ratio | Without Mortgage | With Mortgage |
| Less than 2.0x | 0 (0.0%) | 63,011 (70,798.9%) |
| 2.0x to 2.9x | 0 (0.0%) | 1 (1.1%) |
| 3.0x to 3.9x | 24 (26.7%) | 0 (0.0%) |
| 4.0x or more | 50 (55.6%) | 8 (9.0%) |
| Total | 90 (100.0%) | 89 (100.0%) |
Real Estate Taxes by Mortgage Status in South Glastonbury
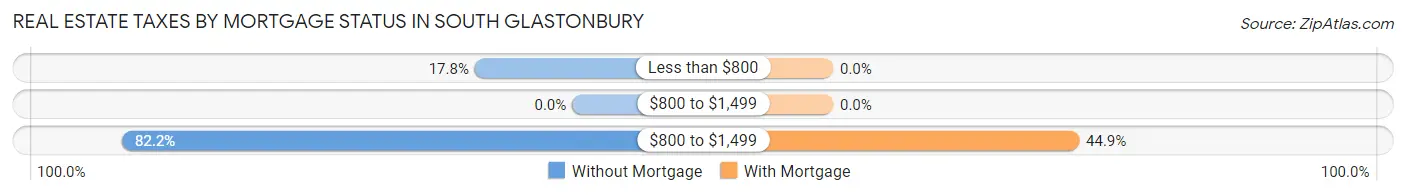
| Property Taxes | Without Mortgage | With Mortgage |
| Less than $800 | 16 (17.8%) | 0 (0.0%) |
| $800 to $1,499 | 0 (0.0%) | 0 (0.0%) |
| $800 to $1,499 | 74 (82.2%) | 40 (44.9%) |
| Total | 90 (100.0%) | 89 (100.0%) |
Health & Disability in South Glastonbury
Health Insurance Coverage by Age in South Glastonbury
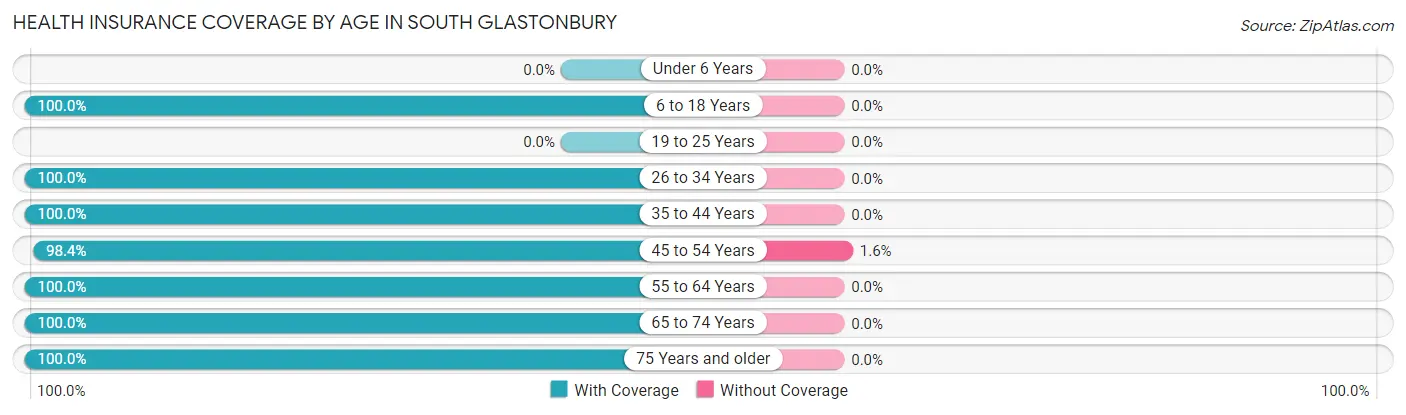
| Age Bracket | With Coverage | Without Coverage |
| Under 6 Years | 0 (0.0%) | 0 (0.0%) |
| 6 to 18 Years | 5 (100.0%) | 0 (0.0%) |
| 19 to 25 Years | 0 (0.0%) | 0 (0.0%) |
| 26 to 34 Years | 19 (100.0%) | 0 (0.0%) |
| 35 to 44 Years | 4 (100.0%) | 0 (0.0%) |
| 45 to 54 Years | 62 (98.4%) | 1 (1.6%) |
| 55 to 64 Years | 72 (100.0%) | 0 (0.0%) |
| 65 to 74 Years | 31 (100.0%) | 0 (0.0%) |
| 75 Years and older | 82 (100.0%) | 0 (0.0%) |
| Total | 275 (99.6%) | 1 (0.4%) |
Health Insurance Coverage by Citizenship Status in South Glastonbury
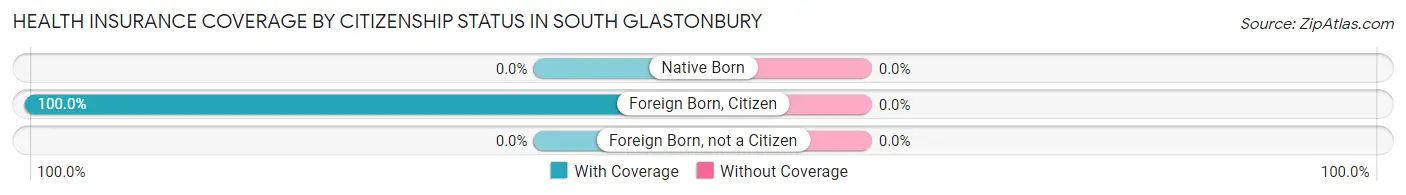
| Citizenship Status | With Coverage | Without Coverage |
| Native Born | 0 (0.0%) | 0 (0.0%) |
| Foreign Born, Citizen | 5 (100.0%) | 0 (0.0%) |
| Foreign Born, not a Citizen | 0 (0.0%) | 0 (0.0%) |
Health Insurance Coverage by Household Income in South Glastonbury
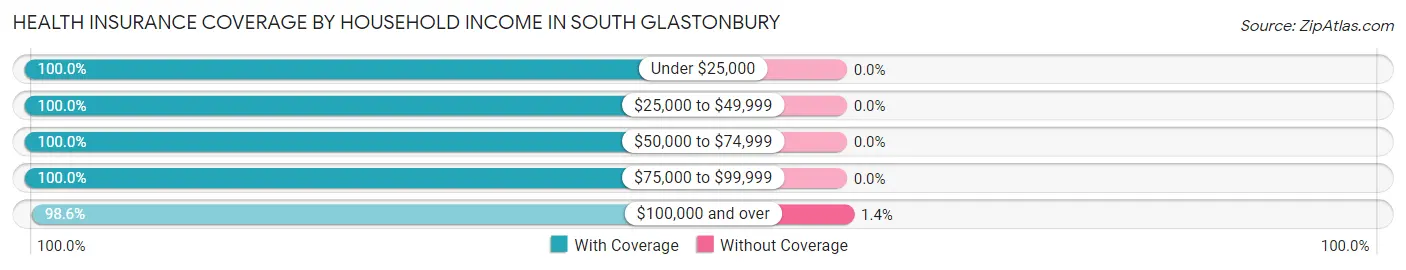
| Household Income | With Coverage | Without Coverage |
| Under $25,000 | 54 (100.0%) | 0 (0.0%) |
| $25,000 to $49,999 | 46 (100.0%) | 0 (0.0%) |
| $50,000 to $74,999 | 80 (100.0%) | 0 (0.0%) |
| $75,000 to $99,999 | 23 (100.0%) | 0 (0.0%) |
| $100,000 and over | 72 (98.6%) | 1 (1.4%) |
Public vs Private Health Insurance Coverage by Age in South Glastonbury
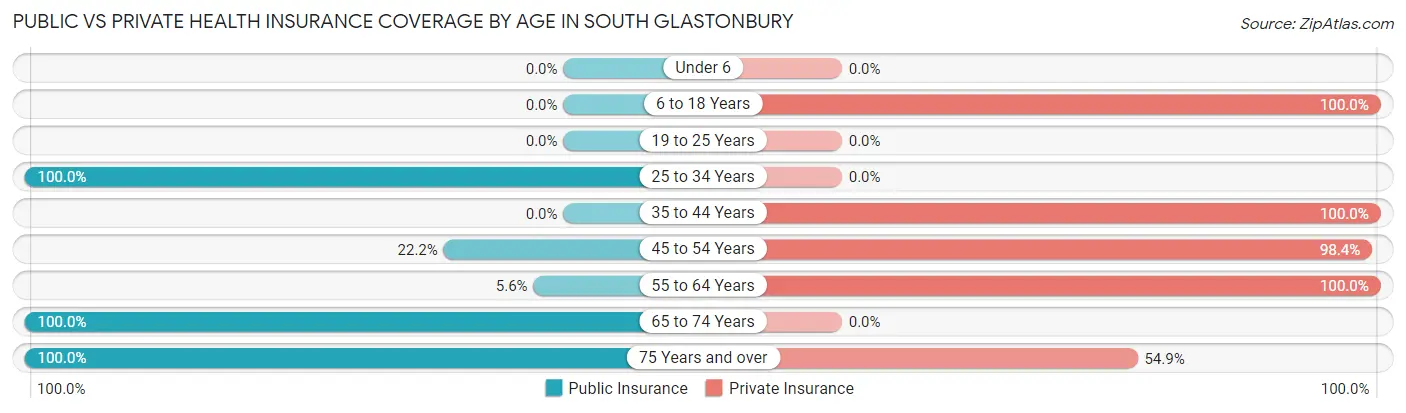
| Age Bracket | Public Insurance | Private Insurance |
| Under 6 | 0 (0.0%) | 0 (0.0%) |
| 6 to 18 Years | 0 (0.0%) | 5 (100.0%) |
| 19 to 25 Years | 0 (0.0%) | 0 (0.0%) |
| 25 to 34 Years | 19 (100.0%) | 0 (0.0%) |
| 35 to 44 Years | 0 (0.0%) | 4 (100.0%) |
| 45 to 54 Years | 14 (22.2%) | 62 (98.4%) |
| 55 to 64 Years | 4 (5.6%) | 72 (100.0%) |
| 65 to 74 Years | 31 (100.0%) | 0 (0.0%) |
| 75 Years and over | 82 (100.0%) | 45 (54.9%) |
| Total | 150 (54.3%) | 188 (68.1%) |
Disability Status by Sex by Age in South Glastonbury
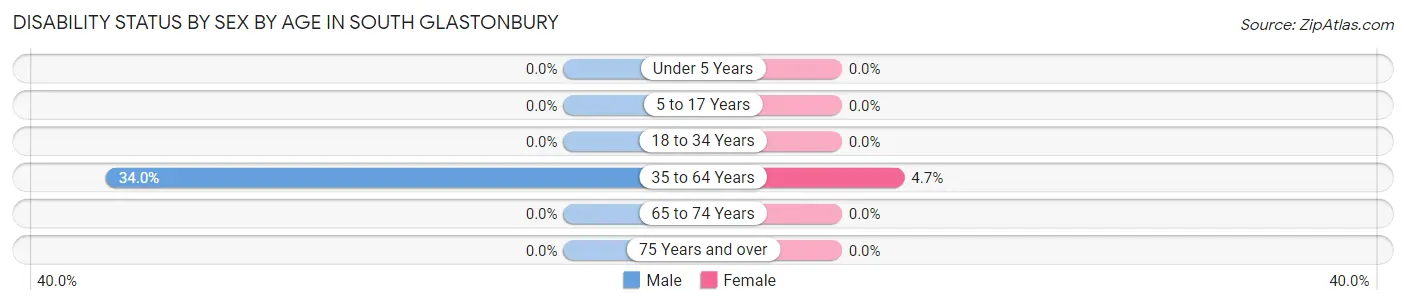
| Age Bracket | Male | Female |
| Under 5 Years | 0 (0.0%) | 0 (0.0%) |
| 5 to 17 Years | 0 (0.0%) | 0 (0.0%) |
| 18 to 34 Years | 0 (0.0%) | 0 (0.0%) |
| 35 to 64 Years | 18 (34.0%) | 4 (4.6%) |
| 65 to 74 Years | 0 (0.0%) | 0 (0.0%) |
| 75 Years and over | 0 (0.0%) | 0 (0.0%) |
Disability Class by Sex by Age in South Glastonbury
Disability Class: Hearing Difficulty
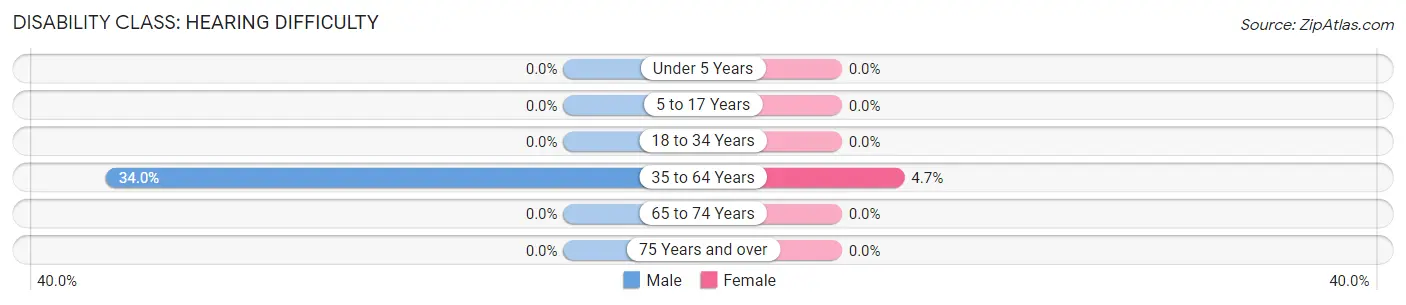
| Age Bracket | Male | Female |
| Under 5 Years | 0 (0.0%) | 0 (0.0%) |
| 5 to 17 Years | 0 (0.0%) | 0 (0.0%) |
| 18 to 34 Years | 0 (0.0%) | 0 (0.0%) |
| 35 to 64 Years | 18 (34.0%) | 4 (4.6%) |
| 65 to 74 Years | 0 (0.0%) | 0 (0.0%) |
| 75 Years and over | 0 (0.0%) | 0 (0.0%) |
Disability Class: Vision Difficulty
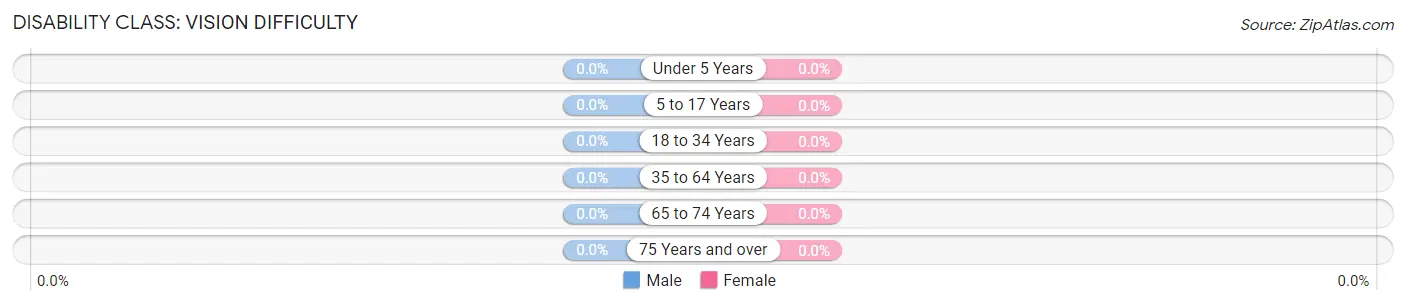
| Age Bracket | Male | Female |
| Under 5 Years | 0 (0.0%) | 0 (0.0%) |
| 5 to 17 Years | 0 (0.0%) | 0 (0.0%) |
| 18 to 34 Years | 0 (0.0%) | 0 (0.0%) |
| 35 to 64 Years | 0 (0.0%) | 0 (0.0%) |
| 65 to 74 Years | 0 (0.0%) | 0 (0.0%) |
| 75 Years and over | 0 (0.0%) | 0 (0.0%) |
Disability Class: Cognitive Difficulty
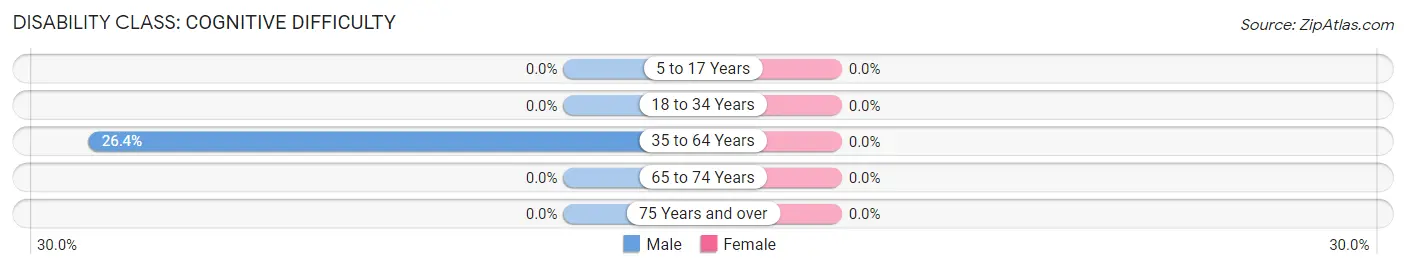
| Age Bracket | Male | Female |
| 5 to 17 Years | 0 (0.0%) | 0 (0.0%) |
| 18 to 34 Years | 0 (0.0%) | 0 (0.0%) |
| 35 to 64 Years | 14 (26.4%) | 0 (0.0%) |
| 65 to 74 Years | 0 (0.0%) | 0 (0.0%) |
| 75 Years and over | 0 (0.0%) | 0 (0.0%) |
Disability Class: Ambulatory Difficulty
| Age Bracket | Male | Female |
| 5 to 17 Years | 0 (0.0%) | 0 (0.0%) |
| 18 to 34 Years | 0 (0.0%) | 0 (0.0%) |
| 35 to 64 Years | 0 (0.0%) | 0 (0.0%) |
| 65 to 74 Years | 0 (0.0%) | 0 (0.0%) |
| 75 Years and over | 0 (0.0%) | 0 (0.0%) |
Disability Class: Self-Care Difficulty
| Age Bracket | Male | Female |
| 5 to 17 Years | 0 (0.0%) | 0 (0.0%) |
| 18 to 34 Years | 0 (0.0%) | 0 (0.0%) |
| 35 to 64 Years | 0 (0.0%) | 0 (0.0%) |
| 65 to 74 Years | 0 (0.0%) | 0 (0.0%) |
| 75 Years and over | 0 (0.0%) | 0 (0.0%) |
Technology Access in South Glastonbury
Computing Device Access in South Glastonbury
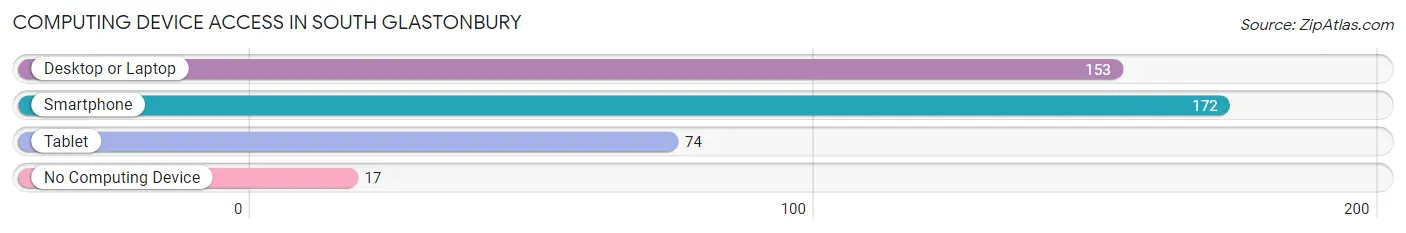
| Device Type | # Households | % Households |
| Desktop or Laptop | 153 | 78.1% |
| Smartphone | 172 | 87.8% |
| Tablet | 74 | 37.8% |
| No Computing Device | 17 | 8.7% |
| Total | 196 | 100.0% |
Internet Access in South Glastonbury
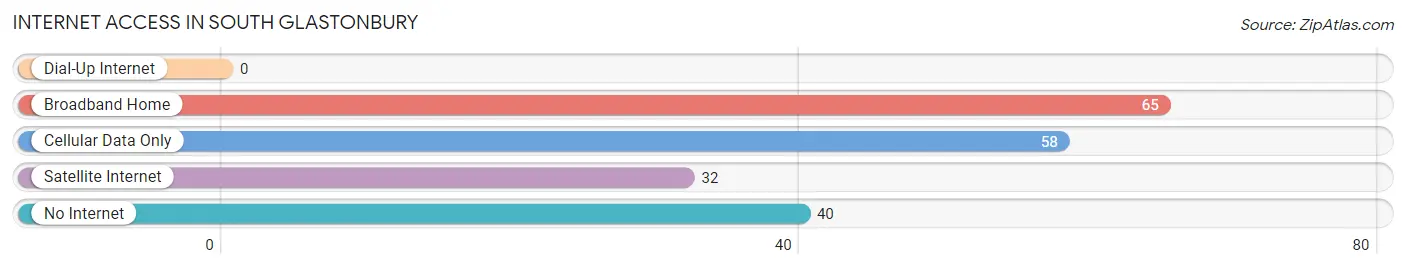
| Internet Type | # Households | % Households |
| Dial-Up Internet | 0 | 0.0% |
| Broadband Home | 65 | 33.2% |
| Cellular Data Only | 58 | 29.6% |
| Satellite Internet | 32 | 16.3% |
| No Internet | 40 | 20.4% |
| Total | 196 | 100.0% |
South Glastonbury Summary
Glastonbury, Montana is a small town located in the southwestern part of the state, in the foothills of the Rocky Mountains. It is situated in the Gallatin Valley, near the headwaters of the Gallatin River. The town was founded in 1883 by a group of settlers from Glastonbury, Connecticut, who were looking for a place to settle and start a new life.
Geography
Glastonbury is located in the southwestern part of Montana, in the foothills of the Rocky Mountains. It is situated in the Gallatin Valley, near the headwaters of the Gallatin River. The town is surrounded by mountains, including the Madison Range to the west, the Tobacco Root Mountains to the south, and the Bridger Mountains to the east. The town is located at an elevation of 4,890 feet above sea level.
The climate in Glastonbury is semi-arid, with hot summers and cold winters. The average annual temperature is 44°F, with an average high of 79°F in the summer and an average low of -2°F in the winter. The average annual precipitation is 16 inches, with most of it falling in the form of snow.
Economy
The economy of Glastonbury is largely based on agriculture and tourism. The town is home to several farms, which produce a variety of crops, including wheat, barley, oats, hay, and alfalfa. The town is also home to several tourist attractions, including the Glastonbury Historical Museum, the Glastonbury Ski Resort, and the Glastonbury Hot Springs.
Demographics
As of the 2010 census, the population of Glastonbury was 1,845. The racial makeup of the town was 95.3% White, 0.3% African American, 0.7% Native American, 0.2% Asian, 0.1% Pacific Islander, 1.2% from other races, and 2.3% from two or more races. Hispanic or Latino of any race were 3.2% of the population.
The median household income in Glastonbury was $41,250, and the median family income was $50,000. The per capita income was $20,945. About 11.2% of families and 14.2% of the population were below the poverty line, including 18.2% of those under age 18 and 8.3% of those age 65 or over.
Conclusion
Glastonbury, Montana is a small town located in the southwestern part of the state, in the foothills of the Rocky Mountains. It is situated in the Gallatin Valley, near the headwaters of the Gallatin River. The town was founded in 1883 by a group of settlers from Glastonbury, Connecticut, who were looking for a place to settle and start a new life. The economy of Glastonbury is largely based on agriculture and tourism, and the town is home to several tourist attractions. As of the 2010 census, the population of Glastonbury was 1,845. The median household income in Glastonbury was $41,250, and the median family income was $50,000. The per capita income was $20,945.
Common Questions
What is Per Capita Income in South Glastonbury?
Per Capita income in South Glastonbury is $41,262.
What is the Median Household income in South Glastonbury?
Median Household Income in South Glastonbury is $55,278.
What is Inequality or Gini Index in South Glastonbury?
Inequality or Gini Index in South Glastonbury is 0.40.
What is the Total Population of South Glastonbury?
Total Population of South Glastonbury is 276.
What is the Total Male Population of South Glastonbury?
Total Male Population of South Glastonbury is 125.
What is the Total Female Population of South Glastonbury?
Total Female Population of South Glastonbury is 151.
What is the Ratio of Males per 100 Females in South Glastonbury?
There are 82.78 Males per 100 Females in South Glastonbury.
What is the Ratio of Females per 100 Males in South Glastonbury?
There are 120.80 Females per 100 Males in South Glastonbury.
What is the Median Population Age in South Glastonbury?
Median Population Age in South Glastonbury is 59.8 Years.
What is the Average Family Size in South Glastonbury
Average Family Size in South Glastonbury is 1.9 People.
What is the Average Household Size in South Glastonbury
Average Household Size in South Glastonbury is 1.4 People.
How Large is the Labor Force in South Glastonbury?
There are 110 People in the Labor Forcein in South Glastonbury.
What is the Percentage of People in the Labor Force in South Glastonbury?
40.6% of People are in the Labor Force in South Glastonbury.