Riverbend, MT Map & Demographics
Riverbend Map
Riverbend Overview
$24,236
PER CAPITA INCOME
$70,714
AVG FAMILY INCOME
$67,500
AVG HOUSEHOLD INCOME
0.28
INEQUALITY / GINI INDEX
433
TOTAL POPULATION
273
MALE POPULATION
160
FEMALE POPULATION
170.62
MALES / 100 FEMALES
58.61
FEMALES / 100 MALES
33.7
MEDIAN AGE
2.6
AVG FAMILY SIZE
3.1
AVG HOUSEHOLD SIZE
198
LABOR FORCE [ PEOPLE ]
59.6%
PERCENT IN LABOR FORCE
Income in Riverbend
Income Overview in Riverbend
Per Capita Income in Riverbend is $24,236, while median incomes of families and households are $70,714 and $67,500 respectively.
| Characteristic | Number | Measure |
| Per Capita Income | 433 | $24,236 |
| Median Family Income | 108 | $70,714 |
| Mean Family Income | 108 | $77,336 |
| Median Household Income | 138 | $67,500 |
| Mean Household Income | 138 | $72,257 |
| Income Deficit | 108 | $0 |
| Wage / Income Gap (%) | 433 | 0.00% |
| Wage / Income Gap ($) | 433 | 100.00¢ per $1 |
| Gini / Inequality Index | 433 | 0.28 |
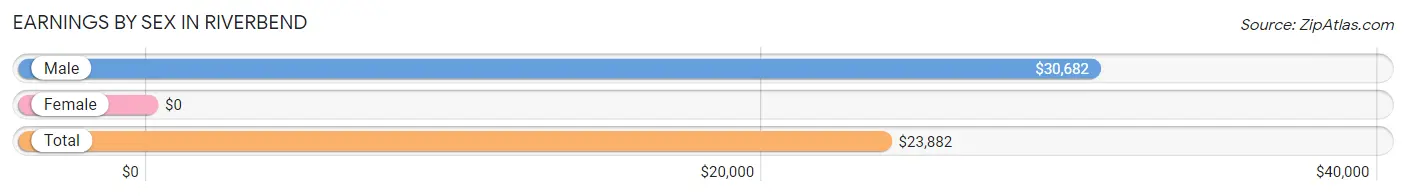
Earnings by Sex in Riverbend
| Sex | Number | Average Earnings |
| Male | 126 (56.5%) | $30,682 |
| Female | 97 (43.5%) | $0 |
| Total | 223 (100.0%) | $23,882 |
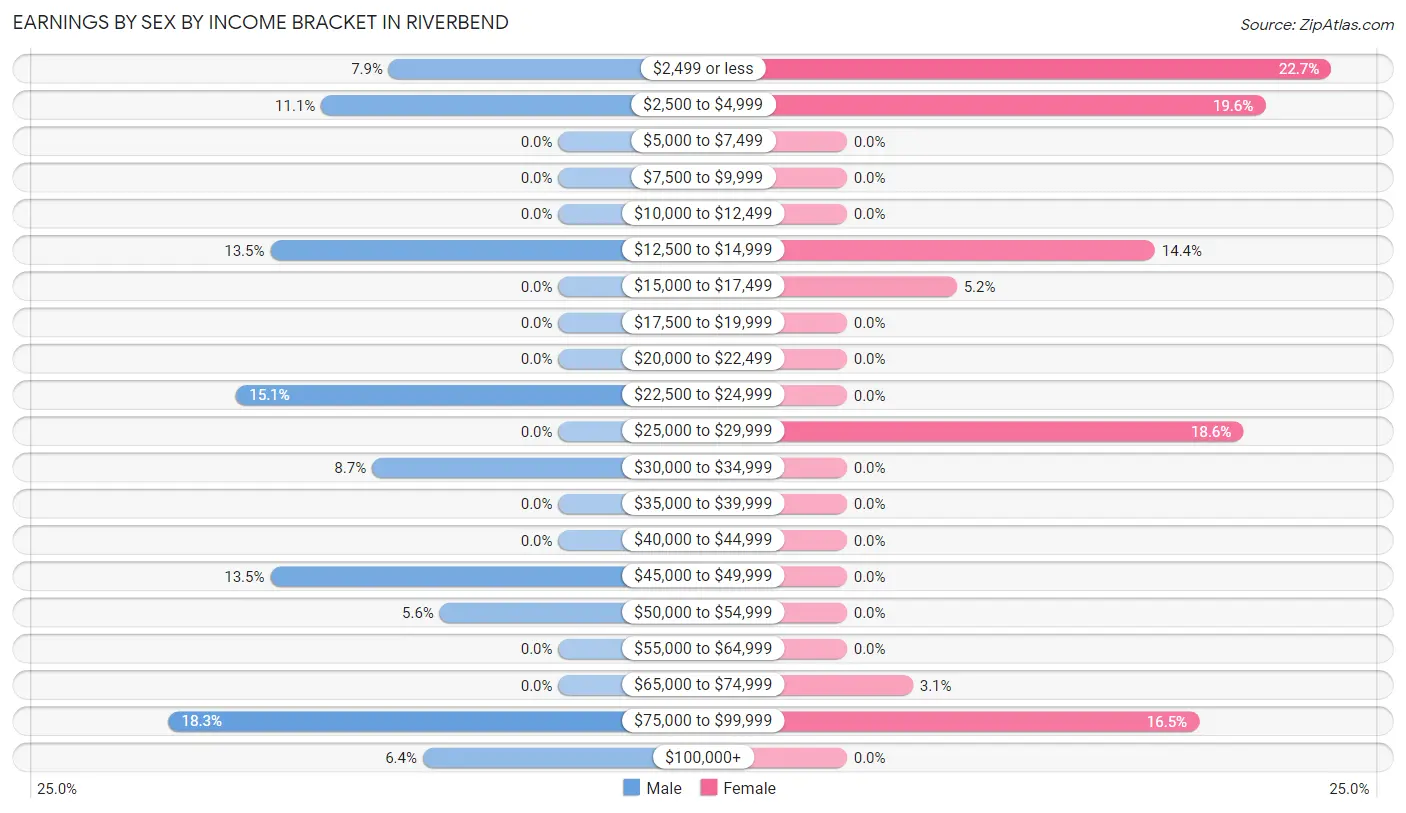
Earnings by Sex by Income Bracket in Riverbend
The most common earnings brackets in Riverbend are $75,000 to $99,999 for men (23 | 18.2%) and $2,499 or less for women (22 | 22.7%).
| Income | Male | Female |
| $2,499 or less | 10 (7.9%) | 22 (22.7%) |
| $2,500 to $4,999 | 14 (11.1%) | 19 (19.6%) |
| $5,000 to $7,499 | 0 (0.0%) | 0 (0.0%) |
| $7,500 to $9,999 | 0 (0.0%) | 0 (0.0%) |
| $10,000 to $12,499 | 0 (0.0%) | 0 (0.0%) |
| $12,500 to $14,999 | 17 (13.5%) | 14 (14.4%) |
| $15,000 to $17,499 | 0 (0.0%) | 5 (5.1%) |
| $17,500 to $19,999 | 0 (0.0%) | 0 (0.0%) |
| $20,000 to $22,499 | 0 (0.0%) | 0 (0.0%) |
| $22,500 to $24,999 | 19 (15.1%) | 0 (0.0%) |
| $25,000 to $29,999 | 0 (0.0%) | 18 (18.6%) |
| $30,000 to $34,999 | 11 (8.7%) | 0 (0.0%) |
| $35,000 to $39,999 | 0 (0.0%) | 0 (0.0%) |
| $40,000 to $44,999 | 0 (0.0%) | 0 (0.0%) |
| $45,000 to $49,999 | 17 (13.5%) | 0 (0.0%) |
| $50,000 to $54,999 | 7 (5.6%) | 0 (0.0%) |
| $55,000 to $64,999 | 0 (0.0%) | 0 (0.0%) |
| $65,000 to $74,999 | 0 (0.0%) | 3 (3.1%) |
| $75,000 to $99,999 | 23 (18.2%) | 16 (16.5%) |
| $100,000+ | 8 (6.4%) | 0 (0.0%) |
| Total | 126 (100.0%) | 97 (100.0%) |
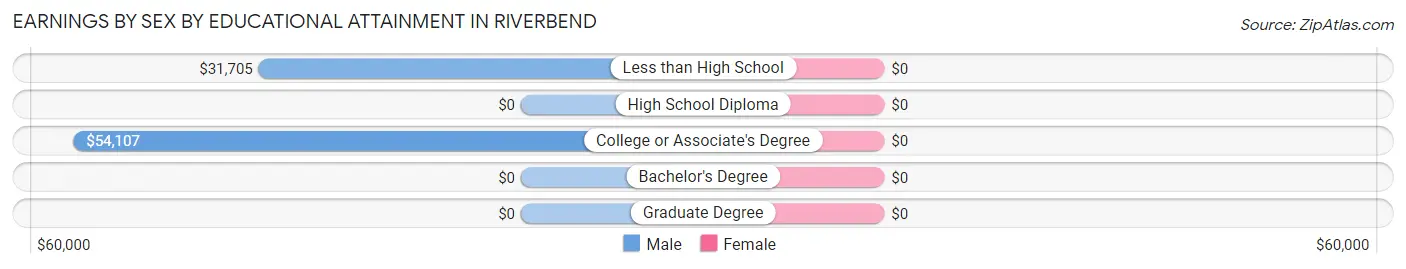
Earnings by Sex by Educational Attainment in Riverbend
| Educational Attainment | Male Income | Female Income |
| Less than High School | $31,705 | $0 |
| High School Diploma | - | - |
| College or Associate's Degree | $54,107 | $0 |
| Bachelor's Degree | - | - |
| Graduate Degree | - | - |
| Total | $31,591 | $0 |
Family Income in Riverbend
Family Income Brackets in Riverbend
According to the Riverbend family income data, there are 36 families falling into the $100,000 to $149,999 income range, which is the most common income bracket and makes up 33.3% of all families.
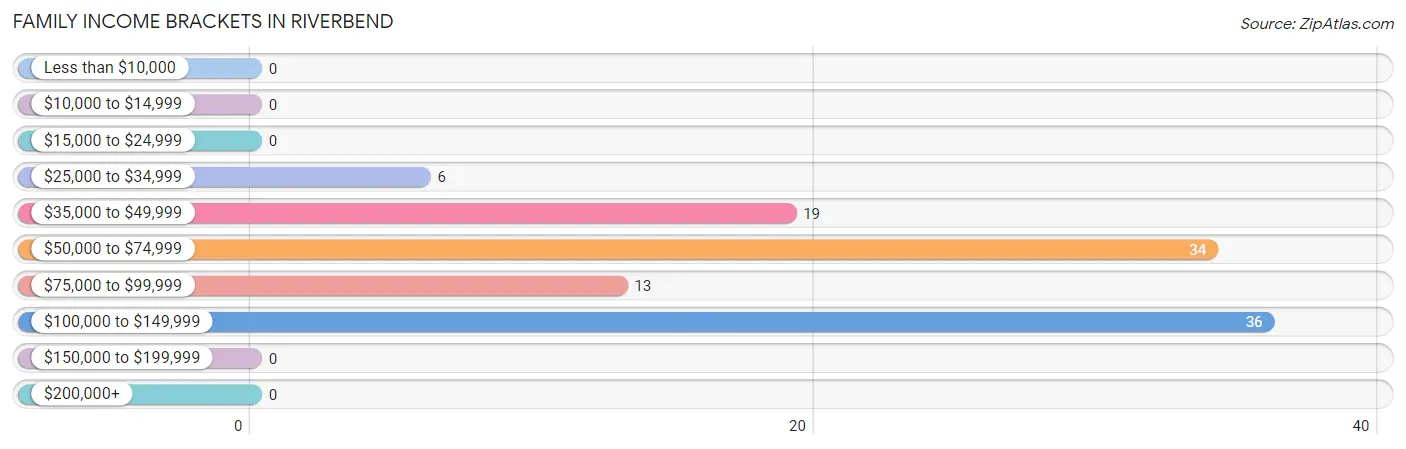
| Income Bracket | # Families | % Families |
| Less than $10,000 | 0 | 0.0% |
| $10,000 to $14,999 | 0 | 0.0% |
| $15,000 to $24,999 | 0 | 0.0% |
| $25,000 to $34,999 | 6 | 5.6% |
| $35,000 to $49,999 | 19 | 17.6% |
| $50,000 to $74,999 | 34 | 31.5% |
| $75,000 to $99,999 | 13 | 12.0% |
| $100,000 to $149,999 | 36 | 33.3% |
| $150,000 to $199,999 | 0 | 0.0% |
| $200,000+ | 0 | 0.0% |
Family Income by Famaliy Size in Riverbend
4-person families (19 | 17.6%) account for the highest median family income in Riverbend with $108,021 per family, while 2-person families (56 | 51.8%) have the highest median income of $42,084 per family member.
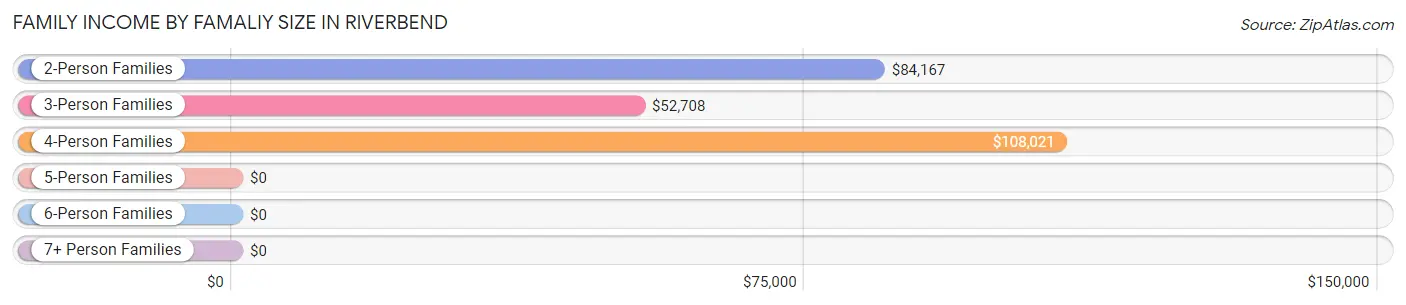
| Income Bracket | # Families | Median Income |
| 2-Person Families | 56 (51.8%) | $84,167 |
| 3-Person Families | 33 (30.6%) | $52,708 |
| 4-Person Families | 19 (17.6%) | $108,021 |
| 5-Person Families | 0 (0.0%) | $0 |
| 6-Person Families | 0 (0.0%) | $0 |
| 7+ Person Families | 0 (0.0%) | $0 |
| Total | 108 (100.0%) | $70,714 |
Family Income by Number of Earners in Riverbend
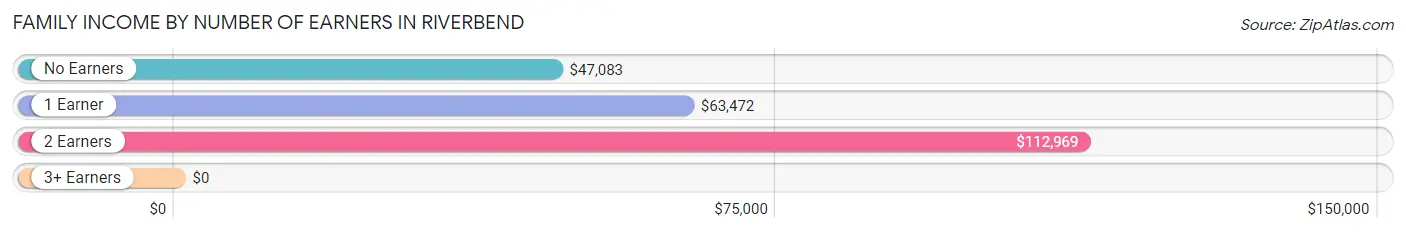
| Number of Earners | # Families | Median Income |
| No Earners | 29 (26.9%) | $47,083 |
| 1 Earner | 19 (17.6%) | $63,472 |
| 2 Earners | 26 (24.1%) | $112,969 |
| 3+ Earners | 34 (31.5%) | $0 |
| Total | 108 (100.0%) | $70,714 |
Household Income in Riverbend
Household Income Brackets in Riverbend
With 34 households falling in the category, the $50,000 to $74,999 income range is the most frequent in Riverbend, accounting for 24.6% of all households.
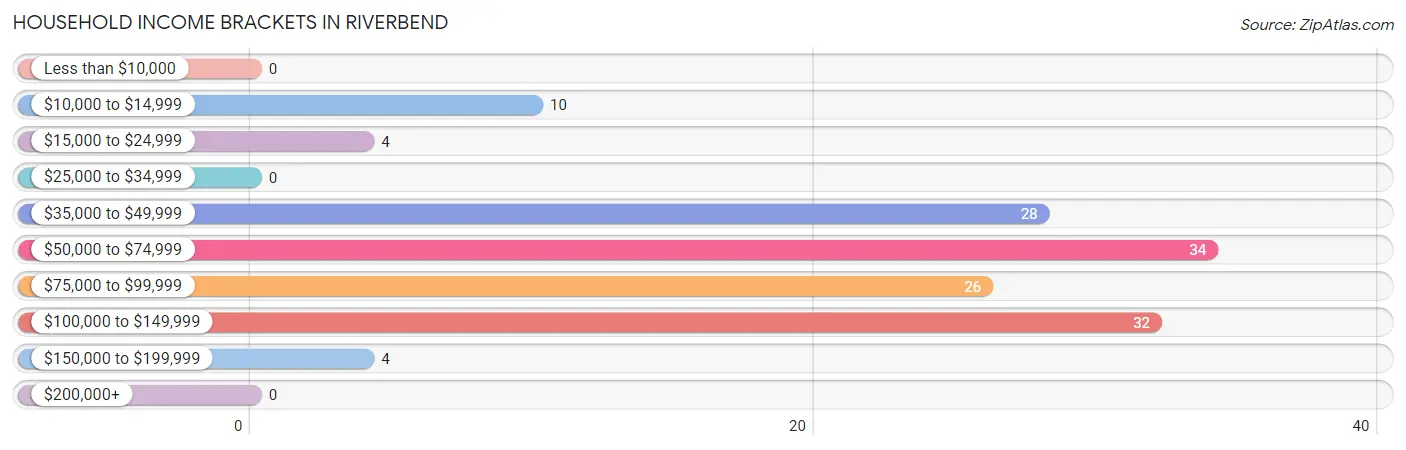
| Income Bracket | # Households | % Households |
| Less than $10,000 | 0 | 0.0% |
| $10,000 to $14,999 | 10 | 7.2% |
| $15,000 to $24,999 | 4 | 2.9% |
| $25,000 to $34,999 | 0 | 0.0% |
| $35,000 to $49,999 | 28 | 20.3% |
| $50,000 to $74,999 | 34 | 24.6% |
| $75,000 to $99,999 | 26 | 18.8% |
| $100,000 to $149,999 | 32 | 23.2% |
| $150,000 to $199,999 | 4 | 2.9% |
| $200,000+ | 0 | 0.0% |
Household Income by Householder Age in Riverbend
The median household income in Riverbend is $67,500, with the highest median household income of $112,734 found in the 25 to 44 years age bracket for the primary householder. A total of 61 households (44.2%) fall into this category.
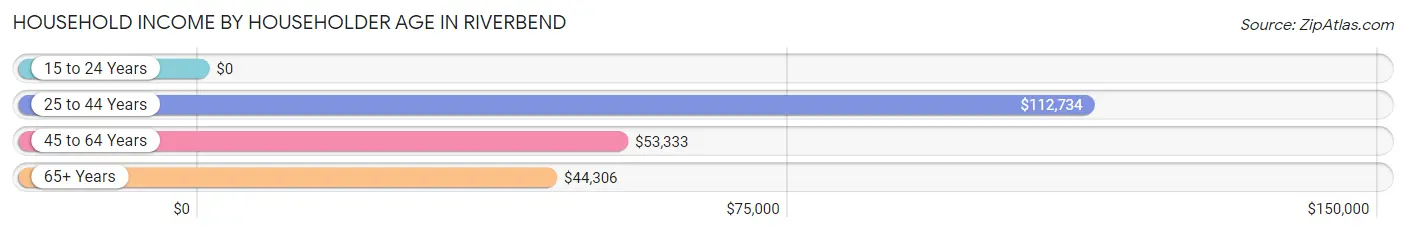
| Income Bracket | # Households | Median Income |
| 15 to 24 Years | 0 (0.0%) | $0 |
| 25 to 44 Years | 61 (44.2%) | $112,734 |
| 45 to 64 Years | 38 (27.5%) | $53,333 |
| 65+ Years | 39 (28.3%) | $44,306 |
| Total | 138 (100.0%) | $67,500 |
Poverty in Riverbend
Income Below Poverty by Sex and Age in Riverbend
With 14.0% poverty level for males and 11.3% for females among the residents of Riverbend, 35 to 44 year old males and 25 to 34 year old females are the most vulnerable to poverty, with 17 males (46.0%) and 14 females (46.7%) in their respective age groups living below the poverty level.
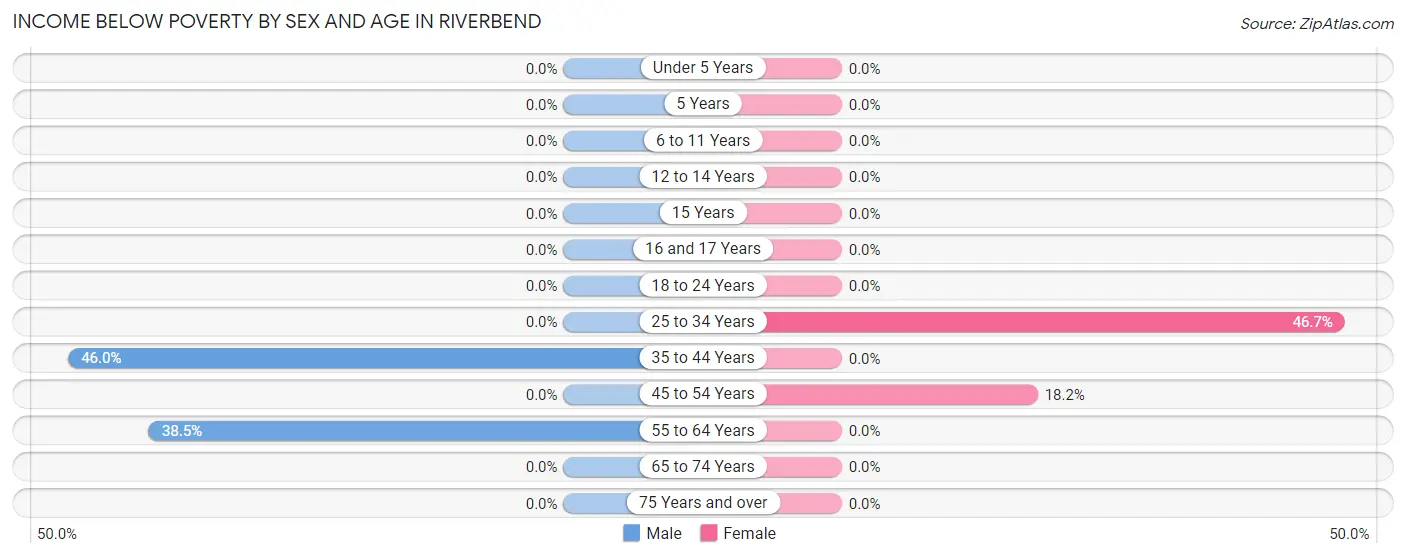
| Age Bracket | Male | Female |
| Under 5 Years | 0 (0.0%) | 0 (0.0%) |
| 5 Years | 0 (0.0%) | 0 (0.0%) |
| 6 to 11 Years | 0 (0.0%) | 0 (0.0%) |
| 12 to 14 Years | 0 (0.0%) | 0 (0.0%) |
| 15 Years | 0 (0.0%) | 0 (0.0%) |
| 16 and 17 Years | 0 (0.0%) | 0 (0.0%) |
| 18 to 24 Years | 0 (0.0%) | 0 (0.0%) |
| 25 to 34 Years | 0 (0.0%) | 14 (46.7%) |
| 35 to 44 Years | 17 (46.0%) | 0 (0.0%) |
| 45 to 54 Years | 0 (0.0%) | 4 (18.2%) |
| 55 to 64 Years | 10 (38.5%) | 0 (0.0%) |
| 65 to 74 Years | 0 (0.0%) | 0 (0.0%) |
| 75 Years and over | 0 (0.0%) | 0 (0.0%) |
| Total | 27 (14.0%) | 18 (11.3%) |
Income Above Poverty by Sex and Age in Riverbend
According to the poverty statistics in Riverbend, males aged under 5 years and females aged 12 to 14 years are the age groups that are most secure financially, with 100.0% of males and 100.0% of females in these age groups living above the poverty line.
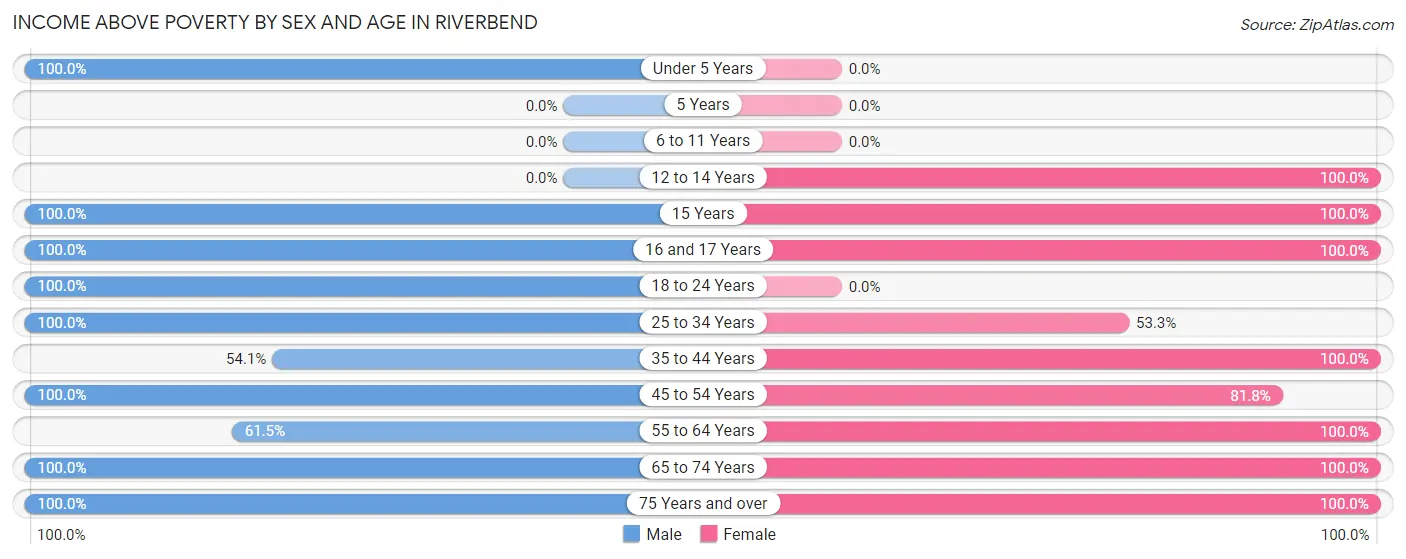
| Age Bracket | Male | Female |
| Under 5 Years | 2 (100.0%) | 0 (0.0%) |
| 5 Years | 0 (0.0%) | 0 (0.0%) |
| 6 to 11 Years | 0 (0.0%) | 0 (0.0%) |
| 12 to 14 Years | 0 (0.0%) | 9 (100.0%) |
| 15 Years | 1 (100.0%) | 9 (100.0%) |
| 16 and 17 Years | 8 (100.0%) | 19 (100.0%) |
| 18 to 24 Years | 37 (100.0%) | 0 (0.0%) |
| 25 to 34 Years | 34 (100.0%) | 16 (53.3%) |
| 35 to 44 Years | 20 (54.0%) | 33 (100.0%) |
| 45 to 54 Years | 8 (100.0%) | 18 (81.8%) |
| 55 to 64 Years | 16 (61.5%) | 8 (100.0%) |
| 65 to 74 Years | 30 (100.0%) | 7 (100.0%) |
| 75 Years and over | 10 (100.0%) | 23 (100.0%) |
| Total | 166 (86.0%) | 142 (88.7%) |
Income Below Poverty Among Married-Couple Families in Riverbend
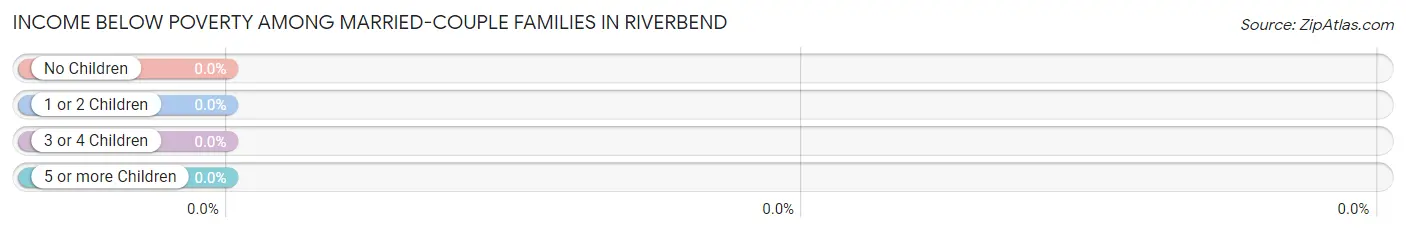
| Children | Above Poverty | Below Poverty |
| No Children | 52 (100.0%) | 0 (0.0%) |
| 1 or 2 Children | 7 (100.0%) | 0 (0.0%) |
| 3 or 4 Children | 0 (0.0%) | 0 (0.0%) |
| 5 or more Children | 0 (0.0%) | 0 (0.0%) |
| Total | 59 (100.0%) | 0 (0.0%) |
Income Below Poverty Among Single-Parent Households in Riverbend
| Children | Single Father | Single Mother |
| No Children | 0 (0.0%) | 0 (0.0%) |
| 1 or 2 Children | 0 (0.0%) | 0 (0.0%) |
| 3 or 4 Children | 0 (0.0%) | 0 (0.0%) |
| 5 or more Children | 0 (0.0%) | 0 (0.0%) |
| Total | 0 (0.0%) | 0 (0.0%) |
Income Below Poverty Among Married-Couple vs Single-Parent Households in Riverbend
| Children | Married-Couple Families | Single-Parent Households |
| No Children | 0 (0.0%) | 0 (0.0%) |
| 1 or 2 Children | 0 (0.0%) | 0 (0.0%) |
| 3 or 4 Children | 0 (0.0%) | 0 (0.0%) |
| 5 or more Children | 0 (0.0%) | 0 (0.0%) |
| Total | 0 (0.0%) | 0 (0.0%) |
Race in Riverbend
The most populous races in Riverbend are White / Caucasian (410 | 94.7%), Hispanic or Latino (80 | 18.5%), and Asian (19 | 4.4%).
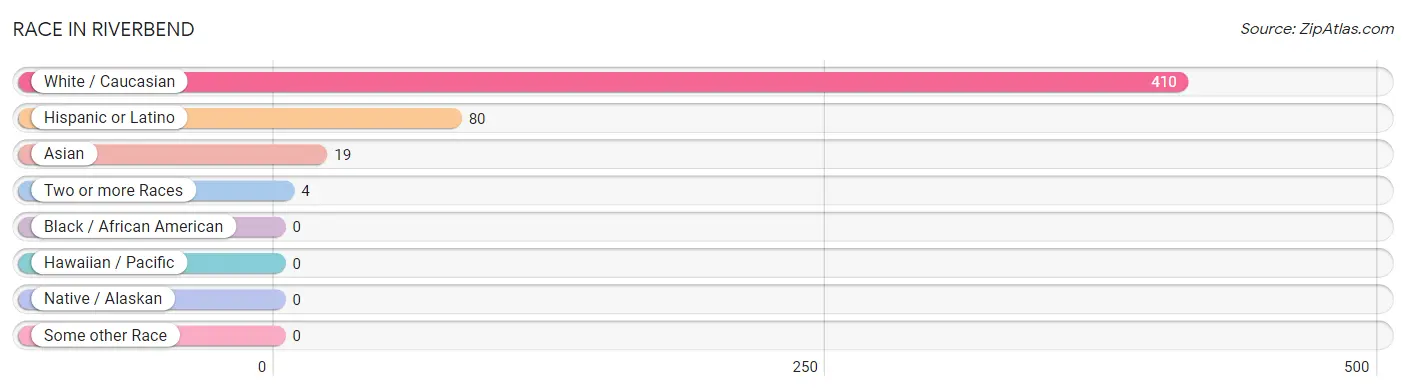
| Race | # Population | % Population |
| Asian | 19 | 4.4% |
| Black / African American | 0 | 0.0% |
| Hawaiian / Pacific | 0 | 0.0% |
| Hispanic or Latino | 80 | 18.5% |
| Native / Alaskan | 0 | 0.0% |
| White / Caucasian | 410 | 94.7% |
| Two or more Races | 4 | 0.9% |
| Some other Race | 0 | 0.0% |
| Total | 433 | 100.0% |
Ancestry in Riverbend
The most populous ancestries reported in Riverbend are Mexican (80 | 18.5%), German (45 | 10.4%), American (41 | 9.5%), English (40 | 9.2%), and Slovak (33 | 7.6%), together accounting for 55.2% of all Riverbend residents.
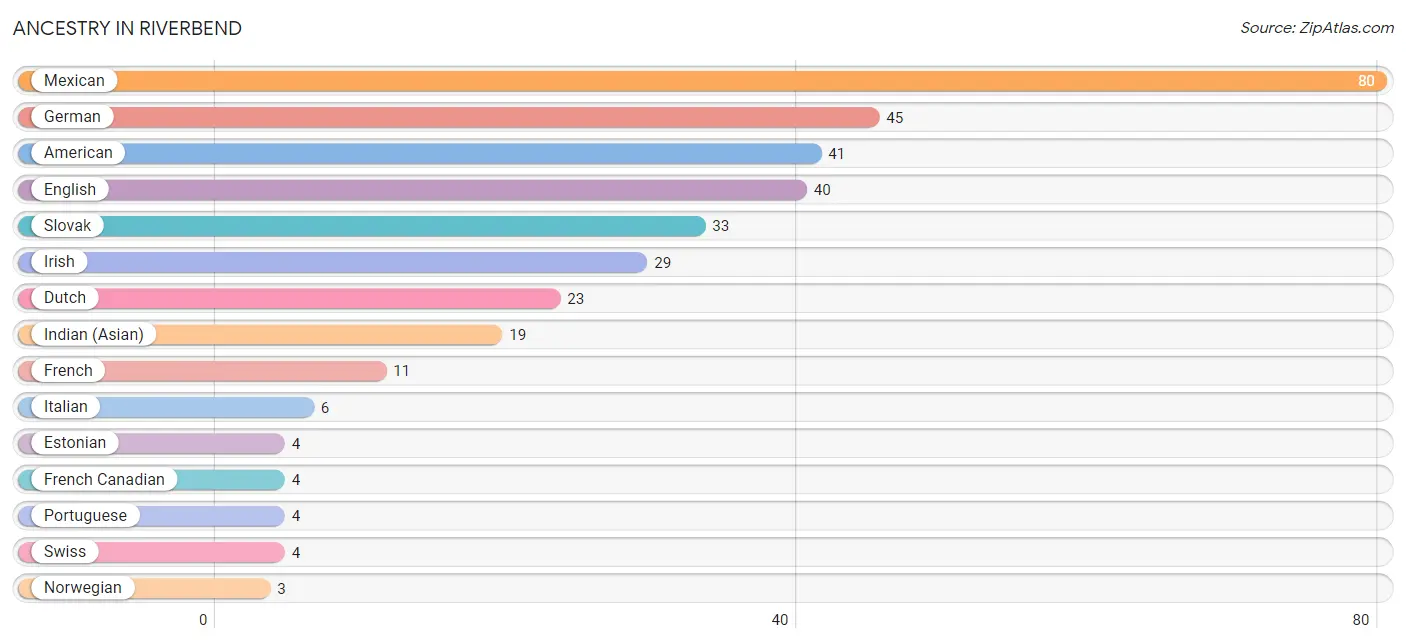
| Ancestry | # Population | % Population |
| American | 41 | 9.5% |
| Dutch | 23 | 5.3% |
| English | 40 | 9.2% |
| Estonian | 4 | 0.9% |
| French | 11 | 2.5% |
| French Canadian | 4 | 0.9% |
| German | 45 | 10.4% |
| Indian (Asian) | 19 | 4.4% |
| Irish | 29 | 6.7% |
| Italian | 6 | 1.4% |
| Mexican | 80 | 18.5% |
| Norwegian | 3 | 0.7% |
| Portuguese | 4 | 0.9% |
| Scottish | 3 | 0.7% |
| Slovak | 33 | 7.6% |
| Swedish | 3 | 0.7% |
| Swiss | 4 | 0.9% | View All 17 Rows |
Immigrants in Riverbend
The most numerous immigrant groups reported in Riverbend came from Asia (19 | 4.4%), China (19 | 4.4%), Eastern Asia (19 | 4.4%), and Canada (18 | 4.2%), together accounting for 17.3% of all Riverbend residents.
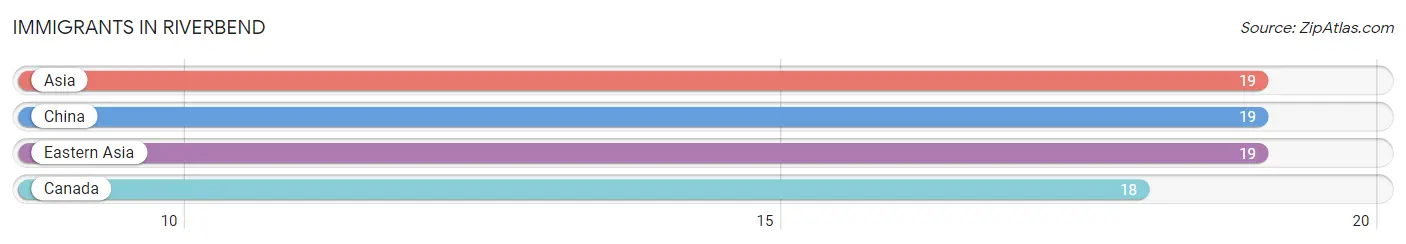
| Immigration Origin | # Population | % Population |
| Asia | 19 | 4.4% |
| Canada | 18 | 4.2% |
| China | 19 | 4.4% |
| Eastern Asia | 19 | 4.4% | View All 4 Rows |
Sex and Age in Riverbend
Sex and Age in Riverbend
The most populous age groups in Riverbend are Under 5 Years (82 | 30.0%) for men and 40 to 44 Years (33 | 20.6%) for women.
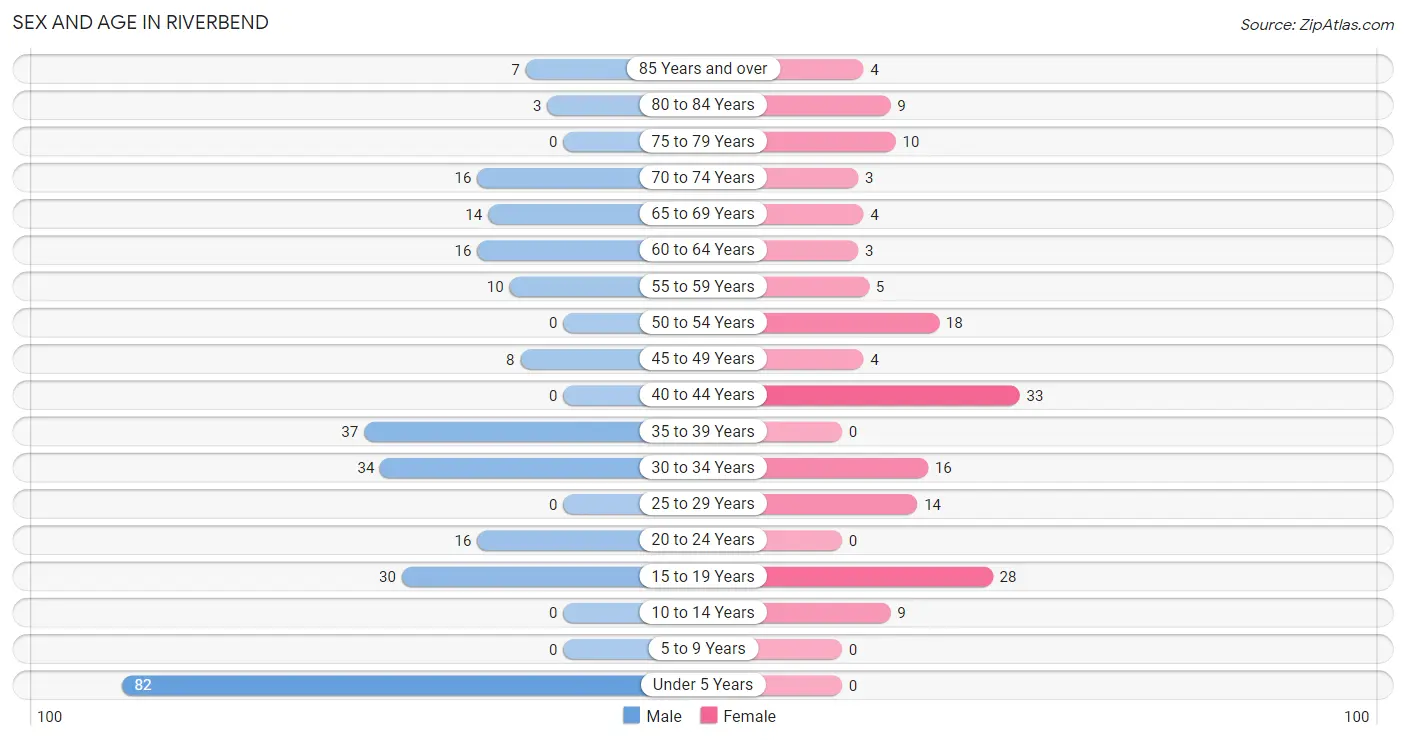
| Age Bracket | Male | Female |
| Under 5 Years | 82 (30.0%) | 0 (0.0%) |
| 5 to 9 Years | 0 (0.0%) | 0 (0.0%) |
| 10 to 14 Years | 0 (0.0%) | 9 (5.6%) |
| 15 to 19 Years | 30 (11.0%) | 28 (17.5%) |
| 20 to 24 Years | 16 (5.9%) | 0 (0.0%) |
| 25 to 29 Years | 0 (0.0%) | 14 (8.7%) |
| 30 to 34 Years | 34 (12.4%) | 16 (10.0%) |
| 35 to 39 Years | 37 (13.6%) | 0 (0.0%) |
| 40 to 44 Years | 0 (0.0%) | 33 (20.6%) |
| 45 to 49 Years | 8 (2.9%) | 4 (2.5%) |
| 50 to 54 Years | 0 (0.0%) | 18 (11.3%) |
| 55 to 59 Years | 10 (3.7%) | 5 (3.1%) |
| 60 to 64 Years | 16 (5.9%) | 3 (1.9%) |
| 65 to 69 Years | 14 (5.1%) | 4 (2.5%) |
| 70 to 74 Years | 16 (5.9%) | 3 (1.9%) |
| 75 to 79 Years | 0 (0.0%) | 10 (6.2%) |
| 80 to 84 Years | 3 (1.1%) | 9 (5.6%) |
| 85 Years and over | 7 (2.6%) | 4 (2.5%) |
| Total | 273 (100.0%) | 160 (100.0%) |
Families and Households in Riverbend
Median Family Size in Riverbend
The median family size in Riverbend is 2.59 persons per family, with single female/mother families (36 | 33.3%) accounting for the largest median family size of 3.39 persons per family. On the other hand, married-couple families (59 | 54.6%) represent the smallest median family size with 2.14 persons per family.
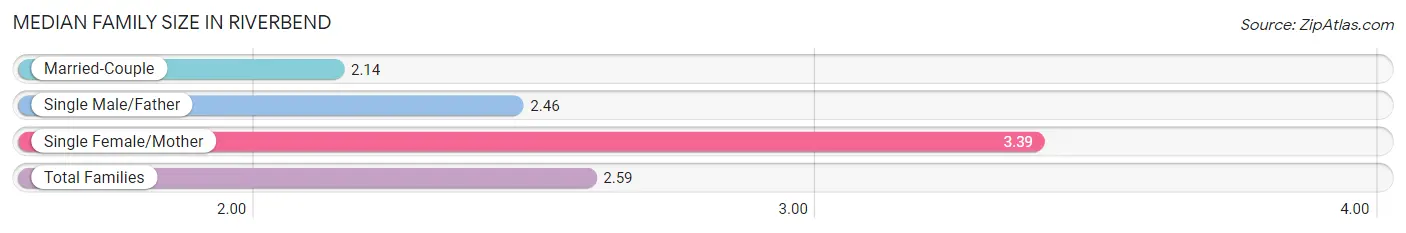
| Family Type | # Families | Family Size |
| Married-Couple | 59 (54.6%) | 2.14 |
| Single Male/Father | 13 (12.0%) | 2.46 |
| Single Female/Mother | 36 (33.3%) | 3.39 |
| Total Families | 108 (100.0%) | 2.59 |
Median Household Size in Riverbend
The median household size in Riverbend is 3.14 persons per household, with single female/mother households (36 | 26.1%) accounting for the largest median household size of 6.31 persons per household. non-family households (30 | 21.7%) represent the smallest median household size with 1.13 persons per household.
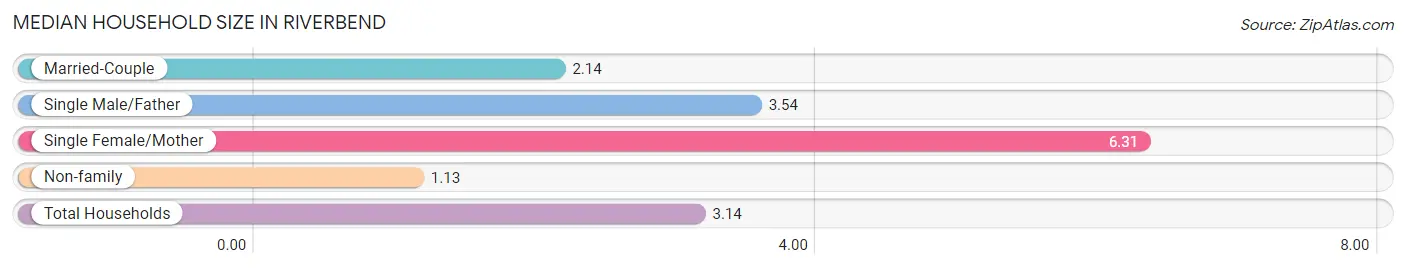
| Household Type | # Households | Household Size |
| Married-Couple | 59 (42.7%) | 2.14 |
| Single Male/Father | 13 (9.4%) | 3.54 |
| Single Female/Mother | 36 (26.1%) | 6.31 |
| Non-family | 30 (21.7%) | 1.13 |
| Total Households | 138 (100.0%) | 3.14 |
Household Size by Marriage Status in Riverbend
Out of a total of 138 households in Riverbend, 108 (78.3%) are family households, while 30 (21.7%) are nonfamily households. The most numerous type of family households are 2-person households, comprising 52, and the most common type of nonfamily households are 1-person households, comprising 20.
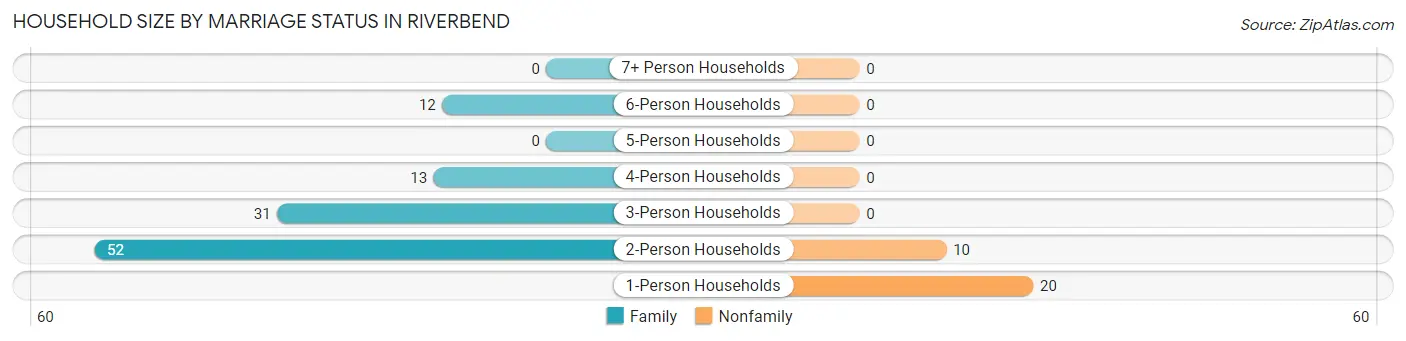
| Household Size | Family Households | Nonfamily Households |
| 1-Person Households | - | 20 (14.5%) |
| 2-Person Households | 52 (37.7%) | 10 (7.2%) |
| 3-Person Households | 31 (22.5%) | 0 (0.0%) |
| 4-Person Households | 13 (9.4%) | 0 (0.0%) |
| 5-Person Households | 0 (0.0%) | 0 (0.0%) |
| 6-Person Households | 12 (8.7%) | 0 (0.0%) |
| 7+ Person Households | 0 (0.0%) | 0 (0.0%) |
| Total | 108 (78.3%) | 30 (21.7%) |
Female Fertility in Riverbend
Fertility by Age in Riverbend
Average fertility rate in Riverbend is 126.0 births per 1,000 women. Women in the age bracket of 35 to 50 years have the highest fertility rate with 324.0 births per 1,000 women. Women in the age bracket of 35 to 50 years acount for 100.0% of all women with births.
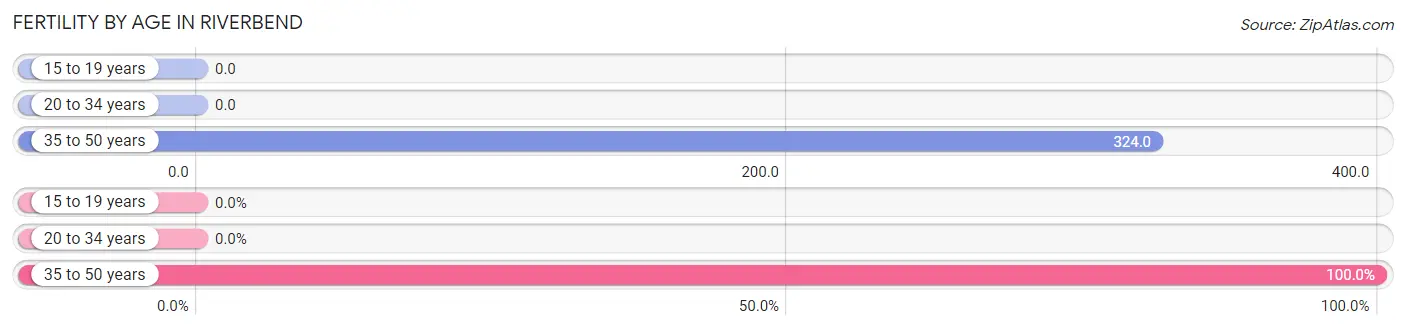
| Age Bracket | Women with Births | Births / 1,000 Women |
| 15 to 19 years | 0 (0.0%) | 0.0 |
| 20 to 34 years | 0 (0.0%) | 0.0 |
| 35 to 50 years | 12 (100.0%) | 324.0 |
| Total | 12 (100.0%) | 126.0 |
Fertility by Age by Marriage Status in Riverbend
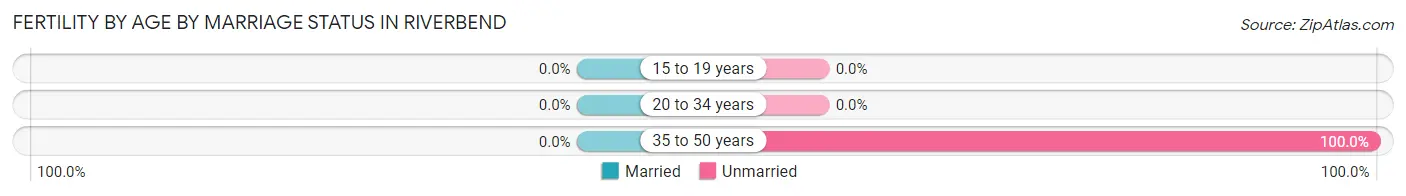
| Age Bracket | Married | Unmarried |
| 15 to 19 years | 0 (0.0%) | 0 (0.0%) |
| 20 to 34 years | 0 (0.0%) | 0 (0.0%) |
| 35 to 50 years | 0 (0.0%) | 12 (100.0%) |
| Total | 0 (0.0%) | 12 (100.0%) |
Fertility by Education in Riverbend
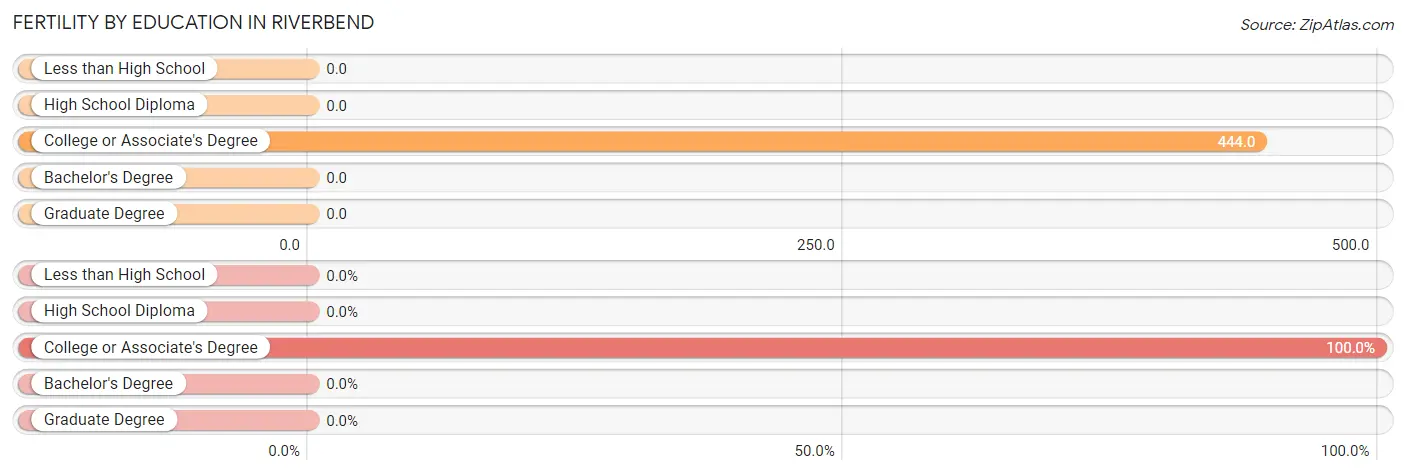
| Educational Attainment | Women with Births | Births / 1,000 Women |
| Less than High School | 0 (0.0%) | 0.0 |
| High School Diploma | 0 (0.0%) | 0.0 |
| College or Associate's Degree | 12 (100.0%) | 444.0 |
| Bachelor's Degree | 0 (0.0%) | 0.0 |
| Graduate Degree | 0 (0.0%) | 0.0 |
| Total | 12 (100.0%) | 126.0 |
Fertility by Education by Marriage Status in Riverbend
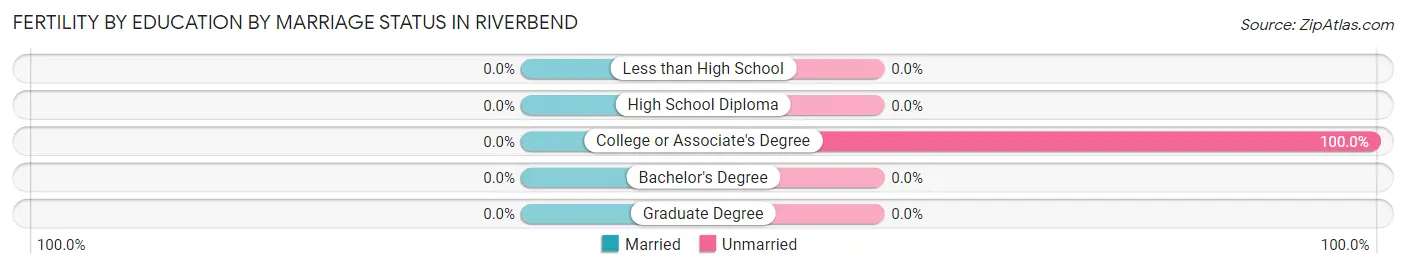
| Educational Attainment | Married | Unmarried |
| Less than High School | 0 (0.0%) | 0 (0.0%) |
| High School Diploma | 0 (0.0%) | 0 (0.0%) |
| College or Associate's Degree | 0 (0.0%) | 12 (100.0%) |
| Bachelor's Degree | 0 (0.0%) | 0 (0.0%) |
| Graduate Degree | 0 (0.0%) | 0 (0.0%) |
| Total | 0 (0.0%) | 12 (100.0%) |
Employment Characteristics in Riverbend
Employment by Class of Employer in Riverbend
Among the 184 employed individuals in Riverbend, private company employees (143 | 77.7%), local government employees (16 | 8.7%), and not-for-profit organizations (14 | 7.6%) make up the most common classes of employment.
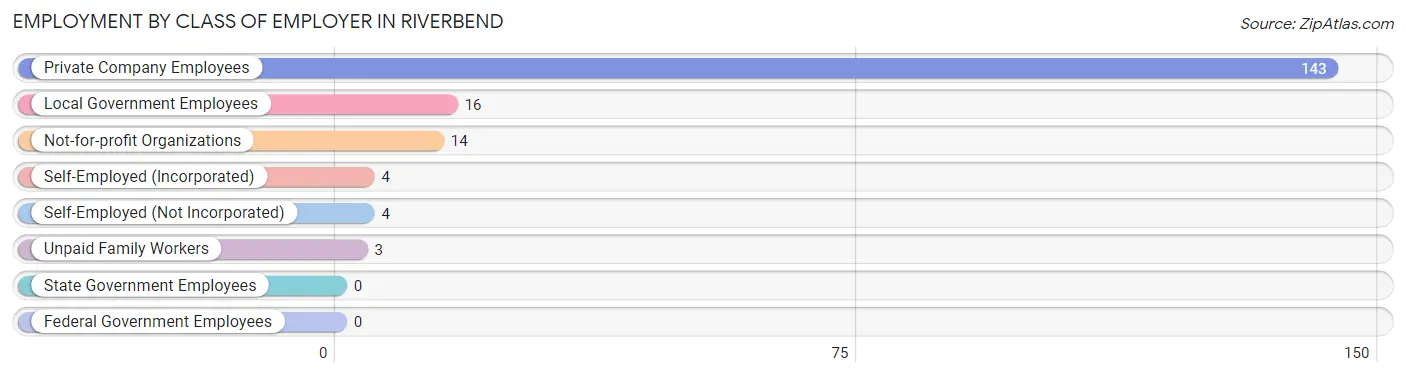
| Employer Class | # Employees | % Employees |
| Private Company Employees | 143 | 77.7% |
| Self-Employed (Incorporated) | 4 | 2.2% |
| Self-Employed (Not Incorporated) | 4 | 2.2% |
| Not-for-profit Organizations | 14 | 7.6% |
| Local Government Employees | 16 | 8.7% |
| State Government Employees | 0 | 0.0% |
| Federal Government Employees | 0 | 0.0% |
| Unpaid Family Workers | 3 | 1.6% |
| Total | 184 | 100.0% |
Employment Status by Age in Riverbend
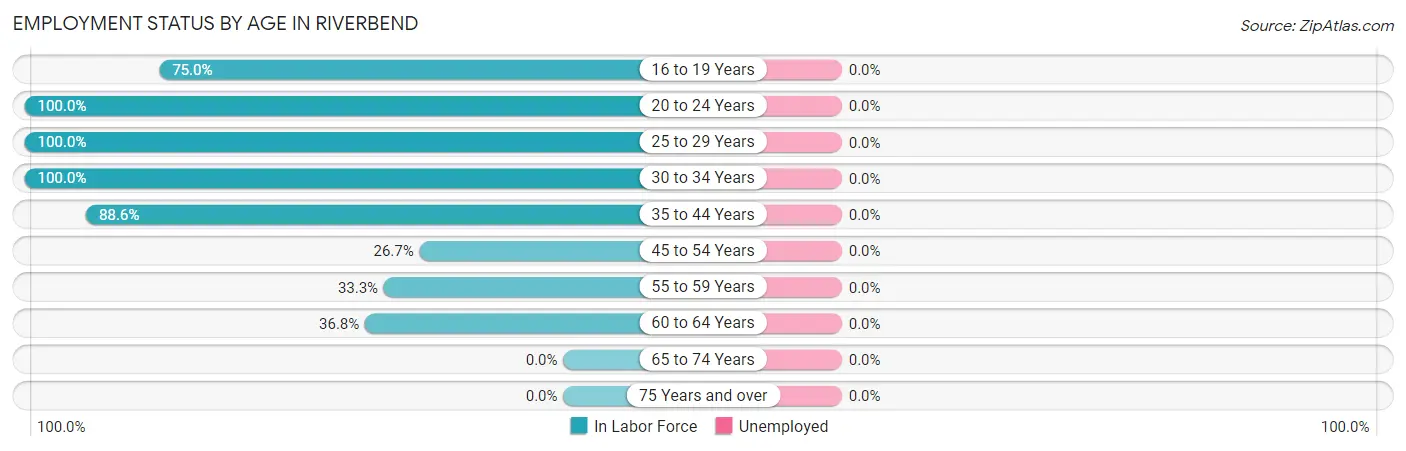
| Age Bracket | In Labor Force | Unemployed |
| 16 to 19 Years | 36 (75.0%) | 0 (0.0%) |
| 20 to 24 Years | 16 (100.0%) | 0 (0.0%) |
| 25 to 29 Years | 14 (100.0%) | 0 (0.0%) |
| 30 to 34 Years | 50 (100.0%) | 0 (0.0%) |
| 35 to 44 Years | 62 (88.6%) | 0 (0.0%) |
| 45 to 54 Years | 8 (26.7%) | 0 (0.0%) |
| 55 to 59 Years | 5 (33.3%) | 0 (0.0%) |
| 60 to 64 Years | 7 (36.8%) | 0 (0.0%) |
| 65 to 74 Years | 0 (0.0%) | 0 (0.0%) |
| 75 Years and over | 0 (0.0%) | 0 (0.0%) |
| Total | 198 (59.6%) | 0 (0.0%) |
Employment Status by Educational Attainment in Riverbend
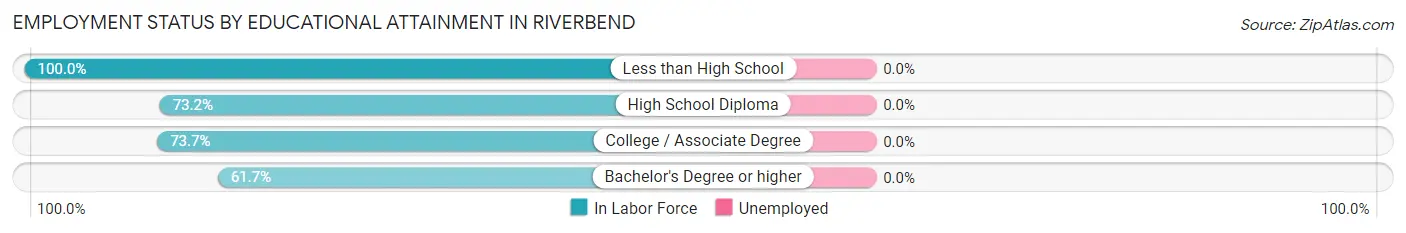
| Educational Attainment | In Labor Force | Unemployed |
| Less than High School | 23 (100.0%) | 0 (0.0%) |
| High School Diploma | 52 (73.2%) | 0 (0.0%) |
| College / Associate Degree | 42 (73.7%) | 0 (0.0%) |
| Bachelor's Degree or higher | 29 (61.7%) | 0 (0.0%) |
| Total | 146 (73.7%) | 0 (0.0%) |
Employment Occupations by Sex in Riverbend
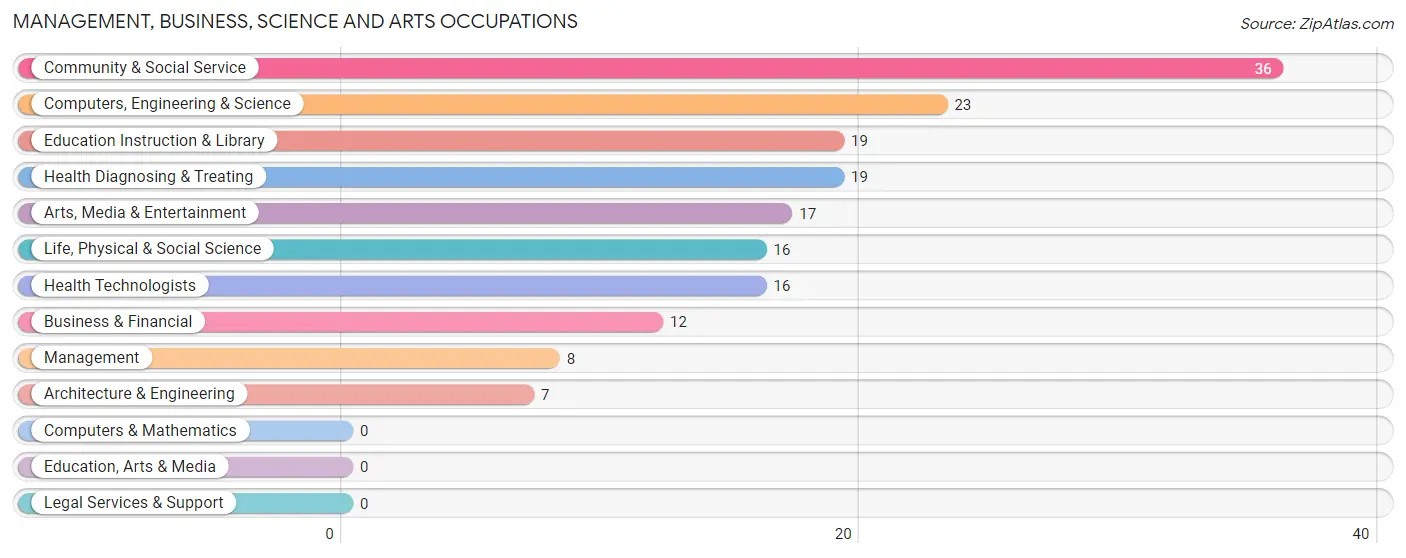
Management, Business, Science and Arts Occupations
The most common Management, Business, Science and Arts occupations in Riverbend are Community & Social Service (36 | 18.2%), Computers, Engineering & Science (23 | 11.6%), Education Instruction & Library (19 | 9.6%), Health Diagnosing & Treating (19 | 9.6%), and Arts, Media & Entertainment (17 | 8.6%).
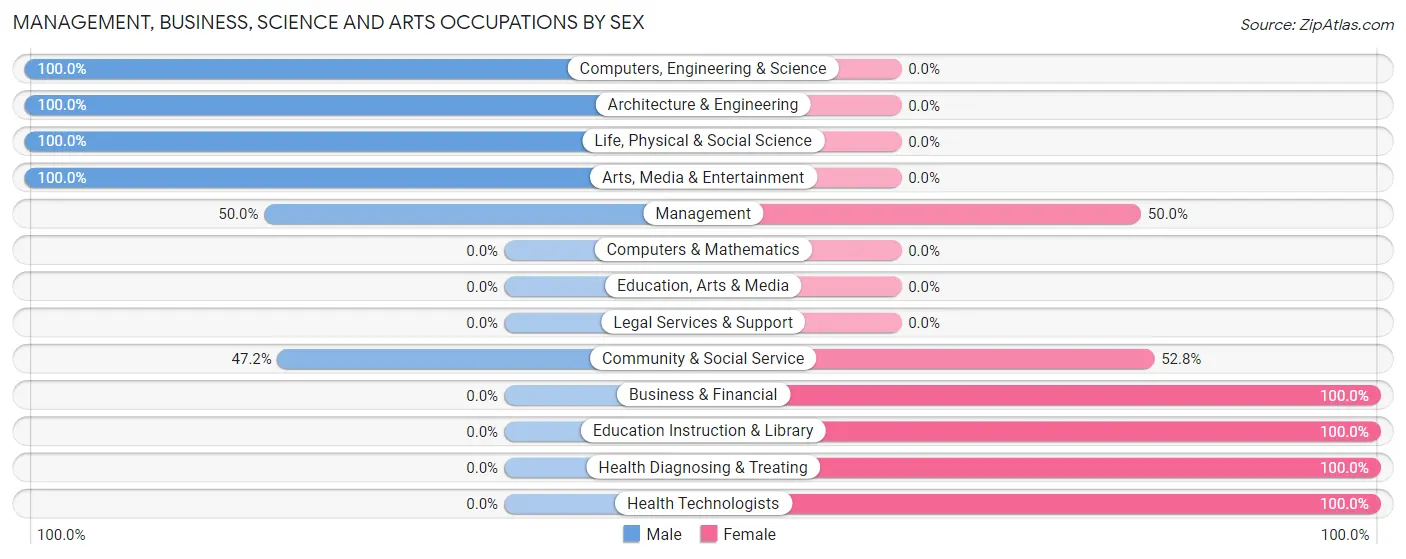
Management, Business, Science and Arts Occupations by Sex
Within the Management, Business, Science and Arts occupations in Riverbend, the most male-oriented occupations are Computers, Engineering & Science (100.0%), Architecture & Engineering (100.0%), and Life, Physical & Social Science (100.0%), while the most female-oriented occupations are Business & Financial (100.0%), Education Instruction & Library (100.0%), and Health Diagnosing & Treating (100.0%).
| Occupation | Male | Female |
| Management | 4 (50.0%) | 4 (50.0%) |
| Business & Financial | 0 (0.0%) | 12 (100.0%) |
| Computers, Engineering & Science | 23 (100.0%) | 0 (0.0%) |
| Computers & Mathematics | 0 (0.0%) | 0 (0.0%) |
| Architecture & Engineering | 7 (100.0%) | 0 (0.0%) |
| Life, Physical & Social Science | 16 (100.0%) | 0 (0.0%) |
| Community & Social Service | 17 (47.2%) | 19 (52.8%) |
| Education, Arts & Media | 0 (0.0%) | 0 (0.0%) |
| Legal Services & Support | 0 (0.0%) | 0 (0.0%) |
| Education Instruction & Library | 0 (0.0%) | 19 (100.0%) |
| Arts, Media & Entertainment | 17 (100.0%) | 0 (0.0%) |
| Health Diagnosing & Treating | 0 (0.0%) | 19 (100.0%) |
| Health Technologists | 0 (0.0%) | 16 (100.0%) |
| Total (Category) | 44 (44.9%) | 54 (55.1%) |
| Total (Overall) | 119 (60.1%) | 79 (39.9%) |
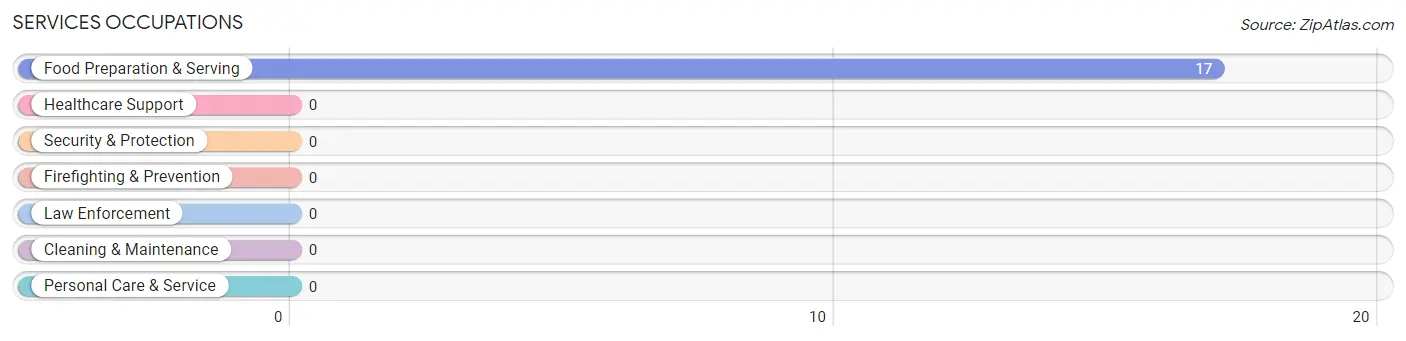
Services Occupations
The most common Services occupations in Riverbend are , and Food Preparation & Serving (17 | 8.6%).
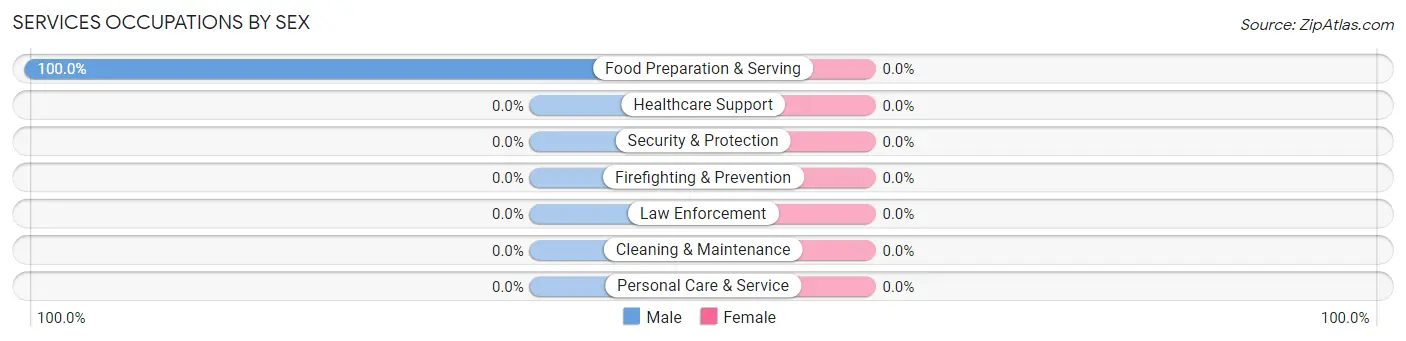
Services Occupations by Sex
| Occupation | Male | Female |
| Healthcare Support | 0 (0.0%) | 0 (0.0%) |
| Security & Protection | 0 (0.0%) | 0 (0.0%) |
| Firefighting & Prevention | 0 (0.0%) | 0 (0.0%) |
| Law Enforcement | 0 (0.0%) | 0 (0.0%) |
| Food Preparation & Serving | 17 (100.0%) | 0 (0.0%) |
| Cleaning & Maintenance | 0 (0.0%) | 0 (0.0%) |
| Personal Care & Service | 0 (0.0%) | 0 (0.0%) |
| Total (Category) | 17 (100.0%) | 0 (0.0%) |
| Total (Overall) | 119 (60.1%) | 79 (39.9%) |
Sales and Office Occupations
Sales and Office Occupations by Sex
| Occupation | Male | Female |
| Sales & Related | 0 (0.0%) | 0 (0.0%) |
| Office & Administration | 0 (0.0%) | 0 (0.0%) |
| Total (Category) | 0 (0.0%) | 0 (0.0%) |
| Total (Overall) | 119 (60.1%) | 79 (39.9%) |
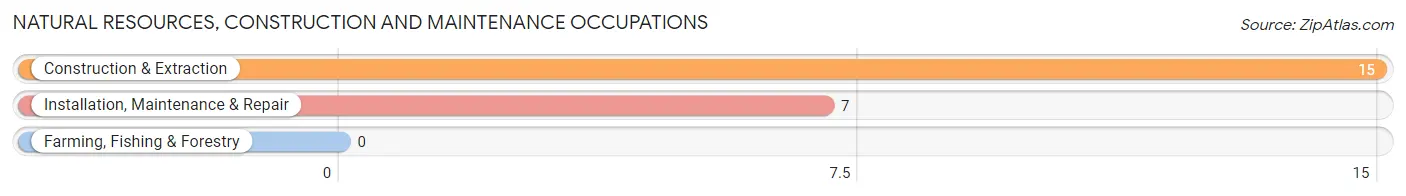
Natural Resources, Construction and Maintenance Occupations
The most common Natural Resources, Construction and Maintenance occupations in Riverbend are Construction & Extraction (15 | 7.6%), and Installation, Maintenance & Repair (7 | 3.5%).
Natural Resources, Construction and Maintenance Occupations by Sex
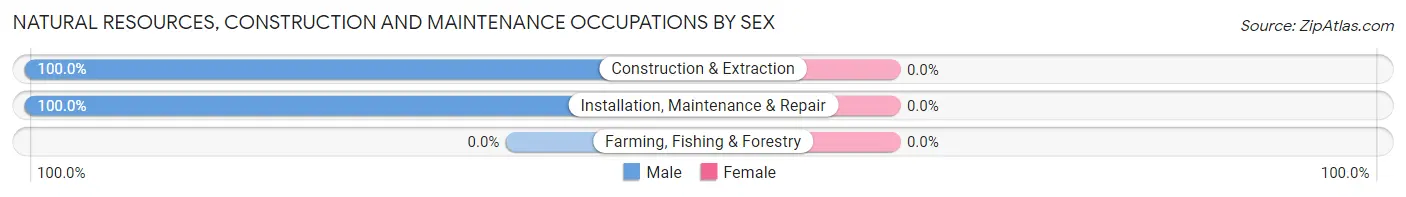
| Occupation | Male | Female |
| Farming, Fishing & Forestry | 0 (0.0%) | 0 (0.0%) |
| Construction & Extraction | 15 (100.0%) | 0 (0.0%) |
| Installation, Maintenance & Repair | 7 (100.0%) | 0 (0.0%) |
| Total (Category) | 22 (100.0%) | 0 (0.0%) |
| Total (Overall) | 119 (60.1%) | 79 (39.9%) |
Production, Transportation and Moving Occupations
The most common Production, Transportation and Moving occupations in Riverbend are Material Moving (40 | 20.2%), Transportation (13 | 6.6%), and Production (8 | 4.0%).
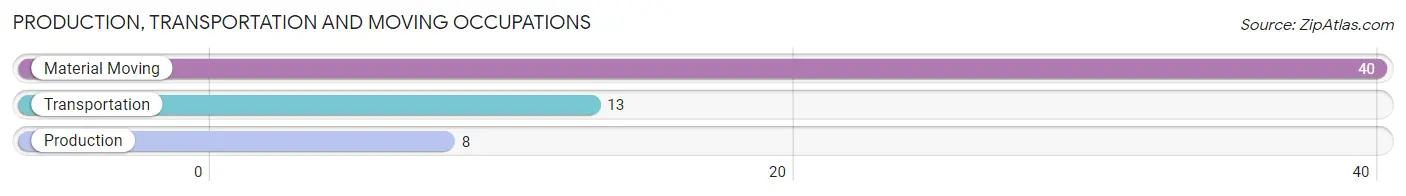
Production, Transportation and Moving Occupations by Sex
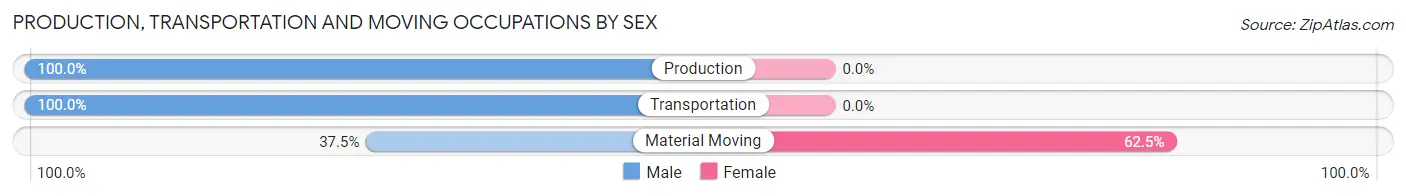
| Occupation | Male | Female |
| Production | 8 (100.0%) | 0 (0.0%) |
| Transportation | 13 (100.0%) | 0 (0.0%) |
| Material Moving | 15 (37.5%) | 25 (62.5%) |
| Total (Category) | 36 (59.0%) | 25 (41.0%) |
| Total (Overall) | 119 (60.1%) | 79 (39.9%) |
Employment Industries by Sex in Riverbend
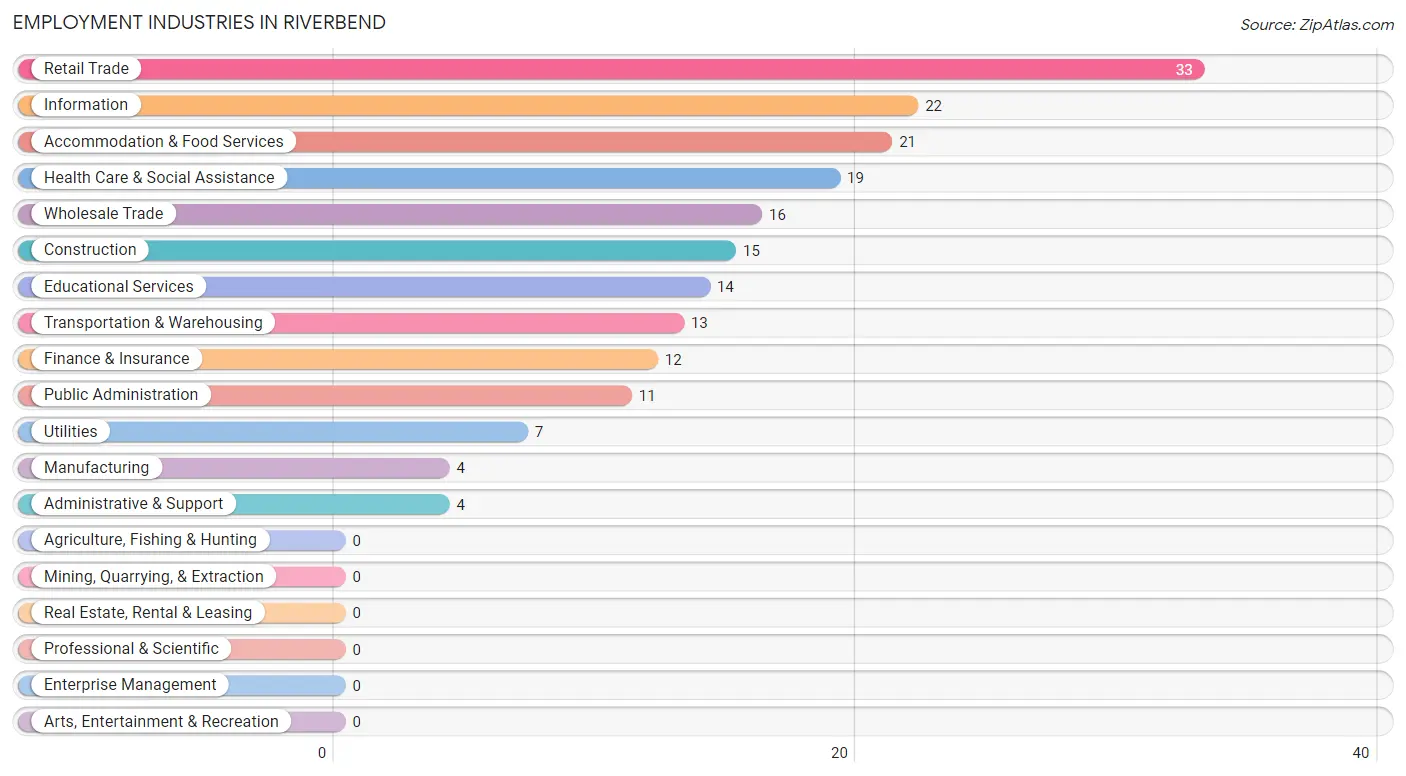
Employment Industries in Riverbend
The major employment industries in Riverbend include Retail Trade (33 | 16.7%), Information (22 | 11.1%), Accommodation & Food Services (21 | 10.6%), Health Care & Social Assistance (19 | 9.6%), and Wholesale Trade (16 | 8.1%).
Employment Industries by Sex in Riverbend
The Riverbend industries that see more men than women are Construction (100.0%), Manufacturing (100.0%), and Wholesale Trade (100.0%), whereas the industries that tend to have a higher number of women are Finance & Insurance (100.0%), Educational Services (100.0%), and Health Care & Social Assistance (100.0%).
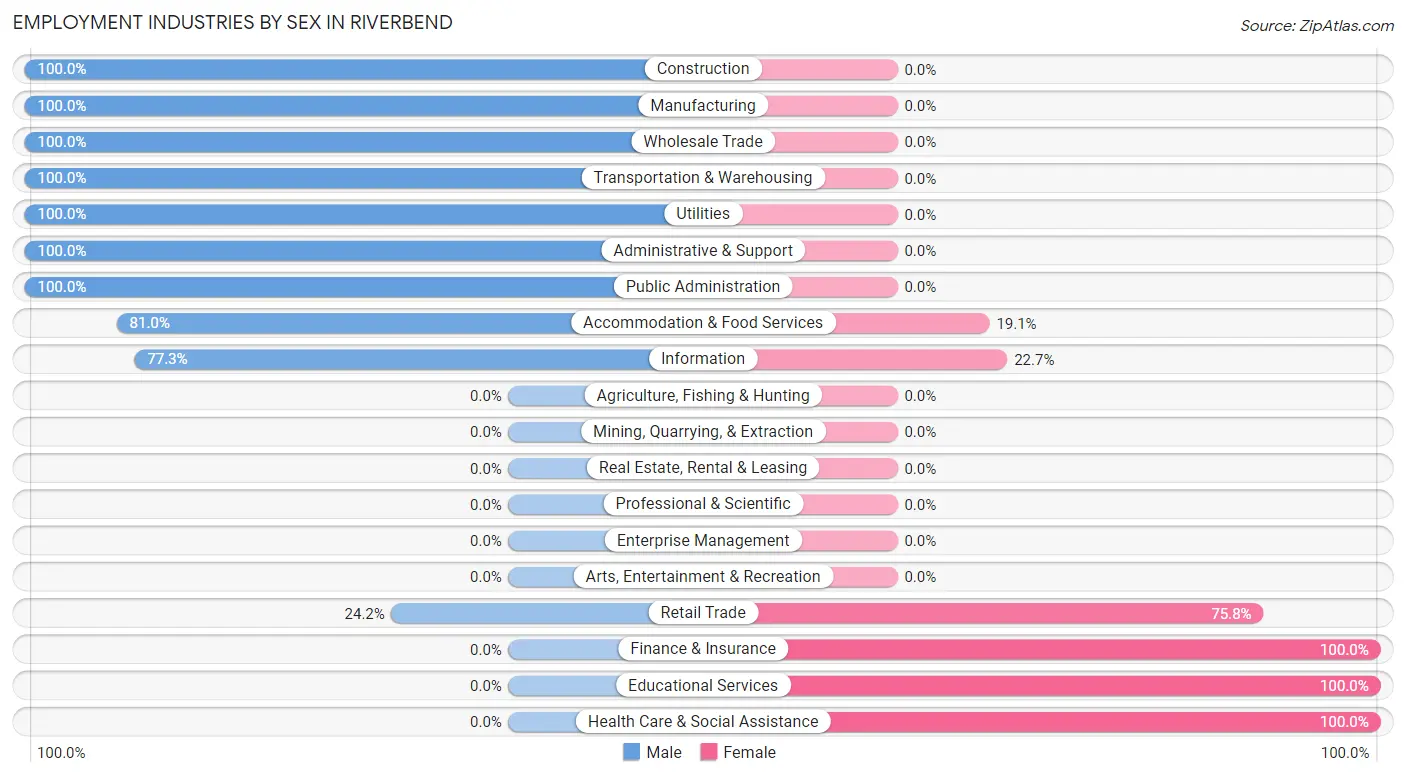
| Industry | Male | Female |
| Agriculture, Fishing & Hunting | 0 (0.0%) | 0 (0.0%) |
| Mining, Quarrying, & Extraction | 0 (0.0%) | 0 (0.0%) |
| Construction | 15 (100.0%) | 0 (0.0%) |
| Manufacturing | 4 (100.0%) | 0 (0.0%) |
| Wholesale Trade | 16 (100.0%) | 0 (0.0%) |
| Retail Trade | 8 (24.2%) | 25 (75.8%) |
| Transportation & Warehousing | 13 (100.0%) | 0 (0.0%) |
| Utilities | 7 (100.0%) | 0 (0.0%) |
| Information | 17 (77.3%) | 5 (22.7%) |
| Finance & Insurance | 0 (0.0%) | 12 (100.0%) |
| Real Estate, Rental & Leasing | 0 (0.0%) | 0 (0.0%) |
| Professional & Scientific | 0 (0.0%) | 0 (0.0%) |
| Enterprise Management | 0 (0.0%) | 0 (0.0%) |
| Administrative & Support | 4 (100.0%) | 0 (0.0%) |
| Educational Services | 0 (0.0%) | 14 (100.0%) |
| Health Care & Social Assistance | 0 (0.0%) | 19 (100.0%) |
| Arts, Entertainment & Recreation | 0 (0.0%) | 0 (0.0%) |
| Accommodation & Food Services | 17 (80.9%) | 4 (19.1%) |
| Public Administration | 11 (100.0%) | 0 (0.0%) |
| Total | 119 (60.1%) | 79 (39.9%) |
Education in Riverbend
School Enrollment in Riverbend
The most common levels of schooling among the 67 students in Riverbend are high school (57 | 85.1%), and middle school (10 | 14.9%).
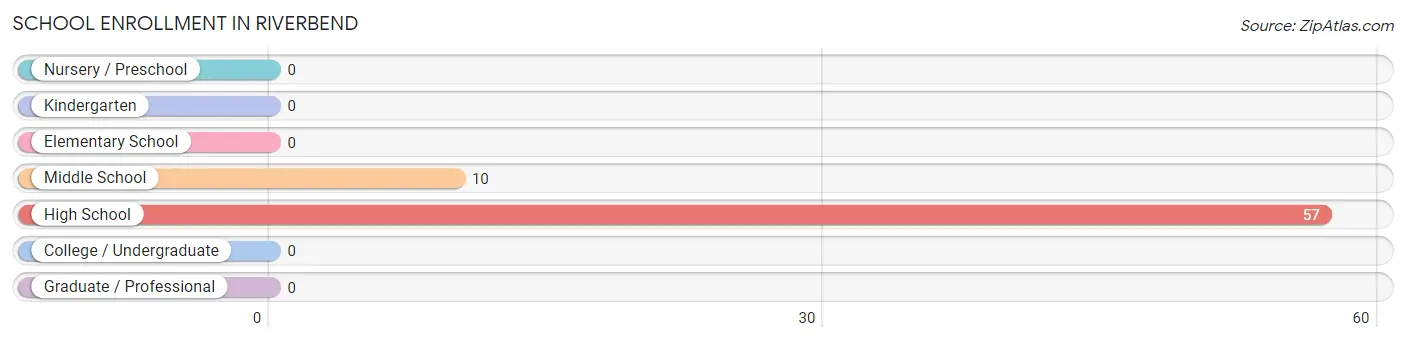
| School Level | # Students | % Students |
| Nursery / Preschool | 0 | 0.0% |
| Kindergarten | 0 | 0.0% |
| Elementary School | 0 | 0.0% |
| Middle School | 10 | 14.9% |
| High School | 57 | 85.1% |
| College / Undergraduate | 0 | 0.0% |
| Graduate / Professional | 0 | 0.0% |
| Total | 67 | 100.0% |
School Enrollment by Age by Funding Source in Riverbend
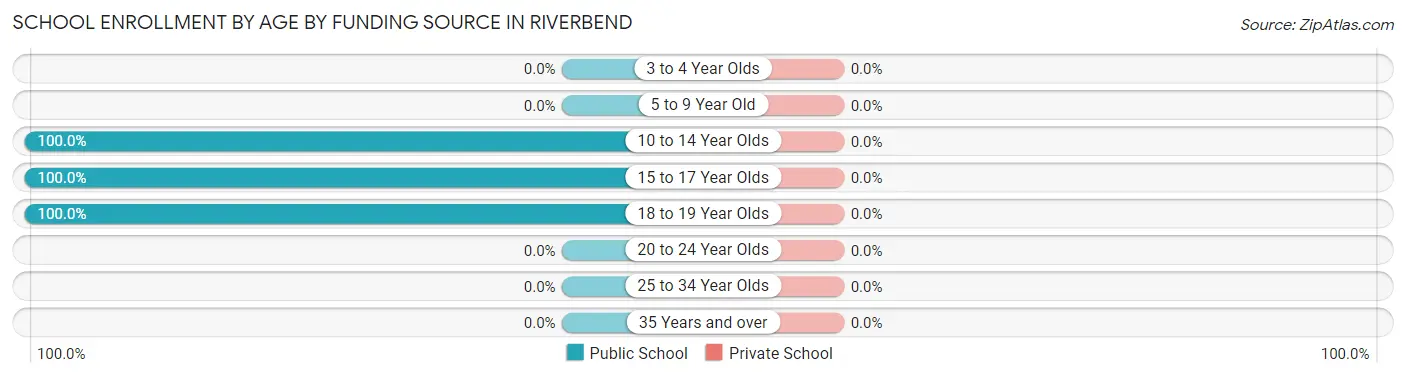
| Age Bracket | Public School | Private School |
| 3 to 4 Year Olds | 0 (0.0%) | 0 (0.0%) |
| 5 to 9 Year Old | 0 (0.0%) | 0 (0.0%) |
| 10 to 14 Year Olds | 9 (100.0%) | 0 (0.0%) |
| 15 to 17 Year Olds | 37 (100.0%) | 0 (0.0%) |
| 18 to 19 Year Olds | 21 (100.0%) | 0 (0.0%) |
| 20 to 24 Year Olds | 0 (0.0%) | 0 (0.0%) |
| 25 to 34 Year Olds | 0 (0.0%) | 0 (0.0%) |
| 35 Years and over | 0 (0.0%) | 0 (0.0%) |
| Total | 67 (100.0%) | 0 (0.0%) |
Educational Attainment by Field of Study in Riverbend
Education (18 | 33.3%), visual & performing arts (15 | 27.8%), computers & mathematics (14 | 25.9%), and science & technology (7 | 13.0%) are the most common fields of study among 54 individuals in Riverbend who have obtained a bachelor's degree or higher.
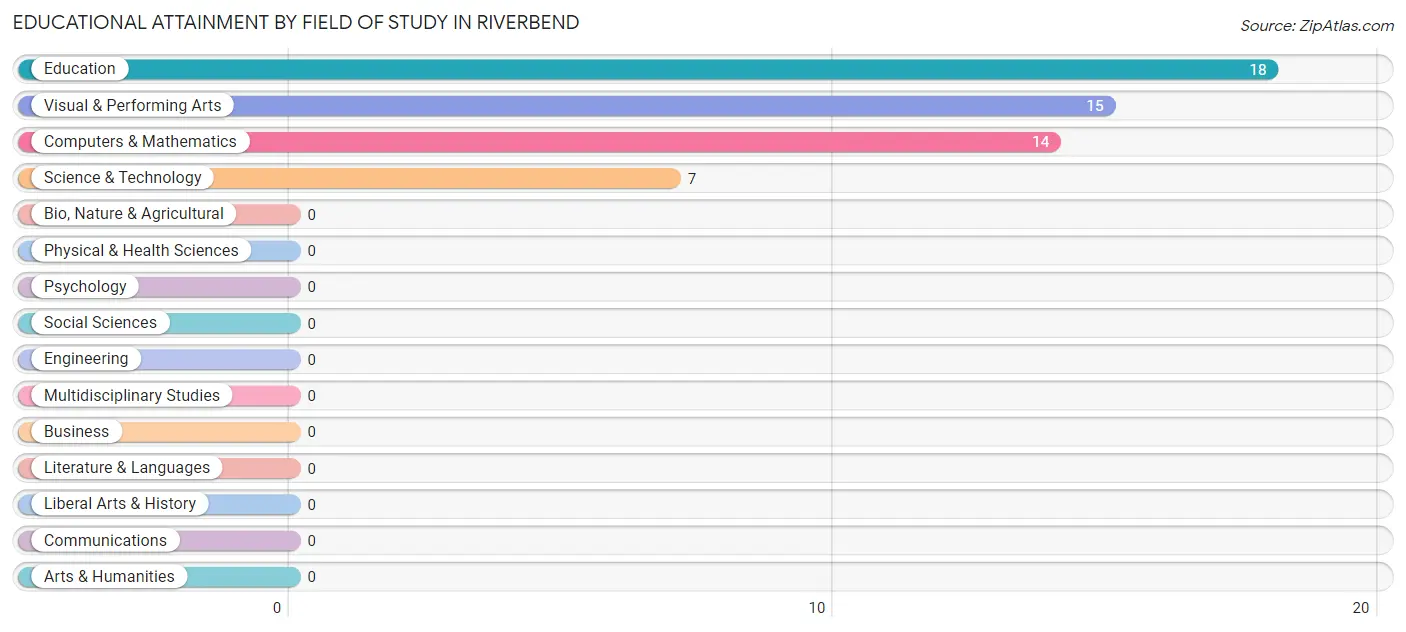
| Field of Study | # Graduates | % Graduates |
| Computers & Mathematics | 14 | 25.9% |
| Bio, Nature & Agricultural | 0 | 0.0% |
| Physical & Health Sciences | 0 | 0.0% |
| Psychology | 0 | 0.0% |
| Social Sciences | 0 | 0.0% |
| Engineering | 0 | 0.0% |
| Multidisciplinary Studies | 0 | 0.0% |
| Science & Technology | 7 | 13.0% |
| Business | 0 | 0.0% |
| Education | 18 | 33.3% |
| Literature & Languages | 0 | 0.0% |
| Liberal Arts & History | 0 | 0.0% |
| Visual & Performing Arts | 15 | 27.8% |
| Communications | 0 | 0.0% |
| Arts & Humanities | 0 | 0.0% |
| Total | 54 | 100.0% |
Transportation & Commute in Riverbend
Vehicle Availability by Sex in Riverbend
The most prevalent vehicle ownership categories in Riverbend are males with 2 vehicles (76, accounting for 72.4%) and females with 2 vehicles (51, making up 96.2%).
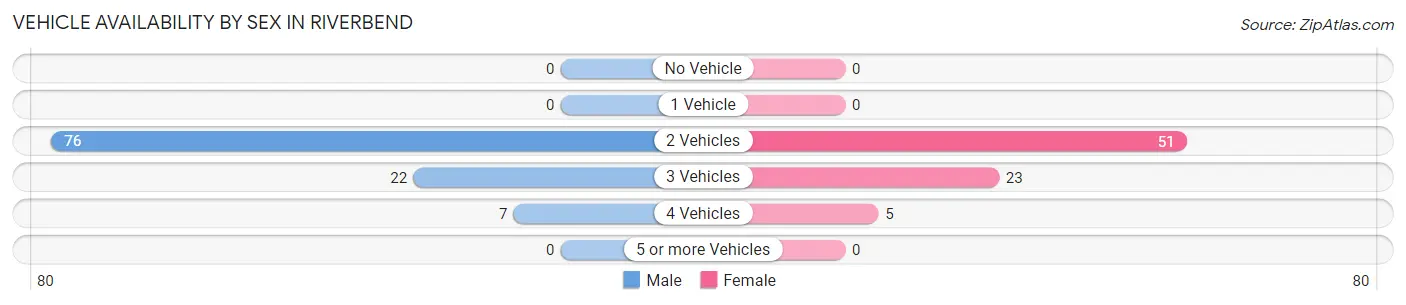
| Vehicles Available | Male | Female |
| No Vehicle | 0 (0.0%) | 0 (0.0%) |
| 1 Vehicle | 0 (0.0%) | 0 (0.0%) |
| 2 Vehicles | 76 (72.4%) | 51 (64.6%) |
| 3 Vehicles | 22 (20.9%) | 23 (29.1%) |
| 4 Vehicles | 7 (6.7%) | 5 (6.3%) |
| 5 or more Vehicles | 0 (0.0%) | 0 (0.0%) |
| Total | 105 (100.0%) | 79 (100.0%) |
Commute Time in Riverbend
The most frequently occuring commute durations in Riverbend are 20 to 24 minutes (45 commuters, 26.8%), 10 to 14 minutes (30 commuters, 17.9%), and 45 to 59 minutes (29 commuters, 17.3%).
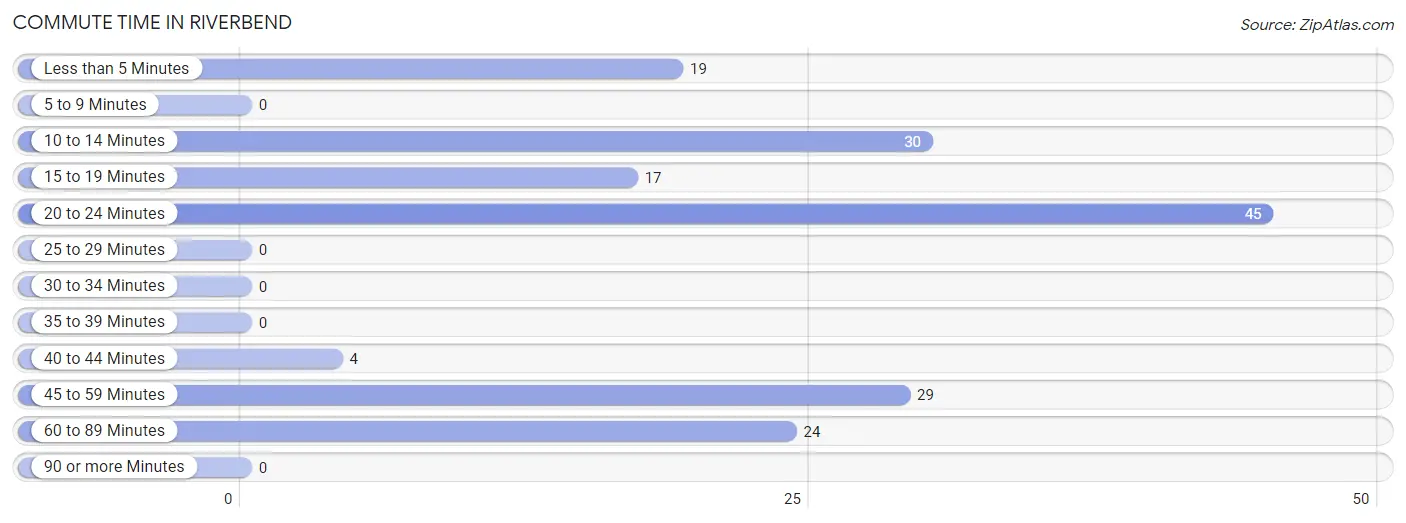
| Commute Time | # Commuters | % Commuters |
| Less than 5 Minutes | 19 | 11.3% |
| 5 to 9 Minutes | 0 | 0.0% |
| 10 to 14 Minutes | 30 | 17.9% |
| 15 to 19 Minutes | 17 | 10.1% |
| 20 to 24 Minutes | 45 | 26.8% |
| 25 to 29 Minutes | 0 | 0.0% |
| 30 to 34 Minutes | 0 | 0.0% |
| 35 to 39 Minutes | 0 | 0.0% |
| 40 to 44 Minutes | 4 | 2.4% |
| 45 to 59 Minutes | 29 | 17.3% |
| 60 to 89 Minutes | 24 | 14.3% |
| 90 or more Minutes | 0 | 0.0% |
Commute Time by Sex in Riverbend
The most common commute times in Riverbend are 20 to 24 minutes (26 commuters, 29.2%) for males and 20 to 24 minutes (19 commuters, 24.0%) for females.
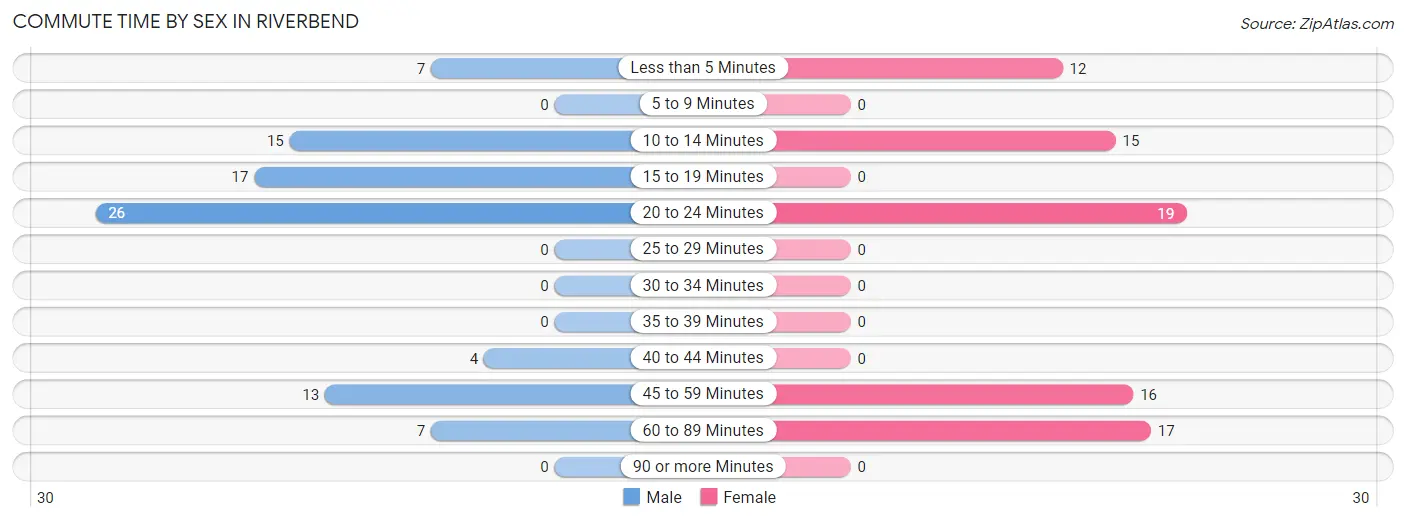
| Commute Time | Male | Female |
| Less than 5 Minutes | 7 (7.9%) | 12 (15.2%) |
| 5 to 9 Minutes | 0 (0.0%) | 0 (0.0%) |
| 10 to 14 Minutes | 15 (16.9%) | 15 (19.0%) |
| 15 to 19 Minutes | 17 (19.1%) | 0 (0.0%) |
| 20 to 24 Minutes | 26 (29.2%) | 19 (24.0%) |
| 25 to 29 Minutes | 0 (0.0%) | 0 (0.0%) |
| 30 to 34 Minutes | 0 (0.0%) | 0 (0.0%) |
| 35 to 39 Minutes | 0 (0.0%) | 0 (0.0%) |
| 40 to 44 Minutes | 4 (4.5%) | 0 (0.0%) |
| 45 to 59 Minutes | 13 (14.6%) | 16 (20.3%) |
| 60 to 89 Minutes | 7 (7.9%) | 17 (21.5%) |
| 90 or more Minutes | 0 (0.0%) | 0 (0.0%) |
Time of Departure to Work by Sex in Riverbend
The most frequent times of departure to work in Riverbend are 5:30 AM to 5:59 AM (22, 24.7%) for males and 5:30 AM to 5:59 AM (36, 45.6%) for females.
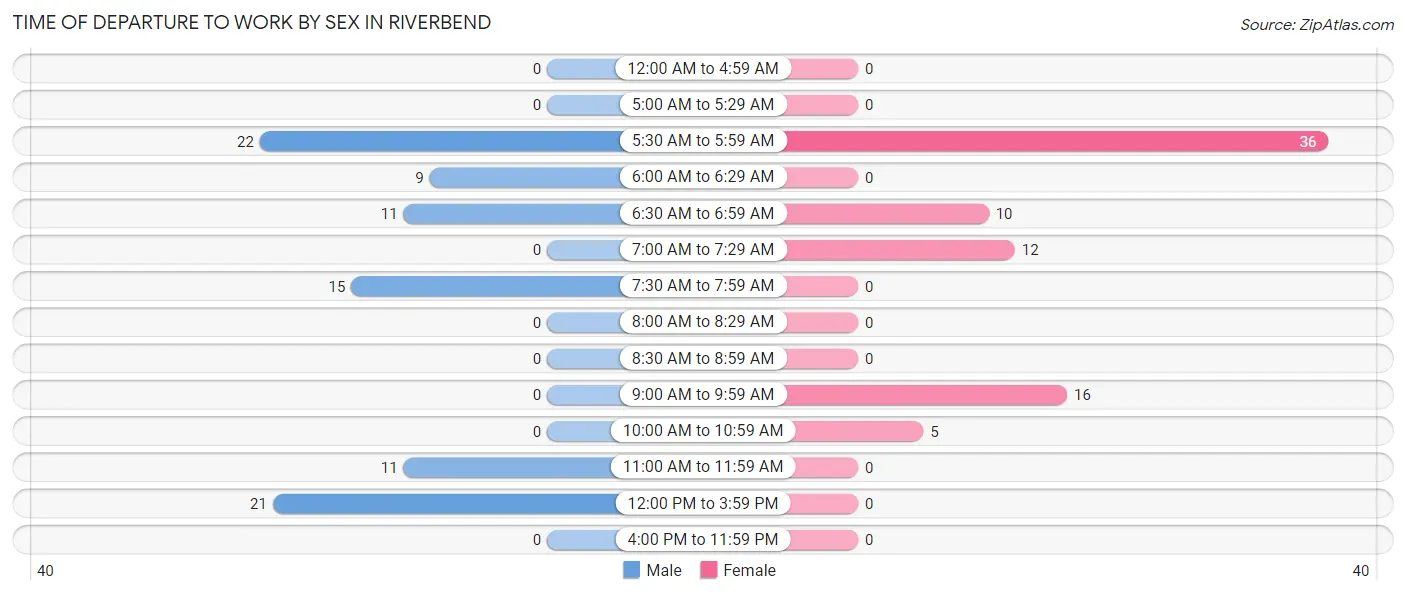
| Time of Departure | Male | Female |
| 12:00 AM to 4:59 AM | 0 (0.0%) | 0 (0.0%) |
| 5:00 AM to 5:29 AM | 0 (0.0%) | 0 (0.0%) |
| 5:30 AM to 5:59 AM | 22 (24.7%) | 36 (45.6%) |
| 6:00 AM to 6:29 AM | 9 (10.1%) | 0 (0.0%) |
| 6:30 AM to 6:59 AM | 11 (12.4%) | 10 (12.7%) |
| 7:00 AM to 7:29 AM | 0 (0.0%) | 12 (15.2%) |
| 7:30 AM to 7:59 AM | 15 (16.9%) | 0 (0.0%) |
| 8:00 AM to 8:29 AM | 0 (0.0%) | 0 (0.0%) |
| 8:30 AM to 8:59 AM | 0 (0.0%) | 0 (0.0%) |
| 9:00 AM to 9:59 AM | 0 (0.0%) | 16 (20.3%) |
| 10:00 AM to 10:59 AM | 0 (0.0%) | 5 (6.3%) |
| 11:00 AM to 11:59 AM | 11 (12.4%) | 0 (0.0%) |
| 12:00 PM to 3:59 PM | 21 (23.6%) | 0 (0.0%) |
| 4:00 PM to 11:59 PM | 0 (0.0%) | 0 (0.0%) |
| Total | 89 (100.0%) | 79 (100.0%) |
Housing Occupancy in Riverbend
Occupancy by Ownership in Riverbend
Of the total 138 dwellings in Riverbend, owner-occupied units account for 110 (79.7%), while renter-occupied units make up 28 (20.3%).
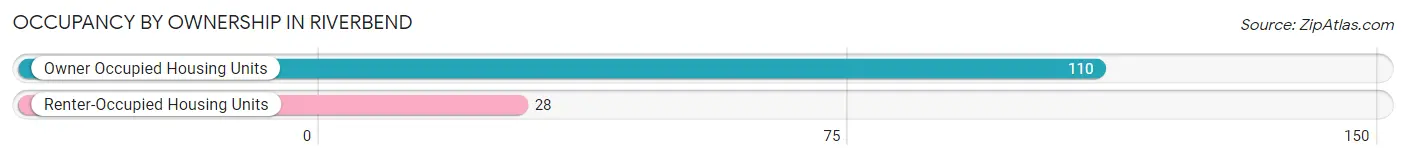
| Occupancy | # Housing Units | % Housing Units |
| Owner Occupied Housing Units | 110 | 79.7% |
| Renter-Occupied Housing Units | 28 | 20.3% |
| Total Occupied Housing Units | 138 | 100.0% |
Occupancy by Household Size in Riverbend
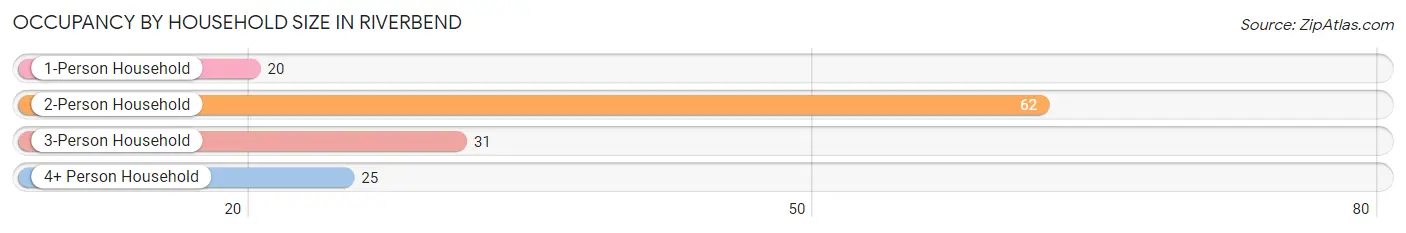
| Household Size | # Housing Units | % Housing Units |
| 1-Person Household | 20 | 14.5% |
| 2-Person Household | 62 | 44.9% |
| 3-Person Household | 31 | 22.5% |
| 4+ Person Household | 25 | 18.1% |
| Total Housing Units | 138 | 100.0% |
Occupancy by Ownership by Household Size in Riverbend
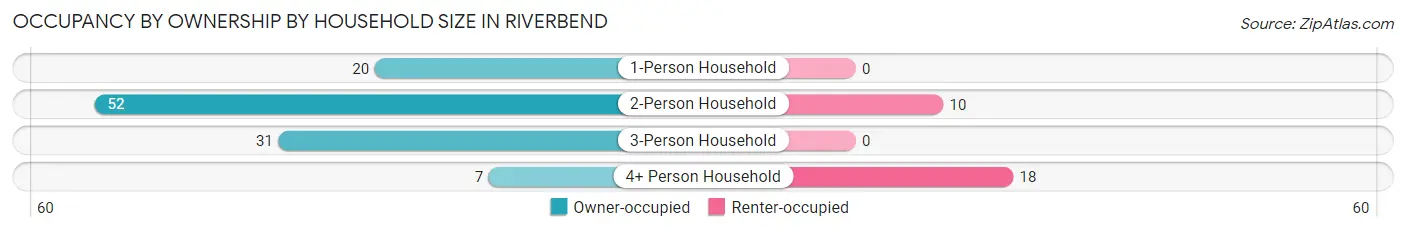
| Household Size | Owner-occupied | Renter-occupied |
| 1-Person Household | 20 (100.0%) | 0 (0.0%) |
| 2-Person Household | 52 (83.9%) | 10 (16.1%) |
| 3-Person Household | 31 (100.0%) | 0 (0.0%) |
| 4+ Person Household | 7 (28.0%) | 18 (72.0%) |
| Total Housing Units | 110 (79.7%) | 28 (20.3%) |
Occupancy by Educational Attainment in Riverbend
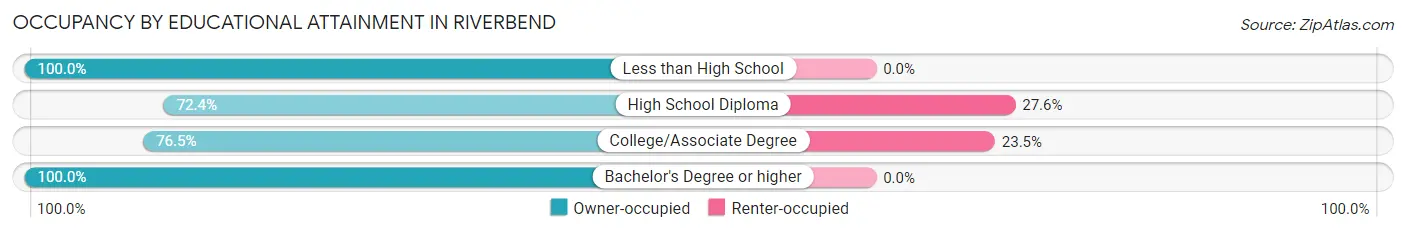
| Household Size | Owner-occupied | Renter-occupied |
| Less than High School | 4 (100.0%) | 0 (0.0%) |
| High School Diploma | 42 (72.4%) | 16 (27.6%) |
| College/Associate Degree | 39 (76.5%) | 12 (23.5%) |
| Bachelor's Degree or higher | 25 (100.0%) | 0 (0.0%) |
Occupancy by Age of Householder in Riverbend
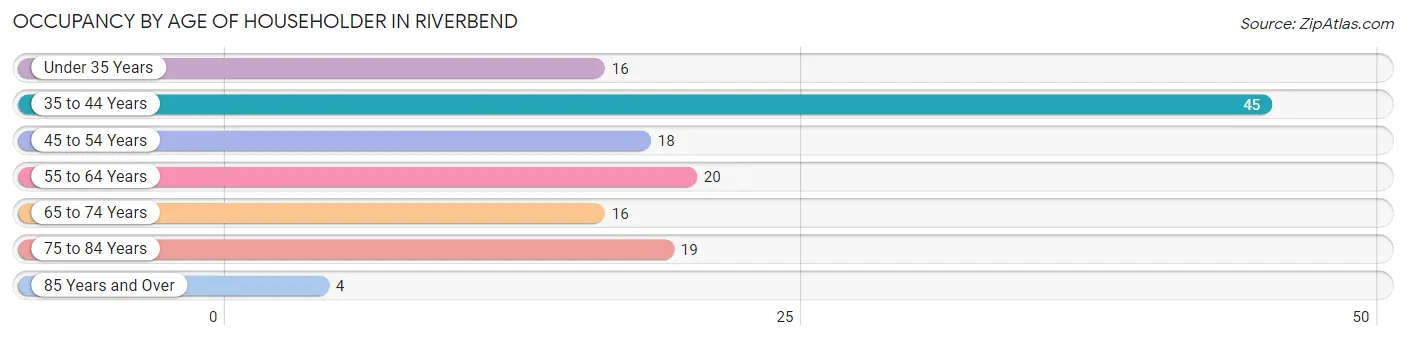
| Age Bracket | # Households | % Households |
| Under 35 Years | 16 | 11.6% |
| 35 to 44 Years | 45 | 32.6% |
| 45 to 54 Years | 18 | 13.0% |
| 55 to 64 Years | 20 | 14.5% |
| 65 to 74 Years | 16 | 11.6% |
| 75 to 84 Years | 19 | 13.8% |
| 85 Years and Over | 4 | 2.9% |
| Total | 138 | 100.0% |
Housing Finances in Riverbend
Median Income by Occupancy in Riverbend
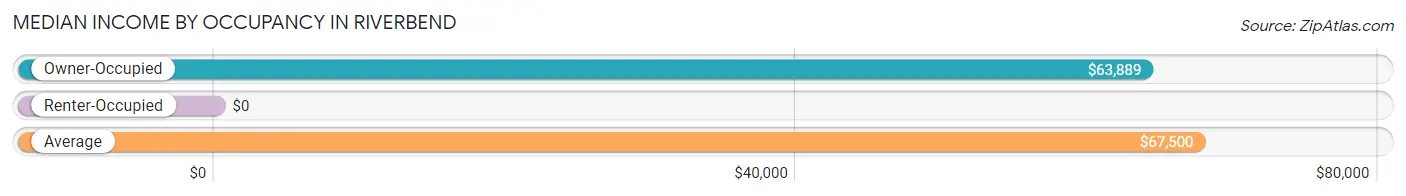
| Occupancy Type | # Households | Median Income |
| Owner-Occupied | 110 (79.7%) | $63,889 |
| Renter-Occupied | 28 (20.3%) | $0 |
| Average | 138 (100.0%) | $67,500 |
Occupancy by Householder Income Bracket in Riverbend
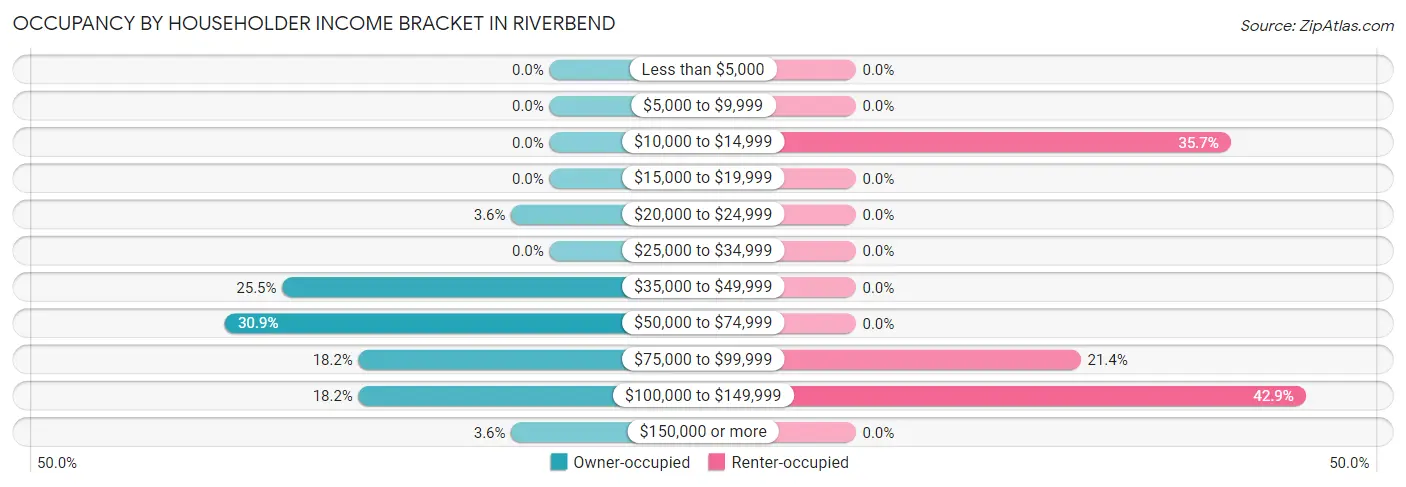
| Income Bracket | Owner-occupied | Renter-occupied |
| Less than $5,000 | 0 (0.0%) | 0 (0.0%) |
| $5,000 to $9,999 | 0 (0.0%) | 0 (0.0%) |
| $10,000 to $14,999 | 0 (0.0%) | 10 (35.7%) |
| $15,000 to $19,999 | 0 (0.0%) | 0 (0.0%) |
| $20,000 to $24,999 | 4 (3.6%) | 0 (0.0%) |
| $25,000 to $34,999 | 0 (0.0%) | 0 (0.0%) |
| $35,000 to $49,999 | 28 (25.5%) | 0 (0.0%) |
| $50,000 to $74,999 | 34 (30.9%) | 0 (0.0%) |
| $75,000 to $99,999 | 20 (18.2%) | 6 (21.4%) |
| $100,000 to $149,999 | 20 (18.2%) | 12 (42.9%) |
| $150,000 or more | 4 (3.6%) | 0 (0.0%) |
| Total | 110 (100.0%) | 28 (100.0%) |
Monthly Housing Cost Tiers in Riverbend
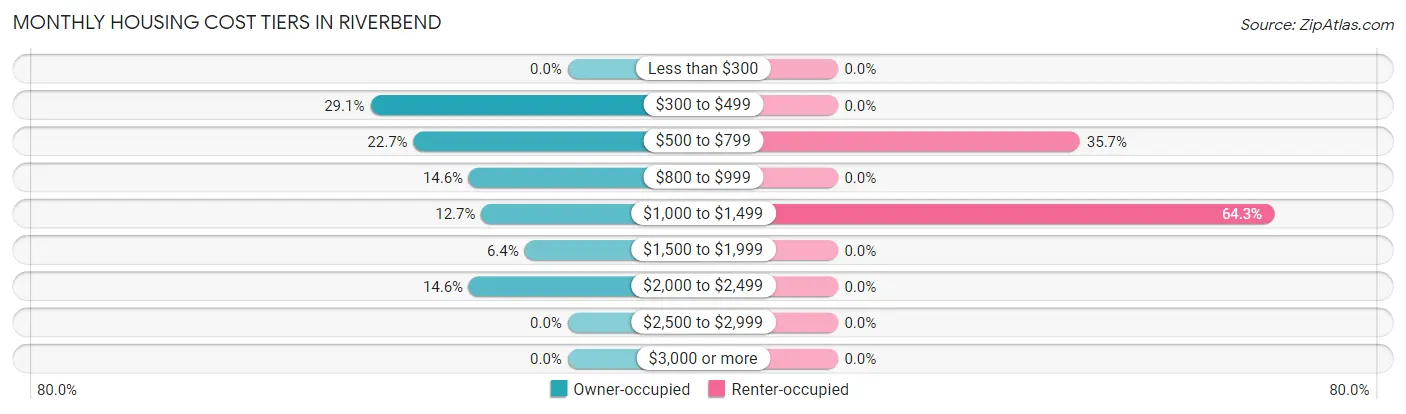
| Monthly Cost | Owner-occupied | Renter-occupied |
| Less than $300 | 0 (0.0%) | 0 (0.0%) |
| $300 to $499 | 32 (29.1%) | 0 (0.0%) |
| $500 to $799 | 25 (22.7%) | 10 (35.7%) |
| $800 to $999 | 16 (14.5%) | 0 (0.0%) |
| $1,000 to $1,499 | 14 (12.7%) | 18 (64.3%) |
| $1,500 to $1,999 | 7 (6.4%) | 0 (0.0%) |
| $2,000 to $2,499 | 16 (14.5%) | 0 (0.0%) |
| $2,500 to $2,999 | 0 (0.0%) | 0 (0.0%) |
| $3,000 or more | 0 (0.0%) | 0 (0.0%) |
| Total | 110 (100.0%) | 28 (100.0%) |
Physical Housing Characteristics in Riverbend
Housing Structures in Riverbend
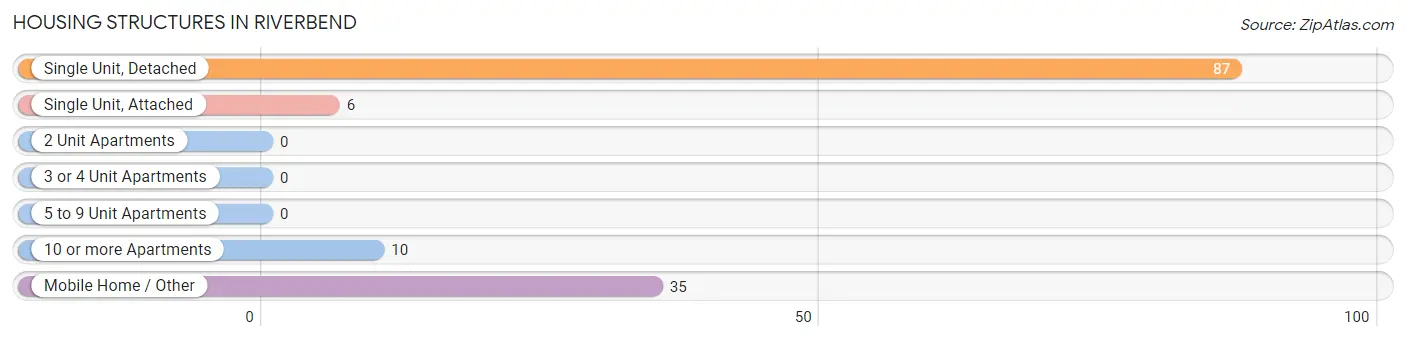
| Structure Type | # Housing Units | % Housing Units |
| Single Unit, Detached | 87 | 63.0% |
| Single Unit, Attached | 6 | 4.3% |
| 2 Unit Apartments | 0 | 0.0% |
| 3 or 4 Unit Apartments | 0 | 0.0% |
| 5 to 9 Unit Apartments | 0 | 0.0% |
| 10 or more Apartments | 10 | 7.2% |
| Mobile Home / Other | 35 | 25.4% |
| Total | 138 | 100.0% |
Housing Structures by Occupancy in Riverbend
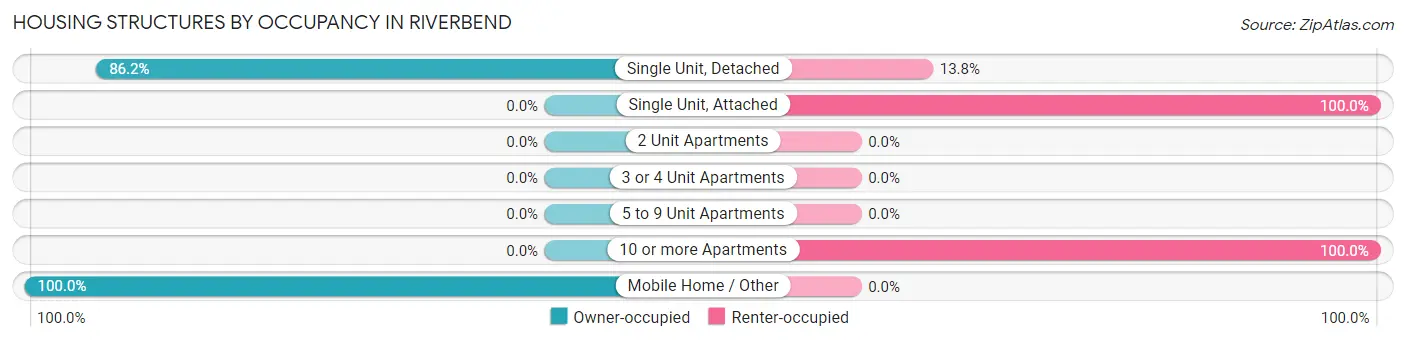
| Structure Type | Owner-occupied | Renter-occupied |
| Single Unit, Detached | 75 (86.2%) | 12 (13.8%) |
| Single Unit, Attached | 0 (0.0%) | 6 (100.0%) |
| 2 Unit Apartments | 0 (0.0%) | 0 (0.0%) |
| 3 or 4 Unit Apartments | 0 (0.0%) | 0 (0.0%) |
| 5 to 9 Unit Apartments | 0 (0.0%) | 0 (0.0%) |
| 10 or more Apartments | 0 (0.0%) | 10 (100.0%) |
| Mobile Home / Other | 35 (100.0%) | 0 (0.0%) |
| Total | 110 (79.7%) | 28 (20.3%) |
Housing Structures by Number of Rooms in Riverbend
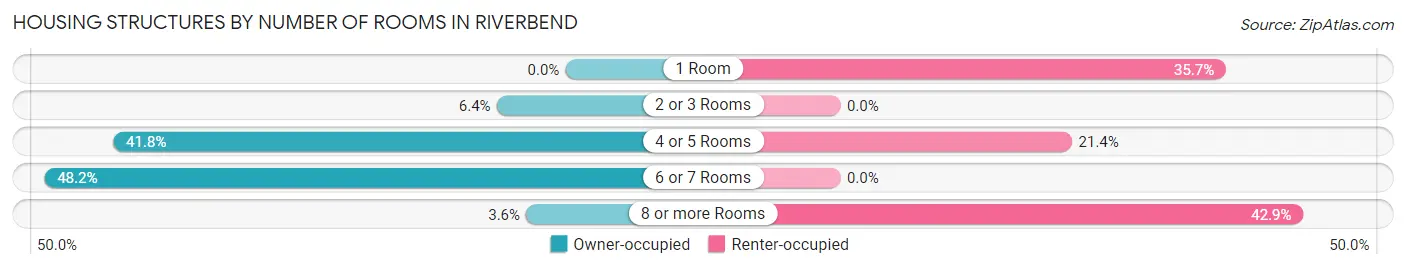
| Number of Rooms | Owner-occupied | Renter-occupied |
| 1 Room | 0 (0.0%) | 10 (35.7%) |
| 2 or 3 Rooms | 7 (6.4%) | 0 (0.0%) |
| 4 or 5 Rooms | 46 (41.8%) | 6 (21.4%) |
| 6 or 7 Rooms | 53 (48.2%) | 0 (0.0%) |
| 8 or more Rooms | 4 (3.6%) | 12 (42.9%) |
| Total | 110 (100.0%) | 28 (100.0%) |
Housing Structure by Heating Type in Riverbend
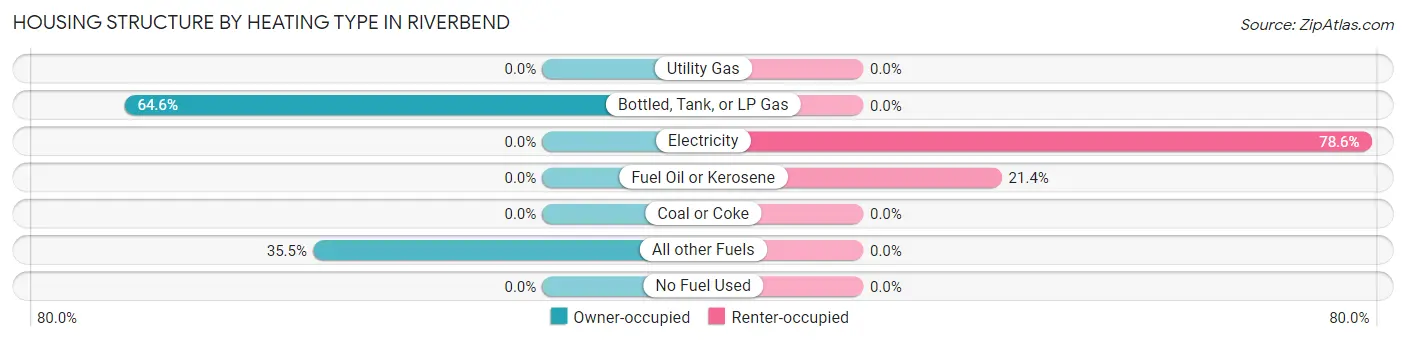
| Heating Type | Owner-occupied | Renter-occupied |
| Utility Gas | 0 (0.0%) | 0 (0.0%) |
| Bottled, Tank, or LP Gas | 71 (64.5%) | 0 (0.0%) |
| Electricity | 0 (0.0%) | 22 (78.6%) |
| Fuel Oil or Kerosene | 0 (0.0%) | 6 (21.4%) |
| Coal or Coke | 0 (0.0%) | 0 (0.0%) |
| All other Fuels | 39 (35.4%) | 0 (0.0%) |
| No Fuel Used | 0 (0.0%) | 0 (0.0%) |
| Total | 110 (100.0%) | 28 (100.0%) |
Household Vehicle Usage in Riverbend
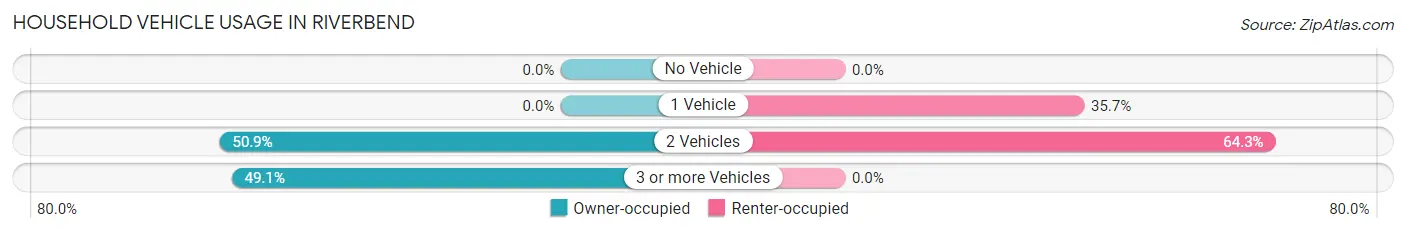
| Vehicles per Household | Owner-occupied | Renter-occupied |
| No Vehicle | 0 (0.0%) | 0 (0.0%) |
| 1 Vehicle | 0 (0.0%) | 10 (35.7%) |
| 2 Vehicles | 56 (50.9%) | 18 (64.3%) |
| 3 or more Vehicles | 54 (49.1%) | 0 (0.0%) |
| Total | 110 (100.0%) | 28 (100.0%) |
Real Estate & Mortgages in Riverbend
Real Estate and Mortgage Overview in Riverbend
| Characteristic | Without Mortgage | With Mortgage |
| Housing Units | 53 | 57 |
| Median Property Value | - | - |
| Median Household Income | $52,708 | $4 |
| Monthly Housing Costs | $480 | $0 |
| Real Estate Taxes | $2,309 | $4 |
Property Value by Mortgage Status in Riverbend
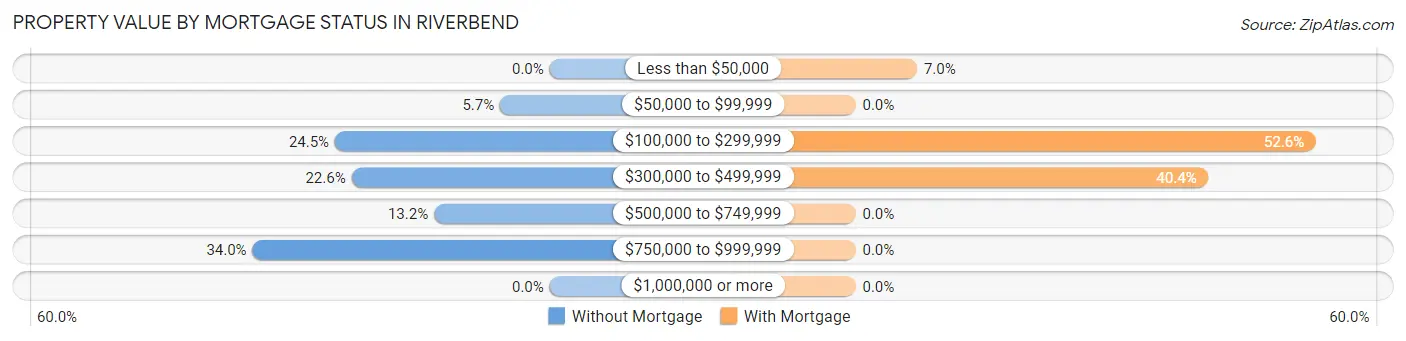
| Property Value | Without Mortgage | With Mortgage |
| Less than $50,000 | 0 (0.0%) | 4 (7.0%) |
| $50,000 to $99,999 | 3 (5.7%) | 0 (0.0%) |
| $100,000 to $299,999 | 13 (24.5%) | 30 (52.6%) |
| $300,000 to $499,999 | 12 (22.6%) | 23 (40.4%) |
| $500,000 to $749,999 | 7 (13.2%) | 0 (0.0%) |
| $750,000 to $999,999 | 18 (34.0%) | 0 (0.0%) |
| $1,000,000 or more | 0 (0.0%) | 0 (0.0%) |
| Total | 53 (100.0%) | 57 (100.0%) |
Household Income by Mortgage Status in Riverbend
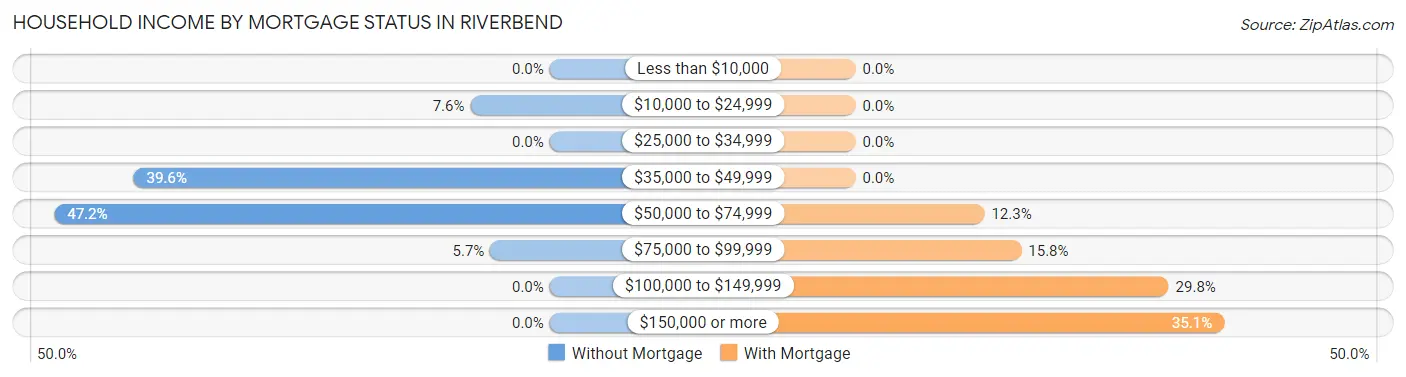
| Household Income | Without Mortgage | With Mortgage |
| Less than $10,000 | 0 (0.0%) | 0 (0.0%) |
| $10,000 to $24,999 | 4 (7.5%) | 0 (0.0%) |
| $25,000 to $34,999 | 0 (0.0%) | 0 (0.0%) |
| $35,000 to $49,999 | 21 (39.6%) | 0 (0.0%) |
| $50,000 to $74,999 | 25 (47.2%) | 7 (12.3%) |
| $75,000 to $99,999 | 3 (5.7%) | 9 (15.8%) |
| $100,000 to $149,999 | 0 (0.0%) | 17 (29.8%) |
| $150,000 or more | 0 (0.0%) | 20 (35.1%) |
| Total | 53 (100.0%) | 57 (100.0%) |
Property Value to Household Income Ratio in Riverbend
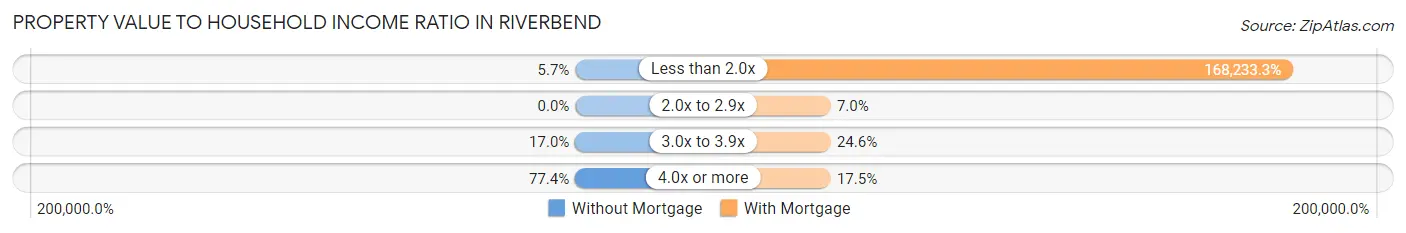
| Value-to-Income Ratio | Without Mortgage | With Mortgage |
| Less than 2.0x | 3 (5.7%) | 95,893 (168,233.3%) |
| 2.0x to 2.9x | 0 (0.0%) | 4 (7.0%) |
| 3.0x to 3.9x | 9 (17.0%) | 14 (24.6%) |
| 4.0x or more | 41 (77.4%) | 10 (17.5%) |
| Total | 53 (100.0%) | 57 (100.0%) |
Real Estate Taxes by Mortgage Status in Riverbend
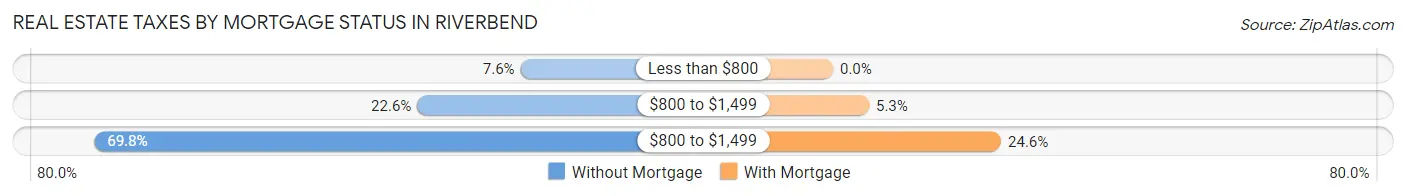
| Property Taxes | Without Mortgage | With Mortgage |
| Less than $800 | 4 (7.5%) | 0 (0.0%) |
| $800 to $1,499 | 12 (22.6%) | 3 (5.3%) |
| $800 to $1,499 | 37 (69.8%) | 14 (24.6%) |
| Total | 53 (100.0%) | 57 (100.0%) |
Health & Disability in Riverbend
Health Insurance Coverage by Age in Riverbend
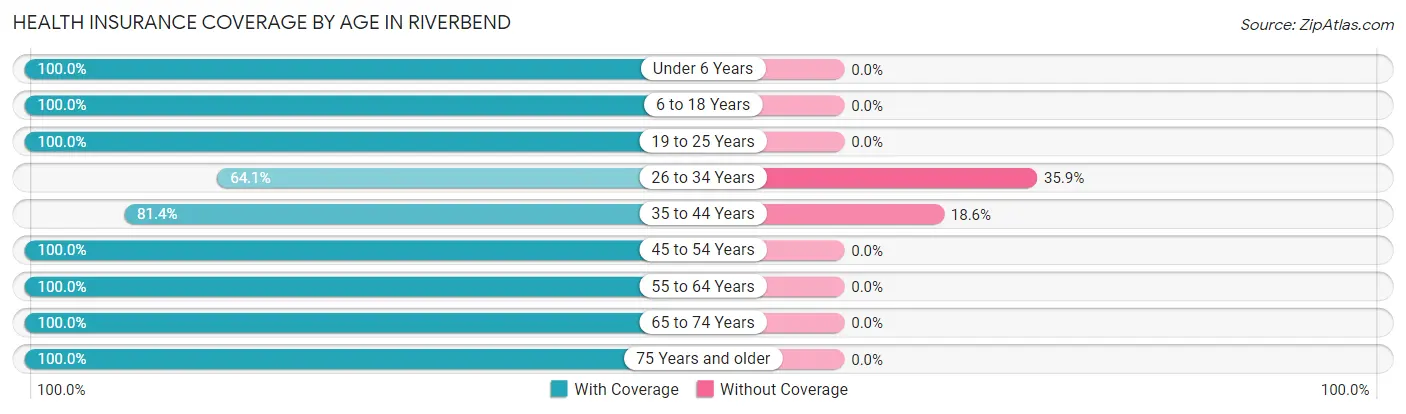
| Age Bracket | With Coverage | Without Coverage |
| Under 6 Years | 82 (100.0%) | 0 (0.0%) |
| 6 to 18 Years | 67 (100.0%) | 0 (0.0%) |
| 19 to 25 Years | 16 (100.0%) | 0 (0.0%) |
| 26 to 34 Years | 41 (64.1%) | 23 (35.9%) |
| 35 to 44 Years | 57 (81.4%) | 13 (18.6%) |
| 45 to 54 Years | 30 (100.0%) | 0 (0.0%) |
| 55 to 64 Years | 34 (100.0%) | 0 (0.0%) |
| 65 to 74 Years | 37 (100.0%) | 0 (0.0%) |
| 75 Years and older | 33 (100.0%) | 0 (0.0%) |
| Total | 397 (91.7%) | 36 (8.3%) |
Health Insurance Coverage by Citizenship Status in Riverbend
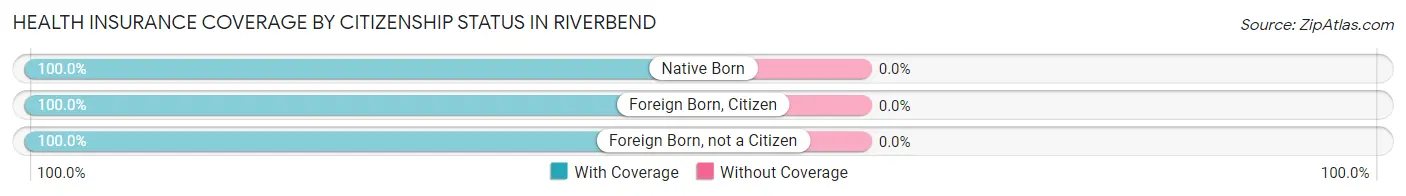
| Citizenship Status | With Coverage | Without Coverage |
| Native Born | 82 (100.0%) | 0 (0.0%) |
| Foreign Born, Citizen | 67 (100.0%) | 0 (0.0%) |
| Foreign Born, not a Citizen | 16 (100.0%) | 0 (0.0%) |
Health Insurance Coverage by Household Income in Riverbend
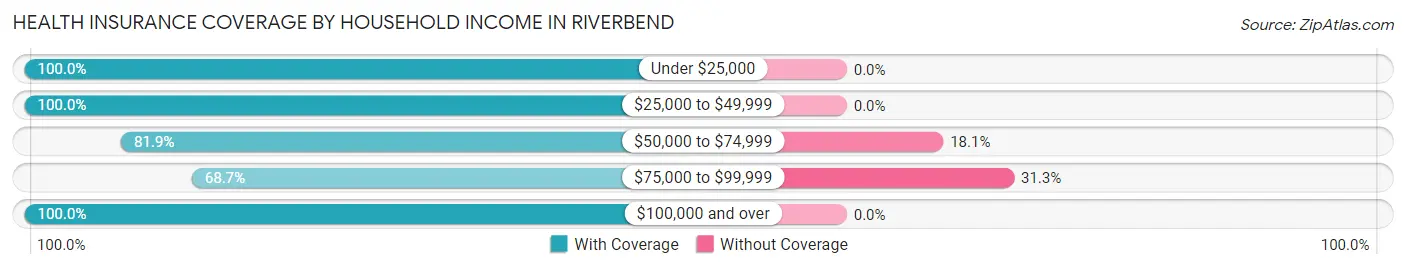
| Household Income | With Coverage | Without Coverage |
| Under $25,000 | 18 (100.0%) | 0 (0.0%) |
| $25,000 to $49,999 | 57 (100.0%) | 0 (0.0%) |
| $50,000 to $74,999 | 68 (81.9%) | 15 (18.1%) |
| $75,000 to $99,999 | 46 (68.7%) | 21 (31.3%) |
| $100,000 and over | 208 (100.0%) | 0 (0.0%) |
Public vs Private Health Insurance Coverage by Age in Riverbend
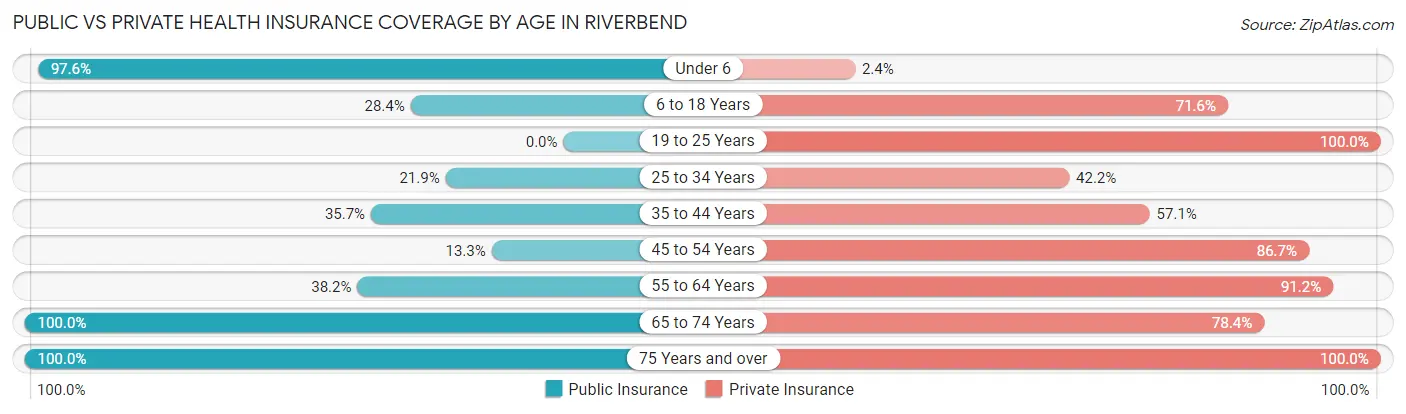
| Age Bracket | Public Insurance | Private Insurance |
| Under 6 | 80 (97.6%) | 2 (2.4%) |
| 6 to 18 Years | 19 (28.4%) | 48 (71.6%) |
| 19 to 25 Years | 0 (0.0%) | 16 (100.0%) |
| 25 to 34 Years | 14 (21.9%) | 27 (42.2%) |
| 35 to 44 Years | 25 (35.7%) | 40 (57.1%) |
| 45 to 54 Years | 4 (13.3%) | 26 (86.7%) |
| 55 to 64 Years | 13 (38.2%) | 31 (91.2%) |
| 65 to 74 Years | 37 (100.0%) | 29 (78.4%) |
| 75 Years and over | 33 (100.0%) | 33 (100.0%) |
| Total | 225 (52.0%) | 252 (58.2%) |
Disability Status by Sex by Age in Riverbend
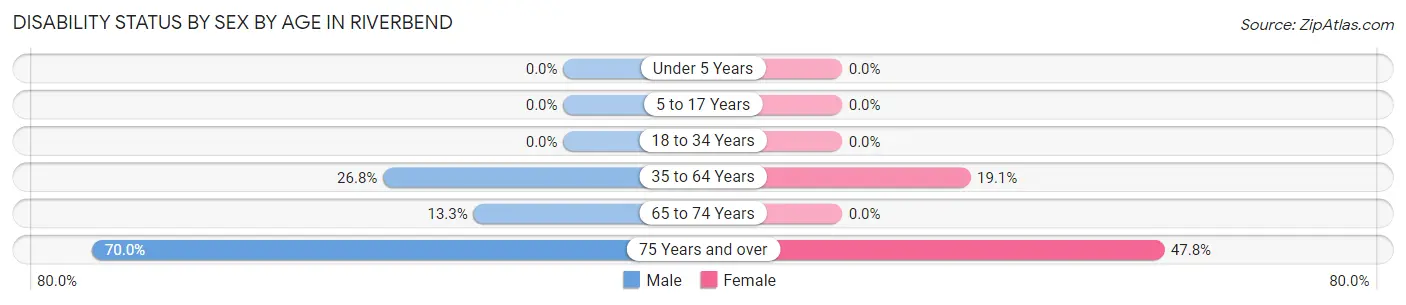
| Age Bracket | Male | Female |
| Under 5 Years | 0 (0.0%) | 0 (0.0%) |
| 5 to 17 Years | 0 (0.0%) | 0 (0.0%) |
| 18 to 34 Years | 0 (0.0%) | 0 (0.0%) |
| 35 to 64 Years | 19 (26.8%) | 12 (19.1%) |
| 65 to 74 Years | 4 (13.3%) | 0 (0.0%) |
| 75 Years and over | 7 (70.0%) | 11 (47.8%) |
Disability Class by Sex by Age in Riverbend
Disability Class: Hearing Difficulty
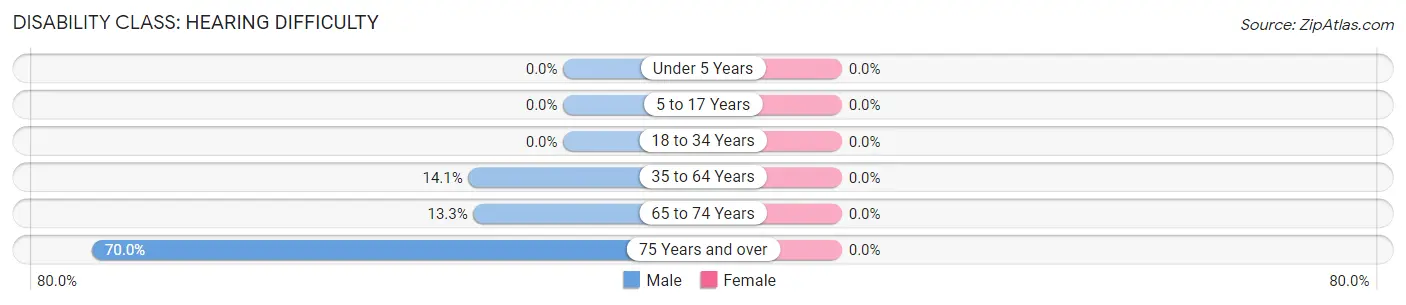
| Age Bracket | Male | Female |
| Under 5 Years | 0 (0.0%) | 0 (0.0%) |
| 5 to 17 Years | 0 (0.0%) | 0 (0.0%) |
| 18 to 34 Years | 0 (0.0%) | 0 (0.0%) |
| 35 to 64 Years | 10 (14.1%) | 0 (0.0%) |
| 65 to 74 Years | 4 (13.3%) | 0 (0.0%) |
| 75 Years and over | 7 (70.0%) | 0 (0.0%) |
Disability Class: Vision Difficulty
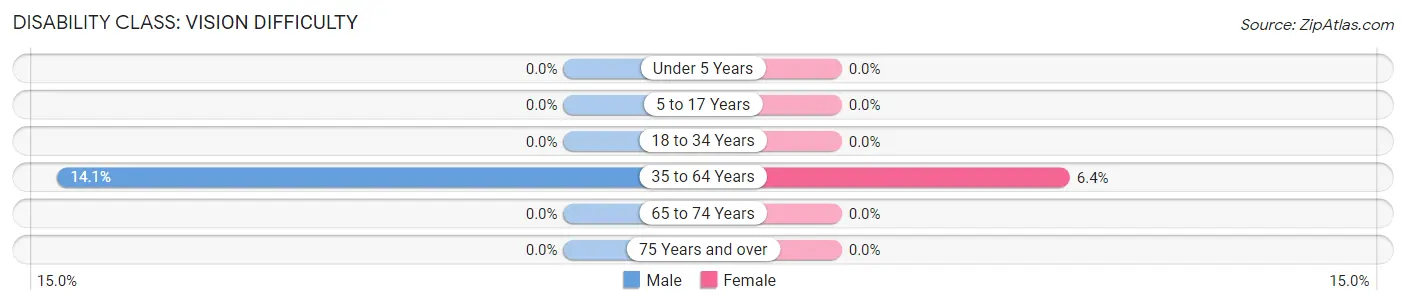
| Age Bracket | Male | Female |
| Under 5 Years | 0 (0.0%) | 0 (0.0%) |
| 5 to 17 Years | 0 (0.0%) | 0 (0.0%) |
| 18 to 34 Years | 0 (0.0%) | 0 (0.0%) |
| 35 to 64 Years | 10 (14.1%) | 4 (6.4%) |
| 65 to 74 Years | 0 (0.0%) | 0 (0.0%) |
| 75 Years and over | 0 (0.0%) | 0 (0.0%) |
Disability Class: Cognitive Difficulty
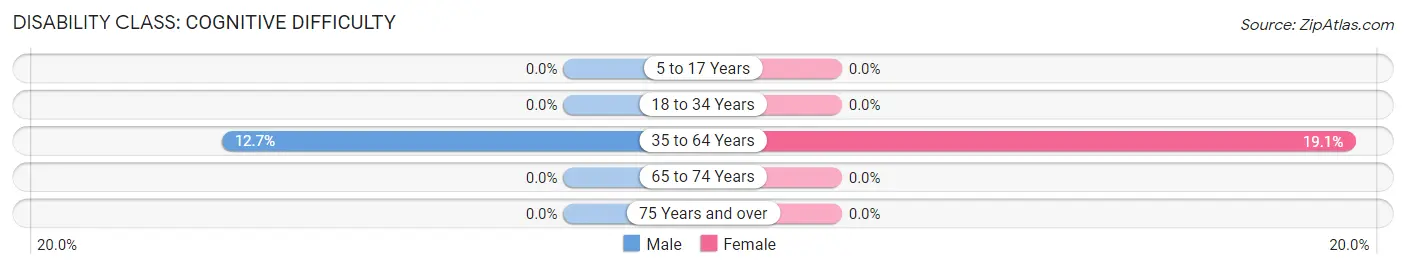
| Age Bracket | Male | Female |
| 5 to 17 Years | 0 (0.0%) | 0 (0.0%) |
| 18 to 34 Years | 0 (0.0%) | 0 (0.0%) |
| 35 to 64 Years | 9 (12.7%) | 12 (19.1%) |
| 65 to 74 Years | 0 (0.0%) | 0 (0.0%) |
| 75 Years and over | 0 (0.0%) | 0 (0.0%) |
Disability Class: Ambulatory Difficulty
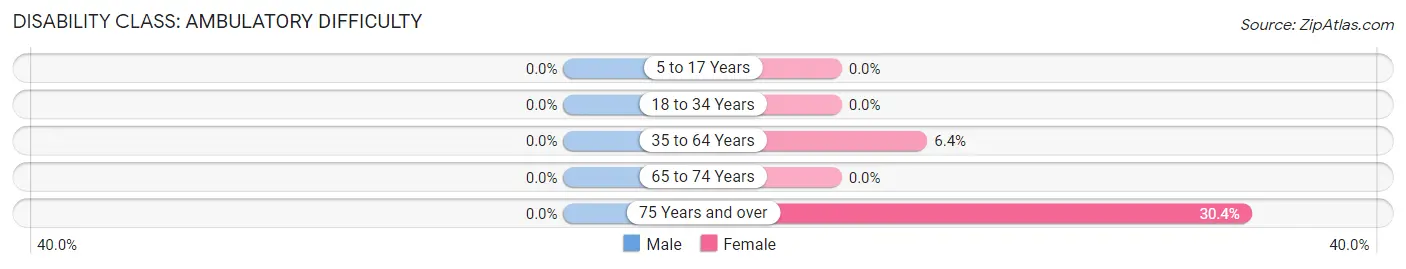
| Age Bracket | Male | Female |
| 5 to 17 Years | 0 (0.0%) | 0 (0.0%) |
| 18 to 34 Years | 0 (0.0%) | 0 (0.0%) |
| 35 to 64 Years | 0 (0.0%) | 4 (6.4%) |
| 65 to 74 Years | 0 (0.0%) | 0 (0.0%) |
| 75 Years and over | 0 (0.0%) | 7 (30.4%) |
Disability Class: Self-Care Difficulty
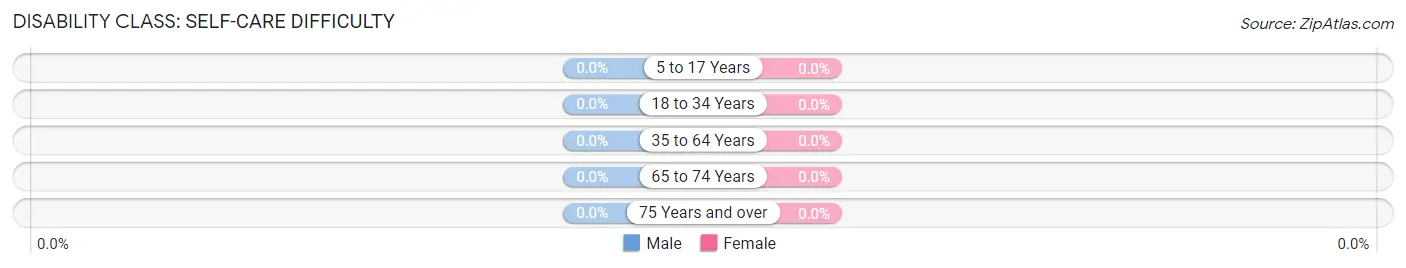
| Age Bracket | Male | Female |
| 5 to 17 Years | 0 (0.0%) | 0 (0.0%) |
| 18 to 34 Years | 0 (0.0%) | 0 (0.0%) |
| 35 to 64 Years | 0 (0.0%) | 0 (0.0%) |
| 65 to 74 Years | 0 (0.0%) | 0 (0.0%) |
| 75 Years and over | 0 (0.0%) | 0 (0.0%) |
Technology Access in Riverbend
Computing Device Access in Riverbend
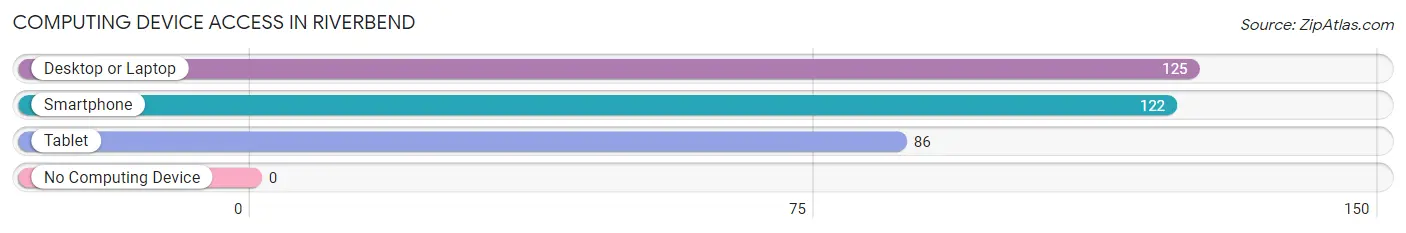
| Device Type | # Households | % Households |
| Desktop or Laptop | 125 | 90.6% |
| Smartphone | 122 | 88.4% |
| Tablet | 86 | 62.3% |
| No Computing Device | 0 | 0.0% |
| Total | 138 | 100.0% |
Internet Access in Riverbend
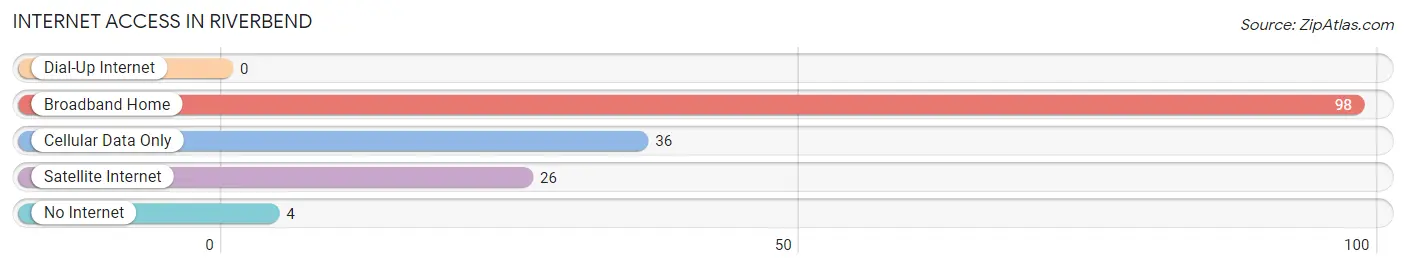
| Internet Type | # Households | % Households |
| Dial-Up Internet | 0 | 0.0% |
| Broadband Home | 98 | 71.0% |
| Cellular Data Only | 36 | 26.1% |
| Satellite Internet | 26 | 18.8% |
| No Internet | 4 | 2.9% |
| Total | 138 | 100.0% |
Riverbend Summary
Riverbend, Montana is a small town located in the western part of the state, near the Idaho border. It is situated in the Bitterroot Valley, a region of the Rocky Mountains known for its stunning beauty and abundant wildlife. The town is home to just over 1,000 people, and is the county seat of Ravalli County.
Riverbend has a rich history that dates back to the late 1800s. The town was founded in 1883 by a group of settlers who were looking for a place to settle and start a new life. The town was named after the nearby river, which was a popular spot for fishing and hunting. The settlers quickly established a thriving community, and the town grew rapidly. By the early 1900s, Riverbend had become a bustling center of commerce and industry, with a variety of businesses, including a sawmill, a flour mill, a blacksmith shop, and a general store.
The geography of Riverbend is dominated by the Bitterroot Mountains, which form a stunning backdrop to the town. The town is situated in a valley, surrounded by mountains on all sides. The nearby river provides a source of water for the town, and the surrounding area is home to a variety of wildlife, including deer, elk, and bighorn sheep.
The economy of Riverbend is largely based on agriculture and tourism. The town is home to several farms, which produce a variety of crops, including wheat, barley, and hay. The nearby mountains provide a popular destination for hikers, campers, and other outdoor enthusiasts. The town also has a number of small businesses, including restaurants, shops, and a movie theater.
The demographics of Riverbend are largely white, with a small percentage of Native American and Hispanic residents. The median household income is around $40,000, and the median age is around 40. The town is home to a variety of churches, including Catholic, Lutheran, and Methodist.
Riverbend is a small town with a rich history and a beautiful natural setting. It is a great place to live, work, and raise a family. The town is home to a variety of businesses, and the surrounding area provides a variety of recreational activities. The town is a great place to visit, and is sure to provide a memorable experience for anyone who visits.
Common Questions
What is Per Capita Income in Riverbend?
Per Capita income in Riverbend is $24,236.
What is the Median Family Income in Riverbend?
Median Family Income in Riverbend is $70,714.
What is the Median Household income in Riverbend?
Median Household Income in Riverbend is $67,500.
What is Inequality or Gini Index in Riverbend?
Inequality or Gini Index in Riverbend is 0.28.
What is the Total Population of Riverbend?
Total Population of Riverbend is 433.
What is the Total Male Population of Riverbend?
Total Male Population of Riverbend is 273.
What is the Total Female Population of Riverbend?
Total Female Population of Riverbend is 160.
What is the Ratio of Males per 100 Females in Riverbend?
There are 170.62 Males per 100 Females in Riverbend.
What is the Ratio of Females per 100 Males in Riverbend?
There are 58.61 Females per 100 Males in Riverbend.
What is the Median Population Age in Riverbend?
Median Population Age in Riverbend is 33.7 Years.
What is the Average Family Size in Riverbend
Average Family Size in Riverbend is 2.6 People.
What is the Average Household Size in Riverbend
Average Household Size in Riverbend is 3.1 People.
How Large is the Labor Force in Riverbend?
There are 198 People in the Labor Forcein in Riverbend.
What is the Percentage of People in the Labor Force in Riverbend?
59.6% of People are in the Labor Force in Riverbend.