Amsterdam, MT Map & Demographics
Amsterdam Map
Amsterdam Overview
$34,971
PER CAPITA INCOME
$81,875
AVG FAMILY INCOME
$90,625
AVG HOUSEHOLD INCOME
52.4%
WAGE / INCOME GAP [ % ]
47.6¢/ $1
WAGE / INCOME GAP [ $ ]
0.37
INEQUALITY / GINI INDEX
160
TOTAL POPULATION
83
MALE POPULATION
77
FEMALE POPULATION
107.79
MALES / 100 FEMALES
92.77
FEMALES / 100 MALES
40.5
MEDIAN AGE
2.8
AVG FAMILY SIZE
3.1
AVG HOUSEHOLD SIZE
80
LABOR FORCE [ PEOPLE ]
66.7%
PERCENT IN LABOR FORCE
Income in Amsterdam
Income Overview in Amsterdam
Per Capita Income in Amsterdam is $34,971, while median incomes of families and households are $81,875 and $90,625 respectively.
| Characteristic | Number | Measure |
| Per Capita Income | 160 | $34,971 |
| Median Family Income | 48 | $81,875 |
| Mean Family Income | 48 | $100,450 |
| Median Household Income | 52 | $90,625 |
| Mean Household Income | 52 | $113,154 |
| Income Deficit | 48 | $0 |
| Wage / Income Gap (%) | 160 | 52.38% |
| Wage / Income Gap ($) | 160 | 47.62¢ per $1 |
| Gini / Inequality Index | 160 | 0.37 |
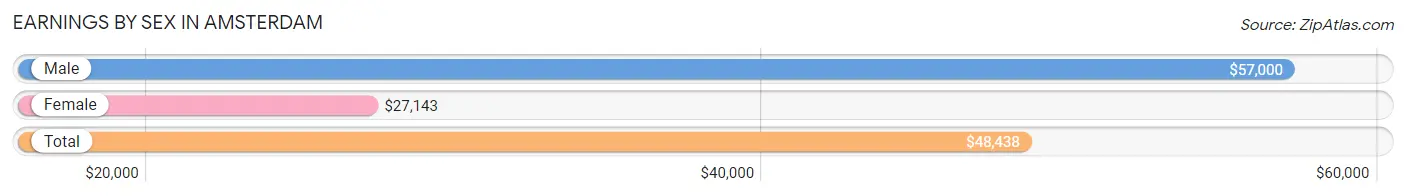
Earnings by Sex in Amsterdam
Average Earnings in Amsterdam are $48,438, $57,000 for men and $27,143 for women, a difference of 52.4%.
| Sex | Number | Average Earnings |
| Male | 48 (60.0%) | $57,000 |
| Female | 32 (40.0%) | $27,143 |
| Total | 80 (100.0%) | $48,438 |
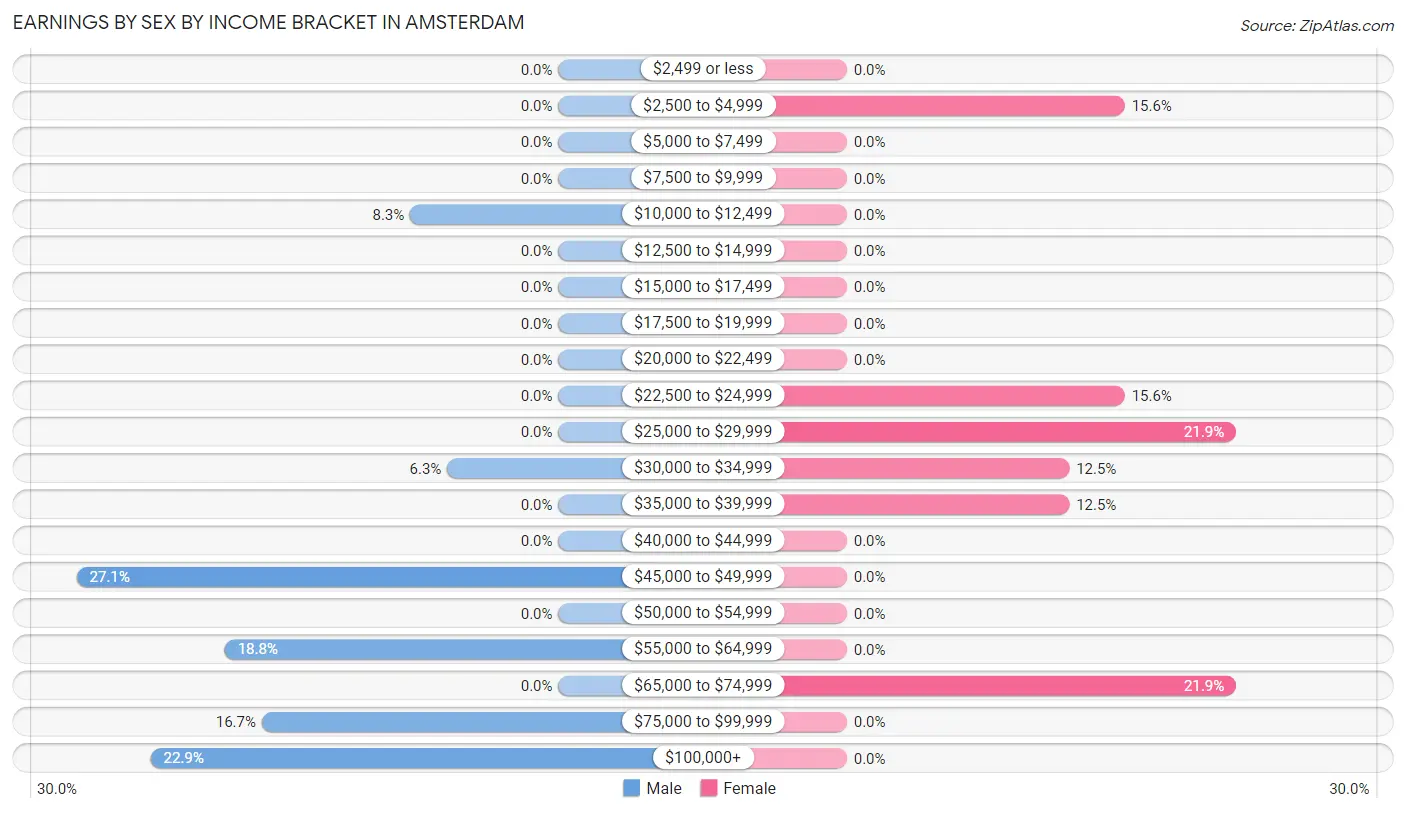
Earnings by Sex by Income Bracket in Amsterdam
The most common earnings brackets in Amsterdam are $45,000 to $49,999 for men (13 | 27.1%) and $25,000 to $29,999 for women (7 | 21.9%).
| Income | Male | Female |
| $2,499 or less | 0 (0.0%) | 0 (0.0%) |
| $2,500 to $4,999 | 0 (0.0%) | 5 (15.6%) |
| $5,000 to $7,499 | 0 (0.0%) | 0 (0.0%) |
| $7,500 to $9,999 | 0 (0.0%) | 0 (0.0%) |
| $10,000 to $12,499 | 4 (8.3%) | 0 (0.0%) |
| $12,500 to $14,999 | 0 (0.0%) | 0 (0.0%) |
| $15,000 to $17,499 | 0 (0.0%) | 0 (0.0%) |
| $17,500 to $19,999 | 0 (0.0%) | 0 (0.0%) |
| $20,000 to $22,499 | 0 (0.0%) | 0 (0.0%) |
| $22,500 to $24,999 | 0 (0.0%) | 5 (15.6%) |
| $25,000 to $29,999 | 0 (0.0%) | 7 (21.9%) |
| $30,000 to $34,999 | 3 (6.2%) | 4 (12.5%) |
| $35,000 to $39,999 | 0 (0.0%) | 4 (12.5%) |
| $40,000 to $44,999 | 0 (0.0%) | 0 (0.0%) |
| $45,000 to $49,999 | 13 (27.1%) | 0 (0.0%) |
| $50,000 to $54,999 | 0 (0.0%) | 0 (0.0%) |
| $55,000 to $64,999 | 9 (18.8%) | 0 (0.0%) |
| $65,000 to $74,999 | 0 (0.0%) | 7 (21.9%) |
| $75,000 to $99,999 | 8 (16.7%) | 0 (0.0%) |
| $100,000+ | 11 (22.9%) | 0 (0.0%) |
| Total | 48 (100.0%) | 32 (100.0%) |
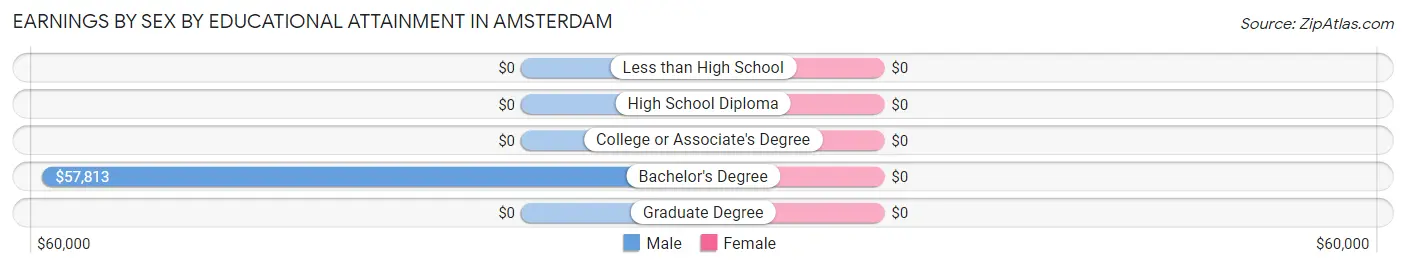
Earnings by Sex by Educational Attainment in Amsterdam
| Educational Attainment | Male Income | Female Income |
| Less than High School | - | - |
| High School Diploma | - | - |
| College or Associate's Degree | - | - |
| Bachelor's Degree | $57,813 | $0 |
| Graduate Degree | - | - |
| Total | $57,000 | $27,143 |
Family Income in Amsterdam
Family Income Brackets in Amsterdam
According to the Amsterdam family income data, there are 16 families falling into the $100,000 to $149,999 income range, which is the most common income bracket and makes up 33.3% of all families.
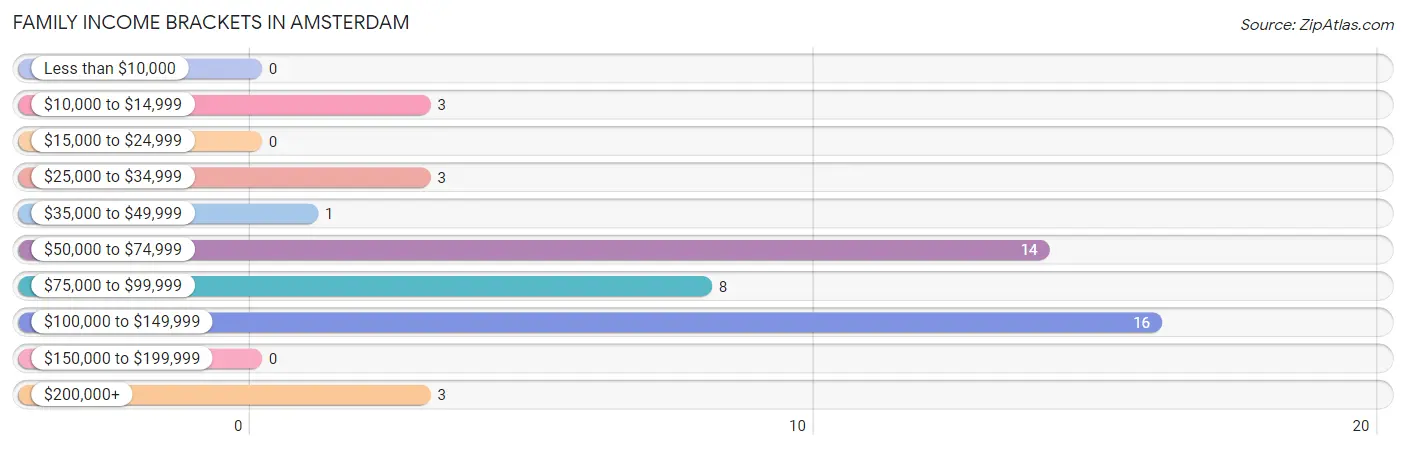
| Income Bracket | # Families | % Families |
| Less than $10,000 | 0 | 0.0% |
| $10,000 to $14,999 | 3 | 6.3% |
| $15,000 to $24,999 | 0 | 0.0% |
| $25,000 to $34,999 | 3 | 6.3% |
| $35,000 to $49,999 | 1 | 2.1% |
| $50,000 to $74,999 | 14 | 29.2% |
| $75,000 to $99,999 | 8 | 16.7% |
| $100,000 to $149,999 | 16 | 33.3% |
| $150,000 to $199,999 | 0 | 0.0% |
| $200,000+ | 3 | 6.3% |
Family Income by Famaliy Size in Amsterdam
2-person families (37 | 77.1%) account for the highest median family income in Amsterdam with $90,938 per family, while 2-person families (37 | 77.1%) have the highest median income of $45,469 per family member.
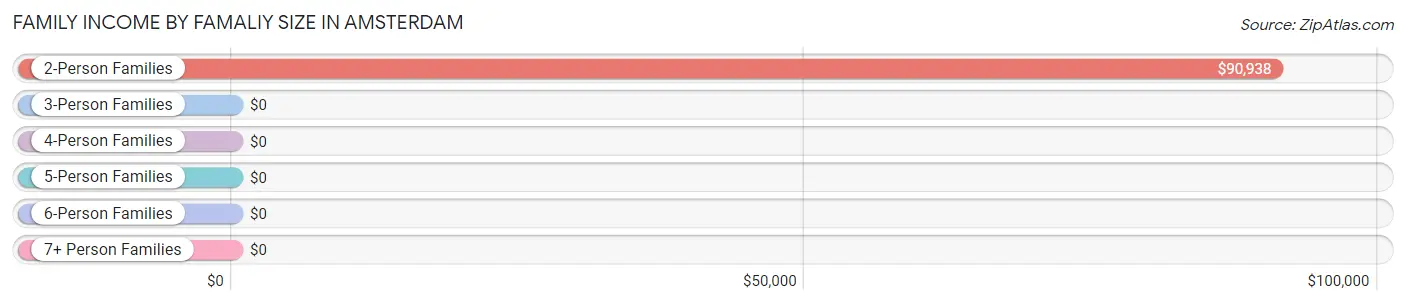
| Income Bracket | # Families | Median Income |
| 2-Person Families | 37 (77.1%) | $90,938 |
| 3-Person Families | 1 (2.1%) | $0 |
| 4-Person Families | 0 (0.0%) | $0 |
| 5-Person Families | 6 (12.5%) | $0 |
| 6-Person Families | 4 (8.3%) | $0 |
| 7+ Person Families | 0 (0.0%) | $0 |
| Total | 48 (100.0%) | $81,875 |
Family Income by Number of Earners in Amsterdam
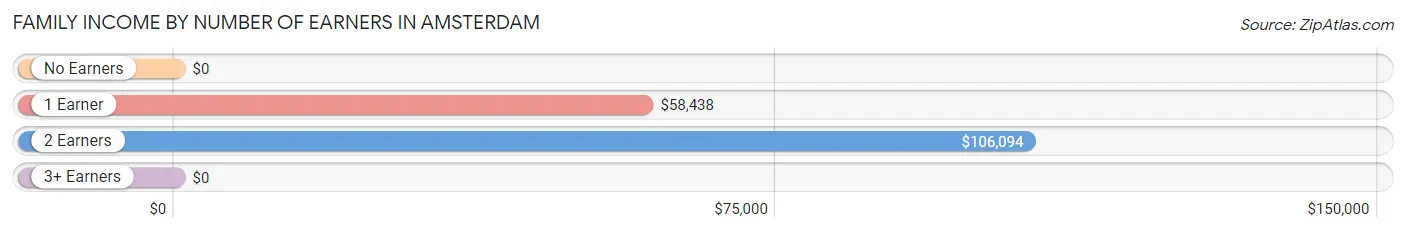
| Number of Earners | # Families | Median Income |
| No Earners | 4 (8.3%) | $0 |
| 1 Earner | 19 (39.6%) | $58,438 |
| 2 Earners | 25 (52.1%) | $106,094 |
| 3+ Earners | 0 (0.0%) | $0 |
| Total | 48 (100.0%) | $81,875 |
Household Income in Amsterdam
Household Income Brackets in Amsterdam
With 14 households falling in the category, the $50,000 to $74,999 income range is the most frequent in Amsterdam, accounting for 26.9% of all households.
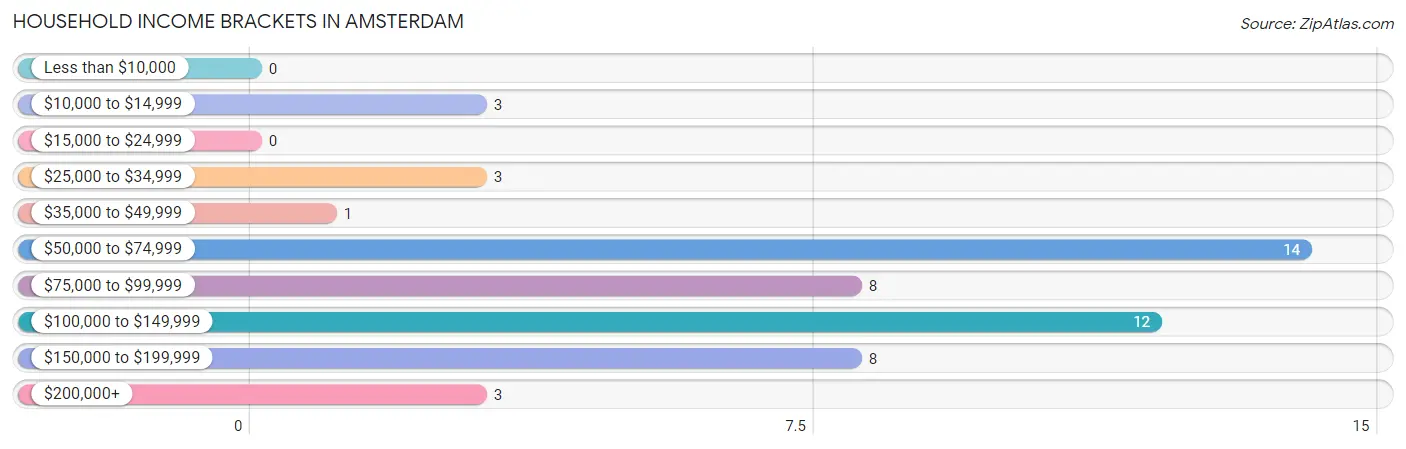
| Income Bracket | # Households | % Households |
| Less than $10,000 | 0 | 0.0% |
| $10,000 to $14,999 | 3 | 5.8% |
| $15,000 to $24,999 | 0 | 0.0% |
| $25,000 to $34,999 | 3 | 5.8% |
| $35,000 to $49,999 | 1 | 1.9% |
| $50,000 to $74,999 | 14 | 26.9% |
| $75,000 to $99,999 | 8 | 15.4% |
| $100,000 to $149,999 | 12 | 23.1% |
| $150,000 to $199,999 | 8 | 15.4% |
| $200,000+ | 3 | 5.8% |
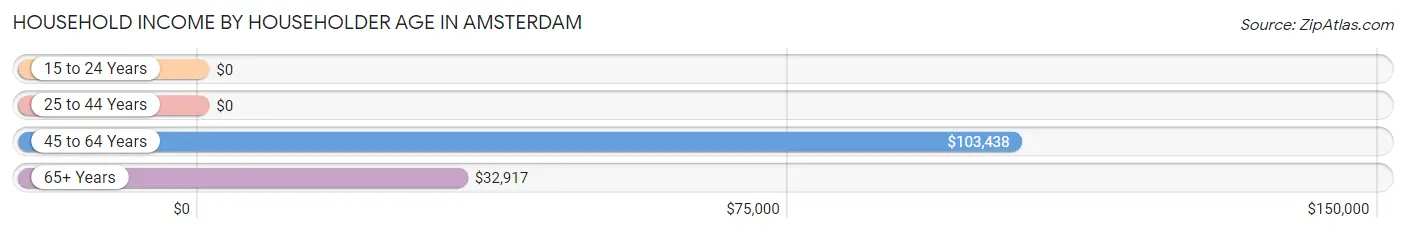
Household Income by Householder Age in Amsterdam
The median household income in Amsterdam is $90,625, with the highest median household income of $103,438 found in the 45 to 64 years age bracket for the primary householder. A total of 21 households (40.4%) fall into this category.
| Income Bracket | # Households | Median Income |
| 15 to 24 Years | 0 (0.0%) | $0 |
| 25 to 44 Years | 24 (46.2%) | $0 |
| 45 to 64 Years | 21 (40.4%) | $103,438 |
| 65+ Years | 7 (13.5%) | $32,917 |
| Total | 52 (100.0%) | $90,625 |
Poverty in Amsterdam
Income Below Poverty by Sex and Age in Amsterdam
With 15.4% poverty level for males and 22.1% for females among the residents of Amsterdam, 16 and 17 year old males and 65 to 74 year old females are the most vulnerable to poverty, with 6 males (100.0%) and 3 females (100.0%) in their respective age groups living below the poverty level.
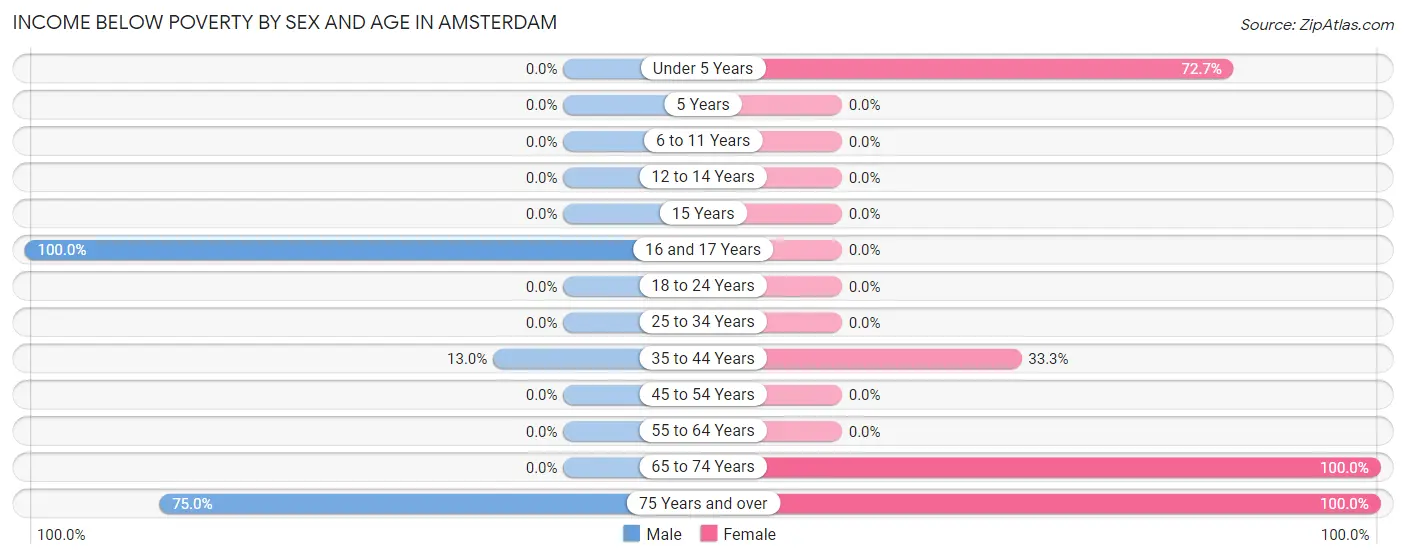
| Age Bracket | Male | Female |
| Under 5 Years | 0 (0.0%) | 8 (72.7%) |
| 5 Years | 0 (0.0%) | 0 (0.0%) |
| 6 to 11 Years | 0 (0.0%) | 0 (0.0%) |
| 12 to 14 Years | 0 (0.0%) | 0 (0.0%) |
| 15 Years | 0 (0.0%) | 0 (0.0%) |
| 16 and 17 Years | 6 (100.0%) | 0 (0.0%) |
| 18 to 24 Years | 0 (0.0%) | 0 (0.0%) |
| 25 to 34 Years | 0 (0.0%) | 0 (0.0%) |
| 35 to 44 Years | 3 (13.0%) | 3 (33.3%) |
| 45 to 54 Years | 0 (0.0%) | 0 (0.0%) |
| 55 to 64 Years | 0 (0.0%) | 0 (0.0%) |
| 65 to 74 Years | 0 (0.0%) | 3 (100.0%) |
| 75 Years and over | 3 (75.0%) | 3 (100.0%) |
| Total | 12 (15.4%) | 17 (22.1%) |
Income Above Poverty by Sex and Age in Amsterdam
According to the poverty statistics in Amsterdam, males aged under 5 years and females aged 6 to 11 years are the age groups that are most secure financially, with 100.0% of males and 100.0% of females in these age groups living above the poverty line.
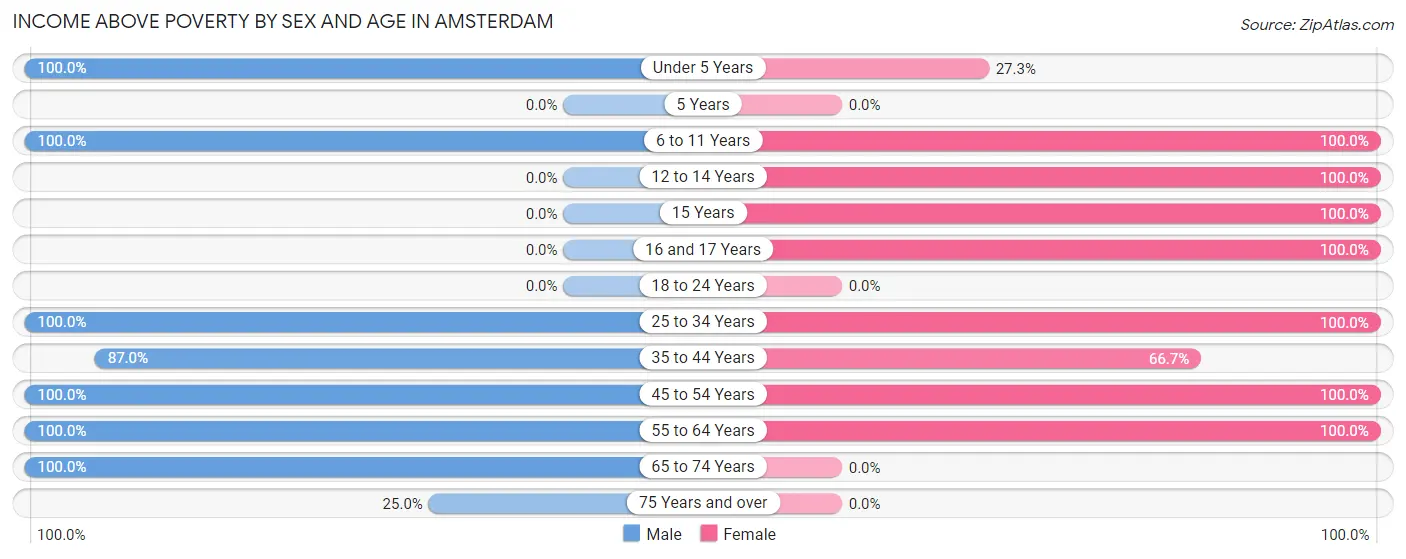
| Age Bracket | Male | Female |
| Under 5 Years | 5 (100.0%) | 3 (27.3%) |
| 5 Years | 0 (0.0%) | 0 (0.0%) |
| 6 to 11 Years | 8 (100.0%) | 3 (100.0%) |
| 12 to 14 Years | 0 (0.0%) | 3 (100.0%) |
| 15 Years | 0 (0.0%) | 5 (100.0%) |
| 16 and 17 Years | 0 (0.0%) | 2 (100.0%) |
| 18 to 24 Years | 0 (0.0%) | 0 (0.0%) |
| 25 to 34 Years | 7 (100.0%) | 9 (100.0%) |
| 35 to 44 Years | 20 (87.0%) | 6 (66.7%) |
| 45 to 54 Years | 3 (100.0%) | 7 (100.0%) |
| 55 to 64 Years | 18 (100.0%) | 22 (100.0%) |
| 65 to 74 Years | 4 (100.0%) | 0 (0.0%) |
| 75 Years and over | 1 (25.0%) | 0 (0.0%) |
| Total | 66 (84.6%) | 60 (77.9%) |
Income Below Poverty Among Married-Couple Families in Amsterdam
The poverty statistics for married-couple families in Amsterdam show that 8.3% or 3 of the total 36 families live below the poverty line. Families with no children have the highest poverty rate of 10.3%, comprising of 3 families. On the other hand, families with 3 or 4 children have the lowest poverty rate of 0.0%, which includes 0 families.
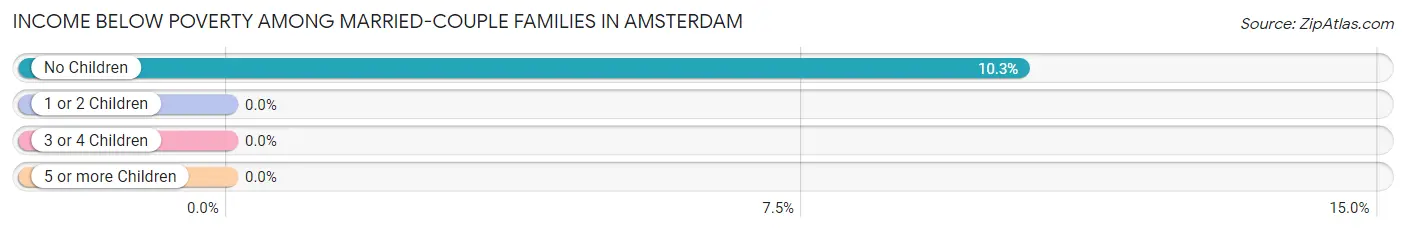
| Children | Above Poverty | Below Poverty |
| No Children | 26 (89.7%) | 3 (10.3%) |
| 1 or 2 Children | 0 (0.0%) | 0 (0.0%) |
| 3 or 4 Children | 7 (100.0%) | 0 (0.0%) |
| 5 or more Children | 0 (0.0%) | 0 (0.0%) |
| Total | 33 (91.7%) | 3 (8.3%) |
Income Below Poverty Among Single-Parent Households in Amsterdam
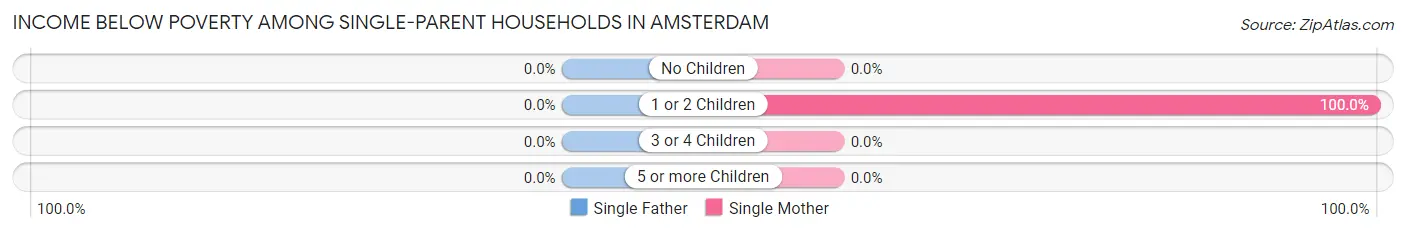
| Children | Single Father | Single Mother |
| No Children | 0 (0.0%) | 0 (0.0%) |
| 1 or 2 Children | 0 (0.0%) | 3 (100.0%) |
| 3 or 4 Children | 0 (0.0%) | 0 (0.0%) |
| 5 or more Children | 0 (0.0%) | 0 (0.0%) |
| Total | 0 (0.0%) | 3 (42.9%) |
Income Below Poverty Among Married-Couple vs Single-Parent Households in Amsterdam
The poverty data for Amsterdam shows that 3 of the married-couple family households (8.3%) and 3 of the single-parent households (25.0%) are living below the poverty level. Within the married-couple family households, those with no children have the highest poverty rate, with 3 households (10.3%) falling below the poverty line. Among the single-parent households, those with 1 or 2 children have the highest poverty rate, with 3 household (37.5%) living below poverty.
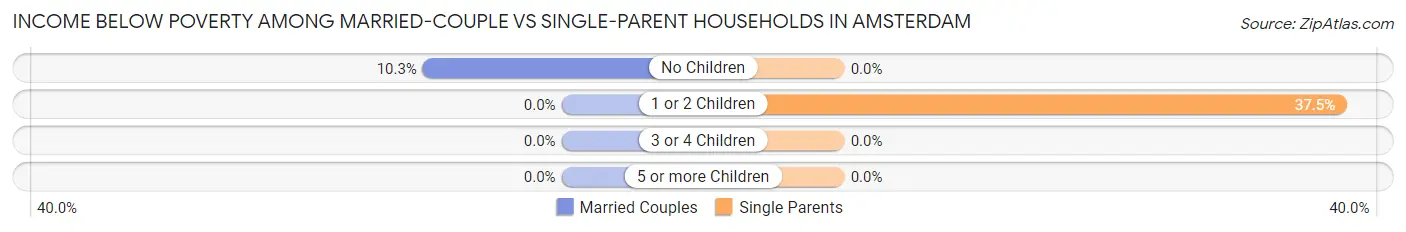
| Children | Married-Couple Families | Single-Parent Households |
| No Children | 3 (10.3%) | 0 (0.0%) |
| 1 or 2 Children | 0 (0.0%) | 3 (37.5%) |
| 3 or 4 Children | 0 (0.0%) | 0 (0.0%) |
| 5 or more Children | 0 (0.0%) | 0 (0.0%) |
| Total | 3 (8.3%) | 3 (25.0%) |
Race in Amsterdam
The most populous races in Amsterdam are White / Caucasian (130 | 81.2%), Native / Alaskan (16 | 10.0%), and Two or more Races (9 | 5.6%).
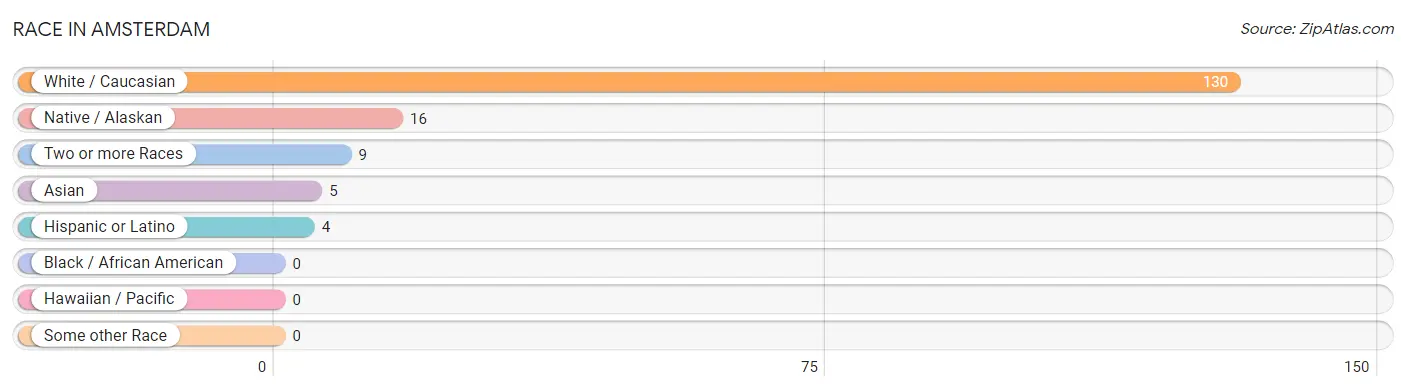
| Race | # Population | % Population |
| Asian | 5 | 3.1% |
| Black / African American | 0 | 0.0% |
| Hawaiian / Pacific | 0 | 0.0% |
| Hispanic or Latino | 4 | 2.5% |
| Native / Alaskan | 16 | 10.0% |
| White / Caucasian | 130 | 81.2% |
| Two or more Races | 9 | 5.6% |
| Some other Race | 0 | 0.0% |
| Total | 160 | 100.0% |
Ancestry in Amsterdam
The most populous ancestries reported in Amsterdam are Dutch (35 | 21.9%), German (25 | 15.6%), European (21 | 13.1%), Norwegian (19 | 11.9%), and Blackfeet (16 | 10.0%), together accounting for 72.5% of all Amsterdam residents.
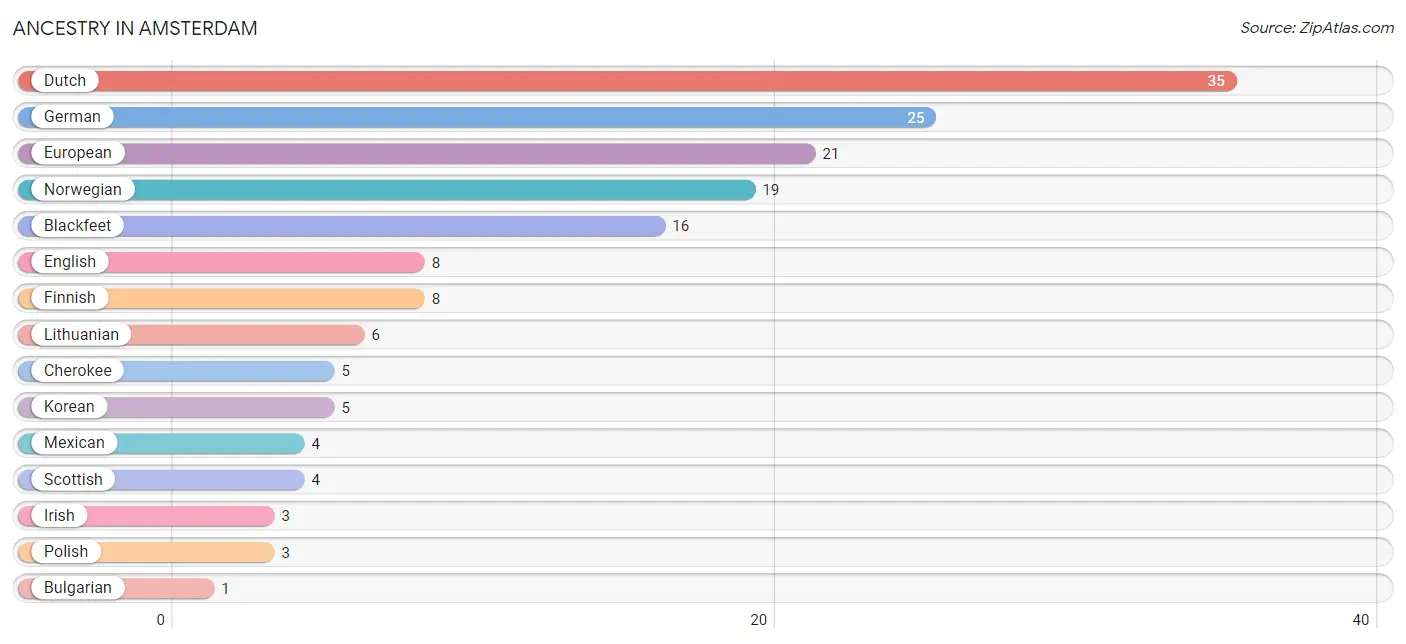
| Ancestry | # Population | % Population |
| Blackfeet | 16 | 10.0% |
| Bulgarian | 1 | 0.6% |
| Cherokee | 5 | 3.1% |
| Dutch | 35 | 21.9% |
| English | 8 | 5.0% |
| European | 21 | 13.1% |
| Finnish | 8 | 5.0% |
| German | 25 | 15.6% |
| Irish | 3 | 1.9% |
| Korean | 5 | 3.1% |
| Lithuanian | 6 | 3.7% |
| Mexican | 4 | 2.5% |
| Norwegian | 19 | 11.9% |
| Polish | 3 | 1.9% |
| Scottish | 4 | 2.5% | View All 15 Rows |
Immigrants in Amsterdam
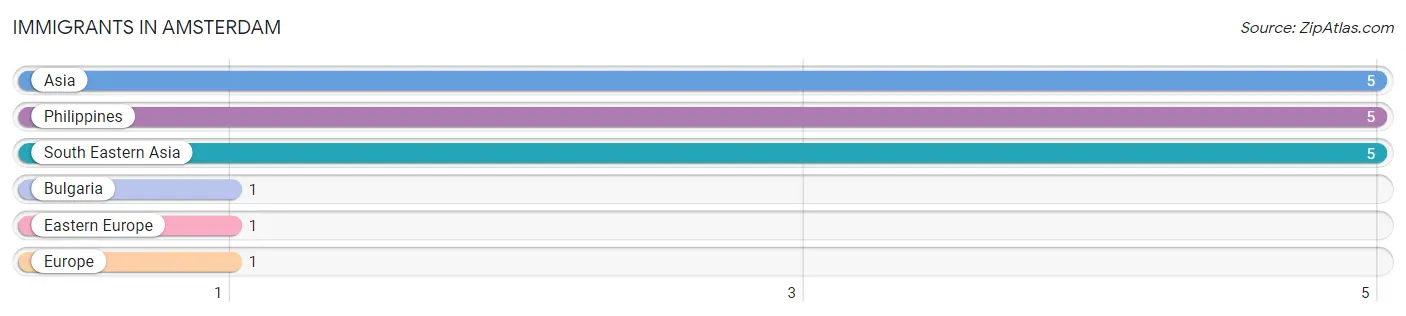
The most numerous immigrant groups reported in Amsterdam came from Asia (5 | 3.1%), Philippines (5 | 3.1%), South Eastern Asia (5 | 3.1%), Bulgaria (1 | 0.6%), and Eastern Europe (1 | 0.6%), together accounting for 10.6% of all Amsterdam residents.
| Immigration Origin | # Population | % Population |
| Asia | 5 | 3.1% |
| Bulgaria | 1 | 0.6% |
| Eastern Europe | 1 | 0.6% |
| Europe | 1 | 0.6% |
| Philippines | 5 | 3.1% |
| South Eastern Asia | 5 | 3.1% | View All 6 Rows |
Sex and Age in Amsterdam
Sex and Age in Amsterdam
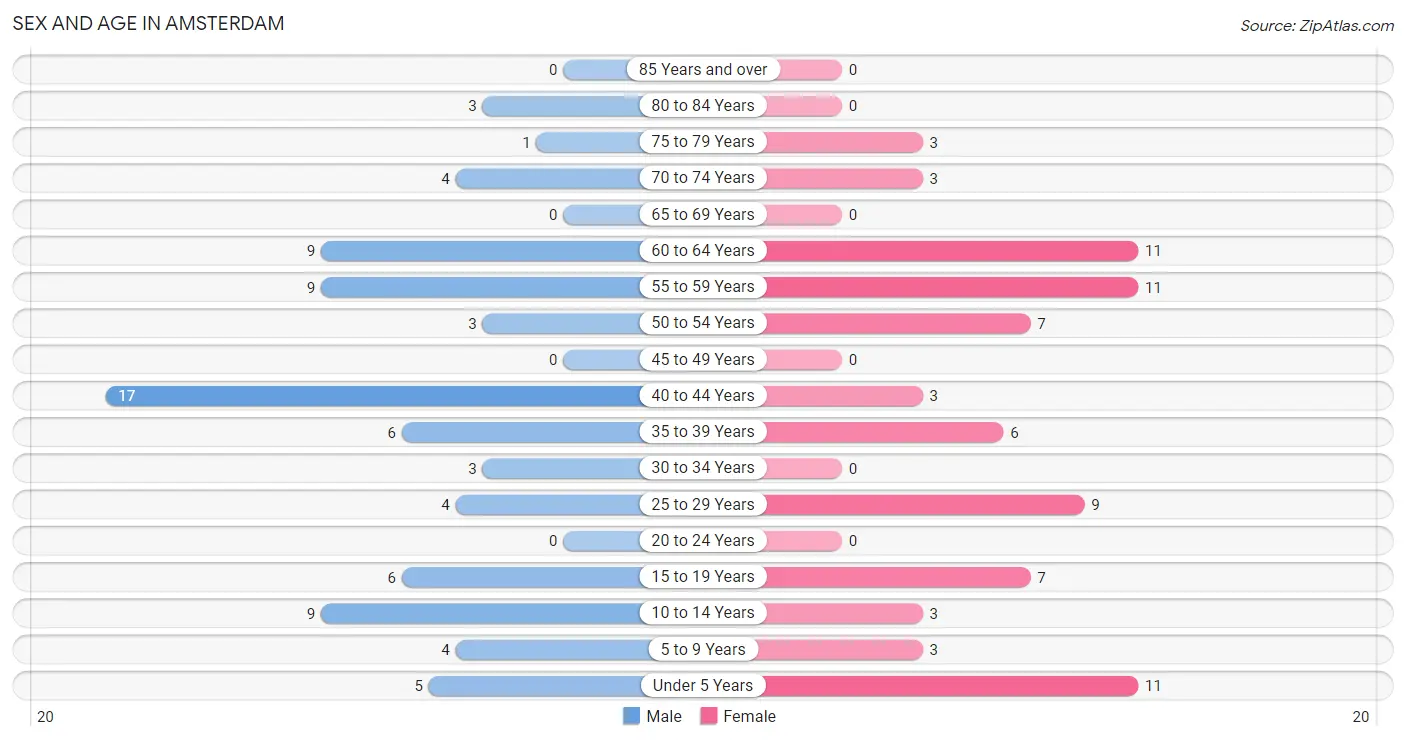
The most populous age groups in Amsterdam are 40 to 44 Years (17 | 20.5%) for men and Under 5 Years (11 | 14.3%) for women.
| Age Bracket | Male | Female |
| Under 5 Years | 5 (6.0%) | 11 (14.3%) |
| 5 to 9 Years | 4 (4.8%) | 3 (3.9%) |
| 10 to 14 Years | 9 (10.8%) | 3 (3.9%) |
| 15 to 19 Years | 6 (7.2%) | 7 (9.1%) |
| 20 to 24 Years | 0 (0.0%) | 0 (0.0%) |
| 25 to 29 Years | 4 (4.8%) | 9 (11.7%) |
| 30 to 34 Years | 3 (3.6%) | 0 (0.0%) |
| 35 to 39 Years | 6 (7.2%) | 6 (7.8%) |
| 40 to 44 Years | 17 (20.5%) | 3 (3.9%) |
| 45 to 49 Years | 0 (0.0%) | 0 (0.0%) |
| 50 to 54 Years | 3 (3.6%) | 7 (9.1%) |
| 55 to 59 Years | 9 (10.8%) | 11 (14.3%) |
| 60 to 64 Years | 9 (10.8%) | 11 (14.3%) |
| 65 to 69 Years | 0 (0.0%) | 0 (0.0%) |
| 70 to 74 Years | 4 (4.8%) | 3 (3.9%) |
| 75 to 79 Years | 1 (1.2%) | 3 (3.9%) |
| 80 to 84 Years | 3 (3.6%) | 0 (0.0%) |
| 85 Years and over | 0 (0.0%) | 0 (0.0%) |
| Total | 83 (100.0%) | 77 (100.0%) |
Families and Households in Amsterdam
Median Family Size in Amsterdam
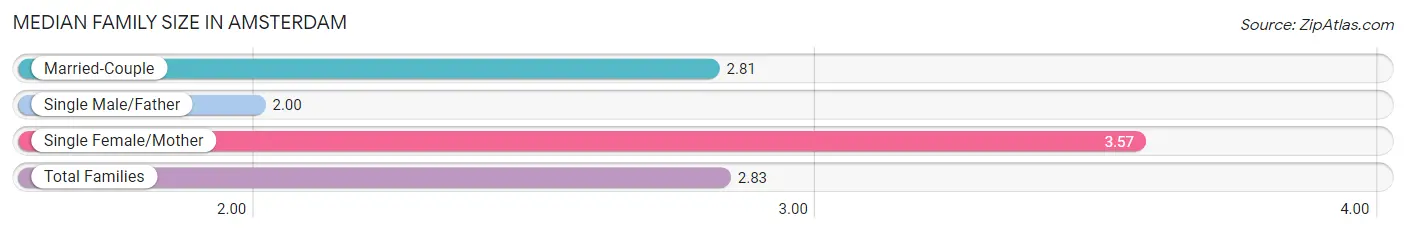
The median family size in Amsterdam is 2.83 persons per family, with single female/mother families (7 | 14.6%) accounting for the largest median family size of 3.57 persons per family. On the other hand, single male/father families (5 | 10.4%) represent the smallest median family size with 2.00 persons per family.
| Family Type | # Families | Family Size |
| Married-Couple | 36 (75.0%) | 2.81 |
| Single Male/Father | 5 (10.4%) | 2.00 |
| Single Female/Mother | 7 (14.6%) | 3.57 |
| Total Families | 48 (100.0%) | 2.83 |
Median Household Size in Amsterdam
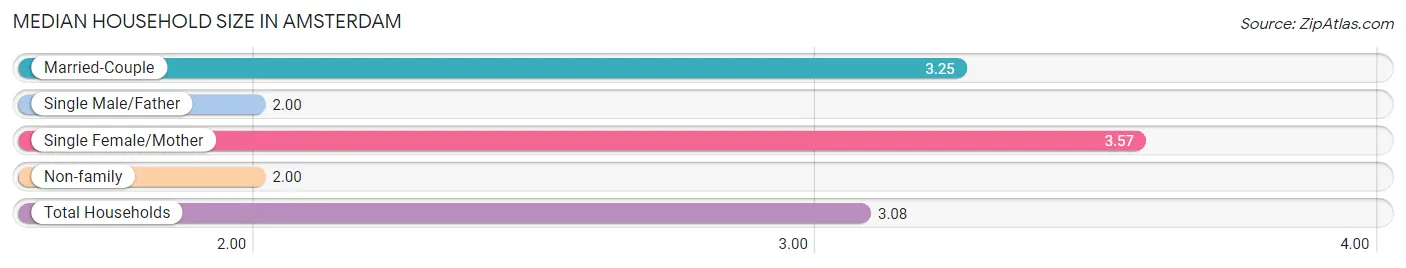
The median household size in Amsterdam is 3.08 persons per household, with single female/mother households (7 | 13.5%) accounting for the largest median household size of 3.57 persons per household. single male/father households (5 | 9.6%) represent the smallest median household size with 2.00 persons per household.
| Household Type | # Households | Household Size |
| Married-Couple | 36 (69.2%) | 3.25 |
| Single Male/Father | 5 (9.6%) | 2.00 |
| Single Female/Mother | 7 (13.5%) | 3.57 |
| Non-family | 4 (7.7%) | 2.00 |
| Total Households | 52 (100.0%) | 3.08 |
Household Size by Marriage Status in Amsterdam
Out of a total of 52 households in Amsterdam, 48 (92.3%) are family households, while 4 (7.7%) are nonfamily households. The most numerous type of family households are 2-person households, comprising 29, and the most common type of nonfamily households are 2-person households, comprising 4.
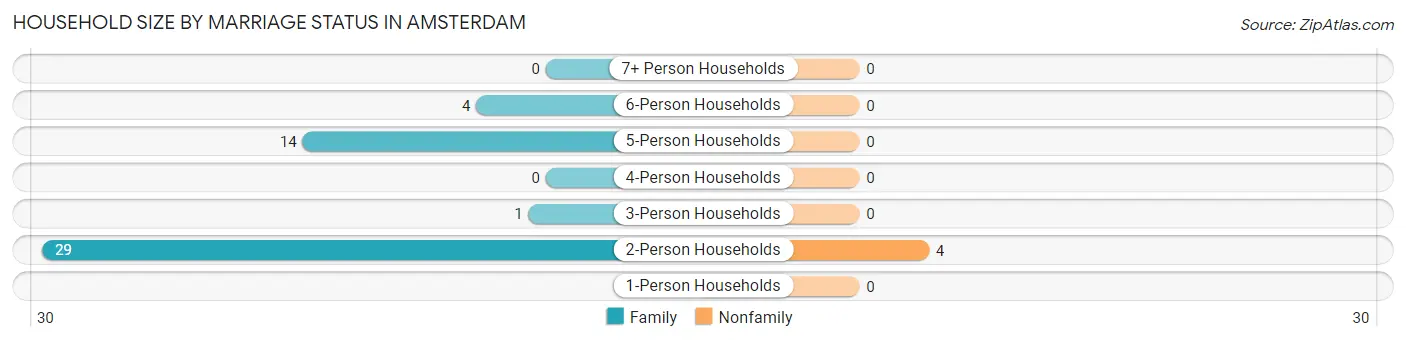
| Household Size | Family Households | Nonfamily Households |
| 1-Person Households | - | 0 (0.0%) |
| 2-Person Households | 29 (55.8%) | 4 (7.7%) |
| 3-Person Households | 1 (1.9%) | 0 (0.0%) |
| 4-Person Households | 0 (0.0%) | 0 (0.0%) |
| 5-Person Households | 14 (26.9%) | 0 (0.0%) |
| 6-Person Households | 4 (7.7%) | 0 (0.0%) |
| 7+ Person Households | 0 (0.0%) | 0 (0.0%) |
| Total | 48 (92.3%) | 4 (7.7%) |
Female Fertility in Amsterdam
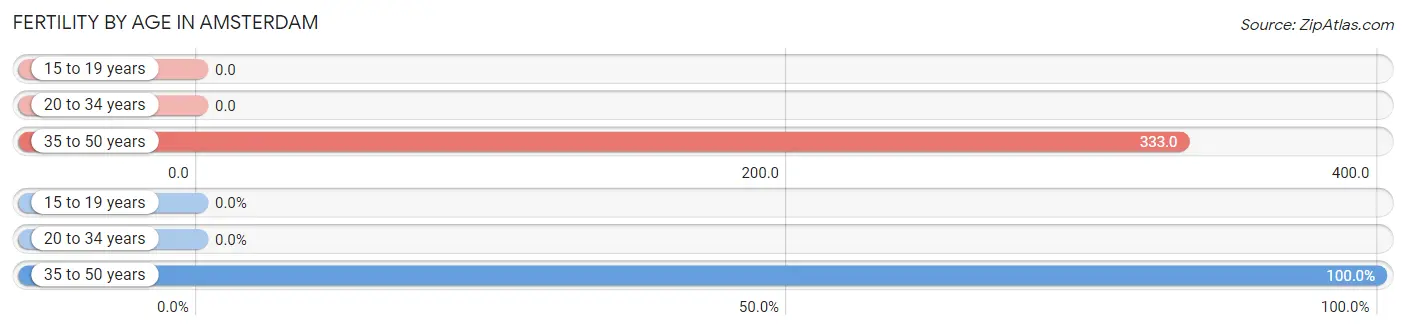
Fertility by Age in Amsterdam
Average fertility rate in Amsterdam is 120.0 births per 1,000 women. Women in the age bracket of 35 to 50 years have the highest fertility rate with 333.0 births per 1,000 women. Women in the age bracket of 35 to 50 years acount for 100.0% of all women with births.
| Age Bracket | Women with Births | Births / 1,000 Women |
| 15 to 19 years | 0 (0.0%) | 0.0 |
| 20 to 34 years | 0 (0.0%) | 0.0 |
| 35 to 50 years | 3 (100.0%) | 333.0 |
| Total | 3 (100.0%) | 120.0 |
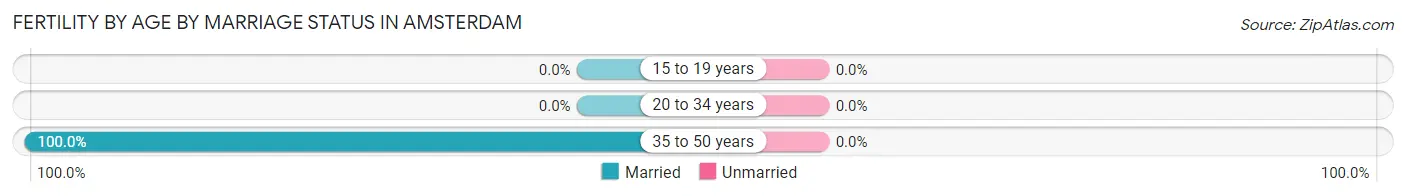
Fertility by Age by Marriage Status in Amsterdam
| Age Bracket | Married | Unmarried |
| 15 to 19 years | 0 (0.0%) | 0 (0.0%) |
| 20 to 34 years | 0 (0.0%) | 0 (0.0%) |
| 35 to 50 years | 3 (100.0%) | 0 (0.0%) |
| Total | 3 (100.0%) | 0 (0.0%) |
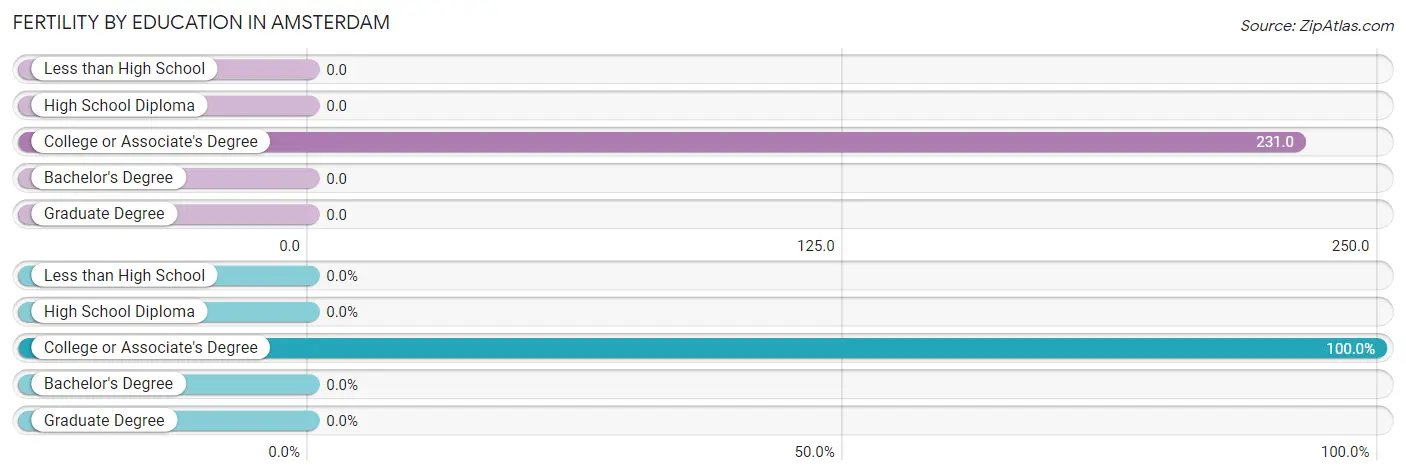
Fertility by Education in Amsterdam
| Educational Attainment | Women with Births | Births / 1,000 Women |
| Less than High School | 0 (0.0%) | 0.0 |
| High School Diploma | 0 (0.0%) | 0.0 |
| College or Associate's Degree | 3 (100.0%) | 231.0 |
| Bachelor's Degree | 0 (0.0%) | 0.0 |
| Graduate Degree | 0 (0.0%) | 0.0 |
| Total | 3 (100.0%) | 120.0 |
Fertility by Education by Marriage Status in Amsterdam
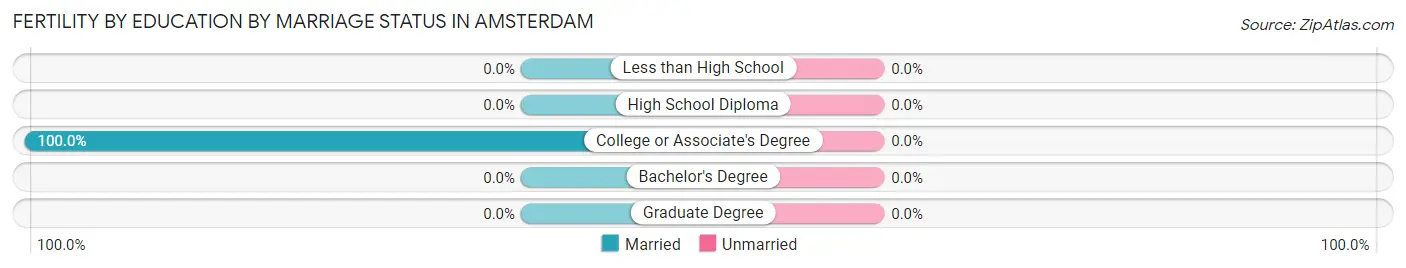
| Educational Attainment | Married | Unmarried |
| Less than High School | 0 (0.0%) | 0 (0.0%) |
| High School Diploma | 0 (0.0%) | 0 (0.0%) |
| College or Associate's Degree | 3 (100.0%) | 0 (0.0%) |
| Bachelor's Degree | 0 (0.0%) | 0 (0.0%) |
| Graduate Degree | 0 (0.0%) | 0 (0.0%) |
| Total | 3 (100.0%) | 0 (0.0%) |
Employment Characteristics in Amsterdam
Employment by Class of Employer in Amsterdam
Among the 80 employed individuals in Amsterdam, private company employees (49 | 61.3%), local government employees (9 | 11.3%), and self-employed (not incorporated) (7 | 8.7%) make up the most common classes of employment.
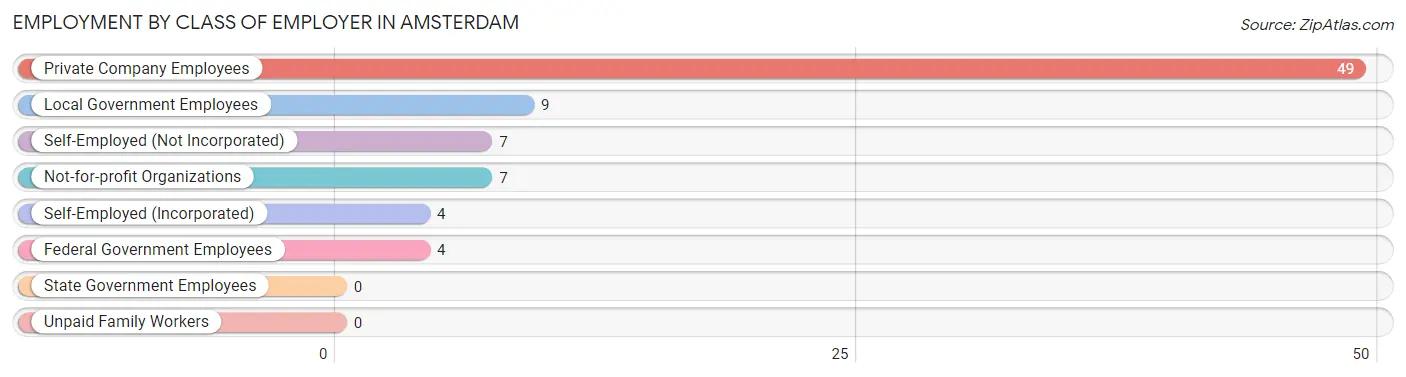
| Employer Class | # Employees | % Employees |
| Private Company Employees | 49 | 61.3% |
| Self-Employed (Incorporated) | 4 | 5.0% |
| Self-Employed (Not Incorporated) | 7 | 8.7% |
| Not-for-profit Organizations | 7 | 8.7% |
| Local Government Employees | 9 | 11.3% |
| State Government Employees | 0 | 0.0% |
| Federal Government Employees | 4 | 5.0% |
| Unpaid Family Workers | 0 | 0.0% |
| Total | 80 | 100.0% |
Employment Status by Age in Amsterdam
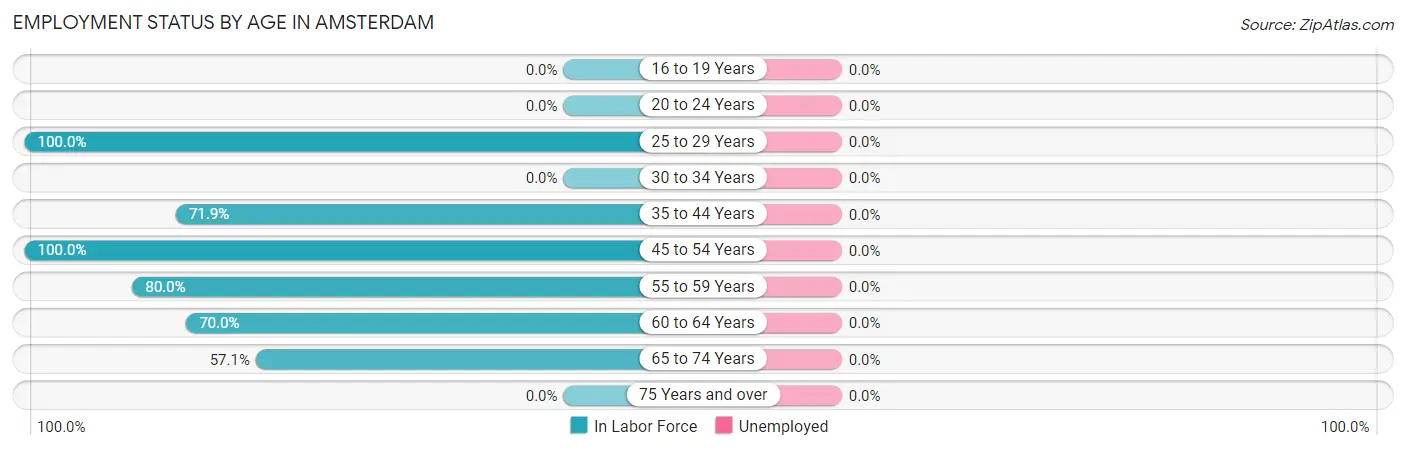
| Age Bracket | In Labor Force | Unemployed |
| 16 to 19 Years | 0 (0.0%) | 0 (0.0%) |
| 20 to 24 Years | 0 (0.0%) | 0 (0.0%) |
| 25 to 29 Years | 13 (100.0%) | 0 (0.0%) |
| 30 to 34 Years | 0 (0.0%) | 0 (0.0%) |
| 35 to 44 Years | 23 (71.9%) | 0 (0.0%) |
| 45 to 54 Years | 10 (100.0%) | 0 (0.0%) |
| 55 to 59 Years | 16 (80.0%) | 0 (0.0%) |
| 60 to 64 Years | 14 (70.0%) | 0 (0.0%) |
| 65 to 74 Years | 4 (57.1%) | 0 (0.0%) |
| 75 Years and over | 0 (0.0%) | 0 (0.0%) |
| Total | 80 (66.7%) | 0 (0.0%) |
Employment Status by Educational Attainment in Amsterdam
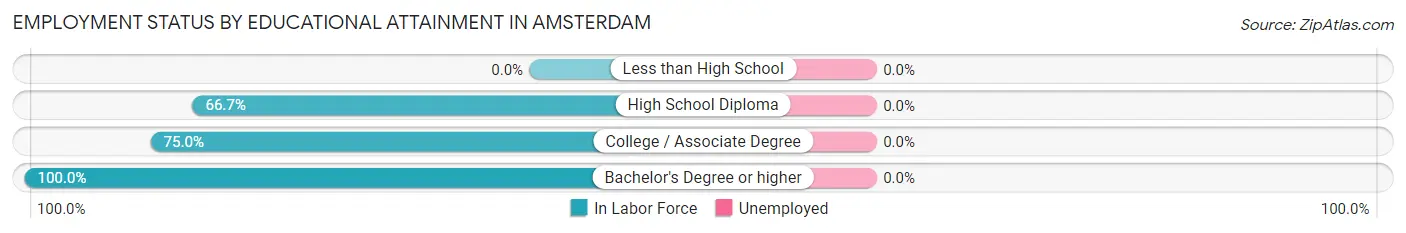
| Educational Attainment | In Labor Force | Unemployed |
| Less than High School | 0 (0.0%) | 0 (0.0%) |
| High School Diploma | 18 (66.7%) | 0 (0.0%) |
| College / Associate Degree | 27 (75.0%) | 0 (0.0%) |
| Bachelor's Degree or higher | 31 (100.0%) | 0 (0.0%) |
| Total | 76 (77.6%) | 0 (0.0%) |
Employment Occupations by Sex in Amsterdam
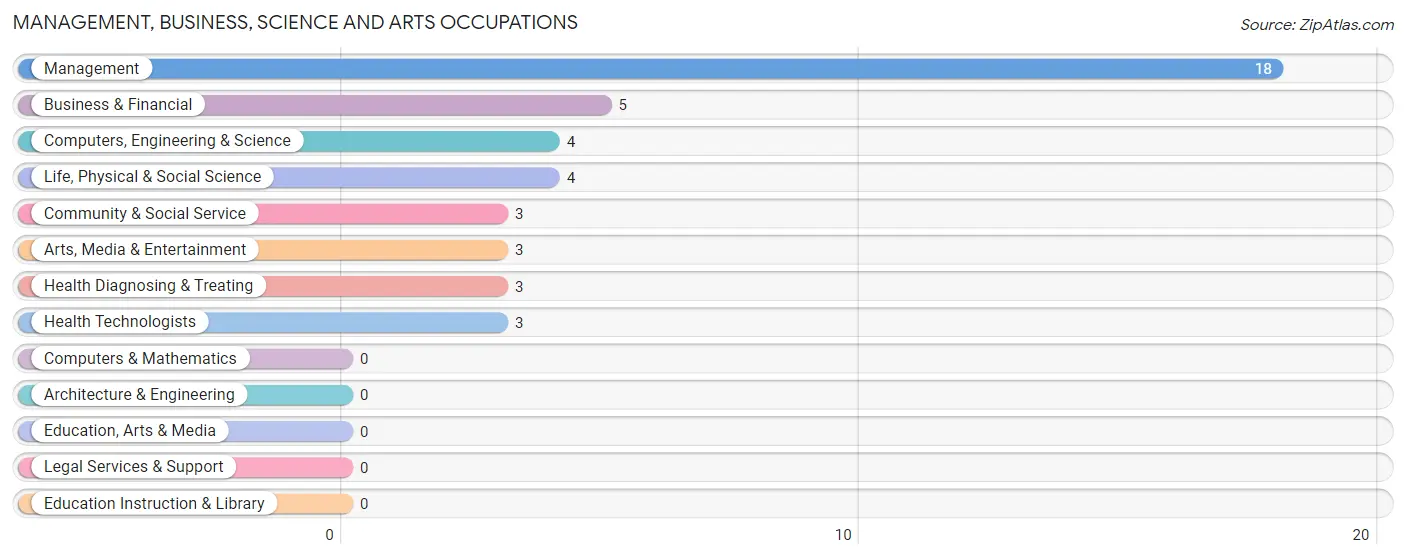
Management, Business, Science and Arts Occupations
The most common Management, Business, Science and Arts occupations in Amsterdam are Management (18 | 22.5%), Business & Financial (5 | 6.2%), Computers, Engineering & Science (4 | 5.0%), Life, Physical & Social Science (4 | 5.0%), and Community & Social Service (3 | 3.7%).
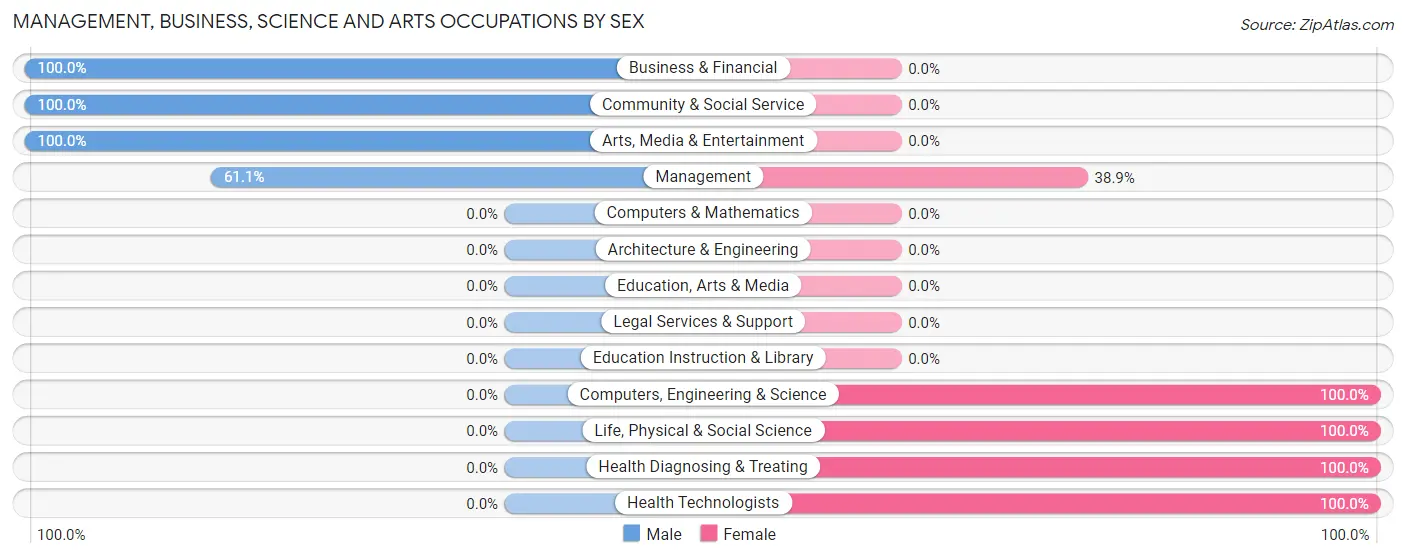
Management, Business, Science and Arts Occupations by Sex
Within the Management, Business, Science and Arts occupations in Amsterdam, the most male-oriented occupations are Business & Financial (100.0%), Community & Social Service (100.0%), and Arts, Media & Entertainment (100.0%), while the most female-oriented occupations are Computers, Engineering & Science (100.0%), Life, Physical & Social Science (100.0%), and Health Diagnosing & Treating (100.0%).
| Occupation | Male | Female |
| Management | 11 (61.1%) | 7 (38.9%) |
| Business & Financial | 5 (100.0%) | 0 (0.0%) |
| Computers, Engineering & Science | 0 (0.0%) | 4 (100.0%) |
| Computers & Mathematics | 0 (0.0%) | 0 (0.0%) |
| Architecture & Engineering | 0 (0.0%) | 0 (0.0%) |
| Life, Physical & Social Science | 0 (0.0%) | 4 (100.0%) |
| Community & Social Service | 3 (100.0%) | 0 (0.0%) |
| Education, Arts & Media | 0 (0.0%) | 0 (0.0%) |
| Legal Services & Support | 0 (0.0%) | 0 (0.0%) |
| Education Instruction & Library | 0 (0.0%) | 0 (0.0%) |
| Arts, Media & Entertainment | 3 (100.0%) | 0 (0.0%) |
| Health Diagnosing & Treating | 0 (0.0%) | 3 (100.0%) |
| Health Technologists | 0 (0.0%) | 3 (100.0%) |
| Total (Category) | 19 (57.6%) | 14 (42.4%) |
| Total (Overall) | 48 (60.0%) | 32 (40.0%) |
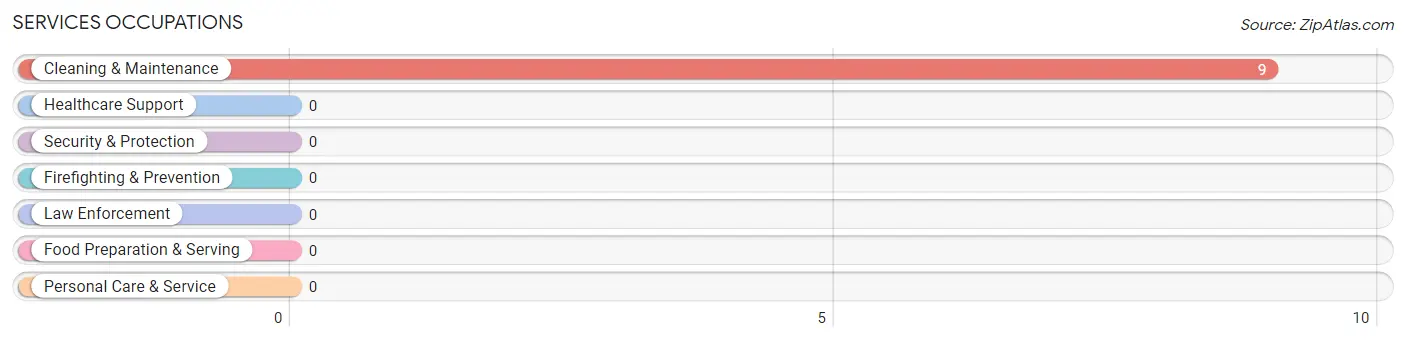
Services Occupations
The most common Services occupations in Amsterdam are , and Cleaning & Maintenance (9 | 11.3%).
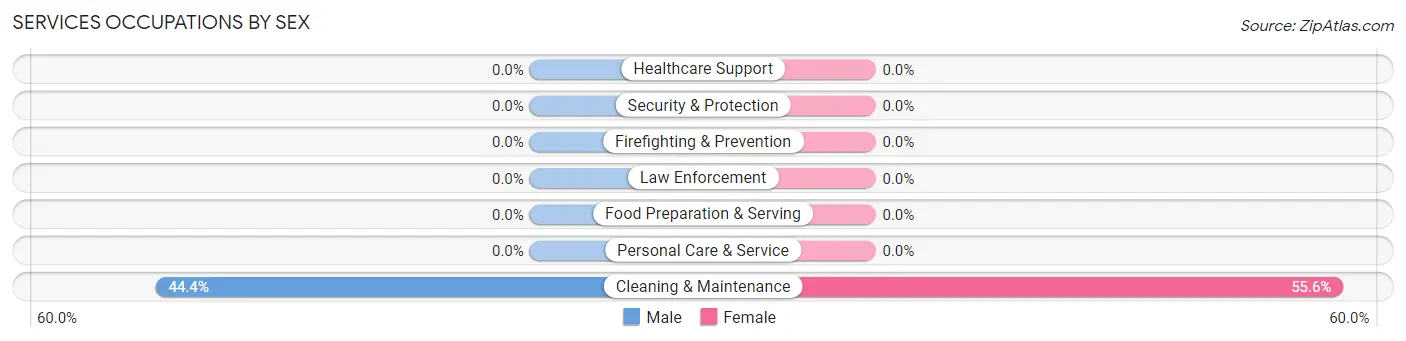
Services Occupations by Sex
| Occupation | Male | Female |
| Healthcare Support | 0 (0.0%) | 0 (0.0%) |
| Security & Protection | 0 (0.0%) | 0 (0.0%) |
| Firefighting & Prevention | 0 (0.0%) | 0 (0.0%) |
| Law Enforcement | 0 (0.0%) | 0 (0.0%) |
| Food Preparation & Serving | 0 (0.0%) | 0 (0.0%) |
| Cleaning & Maintenance | 4 (44.4%) | 5 (55.6%) |
| Personal Care & Service | 0 (0.0%) | 0 (0.0%) |
| Total (Category) | 4 (44.4%) | 5 (55.6%) |
| Total (Overall) | 48 (60.0%) | 32 (40.0%) |
Sales and Office Occupations
The most common Sales and Office occupations in Amsterdam are Sales & Related (13 | 16.3%), and Office & Administration (4 | 5.0%).

Sales and Office Occupations by Sex

| Occupation | Male | Female |
| Sales & Related | 13 (100.0%) | 0 (0.0%) |
| Office & Administration | 0 (0.0%) | 4 (100.0%) |
| Total (Category) | 13 (76.5%) | 4 (23.5%) |
| Total (Overall) | 48 (60.0%) | 32 (40.0%) |
Natural Resources, Construction and Maintenance Occupations
The most common Natural Resources, Construction and Maintenance occupations in Amsterdam are , and Farming, Fishing & Forestry (4 | 5.0%).
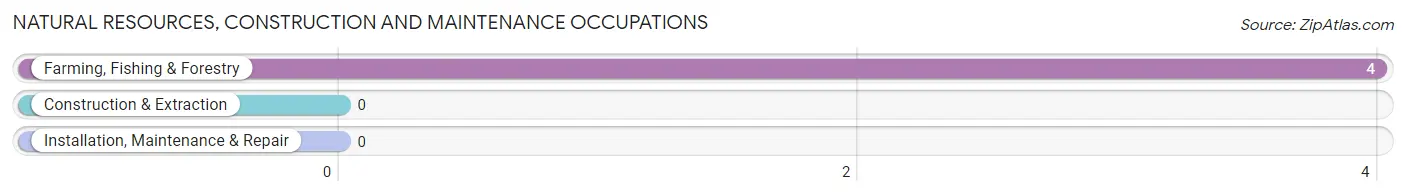
Natural Resources, Construction and Maintenance Occupations by Sex

| Occupation | Male | Female |
| Farming, Fishing & Forestry | 4 (100.0%) | 0 (0.0%) |
| Construction & Extraction | 0 (0.0%) | 0 (0.0%) |
| Installation, Maintenance & Repair | 0 (0.0%) | 0 (0.0%) |
| Total (Category) | 4 (100.0%) | 0 (0.0%) |
| Total (Overall) | 48 (60.0%) | 32 (40.0%) |
Production, Transportation and Moving Occupations
The most common Production, Transportation and Moving occupations in Amsterdam are Production (14 | 17.5%), and Transportation (3 | 3.7%).
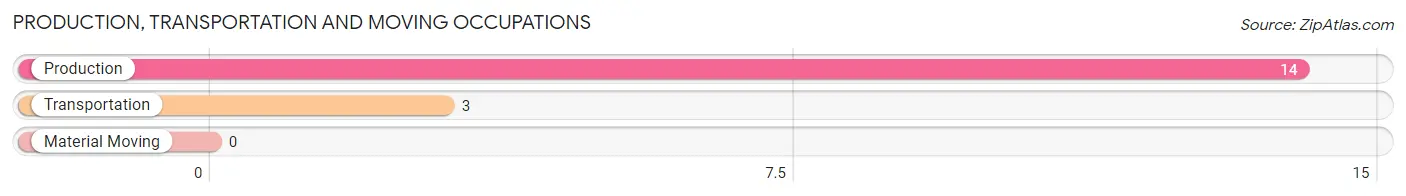
Production, Transportation and Moving Occupations by Sex
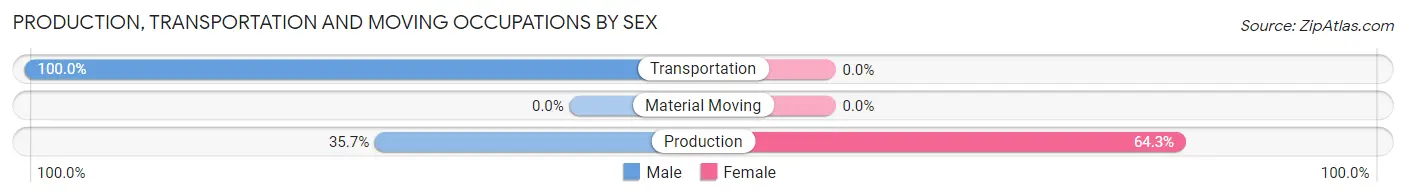
| Occupation | Male | Female |
| Production | 5 (35.7%) | 9 (64.3%) |
| Transportation | 3 (100.0%) | 0 (0.0%) |
| Material Moving | 0 (0.0%) | 0 (0.0%) |
| Total (Category) | 8 (47.1%) | 9 (52.9%) |
| Total (Overall) | 48 (60.0%) | 32 (40.0%) |
Employment Industries by Sex in Amsterdam
Employment Industries in Amsterdam
The major employment industries in Amsterdam include Retail Trade (23 | 28.7%), Agriculture, Fishing & Hunting (12 | 15.0%), Manufacturing (10 | 12.5%), Educational Services (9 | 11.3%), and Transportation & Warehousing (7 | 8.7%).
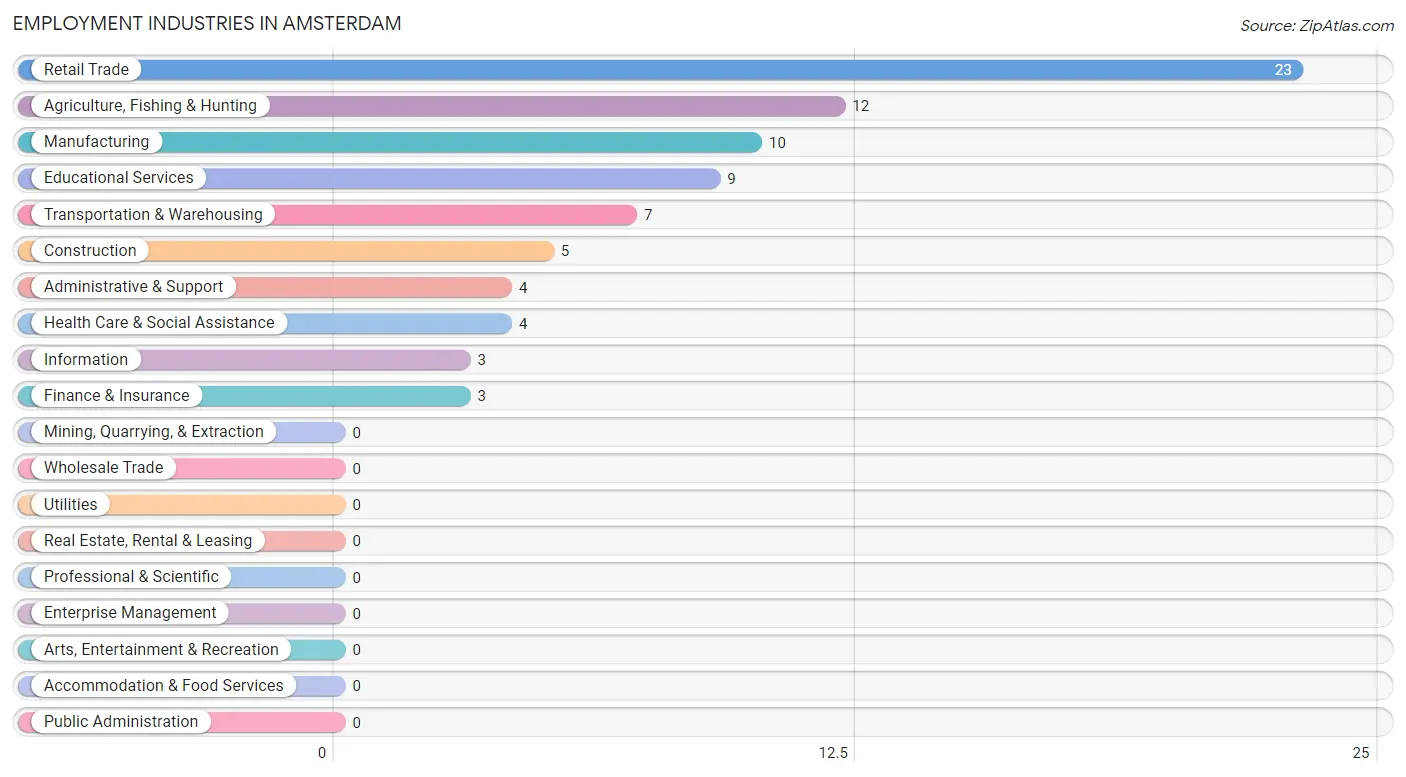
Employment Industries by Sex in Amsterdam
The Amsterdam industries that see more men than women are Construction (100.0%), Information (100.0%), and Finance & Insurance (100.0%), whereas the industries that tend to have a higher number of women are Health Care & Social Assistance (100.0%), Transportation & Warehousing (57.1%), and Educational Services (55.6%).
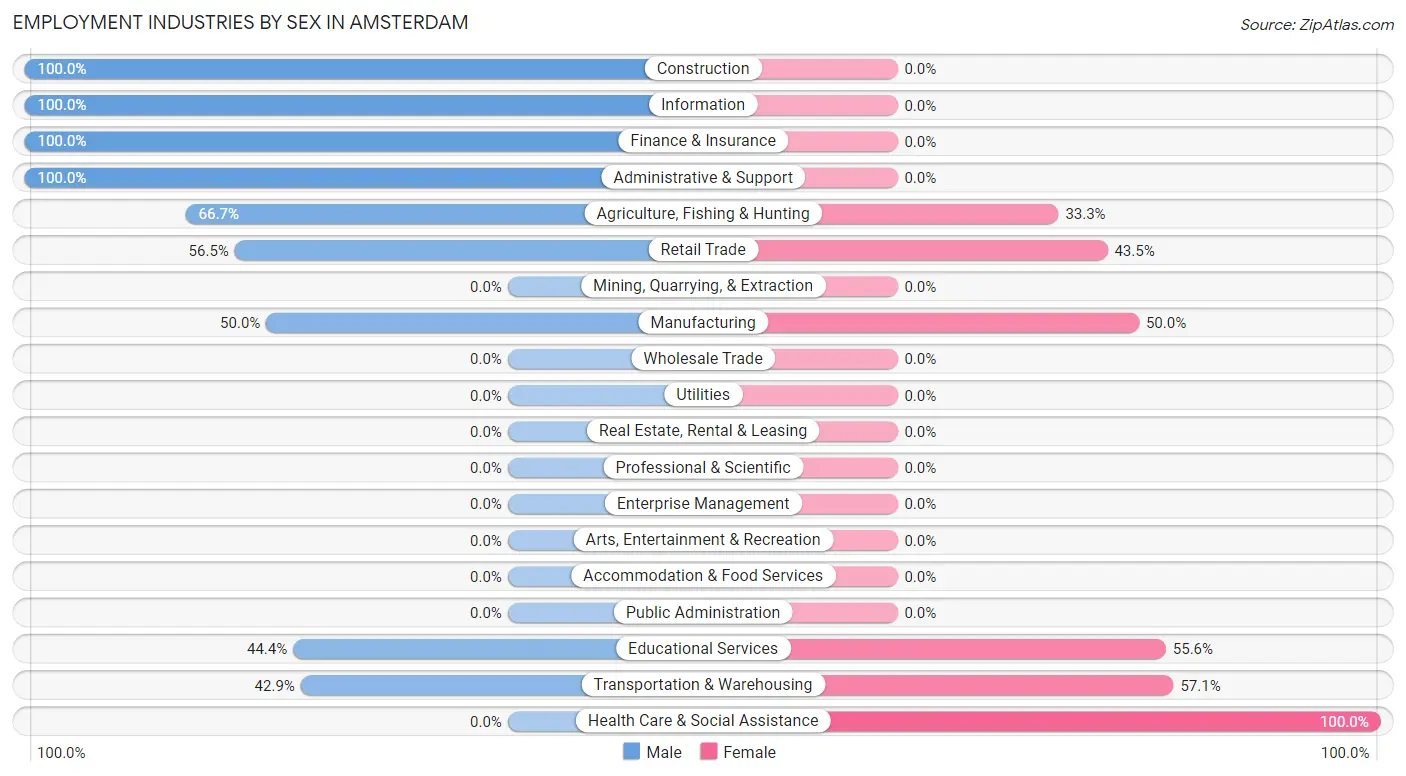
| Industry | Male | Female |
| Agriculture, Fishing & Hunting | 8 (66.7%) | 4 (33.3%) |
| Mining, Quarrying, & Extraction | 0 (0.0%) | 0 (0.0%) |
| Construction | 5 (100.0%) | 0 (0.0%) |
| Manufacturing | 5 (50.0%) | 5 (50.0%) |
| Wholesale Trade | 0 (0.0%) | 0 (0.0%) |
| Retail Trade | 13 (56.5%) | 10 (43.5%) |
| Transportation & Warehousing | 3 (42.9%) | 4 (57.1%) |
| Utilities | 0 (0.0%) | 0 (0.0%) |
| Information | 3 (100.0%) | 0 (0.0%) |
| Finance & Insurance | 3 (100.0%) | 0 (0.0%) |
| Real Estate, Rental & Leasing | 0 (0.0%) | 0 (0.0%) |
| Professional & Scientific | 0 (0.0%) | 0 (0.0%) |
| Enterprise Management | 0 (0.0%) | 0 (0.0%) |
| Administrative & Support | 4 (100.0%) | 0 (0.0%) |
| Educational Services | 4 (44.4%) | 5 (55.6%) |
| Health Care & Social Assistance | 0 (0.0%) | 4 (100.0%) |
| Arts, Entertainment & Recreation | 0 (0.0%) | 0 (0.0%) |
| Accommodation & Food Services | 0 (0.0%) | 0 (0.0%) |
| Public Administration | 0 (0.0%) | 0 (0.0%) |
| Total | 48 (60.0%) | 32 (40.0%) |
Education in Amsterdam
School Enrollment in Amsterdam
The most common levels of schooling among the 27 students in Amsterdam are high school (13 | 48.1%), middle school (7 | 25.9%), and kindergarten (4 | 14.8%).
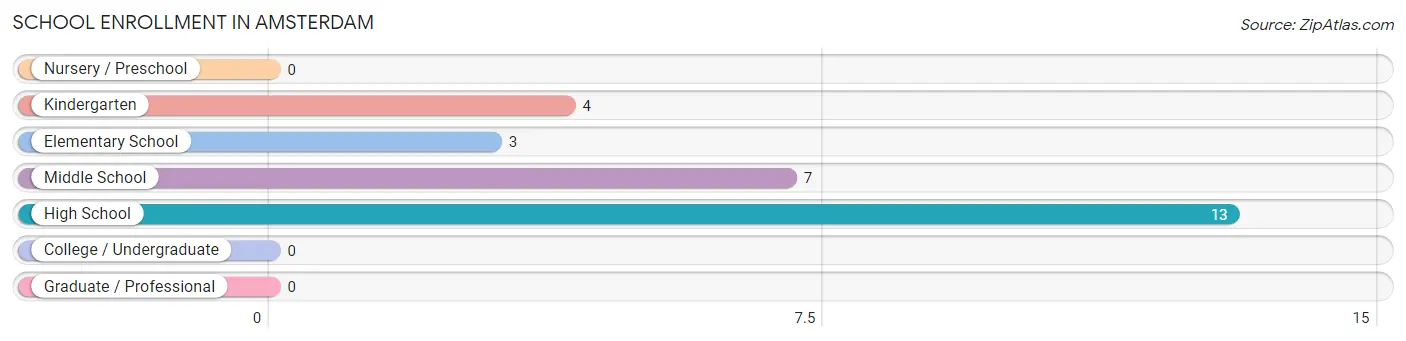
| School Level | # Students | % Students |
| Nursery / Preschool | 0 | 0.0% |
| Kindergarten | 4 | 14.8% |
| Elementary School | 3 | 11.1% |
| Middle School | 7 | 25.9% |
| High School | 13 | 48.1% |
| College / Undergraduate | 0 | 0.0% |
| Graduate / Professional | 0 | 0.0% |
| Total | 27 | 100.0% |
School Enrollment by Age by Funding Source in Amsterdam
Out of a total of 27 students who are enrolled in schools in Amsterdam, 9 (33.3%) attend a private institution, while the remaining 18 (66.7%) are enrolled in public schools. The age group of 5 to 9 year old has the highest likelihood of being enrolled in private schools, with 4 (57.1% in the age bracket) enrolled. Conversely, the age group of 10 to 14 year olds has the lowest likelihood of being enrolled in a private school, with 9 (75.0% in the age bracket) attending a public institution.
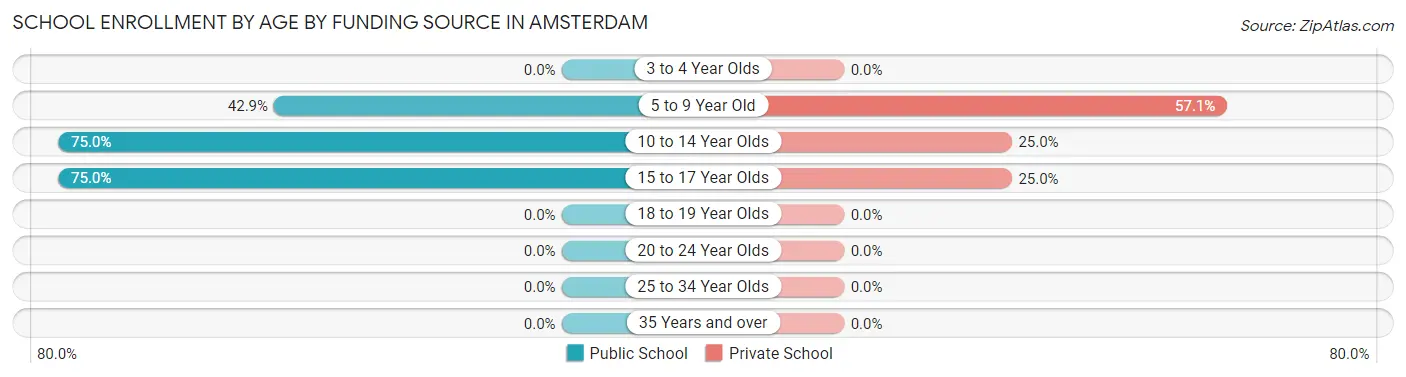
| Age Bracket | Public School | Private School |
| 3 to 4 Year Olds | 0 (0.0%) | 0 (0.0%) |
| 5 to 9 Year Old | 3 (42.9%) | 4 (57.1%) |
| 10 to 14 Year Olds | 9 (75.0%) | 3 (25.0%) |
| 15 to 17 Year Olds | 6 (75.0%) | 2 (25.0%) |
| 18 to 19 Year Olds | 0 (0.0%) | 0 (0.0%) |
| 20 to 24 Year Olds | 0 (0.0%) | 0 (0.0%) |
| 25 to 34 Year Olds | 0 (0.0%) | 0 (0.0%) |
| 35 Years and over | 0 (0.0%) | 0 (0.0%) |
| Total | 18 (66.7%) | 9 (33.3%) |
Educational Attainment by Field of Study in Amsterdam
Computers & mathematics (8 | 19.5%), science & technology (8 | 19.5%), engineering (7 | 17.1%), literature & languages (7 | 17.1%), and business (5 | 12.2%) are the most common fields of study among 41 individuals in Amsterdam who have obtained a bachelor's degree or higher.
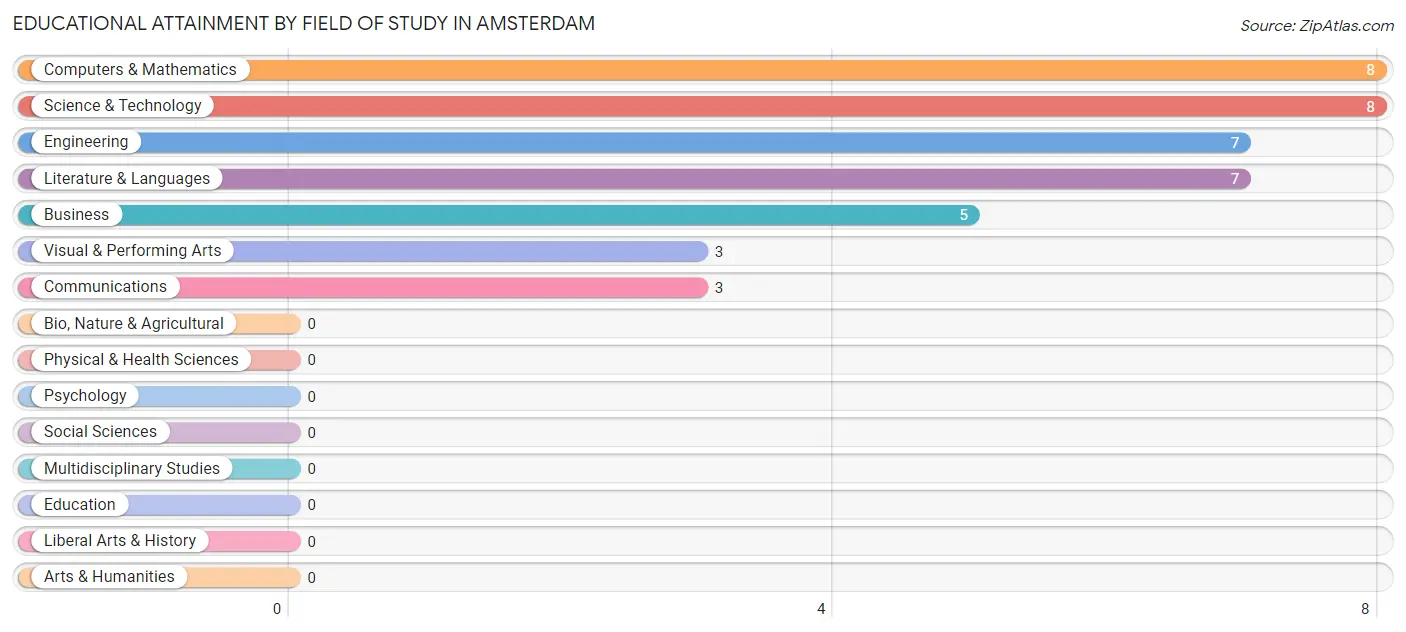
| Field of Study | # Graduates | % Graduates |
| Computers & Mathematics | 8 | 19.5% |
| Bio, Nature & Agricultural | 0 | 0.0% |
| Physical & Health Sciences | 0 | 0.0% |
| Psychology | 0 | 0.0% |
| Social Sciences | 0 | 0.0% |
| Engineering | 7 | 17.1% |
| Multidisciplinary Studies | 0 | 0.0% |
| Science & Technology | 8 | 19.5% |
| Business | 5 | 12.2% |
| Education | 0 | 0.0% |
| Literature & Languages | 7 | 17.1% |
| Liberal Arts & History | 0 | 0.0% |
| Visual & Performing Arts | 3 | 7.3% |
| Communications | 3 | 7.3% |
| Arts & Humanities | 0 | 0.0% |
| Total | 41 | 100.0% |
Transportation & Commute in Amsterdam
Vehicle Availability by Sex in Amsterdam
The most prevalent vehicle ownership categories in Amsterdam are males with 2 vehicles (22, accounting for 45.8%) and females with 2 vehicles (20, making up 68.8%).
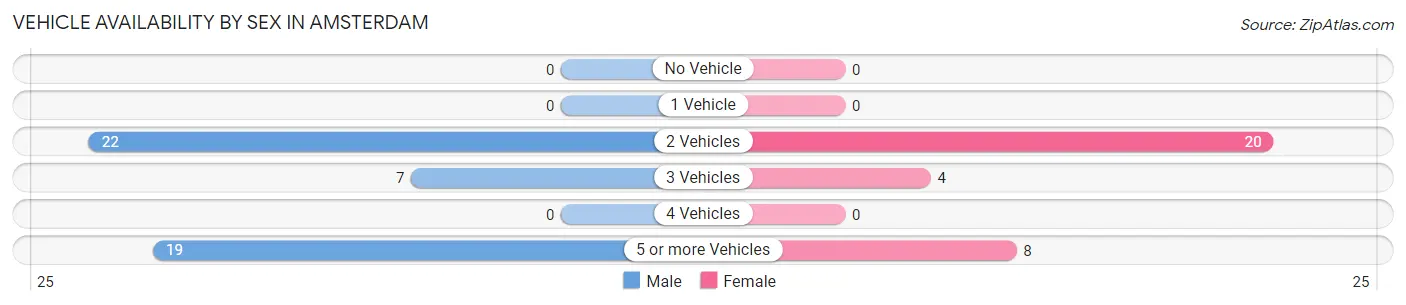
| Vehicles Available | Male | Female |
| No Vehicle | 0 (0.0%) | 0 (0.0%) |
| 1 Vehicle | 0 (0.0%) | 0 (0.0%) |
| 2 Vehicles | 22 (45.8%) | 20 (62.5%) |
| 3 Vehicles | 7 (14.6%) | 4 (12.5%) |
| 4 Vehicles | 0 (0.0%) | 0 (0.0%) |
| 5 or more Vehicles | 19 (39.6%) | 8 (25.0%) |
| Total | 48 (100.0%) | 32 (100.0%) |
Commute Time in Amsterdam
The most frequently occuring commute durations in Amsterdam are 20 to 24 minutes (28 commuters, 36.4%), 25 to 29 minutes (18 commuters, 23.4%), and less than 5 minutes (12 commuters, 15.6%).
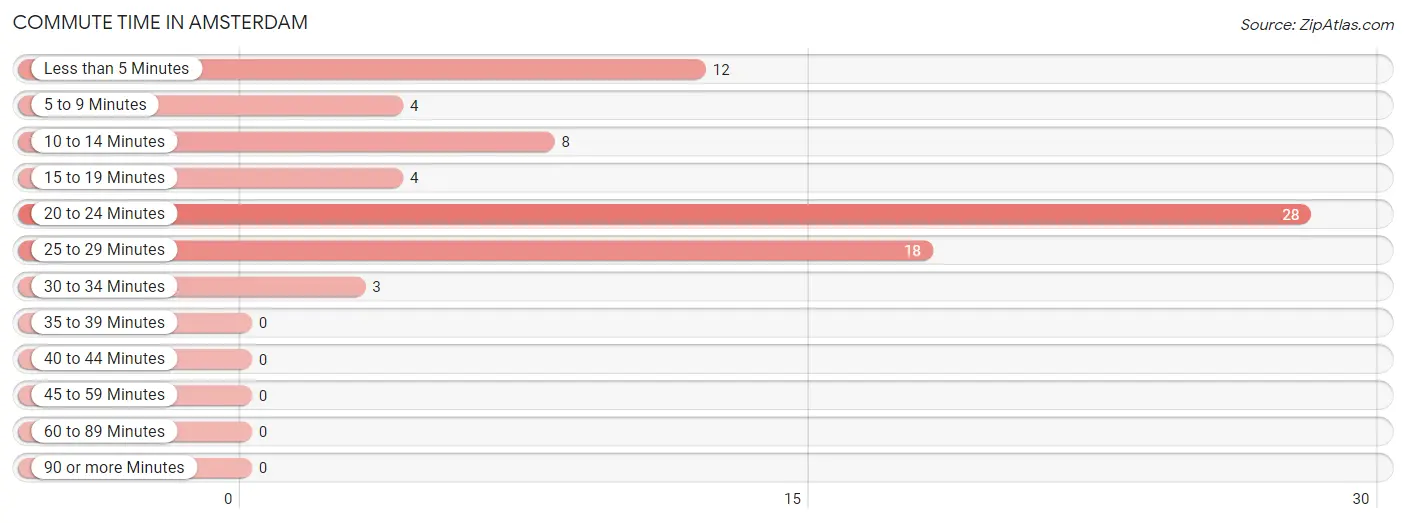
| Commute Time | # Commuters | % Commuters |
| Less than 5 Minutes | 12 | 15.6% |
| 5 to 9 Minutes | 4 | 5.2% |
| 10 to 14 Minutes | 8 | 10.4% |
| 15 to 19 Minutes | 4 | 5.2% |
| 20 to 24 Minutes | 28 | 36.4% |
| 25 to 29 Minutes | 18 | 23.4% |
| 30 to 34 Minutes | 3 | 3.9% |
| 35 to 39 Minutes | 0 | 0.0% |
| 40 to 44 Minutes | 0 | 0.0% |
| 45 to 59 Minutes | 0 | 0.0% |
| 60 to 89 Minutes | 0 | 0.0% |
| 90 or more Minutes | 0 | 0.0% |
Commute Time by Sex in Amsterdam
The most common commute times in Amsterdam are less than 5 minutes (12 commuters, 26.7%) for males and 20 to 24 minutes (16 commuters, 50.0%) for females.
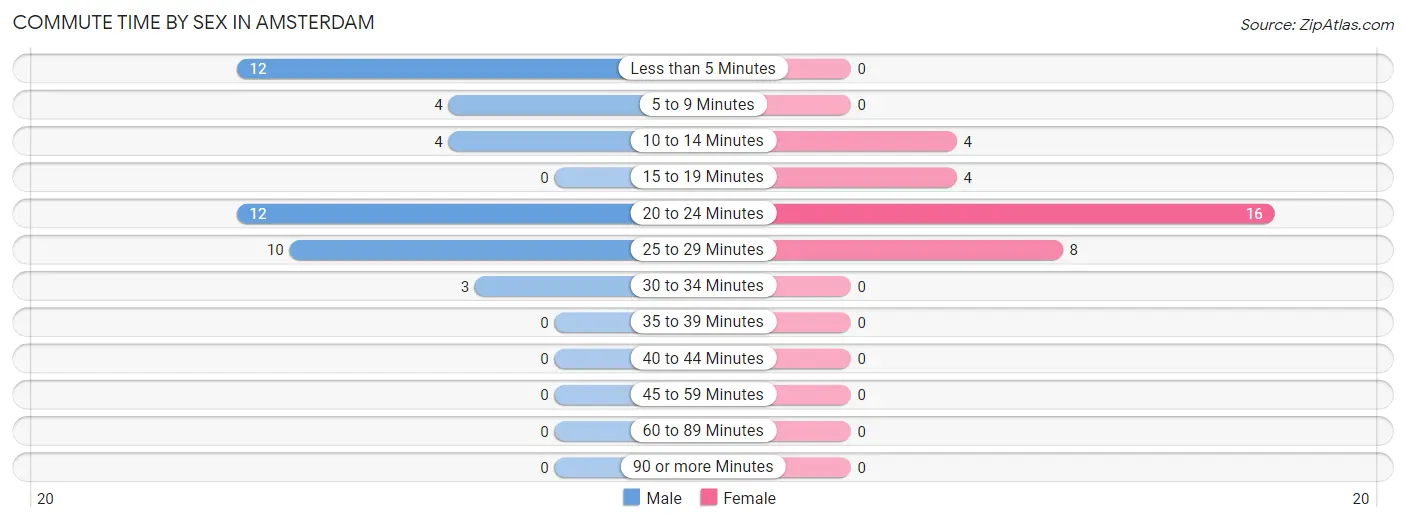
| Commute Time | Male | Female |
| Less than 5 Minutes | 12 (26.7%) | 0 (0.0%) |
| 5 to 9 Minutes | 4 (8.9%) | 0 (0.0%) |
| 10 to 14 Minutes | 4 (8.9%) | 4 (12.5%) |
| 15 to 19 Minutes | 0 (0.0%) | 4 (12.5%) |
| 20 to 24 Minutes | 12 (26.7%) | 16 (50.0%) |
| 25 to 29 Minutes | 10 (22.2%) | 8 (25.0%) |
| 30 to 34 Minutes | 3 (6.7%) | 0 (0.0%) |
| 35 to 39 Minutes | 0 (0.0%) | 0 (0.0%) |
| 40 to 44 Minutes | 0 (0.0%) | 0 (0.0%) |
| 45 to 59 Minutes | 0 (0.0%) | 0 (0.0%) |
| 60 to 89 Minutes | 0 (0.0%) | 0 (0.0%) |
| 90 or more Minutes | 0 (0.0%) | 0 (0.0%) |
Time of Departure to Work by Sex in Amsterdam
The most frequent times of departure to work in Amsterdam are 5:00 AM to 5:29 AM (9, 20.0%) for males and 9:00 AM to 9:59 AM (7, 21.9%) for females.
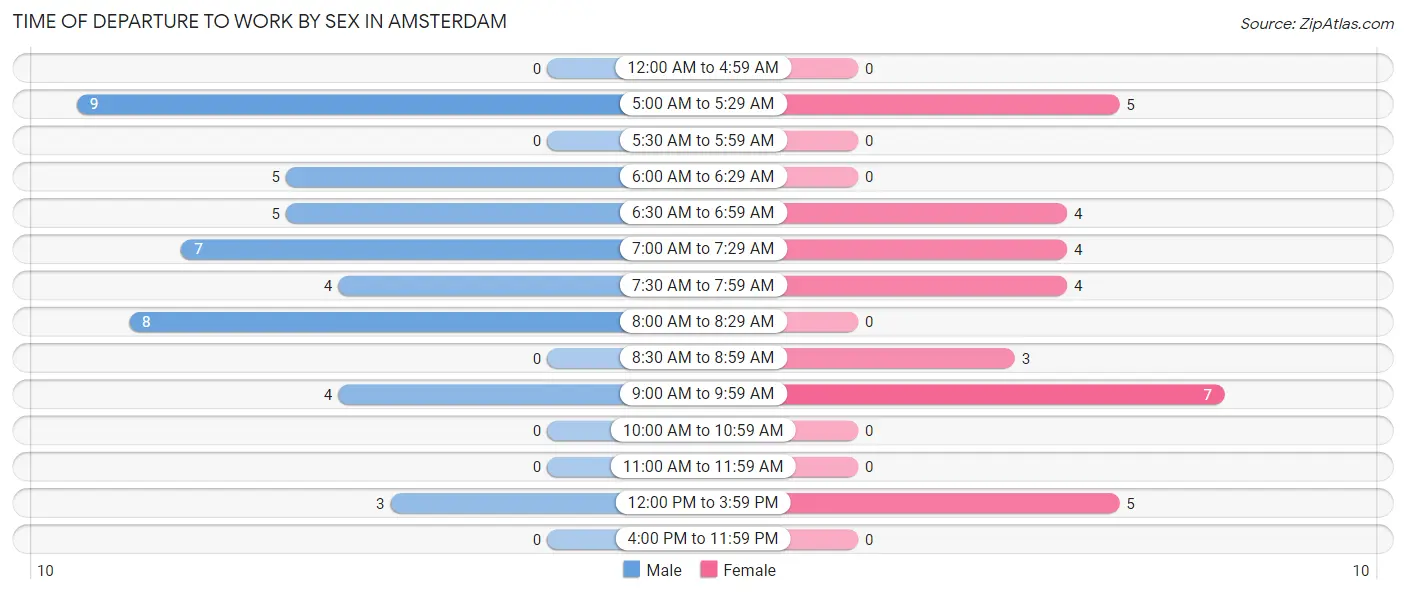
| Time of Departure | Male | Female |
| 12:00 AM to 4:59 AM | 0 (0.0%) | 0 (0.0%) |
| 5:00 AM to 5:29 AM | 9 (20.0%) | 5 (15.6%) |
| 5:30 AM to 5:59 AM | 0 (0.0%) | 0 (0.0%) |
| 6:00 AM to 6:29 AM | 5 (11.1%) | 0 (0.0%) |
| 6:30 AM to 6:59 AM | 5 (11.1%) | 4 (12.5%) |
| 7:00 AM to 7:29 AM | 7 (15.6%) | 4 (12.5%) |
| 7:30 AM to 7:59 AM | 4 (8.9%) | 4 (12.5%) |
| 8:00 AM to 8:29 AM | 8 (17.8%) | 0 (0.0%) |
| 8:30 AM to 8:59 AM | 0 (0.0%) | 3 (9.4%) |
| 9:00 AM to 9:59 AM | 4 (8.9%) | 7 (21.9%) |
| 10:00 AM to 10:59 AM | 0 (0.0%) | 0 (0.0%) |
| 11:00 AM to 11:59 AM | 0 (0.0%) | 0 (0.0%) |
| 12:00 PM to 3:59 PM | 3 (6.7%) | 5 (15.6%) |
| 4:00 PM to 11:59 PM | 0 (0.0%) | 0 (0.0%) |
| Total | 45 (100.0%) | 32 (100.0%) |
Housing Occupancy in Amsterdam
Occupancy by Ownership in Amsterdam
Of the total 52 dwellings in Amsterdam, owner-occupied units account for 48 (92.3%), while renter-occupied units make up 4 (7.7%).
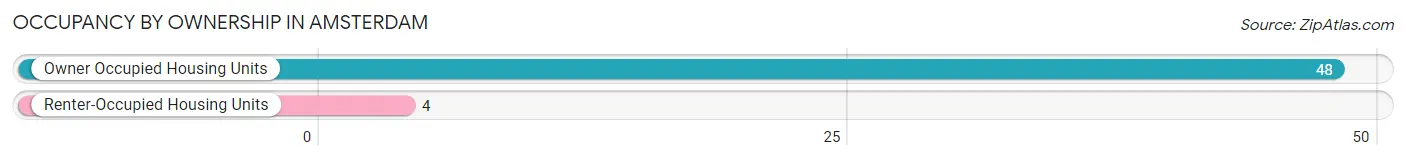
| Occupancy | # Housing Units | % Housing Units |
| Owner Occupied Housing Units | 48 | 92.3% |
| Renter-Occupied Housing Units | 4 | 7.7% |
| Total Occupied Housing Units | 52 | 100.0% |
Occupancy by Household Size in Amsterdam
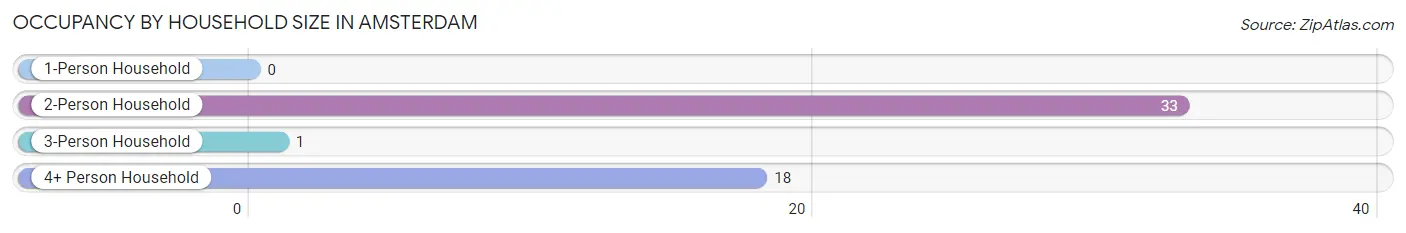
| Household Size | # Housing Units | % Housing Units |
| 1-Person Household | 0 | 0.0% |
| 2-Person Household | 33 | 63.5% |
| 3-Person Household | 1 | 1.9% |
| 4+ Person Household | 18 | 34.6% |
| Total Housing Units | 52 | 100.0% |
Occupancy by Ownership by Household Size in Amsterdam
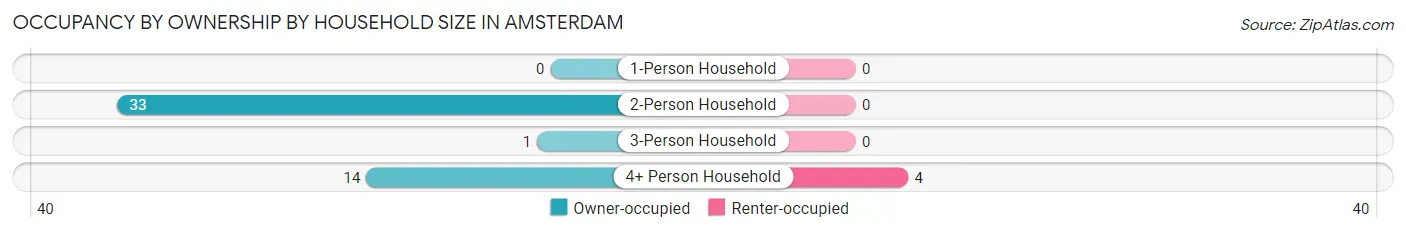
| Household Size | Owner-occupied | Renter-occupied |
| 1-Person Household | 0 (0.0%) | 0 (0.0%) |
| 2-Person Household | 33 (100.0%) | 0 (0.0%) |
| 3-Person Household | 1 (100.0%) | 0 (0.0%) |
| 4+ Person Household | 14 (77.8%) | 4 (22.2%) |
| Total Housing Units | 48 (92.3%) | 4 (7.7%) |
Occupancy by Educational Attainment in Amsterdam
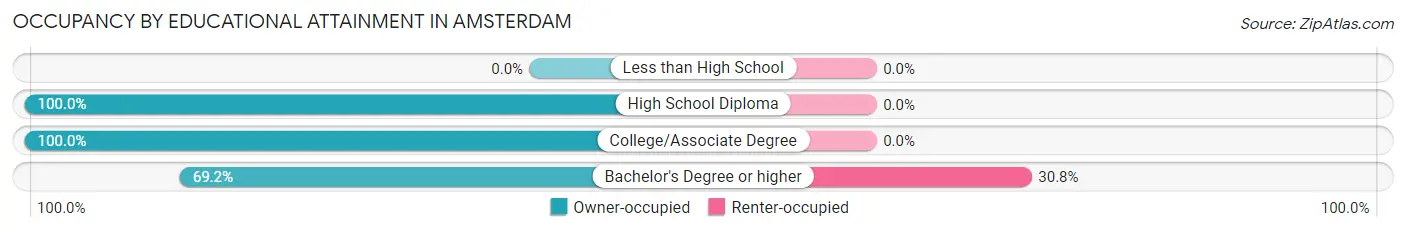
| Household Size | Owner-occupied | Renter-occupied |
| Less than High School | 0 (0.0%) | 0 (0.0%) |
| High School Diploma | 16 (100.0%) | 0 (0.0%) |
| College/Associate Degree | 23 (100.0%) | 0 (0.0%) |
| Bachelor's Degree or higher | 9 (69.2%) | 4 (30.8%) |
Occupancy by Age of Householder in Amsterdam
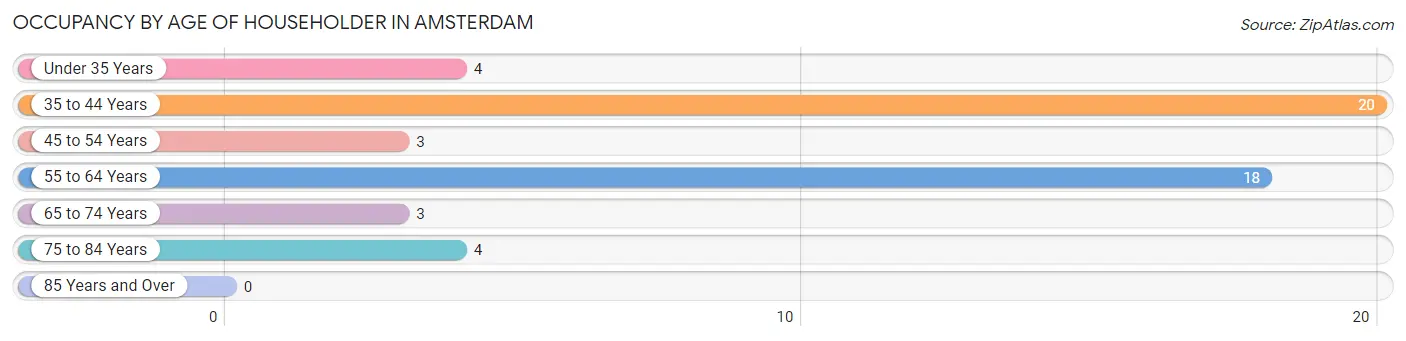
| Age Bracket | # Households | % Households |
| Under 35 Years | 4 | 7.7% |
| 35 to 44 Years | 20 | 38.5% |
| 45 to 54 Years | 3 | 5.8% |
| 55 to 64 Years | 18 | 34.6% |
| 65 to 74 Years | 3 | 5.8% |
| 75 to 84 Years | 4 | 7.7% |
| 85 Years and Over | 0 | 0.0% |
| Total | 52 | 100.0% |
Housing Finances in Amsterdam
Median Income by Occupancy in Amsterdam
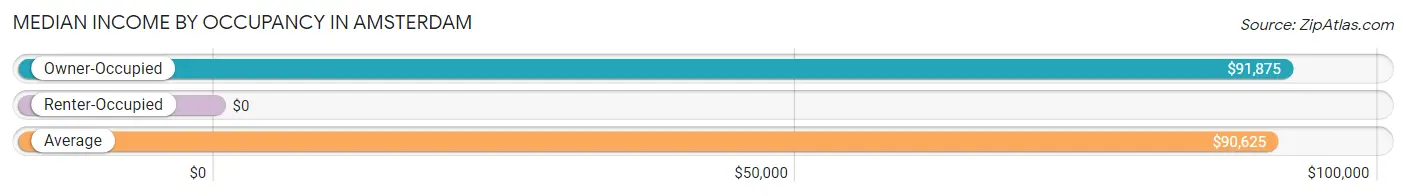
| Occupancy Type | # Households | Median Income |
| Owner-Occupied | 48 (92.3%) | $91,875 |
| Renter-Occupied | 4 (7.7%) | $0 |
| Average | 52 (100.0%) | $90,625 |
Occupancy by Householder Income Bracket in Amsterdam
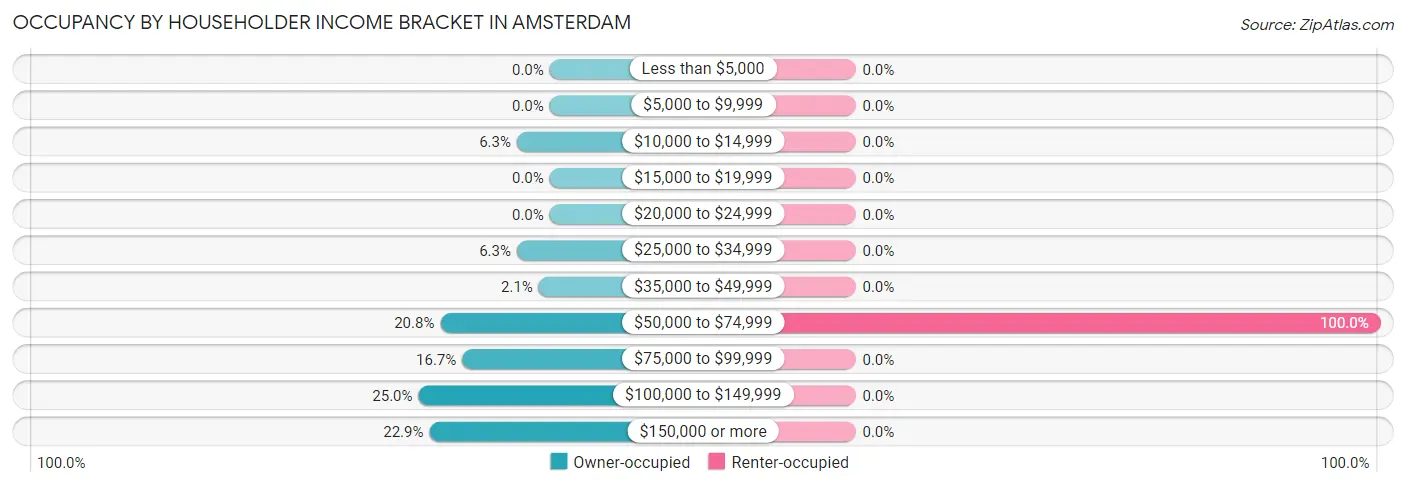
| Income Bracket | Owner-occupied | Renter-occupied |
| Less than $5,000 | 0 (0.0%) | 0 (0.0%) |
| $5,000 to $9,999 | 0 (0.0%) | 0 (0.0%) |
| $10,000 to $14,999 | 3 (6.2%) | 0 (0.0%) |
| $15,000 to $19,999 | 0 (0.0%) | 0 (0.0%) |
| $20,000 to $24,999 | 0 (0.0%) | 0 (0.0%) |
| $25,000 to $34,999 | 3 (6.2%) | 0 (0.0%) |
| $35,000 to $49,999 | 1 (2.1%) | 0 (0.0%) |
| $50,000 to $74,999 | 10 (20.8%) | 4 (100.0%) |
| $75,000 to $99,999 | 8 (16.7%) | 0 (0.0%) |
| $100,000 to $149,999 | 12 (25.0%) | 0 (0.0%) |
| $150,000 or more | 11 (22.9%) | 0 (0.0%) |
| Total | 48 (100.0%) | 4 (100.0%) |
Monthly Housing Cost Tiers in Amsterdam
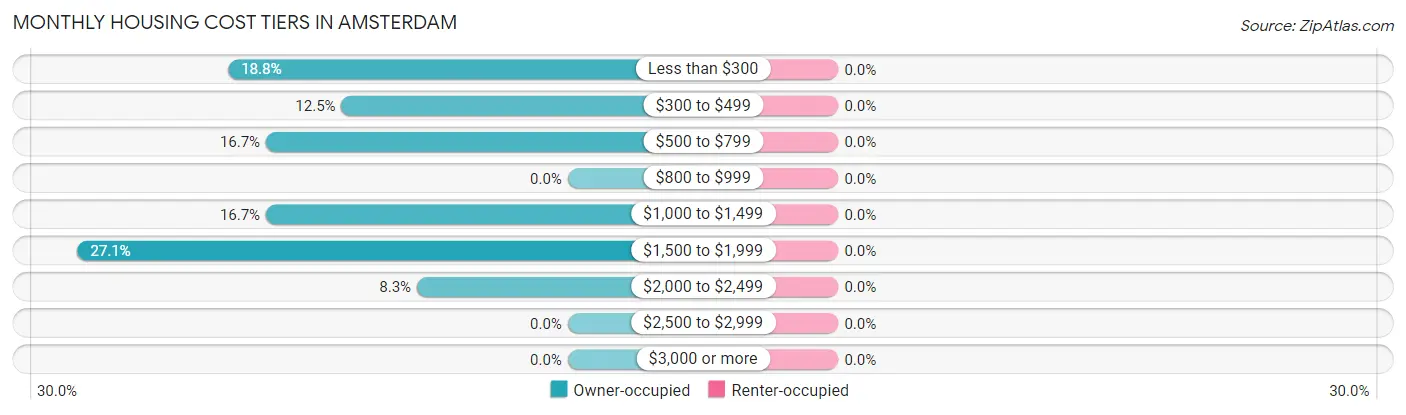
| Monthly Cost | Owner-occupied | Renter-occupied |
| Less than $300 | 9 (18.8%) | 0 (0.0%) |
| $300 to $499 | 6 (12.5%) | 0 (0.0%) |
| $500 to $799 | 8 (16.7%) | 0 (0.0%) |
| $800 to $999 | 0 (0.0%) | 0 (0.0%) |
| $1,000 to $1,499 | 8 (16.7%) | 0 (0.0%) |
| $1,500 to $1,999 | 13 (27.1%) | 0 (0.0%) |
| $2,000 to $2,499 | 4 (8.3%) | 0 (0.0%) |
| $2,500 to $2,999 | 0 (0.0%) | 0 (0.0%) |
| $3,000 or more | 0 (0.0%) | 0 (0.0%) |
| Total | 48 (100.0%) | 4 (100.0%) |
Physical Housing Characteristics in Amsterdam
Housing Structures in Amsterdam
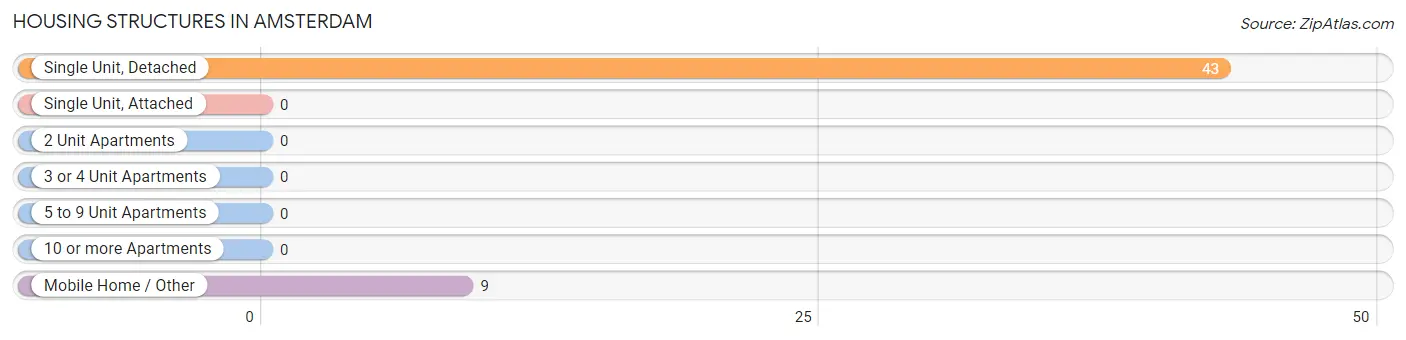
| Structure Type | # Housing Units | % Housing Units |
| Single Unit, Detached | 43 | 82.7% |
| Single Unit, Attached | 0 | 0.0% |
| 2 Unit Apartments | 0 | 0.0% |
| 3 or 4 Unit Apartments | 0 | 0.0% |
| 5 to 9 Unit Apartments | 0 | 0.0% |
| 10 or more Apartments | 0 | 0.0% |
| Mobile Home / Other | 9 | 17.3% |
| Total | 52 | 100.0% |
Housing Structures by Occupancy in Amsterdam
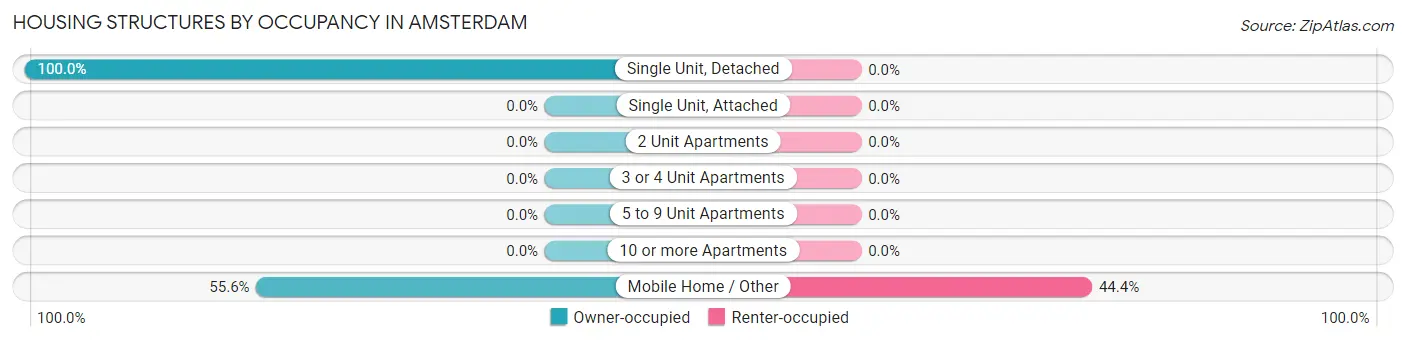
| Structure Type | Owner-occupied | Renter-occupied |
| Single Unit, Detached | 43 (100.0%) | 0 (0.0%) |
| Single Unit, Attached | 0 (0.0%) | 0 (0.0%) |
| 2 Unit Apartments | 0 (0.0%) | 0 (0.0%) |
| 3 or 4 Unit Apartments | 0 (0.0%) | 0 (0.0%) |
| 5 to 9 Unit Apartments | 0 (0.0%) | 0 (0.0%) |
| 10 or more Apartments | 0 (0.0%) | 0 (0.0%) |
| Mobile Home / Other | 5 (55.6%) | 4 (44.4%) |
| Total | 48 (92.3%) | 4 (7.7%) |
Housing Structures by Number of Rooms in Amsterdam
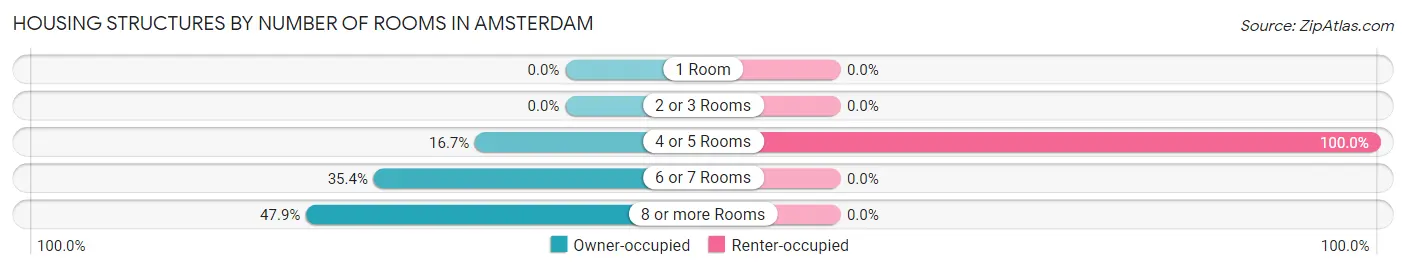
| Number of Rooms | Owner-occupied | Renter-occupied |
| 1 Room | 0 (0.0%) | 0 (0.0%) |
| 2 or 3 Rooms | 0 (0.0%) | 0 (0.0%) |
| 4 or 5 Rooms | 8 (16.7%) | 4 (100.0%) |
| 6 or 7 Rooms | 17 (35.4%) | 0 (0.0%) |
| 8 or more Rooms | 23 (47.9%) | 0 (0.0%) |
| Total | 48 (100.0%) | 4 (100.0%) |
Housing Structure by Heating Type in Amsterdam
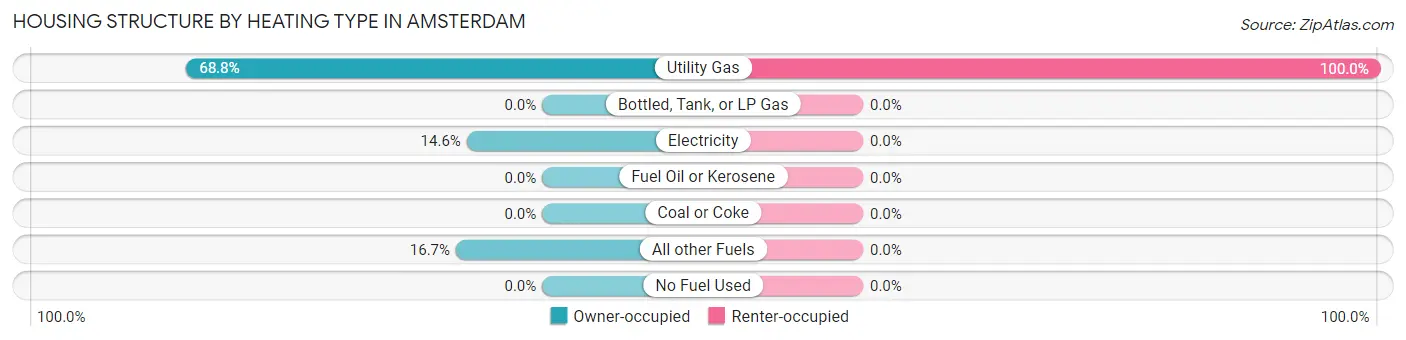
| Heating Type | Owner-occupied | Renter-occupied |
| Utility Gas | 33 (68.8%) | 4 (100.0%) |
| Bottled, Tank, or LP Gas | 0 (0.0%) | 0 (0.0%) |
| Electricity | 7 (14.6%) | 0 (0.0%) |
| Fuel Oil or Kerosene | 0 (0.0%) | 0 (0.0%) |
| Coal or Coke | 0 (0.0%) | 0 (0.0%) |
| All other Fuels | 8 (16.7%) | 0 (0.0%) |
| No Fuel Used | 0 (0.0%) | 0 (0.0%) |
| Total | 48 (100.0%) | 4 (100.0%) |
Household Vehicle Usage in Amsterdam
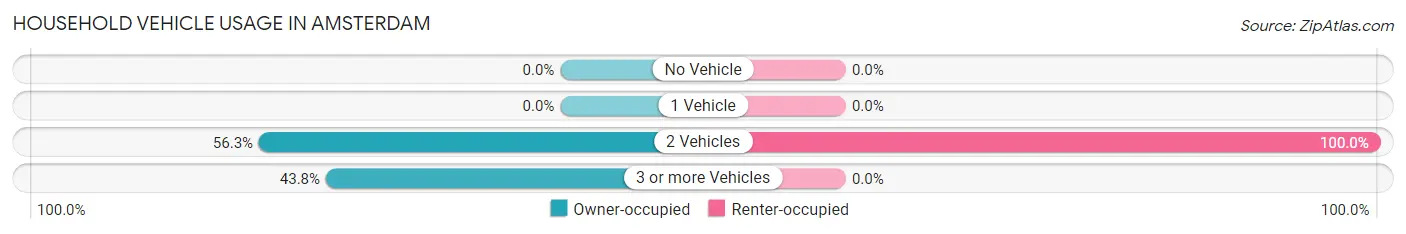
| Vehicles per Household | Owner-occupied | Renter-occupied |
| No Vehicle | 0 (0.0%) | 0 (0.0%) |
| 1 Vehicle | 0 (0.0%) | 0 (0.0%) |
| 2 Vehicles | 27 (56.2%) | 4 (100.0%) |
| 3 or more Vehicles | 21 (43.8%) | 0 (0.0%) |
| Total | 48 (100.0%) | 4 (100.0%) |
Real Estate & Mortgages in Amsterdam
Real Estate and Mortgage Overview in Amsterdam
| Characteristic | Without Mortgage | With Mortgage |
| Housing Units | 26 | 22 |
| Median Property Value | $316,700 | $286,700 |
| Median Household Income | $141,500 | $0 |
| Monthly Housing Costs | $433 | $0 |
| Real Estate Taxes | $2,091 | $5 |
Property Value by Mortgage Status in Amsterdam
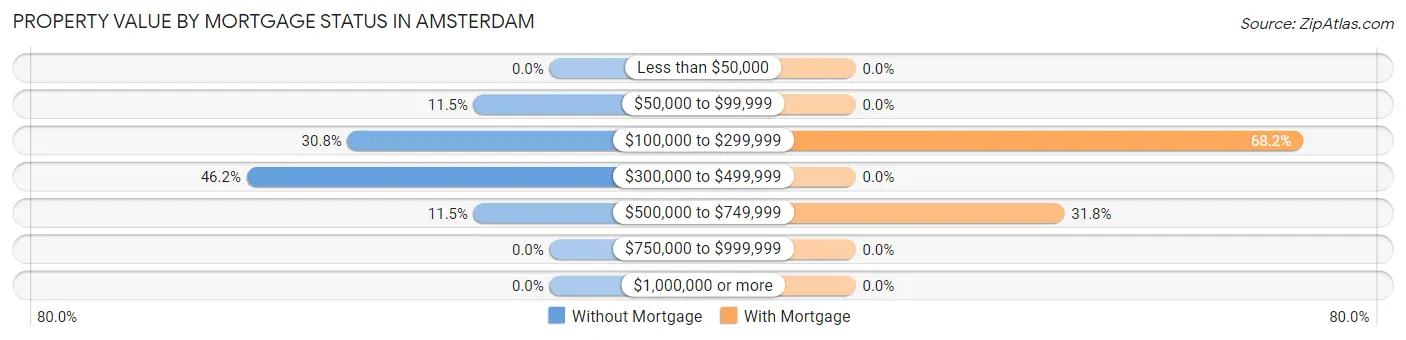
| Property Value | Without Mortgage | With Mortgage |
| Less than $50,000 | 0 (0.0%) | 0 (0.0%) |
| $50,000 to $99,999 | 3 (11.5%) | 0 (0.0%) |
| $100,000 to $299,999 | 8 (30.8%) | 15 (68.2%) |
| $300,000 to $499,999 | 12 (46.2%) | 0 (0.0%) |
| $500,000 to $749,999 | 3 (11.5%) | 7 (31.8%) |
| $750,000 to $999,999 | 0 (0.0%) | 0 (0.0%) |
| $1,000,000 or more | 0 (0.0%) | 0 (0.0%) |
| Total | 26 (100.0%) | 22 (100.0%) |
Household Income by Mortgage Status in Amsterdam
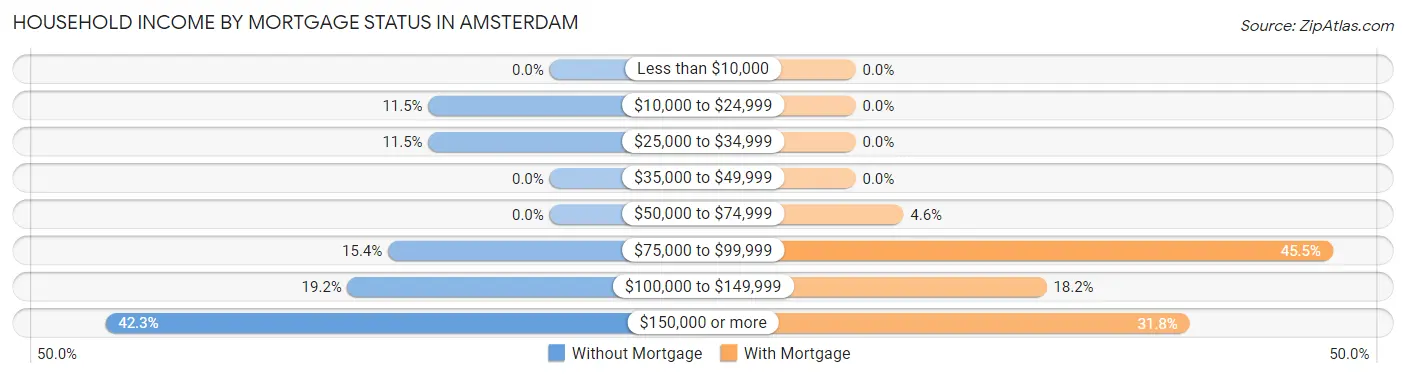
| Household Income | Without Mortgage | With Mortgage |
| Less than $10,000 | 0 (0.0%) | 0 (0.0%) |
| $10,000 to $24,999 | 3 (11.5%) | 0 (0.0%) |
| $25,000 to $34,999 | 3 (11.5%) | 0 (0.0%) |
| $35,000 to $49,999 | 0 (0.0%) | 0 (0.0%) |
| $50,000 to $74,999 | 0 (0.0%) | 1 (4.5%) |
| $75,000 to $99,999 | 4 (15.4%) | 10 (45.5%) |
| $100,000 to $149,999 | 5 (19.2%) | 4 (18.2%) |
| $150,000 or more | 11 (42.3%) | 7 (31.8%) |
| Total | 26 (100.0%) | 22 (100.0%) |
Property Value to Household Income Ratio in Amsterdam
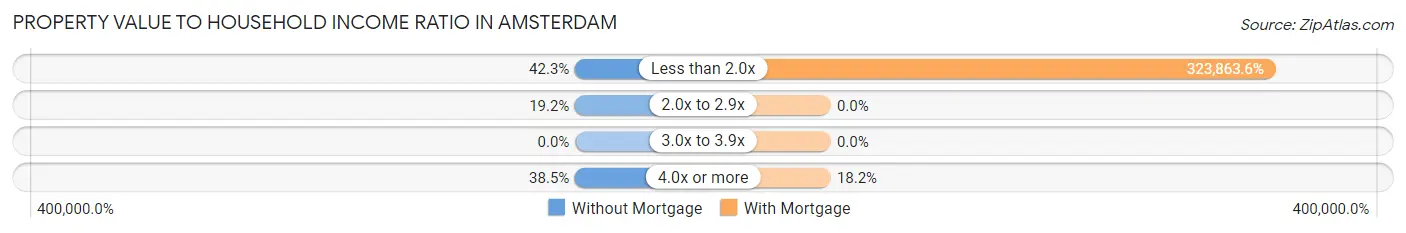
| Value-to-Income Ratio | Without Mortgage | With Mortgage |
| Less than 2.0x | 11 (42.3%) | 71,250 (323,863.6%) |
| 2.0x to 2.9x | 5 (19.2%) | 0 (0.0%) |
| 3.0x to 3.9x | 0 (0.0%) | 0 (0.0%) |
| 4.0x or more | 10 (38.5%) | 4 (18.2%) |
| Total | 26 (100.0%) | 22 (100.0%) |
Real Estate Taxes by Mortgage Status in Amsterdam
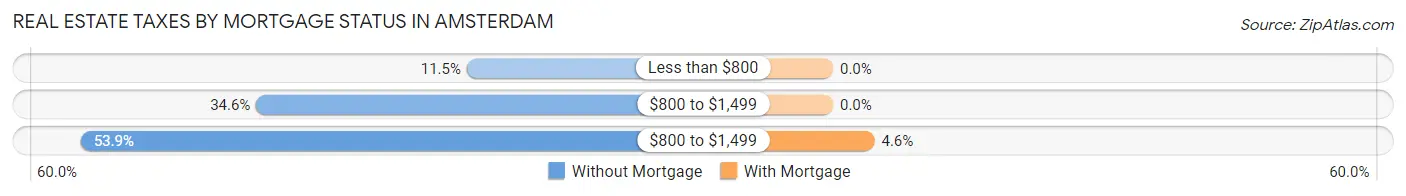
| Property Taxes | Without Mortgage | With Mortgage |
| Less than $800 | 3 (11.5%) | 0 (0.0%) |
| $800 to $1,499 | 9 (34.6%) | 0 (0.0%) |
| $800 to $1,499 | 14 (53.8%) | 1 (4.5%) |
| Total | 26 (100.0%) | 22 (100.0%) |
Health & Disability in Amsterdam
Health Insurance Coverage by Age in Amsterdam
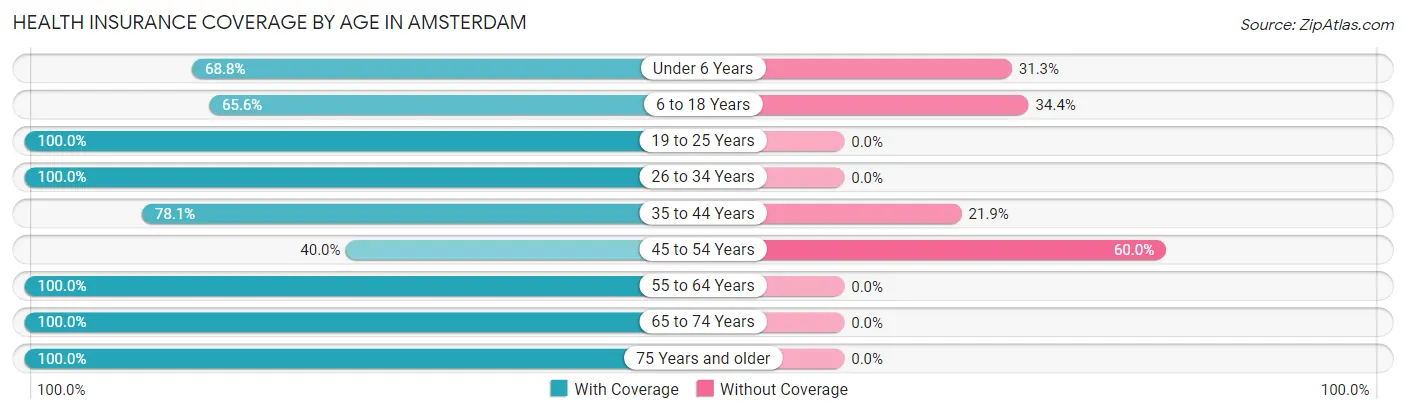
| Age Bracket | With Coverage | Without Coverage |
| Under 6 Years | 11 (68.8%) | 5 (31.2%) |
| 6 to 18 Years | 21 (65.6%) | 11 (34.4%) |
| 19 to 25 Years | 4 (100.0%) | 0 (0.0%) |
| 26 to 34 Years | 12 (100.0%) | 0 (0.0%) |
| 35 to 44 Years | 25 (78.1%) | 7 (21.9%) |
| 45 to 54 Years | 4 (40.0%) | 6 (60.0%) |
| 55 to 64 Years | 40 (100.0%) | 0 (0.0%) |
| 65 to 74 Years | 7 (100.0%) | 0 (0.0%) |
| 75 Years and older | 7 (100.0%) | 0 (0.0%) |
| Total | 131 (81.9%) | 29 (18.1%) |
Health Insurance Coverage by Citizenship Status in Amsterdam

| Citizenship Status | With Coverage | Without Coverage |
| Native Born | 11 (68.8%) | 5 (31.2%) |
| Foreign Born, Citizen | 21 (65.6%) | 11 (34.4%) |
| Foreign Born, not a Citizen | 4 (100.0%) | 0 (0.0%) |
Health Insurance Coverage by Household Income in Amsterdam
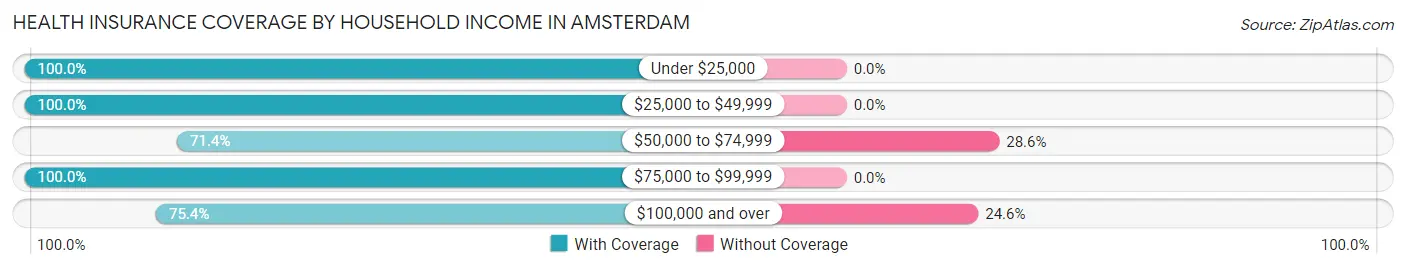
| Household Income | With Coverage | Without Coverage |
| Under $25,000 | 6 (100.0%) | 0 (0.0%) |
| $25,000 to $49,999 | 27 (100.0%) | 0 (0.0%) |
| $50,000 to $74,999 | 30 (71.4%) | 12 (28.6%) |
| $75,000 to $99,999 | 16 (100.0%) | 0 (0.0%) |
| $100,000 and over | 52 (75.4%) | 17 (24.6%) |
Public vs Private Health Insurance Coverage by Age in Amsterdam
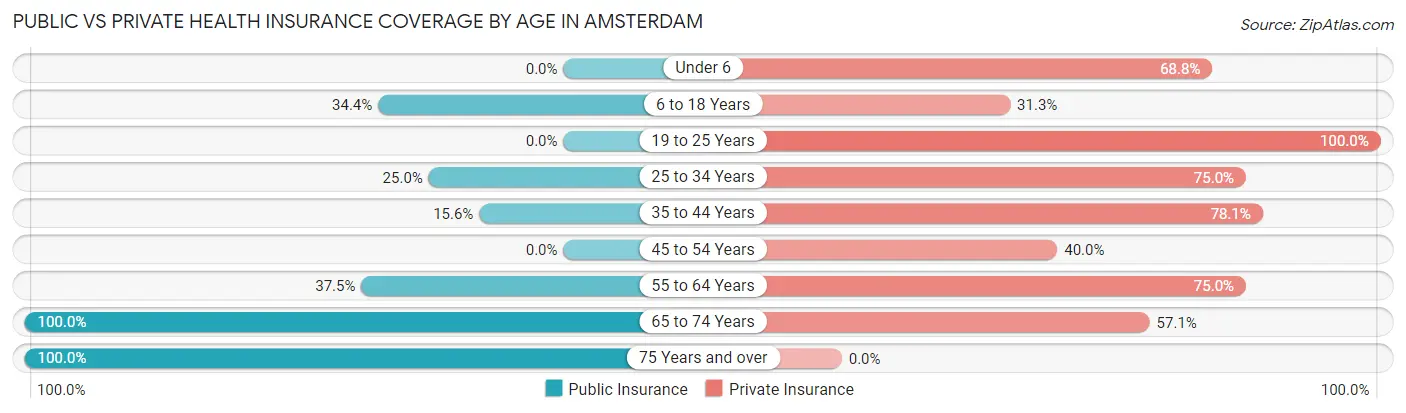
| Age Bracket | Public Insurance | Private Insurance |
| Under 6 | 0 (0.0%) | 11 (68.8%) |
| 6 to 18 Years | 11 (34.4%) | 10 (31.2%) |
| 19 to 25 Years | 0 (0.0%) | 4 (100.0%) |
| 25 to 34 Years | 3 (25.0%) | 9 (75.0%) |
| 35 to 44 Years | 5 (15.6%) | 25 (78.1%) |
| 45 to 54 Years | 0 (0.0%) | 4 (40.0%) |
| 55 to 64 Years | 15 (37.5%) | 30 (75.0%) |
| 65 to 74 Years | 7 (100.0%) | 4 (57.1%) |
| 75 Years and over | 7 (100.0%) | 0 (0.0%) |
| Total | 48 (30.0%) | 97 (60.6%) |
Disability Status by Sex by Age in Amsterdam
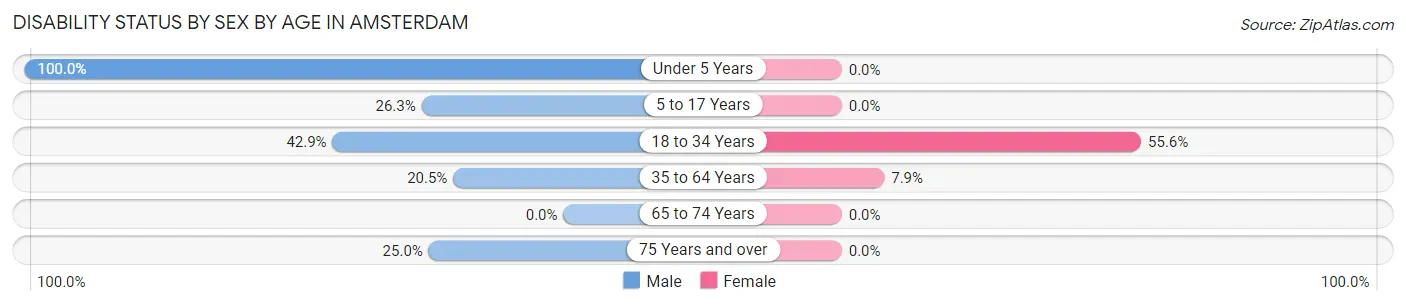
| Age Bracket | Male | Female |
| Under 5 Years | 5 (100.0%) | 0 (0.0%) |
| 5 to 17 Years | 5 (26.3%) | 0 (0.0%) |
| 18 to 34 Years | 3 (42.9%) | 5 (55.6%) |
| 35 to 64 Years | 9 (20.4%) | 3 (7.9%) |
| 65 to 74 Years | 0 (0.0%) | 0 (0.0%) |
| 75 Years and over | 1 (25.0%) | 0 (0.0%) |
Disability Class by Sex by Age in Amsterdam
Disability Class: Hearing Difficulty
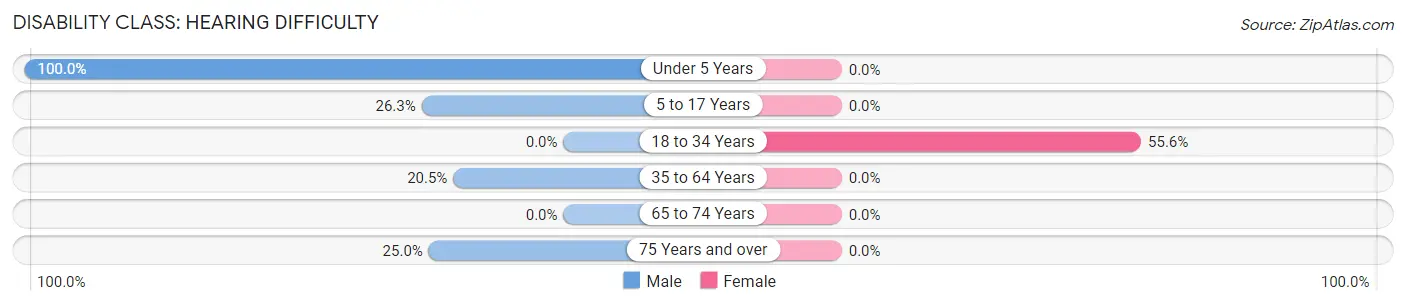
| Age Bracket | Male | Female |
| Under 5 Years | 5 (100.0%) | 0 (0.0%) |
| 5 to 17 Years | 5 (26.3%) | 0 (0.0%) |
| 18 to 34 Years | 0 (0.0%) | 5 (55.6%) |
| 35 to 64 Years | 9 (20.4%) | 0 (0.0%) |
| 65 to 74 Years | 0 (0.0%) | 0 (0.0%) |
| 75 Years and over | 1 (25.0%) | 0 (0.0%) |
Disability Class: Vision Difficulty
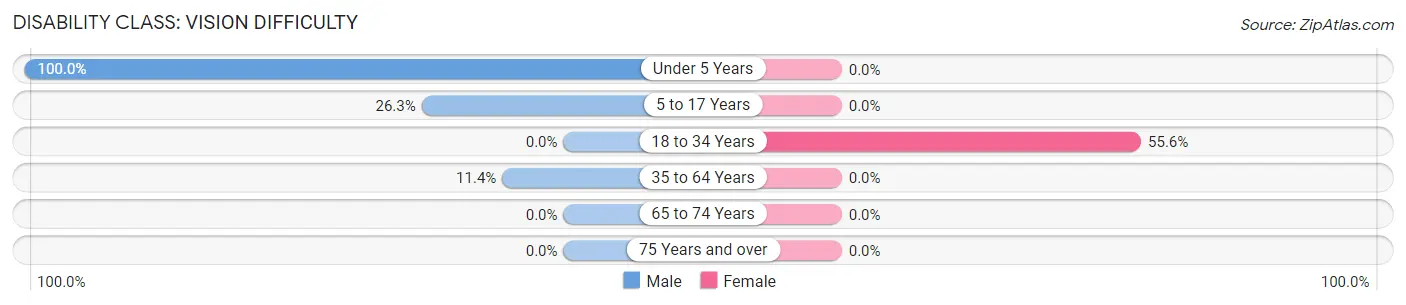
| Age Bracket | Male | Female |
| Under 5 Years | 5 (100.0%) | 0 (0.0%) |
| 5 to 17 Years | 5 (26.3%) | 0 (0.0%) |
| 18 to 34 Years | 0 (0.0%) | 5 (55.6%) |
| 35 to 64 Years | 5 (11.4%) | 0 (0.0%) |
| 65 to 74 Years | 0 (0.0%) | 0 (0.0%) |
| 75 Years and over | 0 (0.0%) | 0 (0.0%) |
Disability Class: Cognitive Difficulty
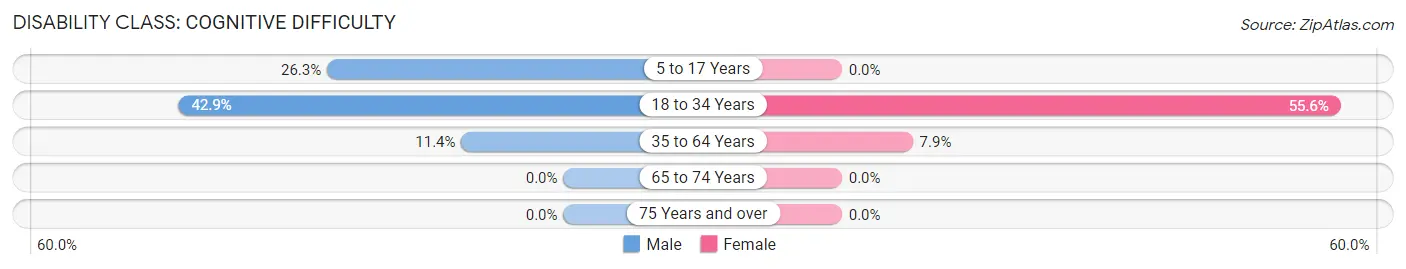
| Age Bracket | Male | Female |
| 5 to 17 Years | 5 (26.3%) | 0 (0.0%) |
| 18 to 34 Years | 3 (42.9%) | 5 (55.6%) |
| 35 to 64 Years | 5 (11.4%) | 3 (7.9%) |
| 65 to 74 Years | 0 (0.0%) | 0 (0.0%) |
| 75 Years and over | 0 (0.0%) | 0 (0.0%) |
Disability Class: Ambulatory Difficulty
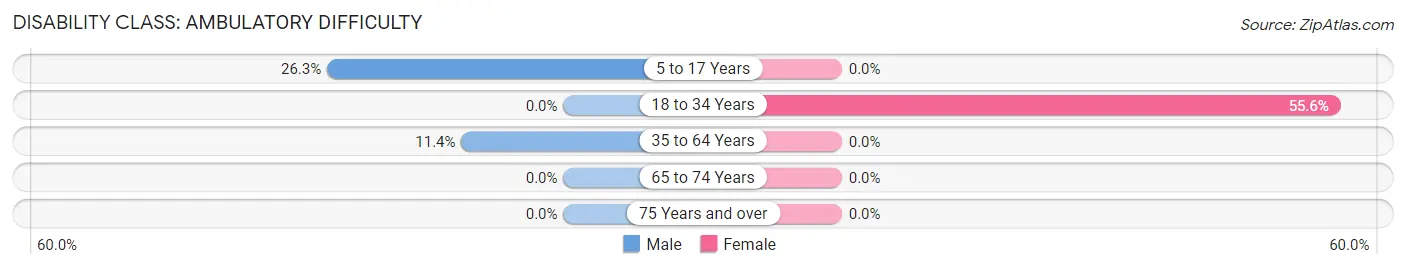
| Age Bracket | Male | Female |
| 5 to 17 Years | 5 (26.3%) | 0 (0.0%) |
| 18 to 34 Years | 0 (0.0%) | 5 (55.6%) |
| 35 to 64 Years | 5 (11.4%) | 0 (0.0%) |
| 65 to 74 Years | 0 (0.0%) | 0 (0.0%) |
| 75 Years and over | 0 (0.0%) | 0 (0.0%) |
Disability Class: Self-Care Difficulty

| Age Bracket | Male | Female |
| 5 to 17 Years | 5 (26.3%) | 0 (0.0%) |
| 18 to 34 Years | 0 (0.0%) | 5 (55.6%) |
| 35 to 64 Years | 5 (11.4%) | 0 (0.0%) |
| 65 to 74 Years | 0 (0.0%) | 0 (0.0%) |
| 75 Years and over | 0 (0.0%) | 0 (0.0%) |
Technology Access in Amsterdam
Computing Device Access in Amsterdam
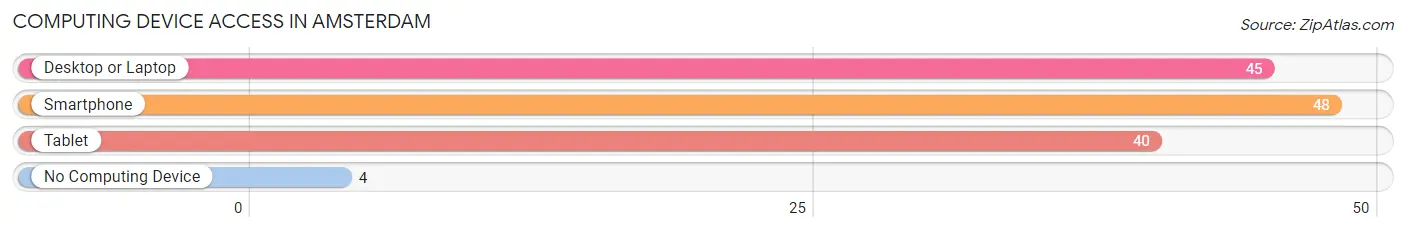
| Device Type | # Households | % Households |
| Desktop or Laptop | 45 | 86.5% |
| Smartphone | 48 | 92.3% |
| Tablet | 40 | 76.9% |
| No Computing Device | 4 | 7.7% |
| Total | 52 | 100.0% |
Internet Access in Amsterdam
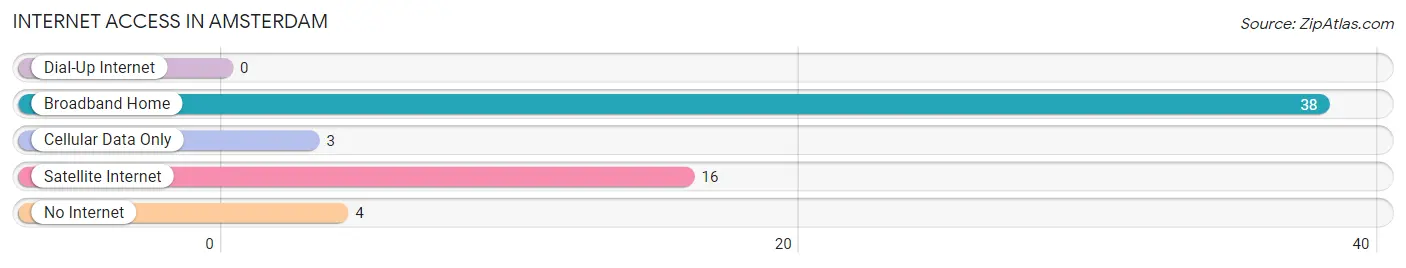
| Internet Type | # Households | % Households |
| Dial-Up Internet | 0 | 0.0% |
| Broadband Home | 38 | 73.1% |
| Cellular Data Only | 3 | 5.8% |
| Satellite Internet | 16 | 30.8% |
| No Internet | 4 | 7.7% |
| Total | 52 | 100.0% |
Amsterdam Summary
Amsterdam is a small city located in the Dutch province of North Holland. It is the capital of the Netherlands and the largest city in the country. Amsterdam is known for its canals, its vibrant nightlife, its art and culture, and its unique architecture. Amsterdam is also a major financial and cultural center, and is home to many international companies and organizations.
Geography
Amsterdam is located in the western part of the Netherlands, in the province of North Holland. It is situated on the banks of the IJ river, which flows into the North Sea. The city is surrounded by a number of canals, which are connected to the IJ river. The city is divided into seven boroughs, each with its own distinct character. The city center is located in the borough of Amsterdam-Centrum, which is home to many of the city’s most famous attractions, such as the Anne Frank House, the Royal Palace, and the Van Gogh Museum.
Economy
Amsterdam is one of the most important economic centers in Europe. It is home to many international companies and organizations, such as the European Union, the International Criminal Court, and the International Court of Justice. The city is also a major financial center, with the Amsterdam Stock Exchange being one of the oldest in the world. The city is also a major hub for the creative industries, with many advertising, design, and media companies based in the city.
Demographics
As of 2020, Amsterdam had a population of 872,000 people. The majority of the population is of Dutch descent, with other ethnic groups including Turks, Moroccans, Surinamese, and Indonesians. The city is also home to a large number of international students and expatriates. The city is known for its tolerant and open-minded attitude towards different cultures and lifestyles.
History
Amsterdam was founded in the late 12th century by a group of fishermen. The city quickly grew in importance, becoming a major trading center in the 16th century. During this period, Amsterdam was a major center of the Dutch Golden Age, with the city becoming a major hub for trade, science, and the arts. In the 19th century, the city became an important industrial center, with many factories and warehouses being built in the city. In the 20th century, Amsterdam became a major tourist destination, with many of its famous attractions, such as the Anne Frank House, the Royal Palace, and the Van Gogh Museum, becoming popular destinations for visitors from around the world.
Common Questions
What is Per Capita Income in Amsterdam?
Per Capita income in Amsterdam is $34,971.
What is the Median Family Income in Amsterdam?
Median Family Income in Amsterdam is $81,875.
What is the Median Household income in Amsterdam?
Median Household Income in Amsterdam is $90,625.
What is Income or Wage Gap in Amsterdam?
Income or Wage Gap in Amsterdam is 52.4%.
Women in Amsterdam earn 47.6 cents for every dollar earned by a man.
What is Inequality or Gini Index in Amsterdam?
Inequality or Gini Index in Amsterdam is 0.37.
What is the Total Population of Amsterdam?
Total Population of Amsterdam is 160.
What is the Total Male Population of Amsterdam?
Total Male Population of Amsterdam is 83.
What is the Total Female Population of Amsterdam?
Total Female Population of Amsterdam is 77.
What is the Ratio of Males per 100 Females in Amsterdam?
There are 107.79 Males per 100 Females in Amsterdam.
What is the Ratio of Females per 100 Males in Amsterdam?
There are 92.77 Females per 100 Males in Amsterdam.
What is the Median Population Age in Amsterdam?
Median Population Age in Amsterdam is 40.5 Years.
What is the Average Family Size in Amsterdam
Average Family Size in Amsterdam is 2.8 People.
What is the Average Household Size in Amsterdam
Average Household Size in Amsterdam is 3.1 People.
How Large is the Labor Force in Amsterdam?
There are 80 People in the Labor Forcein in Amsterdam.
What is the Percentage of People in the Labor Force in Amsterdam?
66.7% of People are in the Labor Force in Amsterdam.