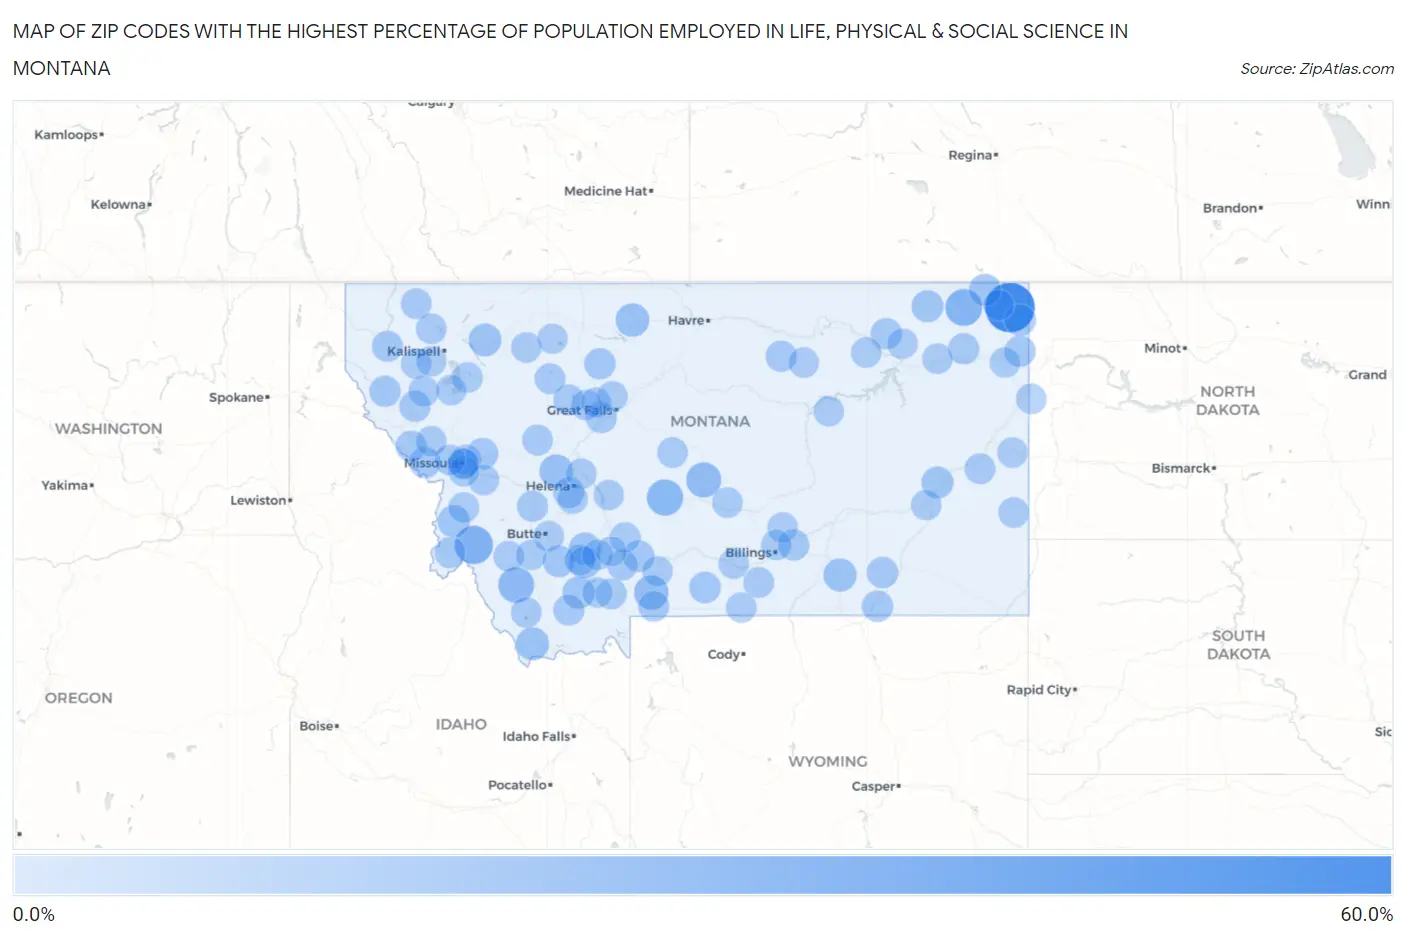
Zip Codes with the Highest Percentage of Population Employed in Life, Physical & Social Science in Montana
RELATED REPORTS & OPTIONS
Life, Physical & Social Science
Montana
Compare Zip Codes
Map of Zip Codes with the Highest Percentage of Population Employed in Life, Physical & Social Science in Montana
0.0%
60.0%
Zip Codes with the Highest Percentage of Population Employed in Life, Physical & Social Science in Montana
| Zip Code | % Employed | vs State | vs National | |
| 1. | 59211 | 53.2% | 1.5%(+51.8)#1 | 1.1%(+52.2)#3 |
| 2. | 59871 | 22.5% | 1.5%(+21.0)#2 | 1.1%(+21.4)#48 |
| 3. | 59222 | 18.3% | 1.5%(+16.9)#3 | 1.1%(+17.3)#74 |
| 4. | 59053 | 16.8% | 1.5%(+15.3)#4 | 1.1%(+15.7)#87 |
| 5. | 59746 | 15.4% | 1.5%(+13.9)#5 | 1.1%(+14.3)#98 |
| 6. | 59453 | 13.5% | 1.5%(+12.1)#6 | 1.1%(+12.4)#123 |
| 7. | 59065 | 11.9% | 1.5%(+10.4)#7 | 1.1%(+10.8)#147 |
| 8. | 59640 | 9.8% | 1.5%(+8.28)#8 | 1.1%(+8.67)#217 |
| 9. | 59522 | 9.5% | 1.5%(+7.98)#9 | 1.1%(+8.37)#230 |
| 10. | 59031 | 8.6% | 1.5%(+7.14)#10 | 1.1%(+7.53)#274 |
| 11. | 59724 | 8.3% | 1.5%(+6.85)#11 | 1.1%(+7.24)#302 |
| 12. | 59916 | 7.5% | 1.5%(+6.07)#12 | 1.1%(+6.46)#358 |
| 13. | 59721 | 6.7% | 1.5%(+5.19)#13 | 1.1%(+5.58)#446 |
| 14. | 59755 | 6.6% | 1.5%(+5.08)#14 | 1.1%(+5.47)#462 |
| 15. | 59840 | 6.1% | 1.5%(+4.64)#15 | 1.1%(+5.03)#530 |
| 16. | 59252 | 5.9% | 1.5%(+4.40)#16 | 1.1%(+4.79)#561 |
| 17. | 59338 | 5.3% | 1.5%(+3.85)#17 | 1.1%(+4.24)#675 |
| 18. | 59253 | 5.3% | 1.5%(+3.78)#18 | 1.1%(+4.17)#698 |
| 19. | 59735 | 4.9% | 1.5%(+3.45)#19 | 1.1%(+3.84)#780 |
| 20. | 59751 | 4.8% | 1.5%(+3.28)#20 | 1.1%(+3.67)#830 |
| 21. | 59219 | 4.5% | 1.5%(+3.07)#21 | 1.1%(+3.45)#911 |
| 22. | 59715 | 4.3% | 1.5%(+2.85)#22 | 1.1%(+3.24)#987 |
| 23. | 59028 | 4.1% | 1.5%(+2.64)#23 | 1.1%(+3.03)#1,092 |
| 24. | 59823 | 4.0% | 1.5%(+2.49)#24 | 1.1%(+2.88)#1,169 |
| 25. | 59873 | 3.8% | 1.5%(+2.29)#25 | 1.1%(+2.68)#1,279 |
| 26. | 59416 | 3.7% | 1.5%(+2.26)#26 | 1.1%(+2.65)#1,294 |
| 27. | 59025 | 3.7% | 1.5%(+2.22)#27 | 1.1%(+2.61)#1,316 |
| 28. | 59859 | 3.7% | 1.5%(+2.22)#28 | 1.1%(+2.61)#1,319 |
| 29. | 59043 | 3.6% | 1.5%(+2.16)#29 | 1.1%(+2.55)#1,349 |
| 30. | 59231 | 3.5% | 1.5%(+2.05)#30 | 1.1%(+2.44)#1,406 |
| 31. | 59829 | 3.5% | 1.5%(+1.99)#31 | 1.1%(+2.38)#1,443 |
| 32. | 59037 | 3.4% | 1.5%(+1.93)#32 | 1.1%(+2.32)#1,496 |
| 33. | 59747 | 3.2% | 1.5%(+1.75)#33 | 1.1%(+2.13)#1,649 |
| 34. | 59255 | 3.2% | 1.5%(+1.70)#34 | 1.1%(+2.09)#1,685 |
| 35. | 59212 | 3.2% | 1.5%(+1.67)#35 | 1.1%(+2.06)#1,706 |
| 36. | 59524 | 3.1% | 1.5%(+1.66)#36 | 1.1%(+2.05)#1,711 |
| 37. | 59485 | 3.1% | 1.5%(+1.65)#37 | 1.1%(+2.04)#1,720 |
| 38. | 59820 | 3.1% | 1.5%(+1.61)#38 | 1.1%(+2.00)#1,776 |
| 39. | 59601 | 3.1% | 1.5%(+1.59)#39 | 1.1%(+1.98)#1,788 |
| 40. | 59872 | 3.0% | 1.5%(+1.51)#40 | 1.1%(+1.90)#1,883 |
| 41. | 59722 | 3.0% | 1.5%(+1.51)#41 | 1.1%(+1.90)#1,888 |
| 42. | 59923 | 2.9% | 1.5%(+1.39)#42 | 1.1%(+1.78)#2,036 |
| 43. | 59436 | 2.8% | 1.5%(+1.28)#43 | 1.1%(+1.66)#2,170 |
| 44. | 59801 | 2.7% | 1.5%(+1.26)#44 | 1.1%(+1.64)#2,197 |
| 45. | 59710 | 2.7% | 1.5%(+1.17)#45 | 1.1%(+1.56)#2,307 |
| 46. | 59716 | 2.6% | 1.5%(+1.11)#46 | 1.1%(+1.50)#2,402 |
| 47. | 59802 | 2.4% | 1.5%(+0.933)#47 | 1.1%(+1.32)#2,733 |
| 48. | 59029 | 2.3% | 1.5%(+0.840)#48 | 1.1%(+1.23)#2,910 |
| 49. | 59825 | 2.3% | 1.5%(+0.826)#49 | 1.1%(+1.21)#2,951 |
| 50. | 59030 | 2.2% | 1.5%(+0.759)#50 | 1.1%(+1.15)#3,087 |
| 51. | 59639 | 2.2% | 1.5%(+0.734)#51 | 1.1%(+1.12)#3,148 |
| 52. | 59918 | 2.2% | 1.5%(+0.723)#52 | 1.1%(+1.11)#3,173 |
| 53. | 59326 | 2.2% | 1.5%(+0.694)#53 | 1.1%(+1.08)#3,240 |
| 54. | 59718 | 2.2% | 1.5%(+0.683)#54 | 1.1%(+1.07)#3,269 |
| 55. | 59911 | 2.1% | 1.5%(+0.639)#55 | 1.1%(+1.03)#3,374 |
| 56. | 59848 | 2.0% | 1.5%(+0.520)#56 | 1.1%(+0.909)#3,690 |
| 57. | 59422 | 1.9% | 1.5%(+0.432)#57 | 1.1%(+0.821)#3,938 |
| 58. | 59762 | 1.8% | 1.5%(+0.338)#58 | 1.1%(+0.727)#4,268 |
| 59. | 59725 | 1.8% | 1.5%(+0.326)#59 | 1.1%(+0.715)#4,301 |
| 60. | 59479 | 1.8% | 1.5%(+0.316)#60 | 1.1%(+0.705)#4,337 |
| 61. | 59448 | 1.8% | 1.5%(+0.290)#61 | 1.1%(+0.679)#4,444 |
| 62. | 59313 | 1.8% | 1.5%(+0.282)#62 | 1.1%(+0.671)#4,465 |
| 63. | 59803 | 1.8% | 1.5%(+0.278)#63 | 1.1%(+0.667)#4,479 |
| 64. | 59443 | 1.7% | 1.5%(+0.268)#64 | 1.1%(+0.657)#4,516 |
| 65. | 59074 | 1.7% | 1.5%(+0.254)#65 | 1.1%(+0.643)#4,574 |
| 66. | 59828 | 1.7% | 1.5%(+0.251)#66 | 1.1%(+0.640)#4,587 |
| 67. | 59254 | 1.7% | 1.5%(+0.246)#67 | 1.1%(+0.635)#4,610 |
| 68. | 59937 | 1.7% | 1.5%(+0.232)#68 | 1.1%(+0.622)#4,664 |
| 69. | 59804 | 1.7% | 1.5%(+0.214)#69 | 1.1%(+0.603)#4,762 |
| 70. | 59602 | 1.7% | 1.5%(+0.178)#70 | 1.1%(+0.567)#4,908 |
| 71. | 59230 | 1.6% | 1.5%(+0.161)#71 | 1.1%(+0.551)#4,986 |
| 72. | 59846 | 1.6% | 1.5%(+0.147)#72 | 1.1%(+0.537)#5,043 |
| 73. | 59701 | 1.6% | 1.5%(+0.124)#73 | 1.1%(+0.513)#5,135 |
| 74. | 59201 | 1.6% | 1.5%(+0.121)#74 | 1.1%(+0.510)#5,154 |
| 75. | 59538 | 1.5% | 1.5%(+0.049)#75 | 1.1%(+0.438)#5,501 |
| 76. | 59812 | 1.5% | 1.5%(+0.044)#76 | 1.1%(+0.433)#5,527 |
| 77. | 59760 | 1.5% | 1.5%(+0.024)#77 | 1.1%(+0.413)#5,642 |
| 78. | 59925 | 1.5% | 1.5%(+0.023)#78 | 1.1%(+0.412)#5,647 |
| 79. | 59404 | 1.5% | 1.5%(-0.000)#79 | 1.1%(+0.389)#5,768 |
| 80. | 59714 | 1.5% | 1.5%(-0.007)#80 | 1.1%(+0.382)#5,815 |
| 81. | 59318 | 1.5% | 1.5%(-0.009)#81 | 1.1%(+0.380)#5,823 |
| 82. | 59008 | 1.4% | 1.5%(-0.031)#82 | 1.1%(+0.358)#5,925 |
| 83. | 59353 | 1.4% | 1.5%(-0.037)#83 | 1.1%(+0.352)#5,947 |
| 84. | 59079 | 1.4% | 1.5%(-0.049)#84 | 1.1%(+0.340)#6,017 |
| 85. | 59301 | 1.4% | 1.5%(-0.061)#85 | 1.1%(+0.328)#6,087 |
| 86. | 59634 | 1.4% | 1.5%(-0.079)#86 | 1.1%(+0.310)#6,185 |
| 87. | 59248 | 1.4% | 1.5%(-0.081)#87 | 1.1%(+0.308)#6,201 |
| 88. | 59105 | 1.4% | 1.5%(-0.113)#88 | 1.1%(+0.276)#6,374 |
| 89. | 59860 | 1.4% | 1.5%(-0.117)#89 | 1.1%(+0.272)#6,404 |
| 90. | 59218 | 1.3% | 1.5%(-0.131)#90 | 1.1%(+0.258)#6,476 |
| 91. | 59727 | 1.3% | 1.5%(-0.181)#91 | 1.1%(+0.208)#6,820 |
| 92. | 59019 | 1.2% | 1.5%(-0.237)#92 | 1.1%(+0.152)#7,187 |
| 93. | 59644 | 1.2% | 1.5%(-0.242)#93 | 1.1%(+0.147)#7,215 |
| 94. | 59741 | 1.2% | 1.5%(-0.246)#94 | 1.1%(+0.143)#7,237 |
| 95. | 59047 | 1.2% | 1.5%(-0.270)#95 | 1.1%(+0.119)#7,414 |
| 96. | 59729 | 1.2% | 1.5%(-0.274)#96 | 1.1%(+0.115)#7,447 |
| 97. | 59487 | 1.2% | 1.5%(-0.300)#97 | 1.1%(+0.089)#7,638 |
| 98. | 59270 | 1.2% | 1.5%(-0.307)#98 | 1.1%(+0.082)#7,707 |
| 99. | 59920 | 1.1% | 1.5%(-0.366)#99 | 1.1%(+0.023)#8,114 |
| 100. | 59486 | 1.1% | 1.5%(-0.379)#100 | 1.1%(+0.010)#8,211 |
Common Questions
What are the Top 10 Zip Codes with the Highest Percentage of Population Employed in Life, Physical & Social Science in Montana?
Top 10 Zip Codes with the Highest Percentage of Population Employed in Life, Physical & Social Science in Montana are:
What zip code has the Highest Percentage of Population Employed in Life, Physical & Social Science in Montana?
59211 has the Highest Percentage of Population Employed in Life, Physical & Social Science in Montana with 53.2%.
What is the Percentage of Population Employed in Life, Physical & Social Science in the State of Montana?
Percentage of Population Employed in Life, Physical & Social Science in Montana is 1.5%.
What is the Percentage of Population Employed in Life, Physical & Social Science in the United States?
Percentage of Population Employed in Life, Physical & Social Science in the United States is 1.1%.