Rader Creek, MT Map & Demographics
Rader Creek Map
Rader Creek Overview
$40,735
PER CAPITA INCOME
$79,329
AVG FAMILY INCOME
$78,009
AVG HOUSEHOLD INCOME
0.39
INEQUALITY / GINI INDEX
401
TOTAL POPULATION
228
MALE POPULATION
173
FEMALE POPULATION
131.79
MALES / 100 FEMALES
75.88
FEMALES / 100 MALES
54.8
MEDIAN AGE
2.6
AVG FAMILY SIZE
2.1
AVG HOUSEHOLD SIZE
135
LABOR FORCE [ PEOPLE ]
39.9%
PERCENT IN LABOR FORCE
13.3%
UNEMPLOYMENT RATE
Income in Rader Creek
Income Overview in Rader Creek
Per Capita Income in Rader Creek is $40,735, while median incomes of families and households are $79,329 and $78,009 respectively.
| Characteristic | Number | Measure |
| Per Capita Income | 401 | $40,735 |
| Median Family Income | 123 | $79,329 |
| Mean Family Income | 123 | $110,334 |
| Median Household Income | 190 | $78,009 |
| Mean Household Income | 190 | $84,608 |
| Income Deficit | 123 | $0 |
| Wage / Income Gap (%) | 401 | 0.00% |
| Wage / Income Gap ($) | 401 | 100.00¢ per $1 |
| Gini / Inequality Index | 401 | 0.39 |
Earnings by Sex in Rader Creek
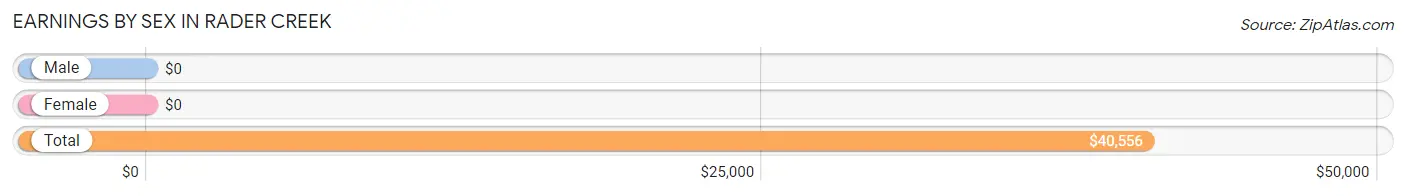
| Sex | Number | Average Earnings |
| Male | 92 (58.2%) | $0 |
| Female | 66 (41.8%) | $0 |
| Total | 158 (100.0%) | $40,556 |
Earnings by Sex by Income Bracket in Rader Creek
The most common earnings brackets in Rader Creek are $75,000 to $99,999 for men (28 | 30.4%) and $40,000 to $44,999 for women (18 | 27.3%).
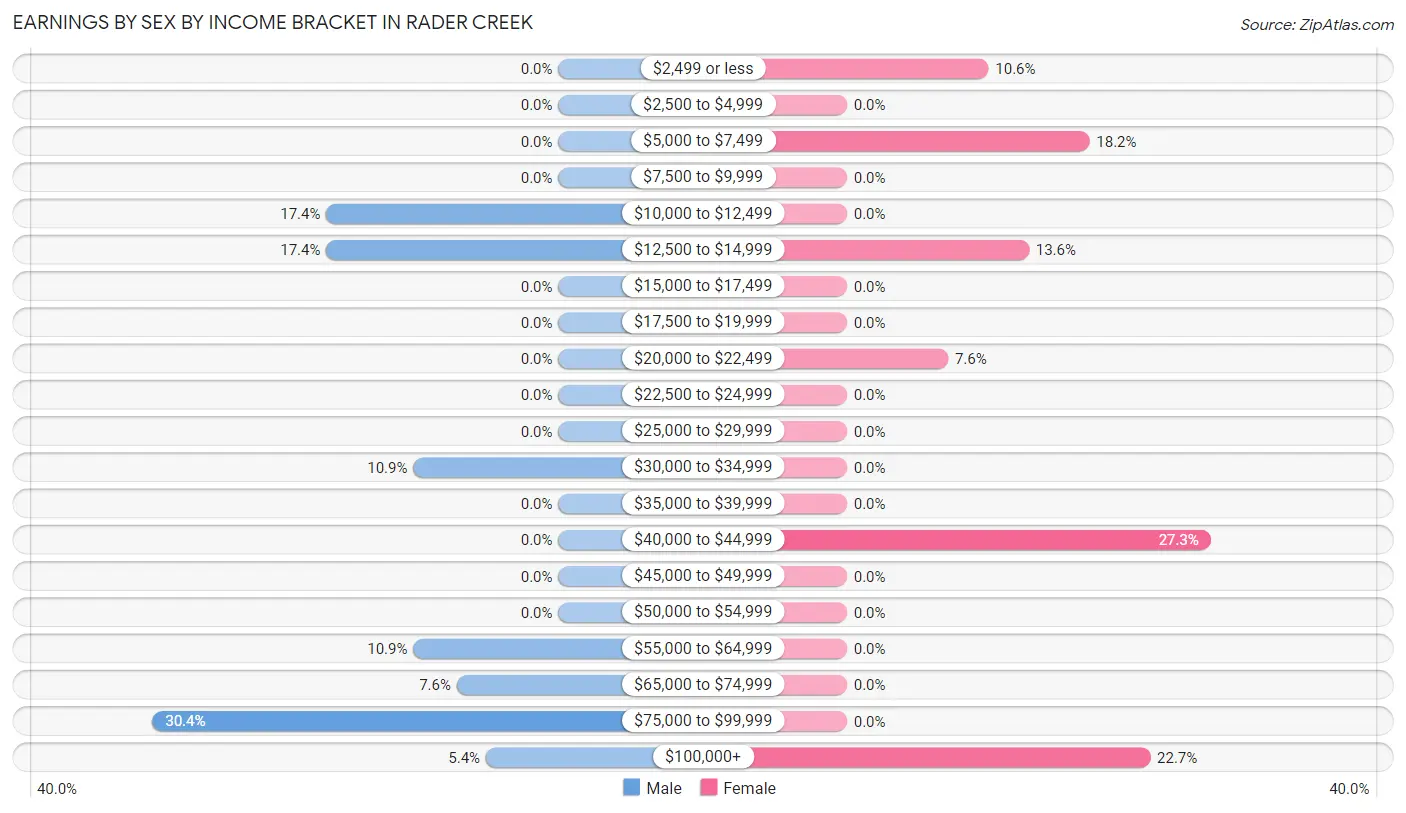
| Income | Male | Female |
| $2,499 or less | 0 (0.0%) | 7 (10.6%) |
| $2,500 to $4,999 | 0 (0.0%) | 0 (0.0%) |
| $5,000 to $7,499 | 0 (0.0%) | 12 (18.2%) |
| $7,500 to $9,999 | 0 (0.0%) | 0 (0.0%) |
| $10,000 to $12,499 | 16 (17.4%) | 0 (0.0%) |
| $12,500 to $14,999 | 16 (17.4%) | 9 (13.6%) |
| $15,000 to $17,499 | 0 (0.0%) | 0 (0.0%) |
| $17,500 to $19,999 | 0 (0.0%) | 0 (0.0%) |
| $20,000 to $22,499 | 0 (0.0%) | 5 (7.6%) |
| $22,500 to $24,999 | 0 (0.0%) | 0 (0.0%) |
| $25,000 to $29,999 | 0 (0.0%) | 0 (0.0%) |
| $30,000 to $34,999 | 10 (10.9%) | 0 (0.0%) |
| $35,000 to $39,999 | 0 (0.0%) | 0 (0.0%) |
| $40,000 to $44,999 | 0 (0.0%) | 18 (27.3%) |
| $45,000 to $49,999 | 0 (0.0%) | 0 (0.0%) |
| $50,000 to $54,999 | 0 (0.0%) | 0 (0.0%) |
| $55,000 to $64,999 | 10 (10.9%) | 0 (0.0%) |
| $65,000 to $74,999 | 7 (7.6%) | 0 (0.0%) |
| $75,000 to $99,999 | 28 (30.4%) | 0 (0.0%) |
| $100,000+ | 5 (5.4%) | 15 (22.7%) |
| Total | 92 (100.0%) | 66 (100.0%) |
Earnings by Sex by Educational Attainment in Rader Creek
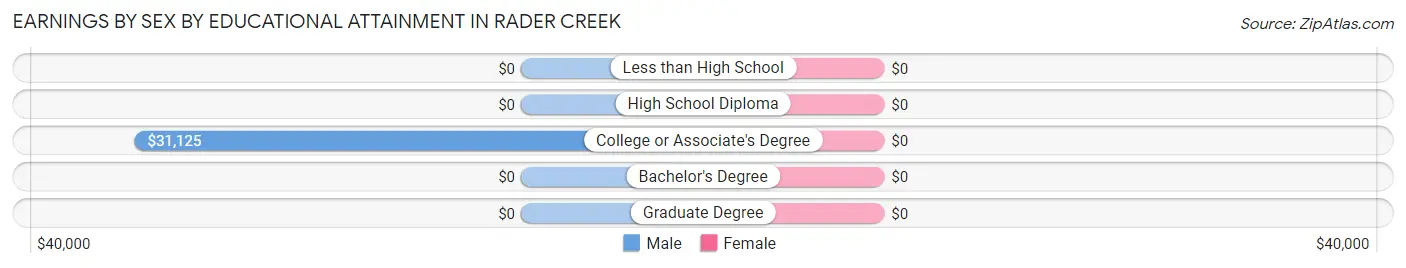
| Educational Attainment | Male Income | Female Income |
| Less than High School | - | - |
| High School Diploma | - | - |
| College or Associate's Degree | $31,125 | $0 |
| Bachelor's Degree | - | - |
| Graduate Degree | - | - |
| Total | - | - |
Family Income in Rader Creek
Family Income Brackets in Rader Creek
According to the Rader Creek family income data, there are 59 families falling into the $75,000 to $99,999 income range, which is the most common income bracket and makes up 48.0% of all families.
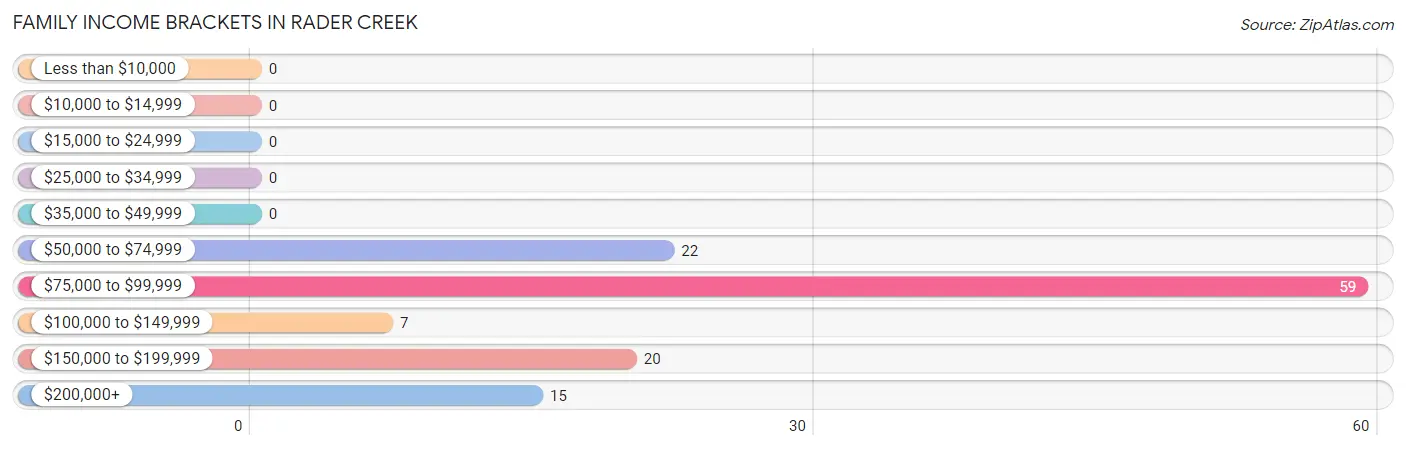
| Income Bracket | # Families | % Families |
| Less than $10,000 | 0 | 0.0% |
| $10,000 to $14,999 | 0 | 0.0% |
| $15,000 to $24,999 | 0 | 0.0% |
| $25,000 to $34,999 | 0 | 0.0% |
| $35,000 to $49,999 | 0 | 0.0% |
| $50,000 to $74,999 | 22 | 17.9% |
| $75,000 to $99,999 | 59 | 48.0% |
| $100,000 to $149,999 | 7 | 5.7% |
| $150,000 to $199,999 | 20 | 16.3% |
| $200,000+ | 15 | 12.2% |
Family Income by Famaliy Size in Rader Creek
2-person families (88 | 71.5%) account for the highest median family income in Rader Creek with $78,519 per family, while 2-person families (88 | 71.5%) have the highest median income of $39,260 per family member.
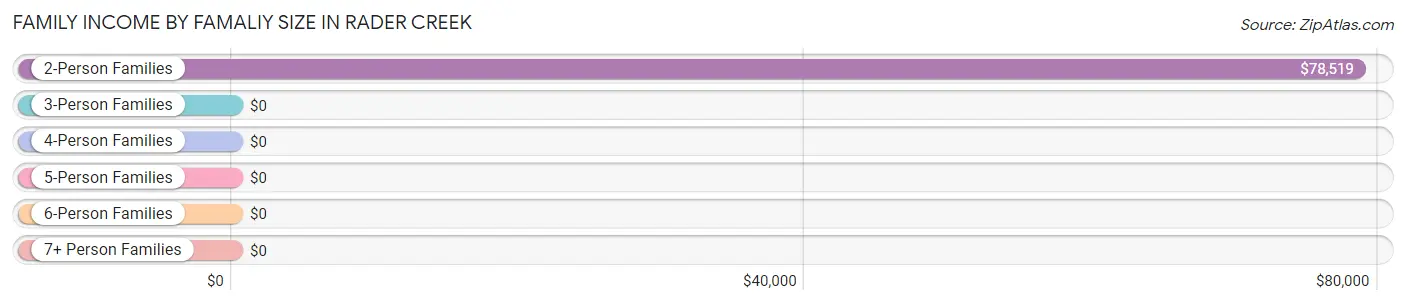
| Income Bracket | # Families | Median Income |
| 2-Person Families | 88 (71.5%) | $78,519 |
| 3-Person Families | 12 (9.8%) | $0 |
| 4-Person Families | 23 (18.7%) | $0 |
| 5-Person Families | 0 (0.0%) | $0 |
| 6-Person Families | 0 (0.0%) | $0 |
| 7+ Person Families | 0 (0.0%) | $0 |
| Total | 123 (100.0%) | $79,329 |
Family Income by Number of Earners in Rader Creek
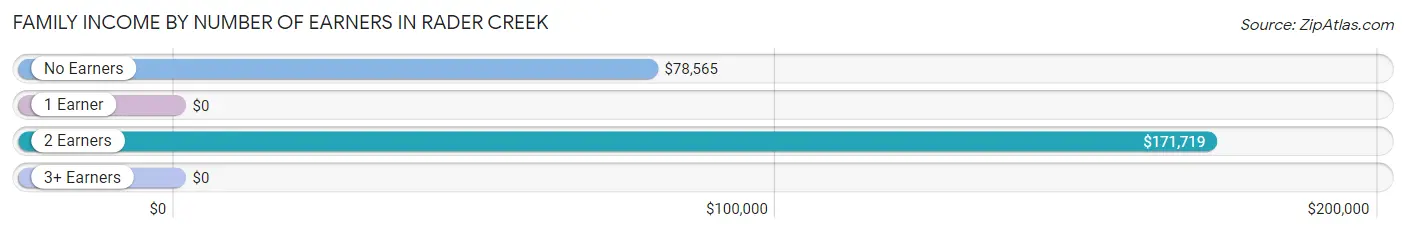
| Number of Earners | # Families | Median Income |
| No Earners | 62 (50.4%) | $78,565 |
| 1 Earner | 14 (11.4%) | $0 |
| 2 Earners | 35 (28.5%) | $171,719 |
| 3+ Earners | 12 (9.8%) | $0 |
| Total | 123 (100.0%) | $79,329 |
Household Income in Rader Creek
Household Income Brackets in Rader Creek
With 59 households falling in the category, the $75,000 to $99,999 income range is the most frequent in Rader Creek, accounting for 31.0% of all households.
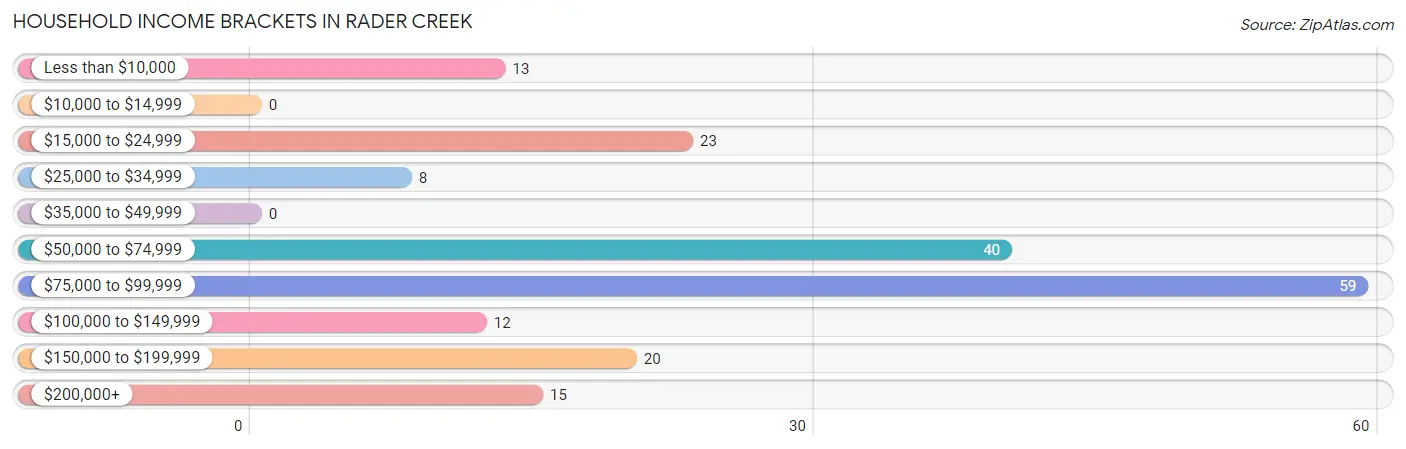
| Income Bracket | # Households | % Households |
| Less than $10,000 | 13 | 6.8% |
| $10,000 to $14,999 | 0 | 0.0% |
| $15,000 to $24,999 | 23 | 12.1% |
| $25,000 to $34,999 | 8 | 4.2% |
| $35,000 to $49,999 | 0 | 0.0% |
| $50,000 to $74,999 | 40 | 21.1% |
| $75,000 to $99,999 | 59 | 31.1% |
| $100,000 to $149,999 | 12 | 6.3% |
| $150,000 to $199,999 | 20 | 10.5% |
| $200,000+ | 15 | 7.9% |
Household Income by Householder Age in Rader Creek
The median household income in Rader Creek is $78,009, with the highest median household income of $78,517 found in the 45 to 64 years age bracket for the primary householder. A total of 125 households (65.8%) fall into this category.
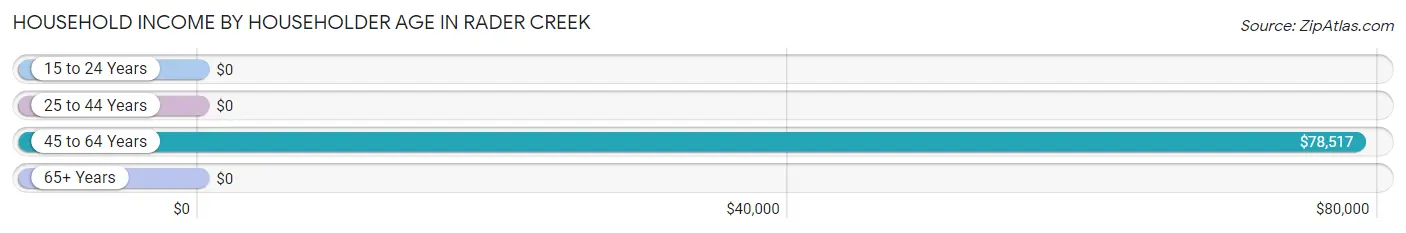
| Income Bracket | # Households | Median Income |
| 15 to 24 Years | 0 (0.0%) | $0 |
| 25 to 44 Years | 33 (17.4%) | $0 |
| 45 to 64 Years | 125 (65.8%) | $78,517 |
| 65+ Years | 32 (16.8%) | $0 |
| Total | 190 (100.0%) | $78,009 |
Poverty in Rader Creek
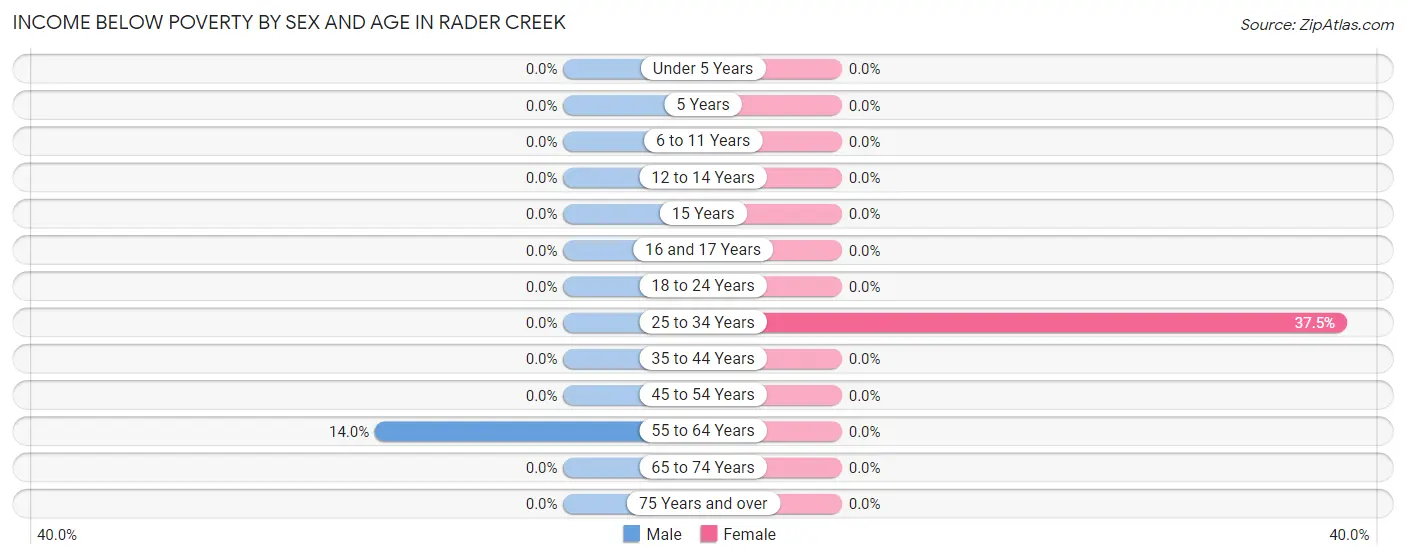
Income Below Poverty by Sex and Age in Rader Creek
With 5.7% poverty level for males and 5.2% for females among the residents of Rader Creek, 55 to 64 year old males and 25 to 34 year old females are the most vulnerable to poverty, with 13 males (14.0%) and 9 females (37.5%) in their respective age groups living below the poverty level.
| Age Bracket | Male | Female |
| Under 5 Years | 0 (0.0%) | 0 (0.0%) |
| 5 Years | 0 (0.0%) | 0 (0.0%) |
| 6 to 11 Years | 0 (0.0%) | 0 (0.0%) |
| 12 to 14 Years | 0 (0.0%) | 0 (0.0%) |
| 15 Years | 0 (0.0%) | 0 (0.0%) |
| 16 and 17 Years | 0 (0.0%) | 0 (0.0%) |
| 18 to 24 Years | 0 (0.0%) | 0 (0.0%) |
| 25 to 34 Years | 0 (0.0%) | 9 (37.5%) |
| 35 to 44 Years | 0 (0.0%) | 0 (0.0%) |
| 45 to 54 Years | 0 (0.0%) | 0 (0.0%) |
| 55 to 64 Years | 13 (14.0%) | 0 (0.0%) |
| 65 to 74 Years | 0 (0.0%) | 0 (0.0%) |
| 75 Years and over | 0 (0.0%) | 0 (0.0%) |
| Total | 13 (5.7%) | 9 (5.2%) |
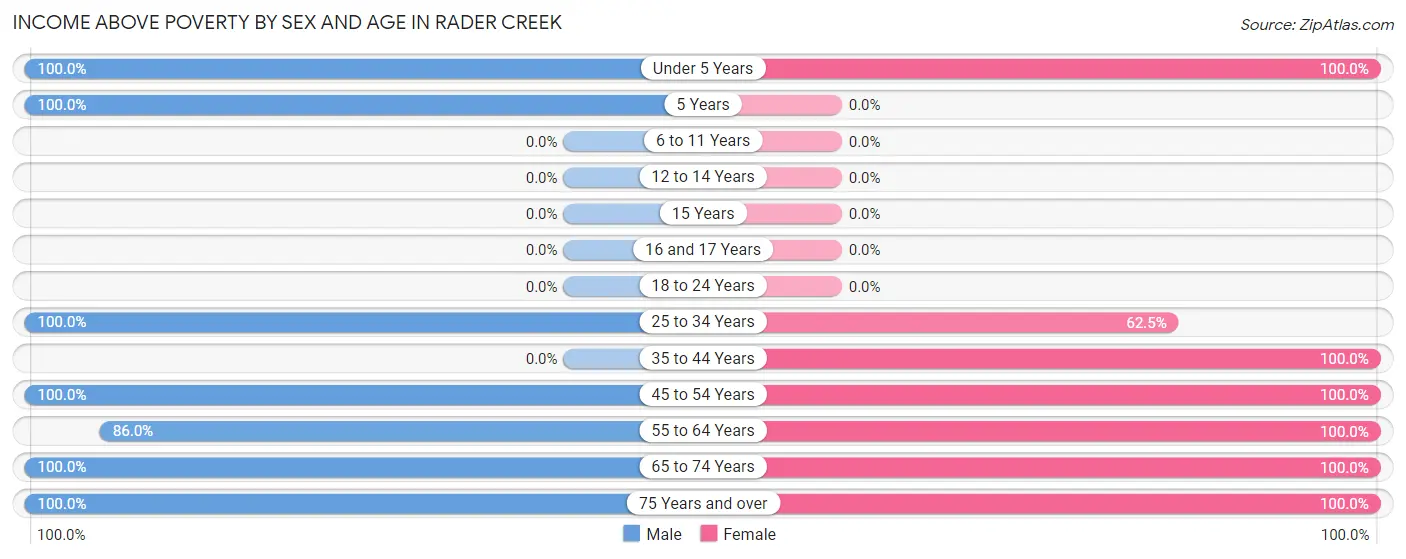
Income Above Poverty by Sex and Age in Rader Creek
According to the poverty statistics in Rader Creek, males aged under 5 years and females aged under 5 years are the age groups that are most secure financially, with 100.0% of males and 100.0% of females in these age groups living above the poverty line.
| Age Bracket | Male | Female |
| Under 5 Years | 23 (100.0%) | 12 (100.0%) |
| 5 Years | 28 (100.0%) | 0 (0.0%) |
| 6 to 11 Years | 0 (0.0%) | 0 (0.0%) |
| 12 to 14 Years | 0 (0.0%) | 0 (0.0%) |
| 15 Years | 0 (0.0%) | 0 (0.0%) |
| 16 and 17 Years | 0 (0.0%) | 0 (0.0%) |
| 18 to 24 Years | 0 (0.0%) | 0 (0.0%) |
| 25 to 34 Years | 38 (100.0%) | 15 (62.5%) |
| 35 to 44 Years | 0 (0.0%) | 18 (100.0%) |
| 45 to 54 Years | 11 (100.0%) | 50 (100.0%) |
| 55 to 64 Years | 80 (86.0%) | 35 (100.0%) |
| 65 to 74 Years | 24 (100.0%) | 8 (100.0%) |
| 75 Years and over | 11 (100.0%) | 26 (100.0%) |
| Total | 215 (94.3%) | 164 (94.8%) |
Income Below Poverty Among Married-Couple Families in Rader Creek
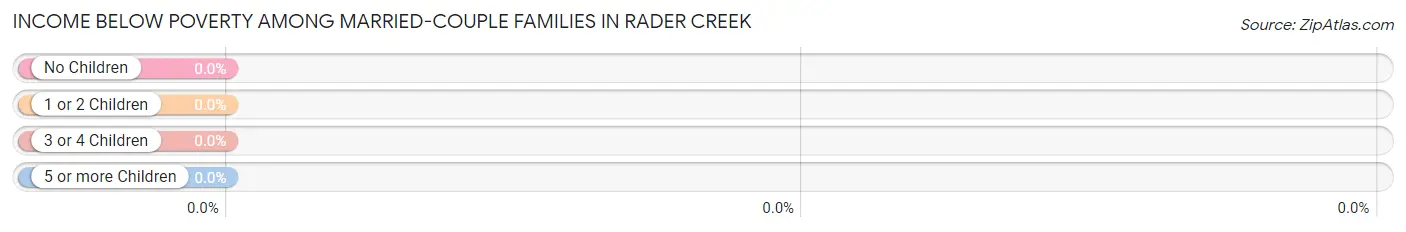
| Children | Above Poverty | Below Poverty |
| No Children | 100 (100.0%) | 0 (0.0%) |
| 1 or 2 Children | 23 (100.0%) | 0 (0.0%) |
| 3 or 4 Children | 0 (0.0%) | 0 (0.0%) |
| 5 or more Children | 0 (0.0%) | 0 (0.0%) |
| Total | 123 (100.0%) | 0 (0.0%) |
Income Below Poverty Among Single-Parent Households in Rader Creek
| Children | Single Father | Single Mother |
| No Children | 0 (0.0%) | 0 (0.0%) |
| 1 or 2 Children | 0 (0.0%) | 0 (0.0%) |
| 3 or 4 Children | 0 (0.0%) | 0 (0.0%) |
| 5 or more Children | 0 (0.0%) | 0 (0.0%) |
| Total | 0 (0.0%) | 0 (0.0%) |
Income Below Poverty Among Married-Couple vs Single-Parent Households in Rader Creek
| Children | Married-Couple Families | Single-Parent Households |
| No Children | 0 (0.0%) | 0 (0.0%) |
| 1 or 2 Children | 0 (0.0%) | 0 (0.0%) |
| 3 or 4 Children | 0 (0.0%) | 0 (0.0%) |
| 5 or more Children | 0 (0.0%) | 0 (0.0%) |
| Total | 0 (0.0%) | 0 (0.0%) |
Race in Rader Creek
The most populous races in Rader Creek are White / Caucasian (391 | 97.5%), Hispanic or Latino (31 | 7.7%), and Native / Alaskan (10 | 2.5%).
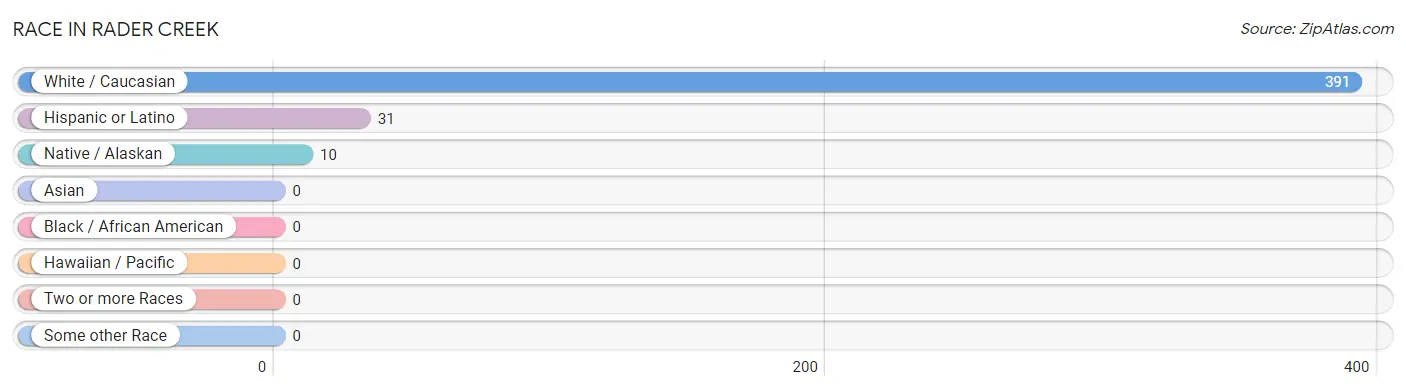
| Race | # Population | % Population |
| Asian | 0 | 0.0% |
| Black / African American | 0 | 0.0% |
| Hawaiian / Pacific | 0 | 0.0% |
| Hispanic or Latino | 31 | 7.7% |
| Native / Alaskan | 10 | 2.5% |
| White / Caucasian | 391 | 97.5% |
| Two or more Races | 0 | 0.0% |
| Some other Race | 0 | 0.0% |
| Total | 401 | 100.0% |
Ancestry in Rader Creek
The most populous ancestries reported in Rader Creek are American (86 | 21.4%), German (68 | 17.0%), English (44 | 11.0%), Mexican (31 | 7.7%), and Irish (26 | 6.5%), together accounting for 63.6% of all Rader Creek residents.
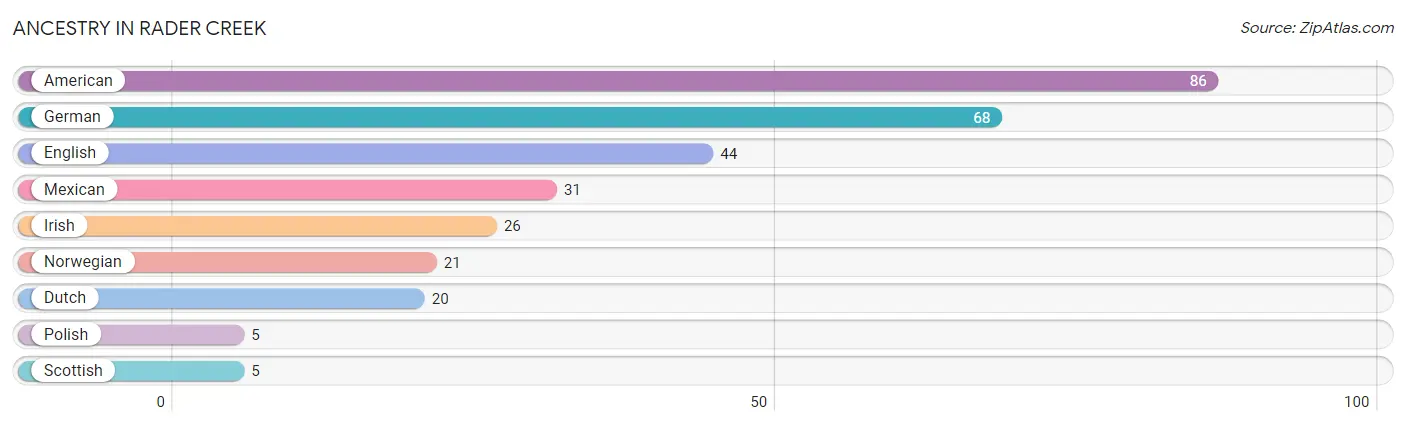
| Ancestry | # Population | % Population |
| American | 86 | 21.4% |
| Dutch | 20 | 5.0% |
| English | 44 | 11.0% |
| German | 68 | 17.0% |
| Irish | 26 | 6.5% |
| Mexican | 31 | 7.7% |
| Norwegian | 21 | 5.2% |
| Polish | 5 | 1.3% |
| Scottish | 5 | 1.3% | View All 9 Rows |
Immigrants in Rader Creek
The most numerous immigrant groups reported in Rader Creek came from Central America (31 | 7.7%), Latin America (31 | 7.7%), Mexico (31 | 7.7%), Europe (13 | 3.2%), and Northern Europe (13 | 3.2%), together accounting for 29.7% of all Rader Creek residents.
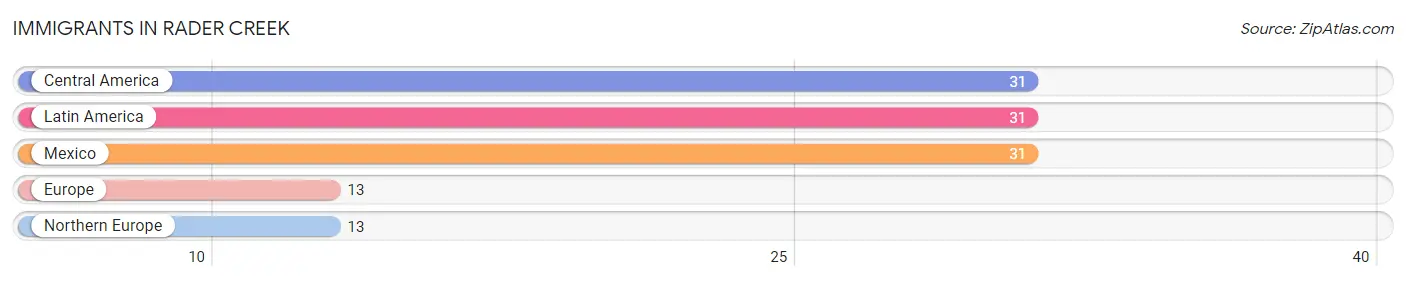
| Immigration Origin | # Population | % Population |
| Central America | 31 | 7.7% |
| Europe | 13 | 3.2% |
| Latin America | 31 | 7.7% |
| Mexico | 31 | 7.7% |
| Northern Europe | 13 | 3.2% | View All 5 Rows |
Sex and Age in Rader Creek
Sex and Age in Rader Creek
The most populous age groups in Rader Creek are 60 to 64 Years (73 | 32.0%) for men and 45 to 49 Years (31 | 17.9%) for women.
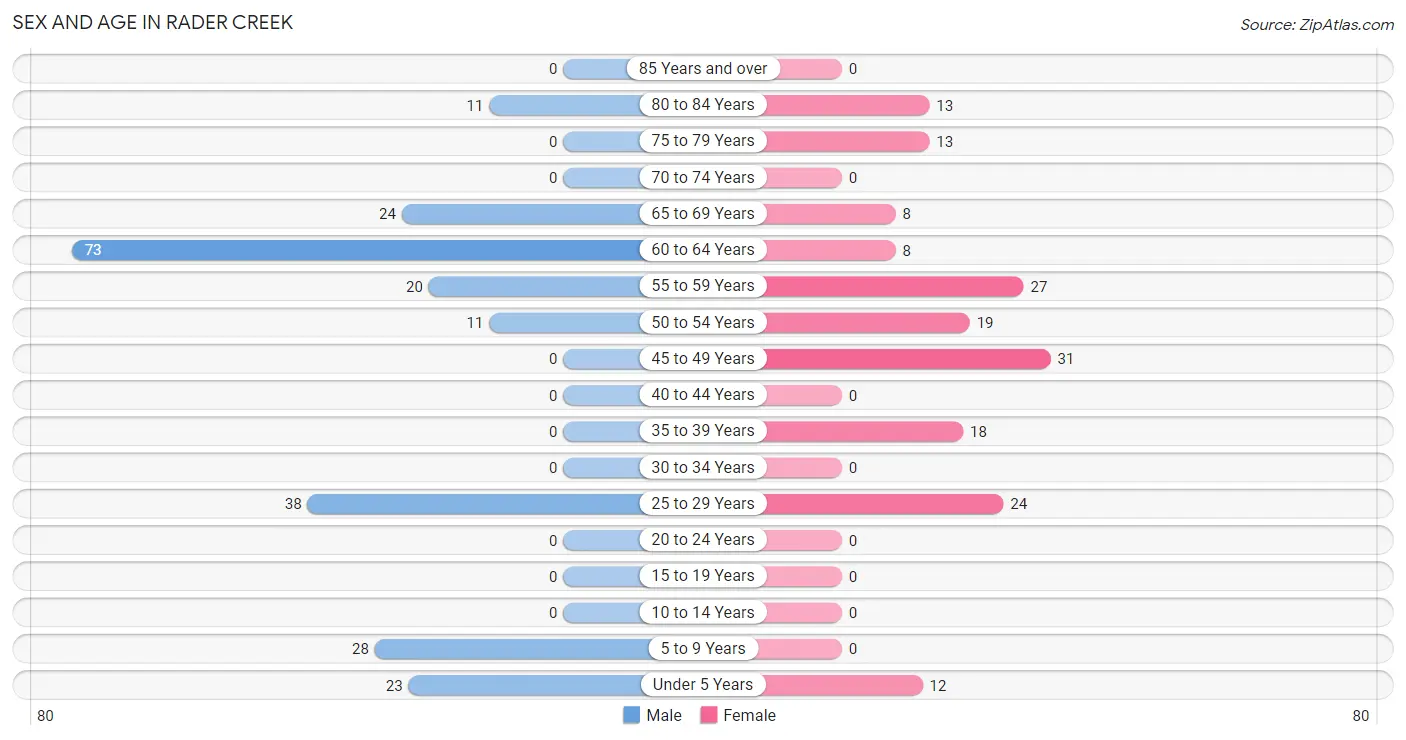
| Age Bracket | Male | Female |
| Under 5 Years | 23 (10.1%) | 12 (6.9%) |
| 5 to 9 Years | 28 (12.3%) | 0 (0.0%) |
| 10 to 14 Years | 0 (0.0%) | 0 (0.0%) |
| 15 to 19 Years | 0 (0.0%) | 0 (0.0%) |
| 20 to 24 Years | 0 (0.0%) | 0 (0.0%) |
| 25 to 29 Years | 38 (16.7%) | 24 (13.9%) |
| 30 to 34 Years | 0 (0.0%) | 0 (0.0%) |
| 35 to 39 Years | 0 (0.0%) | 18 (10.4%) |
| 40 to 44 Years | 0 (0.0%) | 0 (0.0%) |
| 45 to 49 Years | 0 (0.0%) | 31 (17.9%) |
| 50 to 54 Years | 11 (4.8%) | 19 (11.0%) |
| 55 to 59 Years | 20 (8.8%) | 27 (15.6%) |
| 60 to 64 Years | 73 (32.0%) | 8 (4.6%) |
| 65 to 69 Years | 24 (10.5%) | 8 (4.6%) |
| 70 to 74 Years | 0 (0.0%) | 0 (0.0%) |
| 75 to 79 Years | 0 (0.0%) | 13 (7.5%) |
| 80 to 84 Years | 11 (4.8%) | 13 (7.5%) |
| 85 Years and over | 0 (0.0%) | 0 (0.0%) |
| Total | 228 (100.0%) | 173 (100.0%) |
Families and Households in Rader Creek
Median Family Size in Rader Creek
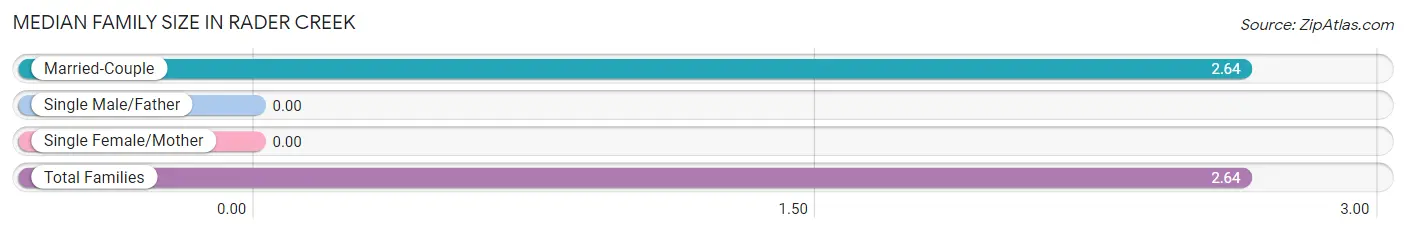
| Family Type | # Families | Family Size |
| Married-Couple | 123 (100.0%) | 2.64 |
| Single Male/Father | 0 (0.0%) | - |
| Single Female/Mother | 0 (0.0%) | - |
| Total Families | 123 (100.0%) | 2.64 |
Median Household Size in Rader Creek
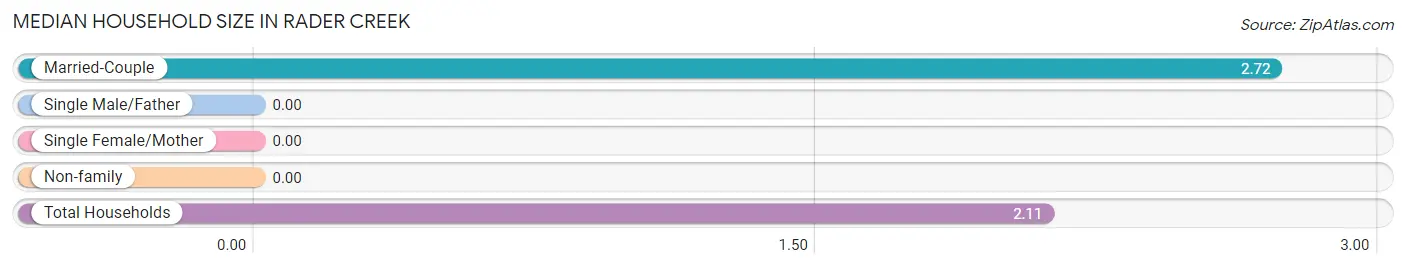
| Household Type | # Households | Household Size |
| Married-Couple | 123 (64.7%) | 2.72 |
| Single Male/Father | 0 (0.0%) | - |
| Single Female/Mother | 0 (0.0%) | - |
| Non-family | 67 (35.3%) | - |
| Total Households | 190 (100.0%) | 2.11 |
Household Size by Marriage Status in Rader Creek
Out of a total of 190 households in Rader Creek, 123 (64.7%) are family households, while 67 (35.3%) are nonfamily households. The most numerous type of family households are 2-person households, comprising 88, and the most common type of nonfamily households are 1-person households, comprising 67.
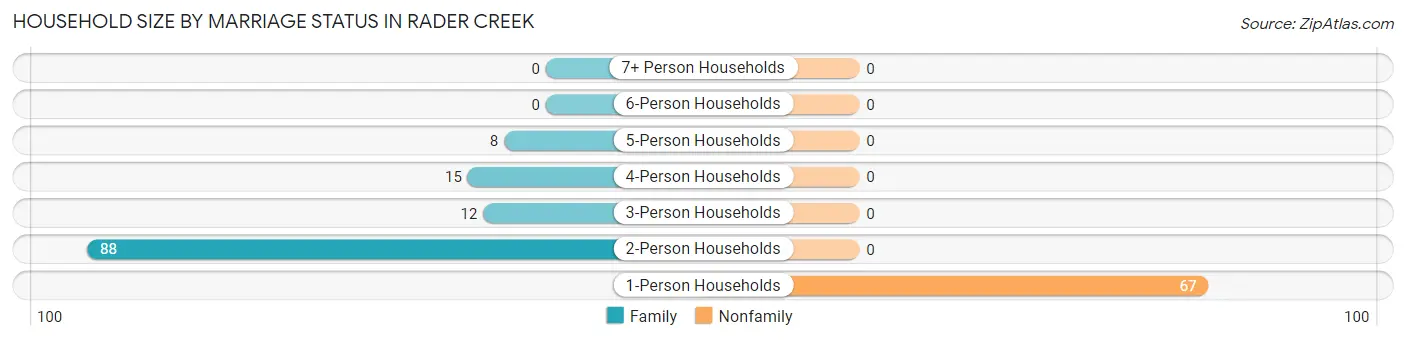
| Household Size | Family Households | Nonfamily Households |
| 1-Person Households | - | 67 (35.3%) |
| 2-Person Households | 88 (46.3%) | 0 (0.0%) |
| 3-Person Households | 12 (6.3%) | 0 (0.0%) |
| 4-Person Households | 15 (7.9%) | 0 (0.0%) |
| 5-Person Households | 8 (4.2%) | 0 (0.0%) |
| 6-Person Households | 0 (0.0%) | 0 (0.0%) |
| 7+ Person Households | 0 (0.0%) | 0 (0.0%) |
| Total | 123 (64.7%) | 67 (35.3%) |
Female Fertility in Rader Creek
Fertility by Age in Rader Creek
Average fertility rate in Rader Creek is 123.0 births per 1,000 women. Women in the age bracket of 20 to 34 years have the highest fertility rate with 375.0 births per 1,000 women. Women in the age bracket of 20 to 34 years acount for 100.0% of all women with births.
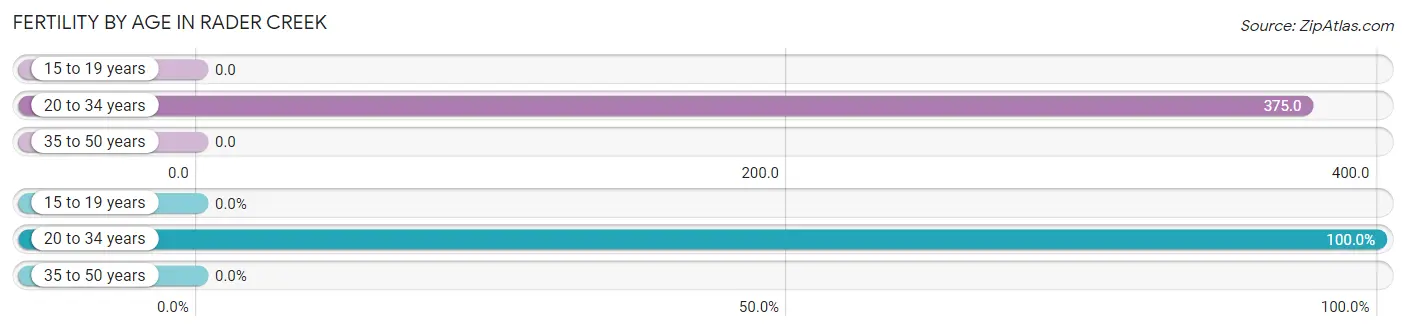
| Age Bracket | Women with Births | Births / 1,000 Women |
| 15 to 19 years | 0 (0.0%) | 0.0 |
| 20 to 34 years | 9 (100.0%) | 375.0 |
| 35 to 50 years | 0 (0.0%) | 0.0 |
| Total | 9 (100.0%) | 123.0 |
Fertility by Age by Marriage Status in Rader Creek
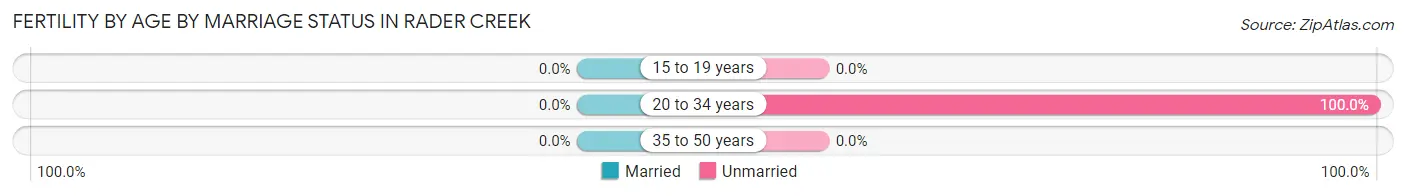
| Age Bracket | Married | Unmarried |
| 15 to 19 years | 0 (0.0%) | 0 (0.0%) |
| 20 to 34 years | 0 (0.0%) | 9 (100.0%) |
| 35 to 50 years | 0 (0.0%) | 0 (0.0%) |
| Total | 0 (0.0%) | 9 (100.0%) |
Fertility by Education in Rader Creek
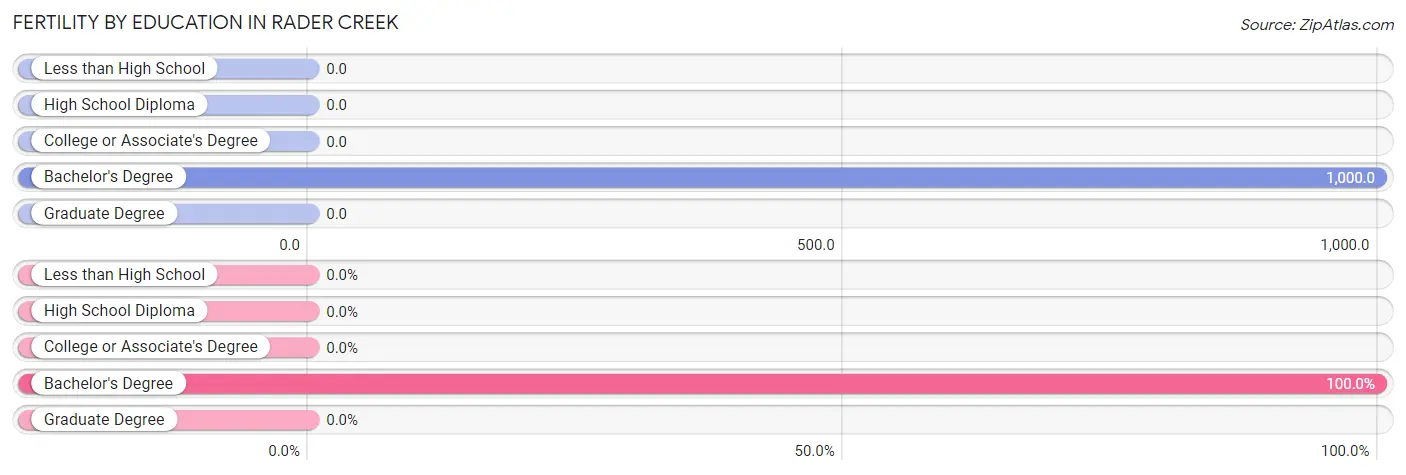
| Educational Attainment | Women with Births | Births / 1,000 Women |
| Less than High School | 0 (0.0%) | 0.0 |
| High School Diploma | 0 (0.0%) | 0.0 |
| College or Associate's Degree | 0 (0.0%) | 0.0 |
| Bachelor's Degree | 9 (100.0%) | 1,000.0 |
| Graduate Degree | 0 (0.0%) | 0.0 |
| Total | 9 (100.0%) | 123.0 |
Fertility by Education by Marriage Status in Rader Creek
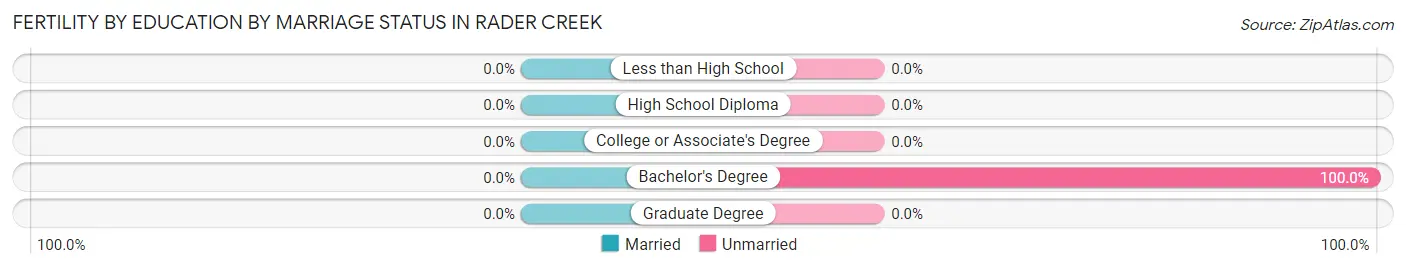
| Educational Attainment | Married | Unmarried |
| Less than High School | 0 (0.0%) | 0 (0.0%) |
| High School Diploma | 0 (0.0%) | 0 (0.0%) |
| College or Associate's Degree | 0 (0.0%) | 0 (0.0%) |
| Bachelor's Degree | 0 (0.0%) | 9 (100.0%) |
| Graduate Degree | 0 (0.0%) | 0 (0.0%) |
| Total | 0 (0.0%) | 9 (100.0%) |
Employment Characteristics in Rader Creek
Employment by Class of Employer in Rader Creek
Among the 102 employed individuals in Rader Creek, private company employees (51 | 50.0%), self-employed (not incorporated) (40 | 39.2%), and self-employed (incorporated) (11 | 10.8%) make up the most common classes of employment.
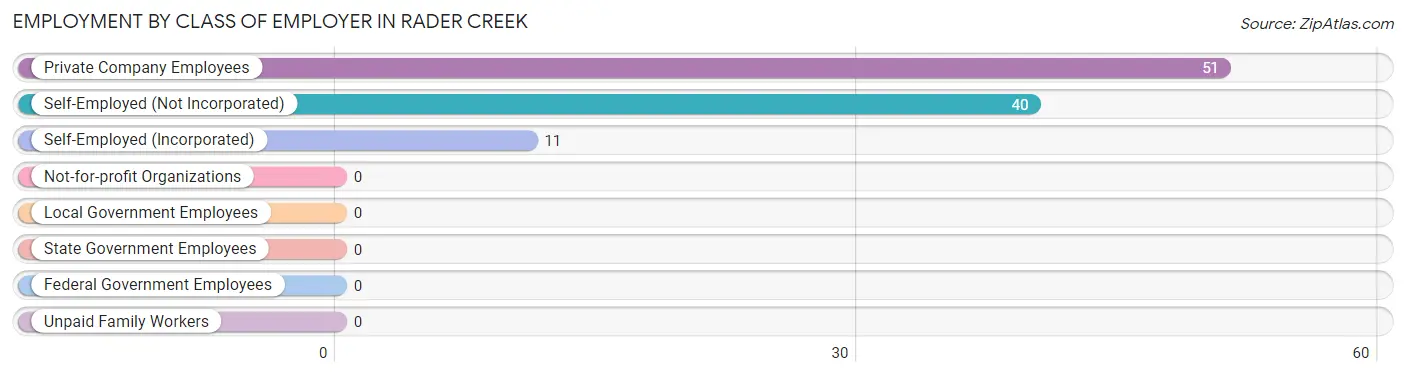
| Employer Class | # Employees | % Employees |
| Private Company Employees | 51 | 50.0% |
| Self-Employed (Incorporated) | 11 | 10.8% |
| Self-Employed (Not Incorporated) | 40 | 39.2% |
| Not-for-profit Organizations | 0 | 0.0% |
| Local Government Employees | 0 | 0.0% |
| State Government Employees | 0 | 0.0% |
| Federal Government Employees | 0 | 0.0% |
| Unpaid Family Workers | 0 | 0.0% |
| Total | 102 | 100.0% |
Employment Status by Age in Rader Creek
According to the labor force statistics for Rader Creek, out of the total population over 16 years of age (338), 39.9% or 135 individuals are in the labor force, with 13.3% or 18 of them unemployed. The age group with the highest labor force participation rate is 25 to 29 years, with 100.0% or 62 individuals in the labor force. Within the labor force, the 35 to 44 years age range has the highest percentage of unemployed individuals, with 100.0% or 18 of them being unemployed.
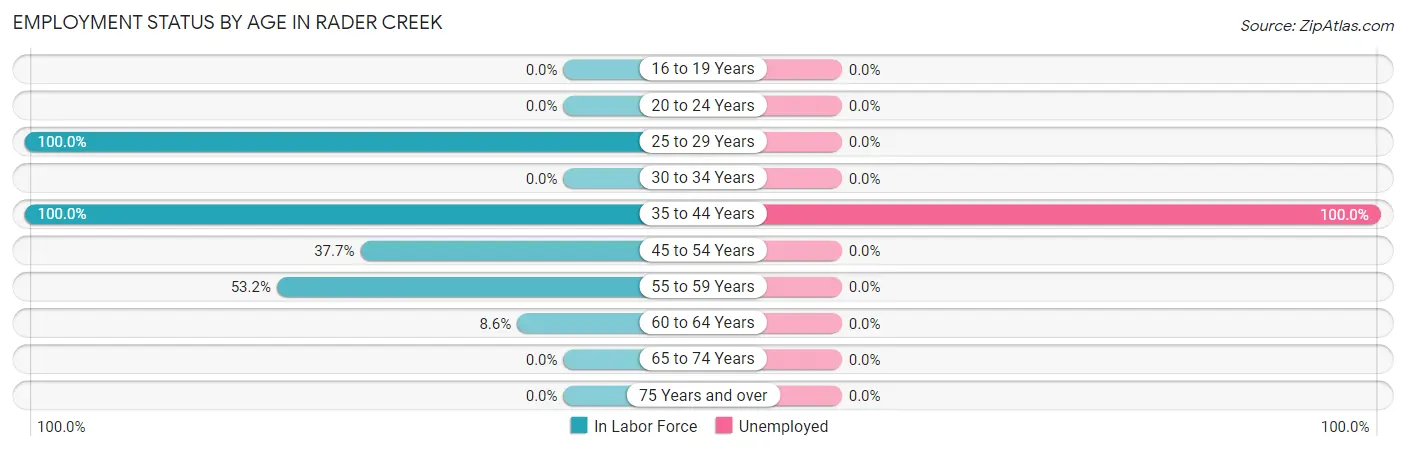
| Age Bracket | In Labor Force | Unemployed |
| 16 to 19 Years | 0 (0.0%) | 0 (0.0%) |
| 20 to 24 Years | 0 (0.0%) | 0 (0.0%) |
| 25 to 29 Years | 62 (100.0%) | 0 (0.0%) |
| 30 to 34 Years | 0 (0.0%) | 0 (0.0%) |
| 35 to 44 Years | 18 (100.0%) | 18 (100.0%) |
| 45 to 54 Years | 23 (37.7%) | 0 (0.0%) |
| 55 to 59 Years | 25 (53.2%) | 0 (0.0%) |
| 60 to 64 Years | 7 (8.6%) | 0 (0.0%) |
| 65 to 74 Years | 0 (0.0%) | 0 (0.0%) |
| 75 Years and over | 0 (0.0%) | 0 (0.0%) |
| Total | 135 (39.9%) | 18 (13.3%) |
Employment Status by Educational Attainment in Rader Creek
According to labor force statistics for Rader Creek, 50.2% of individuals (135) out of the total population between 25 and 64 years of age (269) are in the labor force, with 13.3% or 18 of them being unemployed. The group with the highest labor force participation rate are those with the educational attainment of high school diploma, with 73.3% or 22 individuals in the labor force. Within the labor force, individuals with college / associate degree education have the highest percentage of unemployment, with 23.7% or 18 of them being unemployed.
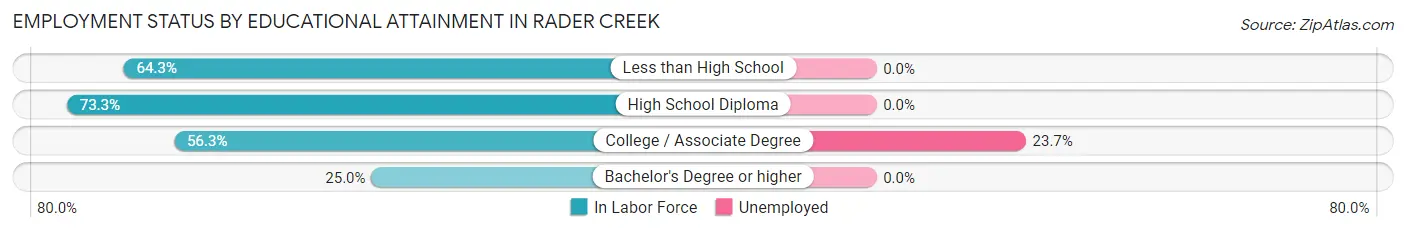
| Educational Attainment | In Labor Force | Unemployed |
| Less than High School | 18 (64.3%) | 0 (0.0%) |
| High School Diploma | 22 (73.3%) | 0 (0.0%) |
| College / Associate Degree | 76 (56.3%) | 32 (23.7%) |
| Bachelor's Degree or higher | 19 (25.0%) | 0 (0.0%) |
| Total | 135 (50.2%) | 36 (13.3%) |
Employment Occupations by Sex in Rader Creek
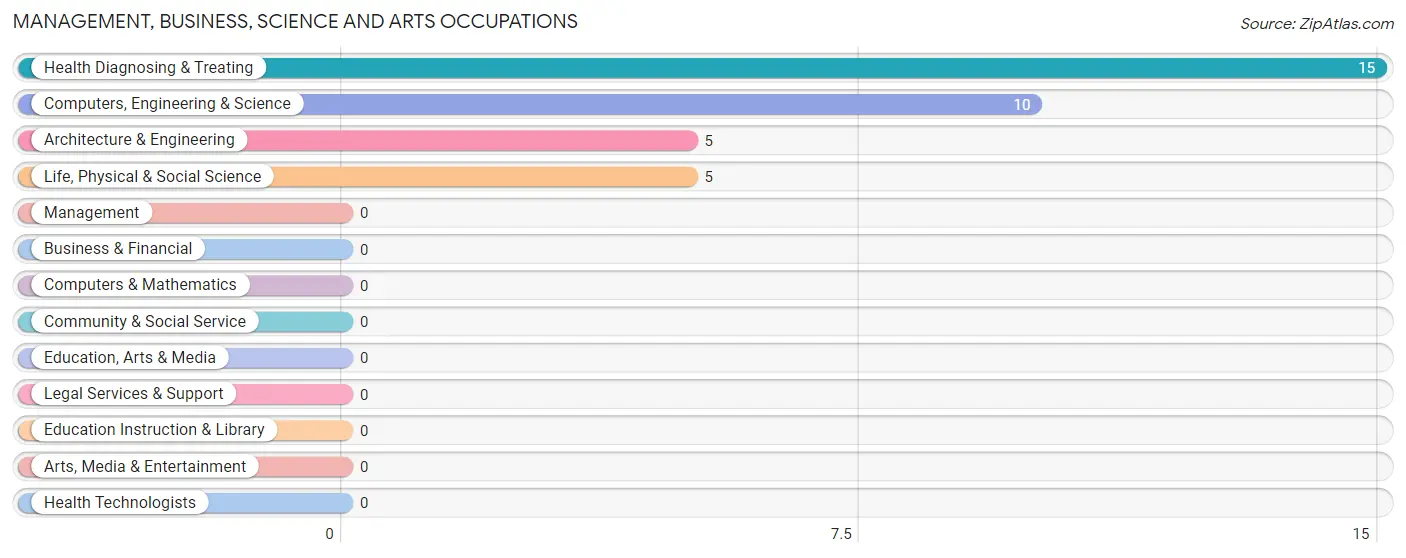
Management, Business, Science and Arts Occupations
The most common Management, Business, Science and Arts occupations in Rader Creek are Health Diagnosing & Treating (15 | 12.8%), Computers, Engineering & Science (10 | 8.6%), Architecture & Engineering (5 | 4.3%), and Life, Physical & Social Science (5 | 4.3%).
Management, Business, Science and Arts Occupations by Sex
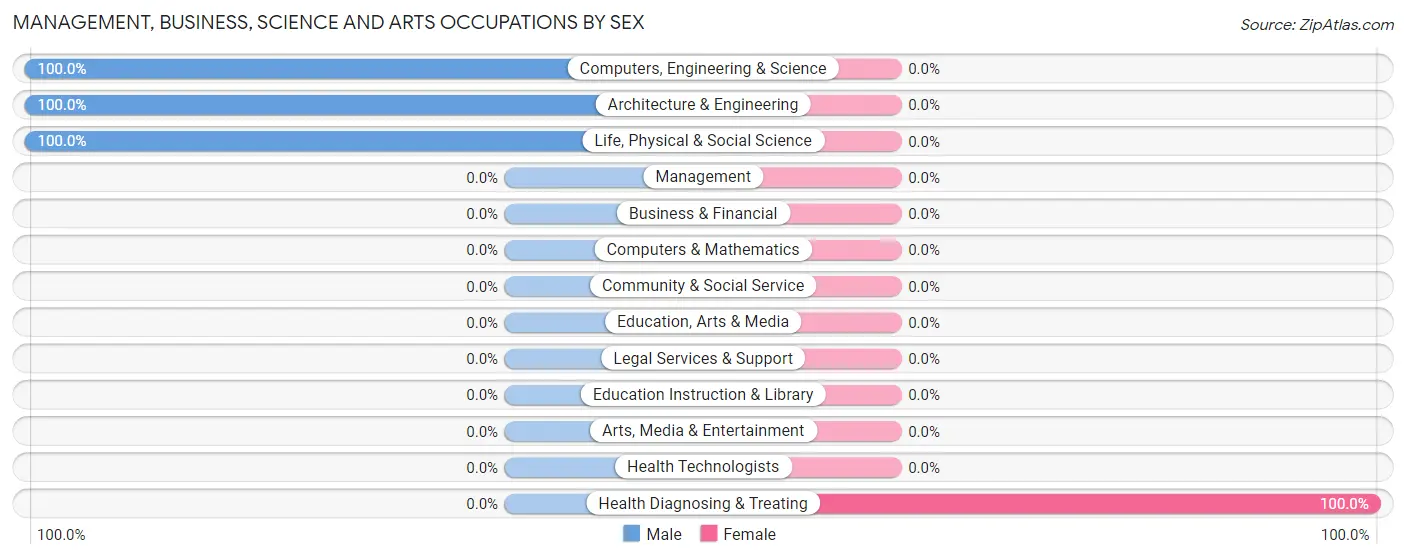
| Occupation | Male | Female |
| Management | 0 (0.0%) | 0 (0.0%) |
| Business & Financial | 0 (0.0%) | 0 (0.0%) |
| Computers, Engineering & Science | 10 (100.0%) | 0 (0.0%) |
| Computers & Mathematics | 0 (0.0%) | 0 (0.0%) |
| Architecture & Engineering | 5 (100.0%) | 0 (0.0%) |
| Life, Physical & Social Science | 5 (100.0%) | 0 (0.0%) |
| Community & Social Service | 0 (0.0%) | 0 (0.0%) |
| Education, Arts & Media | 0 (0.0%) | 0 (0.0%) |
| Legal Services & Support | 0 (0.0%) | 0 (0.0%) |
| Education Instruction & Library | 0 (0.0%) | 0 (0.0%) |
| Arts, Media & Entertainment | 0 (0.0%) | 0 (0.0%) |
| Health Diagnosing & Treating | 0 (0.0%) | 15 (100.0%) |
| Health Technologists | 0 (0.0%) | 0 (0.0%) |
| Total (Category) | 10 (40.0%) | 15 (60.0%) |
| Total (Overall) | 76 (65.0%) | 41 (35.0%) |
Services Occupations
The most common Services occupations in Rader Creek are , and Personal Care & Service (17 | 14.5%).
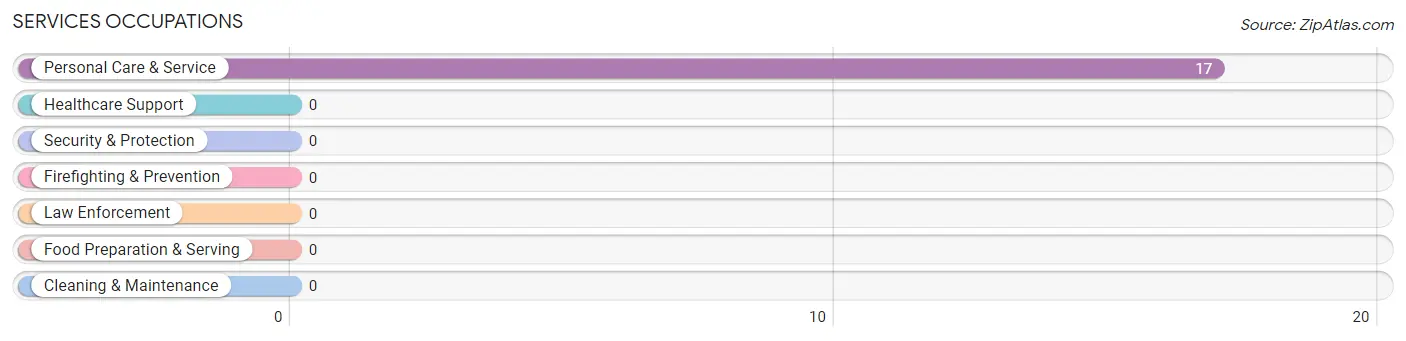
Services Occupations by Sex
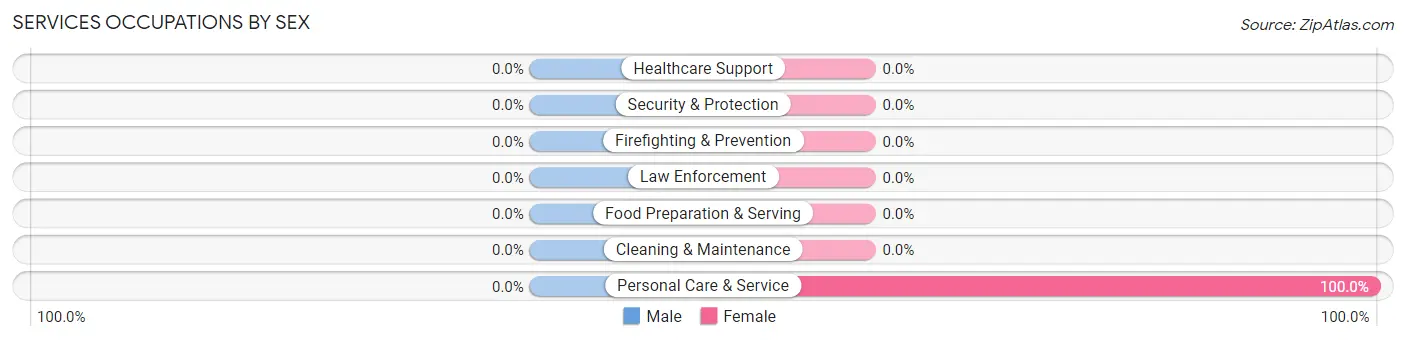
| Occupation | Male | Female |
| Healthcare Support | 0 (0.0%) | 0 (0.0%) |
| Security & Protection | 0 (0.0%) | 0 (0.0%) |
| Firefighting & Prevention | 0 (0.0%) | 0 (0.0%) |
| Law Enforcement | 0 (0.0%) | 0 (0.0%) |
| Food Preparation & Serving | 0 (0.0%) | 0 (0.0%) |
| Cleaning & Maintenance | 0 (0.0%) | 0 (0.0%) |
| Personal Care & Service | 0 (0.0%) | 17 (100.0%) |
| Total (Category) | 0 (0.0%) | 17 (100.0%) |
| Total (Overall) | 76 (65.0%) | 41 (35.0%) |
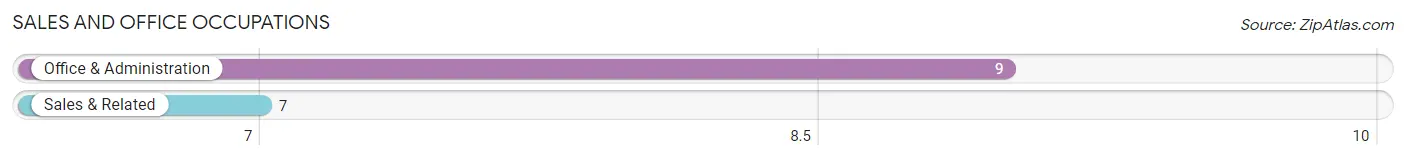
Sales and Office Occupations
The most common Sales and Office occupations in Rader Creek are Office & Administration (9 | 7.7%), and Sales & Related (7 | 6.0%).
Sales and Office Occupations by Sex
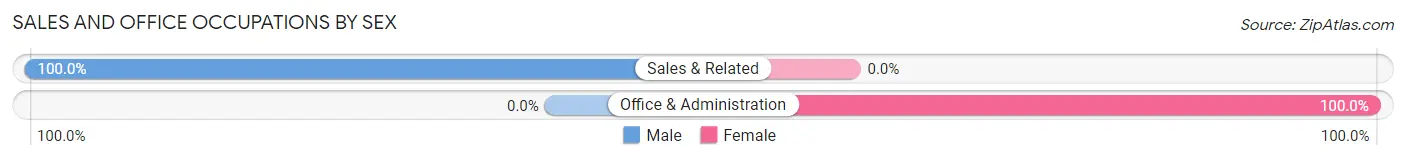
| Occupation | Male | Female |
| Sales & Related | 7 (100.0%) | 0 (0.0%) |
| Office & Administration | 0 (0.0%) | 9 (100.0%) |
| Total (Category) | 7 (43.8%) | 9 (56.2%) |
| Total (Overall) | 76 (65.0%) | 41 (35.0%) |
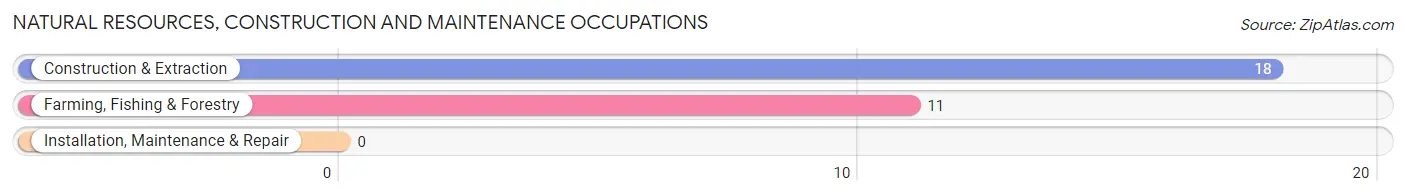
Natural Resources, Construction and Maintenance Occupations
The most common Natural Resources, Construction and Maintenance occupations in Rader Creek are Construction & Extraction (18 | 15.4%), and Farming, Fishing & Forestry (11 | 9.4%).
Natural Resources, Construction and Maintenance Occupations by Sex
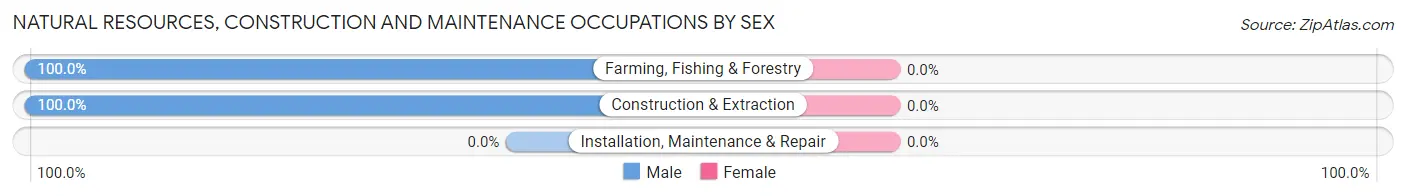
| Occupation | Male | Female |
| Farming, Fishing & Forestry | 11 (100.0%) | 0 (0.0%) |
| Construction & Extraction | 18 (100.0%) | 0 (0.0%) |
| Installation, Maintenance & Repair | 0 (0.0%) | 0 (0.0%) |
| Total (Category) | 29 (100.0%) | 0 (0.0%) |
| Total (Overall) | 76 (65.0%) | 41 (35.0%) |
Production, Transportation and Moving Occupations
The most common Production, Transportation and Moving occupations in Rader Creek are , and Production (30 | 25.6%).
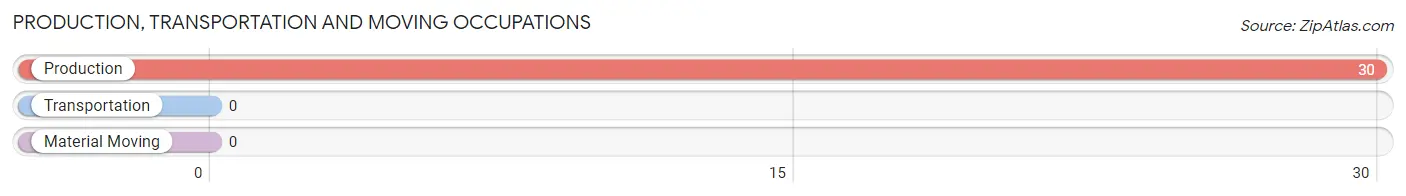
Production, Transportation and Moving Occupations by Sex
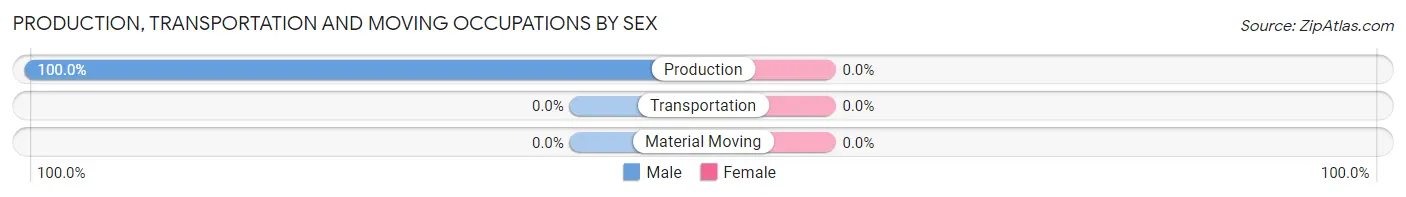
| Occupation | Male | Female |
| Production | 30 (100.0%) | 0 (0.0%) |
| Transportation | 0 (0.0%) | 0 (0.0%) |
| Material Moving | 0 (0.0%) | 0 (0.0%) |
| Total (Category) | 30 (100.0%) | 0 (0.0%) |
| Total (Overall) | 76 (65.0%) | 41 (35.0%) |
Employment Industries by Sex in Rader Creek
Employment Industries in Rader Creek
The major employment industries in Rader Creek include Manufacturing (39 | 33.3%), Health Care & Social Assistance (27 | 23.1%), Construction (18 | 15.4%), Agriculture, Fishing & Hunting (11 | 9.4%), and Wholesale Trade (7 | 6.0%).
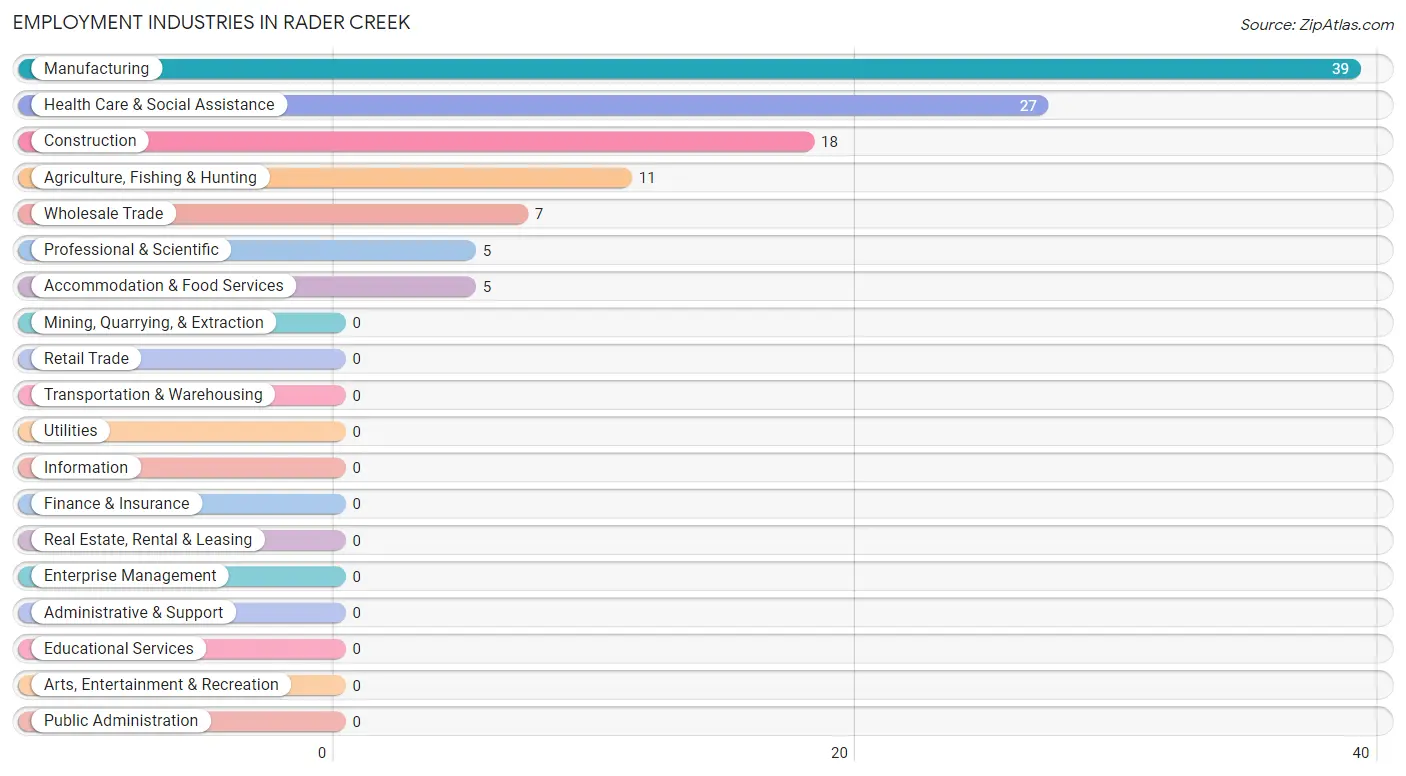
Employment Industries by Sex in Rader Creek
The Rader Creek industries that see more men than women are Agriculture, Fishing & Hunting (100.0%), Construction (100.0%), and Wholesale Trade (100.0%), whereas the industries that tend to have a higher number of women are Health Care & Social Assistance (100.0%), and Manufacturing (23.1%).
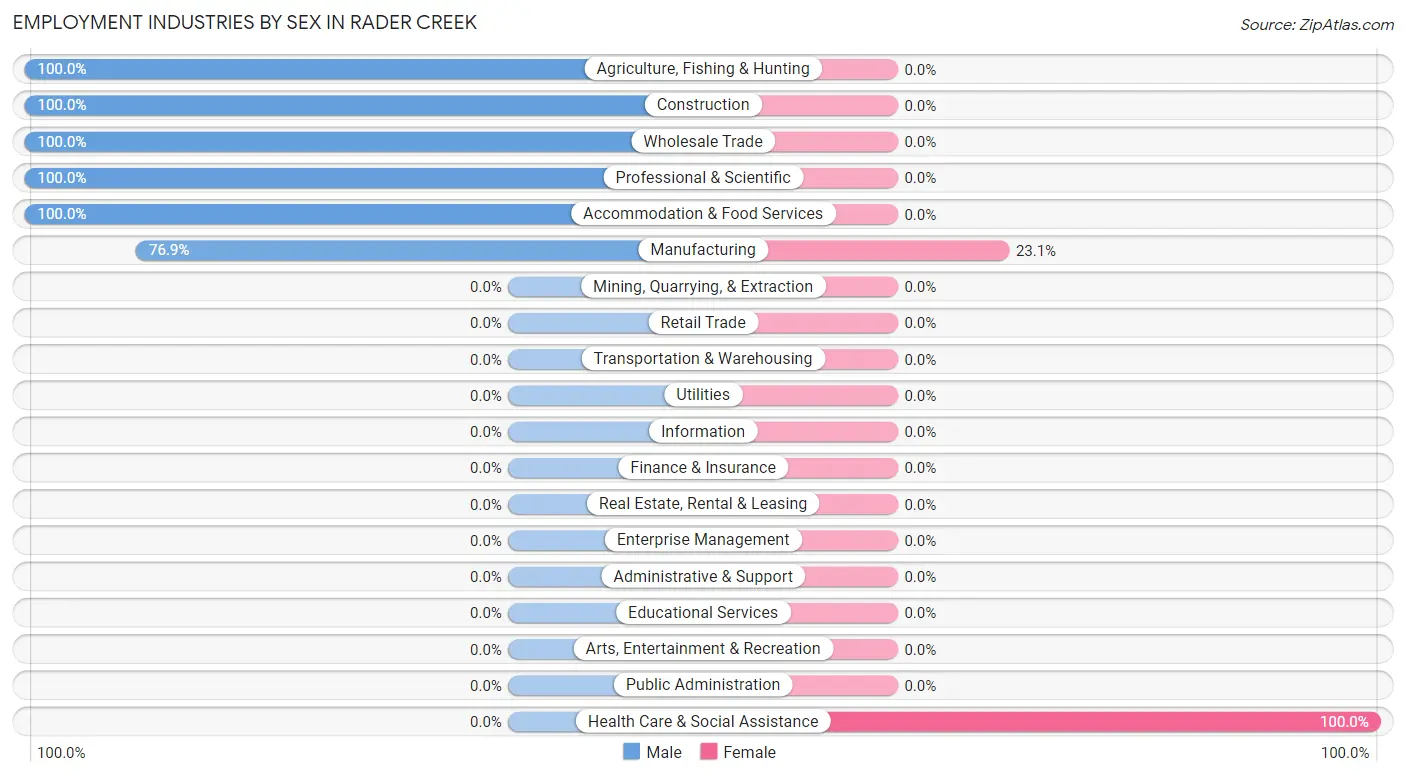
| Industry | Male | Female |
| Agriculture, Fishing & Hunting | 11 (100.0%) | 0 (0.0%) |
| Mining, Quarrying, & Extraction | 0 (0.0%) | 0 (0.0%) |
| Construction | 18 (100.0%) | 0 (0.0%) |
| Manufacturing | 30 (76.9%) | 9 (23.1%) |
| Wholesale Trade | 7 (100.0%) | 0 (0.0%) |
| Retail Trade | 0 (0.0%) | 0 (0.0%) |
| Transportation & Warehousing | 0 (0.0%) | 0 (0.0%) |
| Utilities | 0 (0.0%) | 0 (0.0%) |
| Information | 0 (0.0%) | 0 (0.0%) |
| Finance & Insurance | 0 (0.0%) | 0 (0.0%) |
| Real Estate, Rental & Leasing | 0 (0.0%) | 0 (0.0%) |
| Professional & Scientific | 5 (100.0%) | 0 (0.0%) |
| Enterprise Management | 0 (0.0%) | 0 (0.0%) |
| Administrative & Support | 0 (0.0%) | 0 (0.0%) |
| Educational Services | 0 (0.0%) | 0 (0.0%) |
| Health Care & Social Assistance | 0 (0.0%) | 27 (100.0%) |
| Arts, Entertainment & Recreation | 0 (0.0%) | 0 (0.0%) |
| Accommodation & Food Services | 5 (100.0%) | 0 (0.0%) |
| Public Administration | 0 (0.0%) | 0 (0.0%) |
| Total | 76 (65.0%) | 41 (35.0%) |
Education in Rader Creek
School Enrollment in Rader Creek
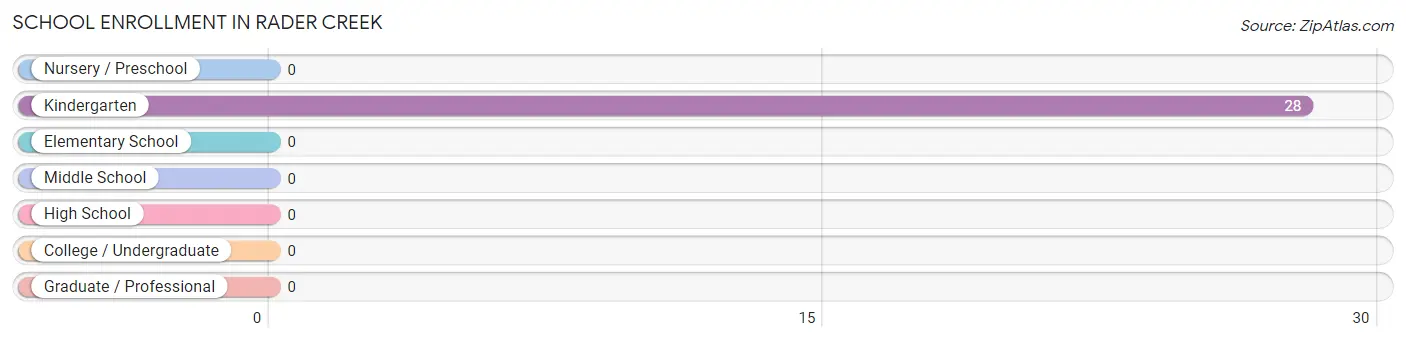
| School Level | # Students | % Students |
| Nursery / Preschool | 0 | 0.0% |
| Kindergarten | 28 | 100.0% |
| Elementary School | 0 | 0.0% |
| Middle School | 0 | 0.0% |
| High School | 0 | 0.0% |
| College / Undergraduate | 0 | 0.0% |
| Graduate / Professional | 0 | 0.0% |
| Total | 28 | 100.0% |
School Enrollment by Age by Funding Source in Rader Creek
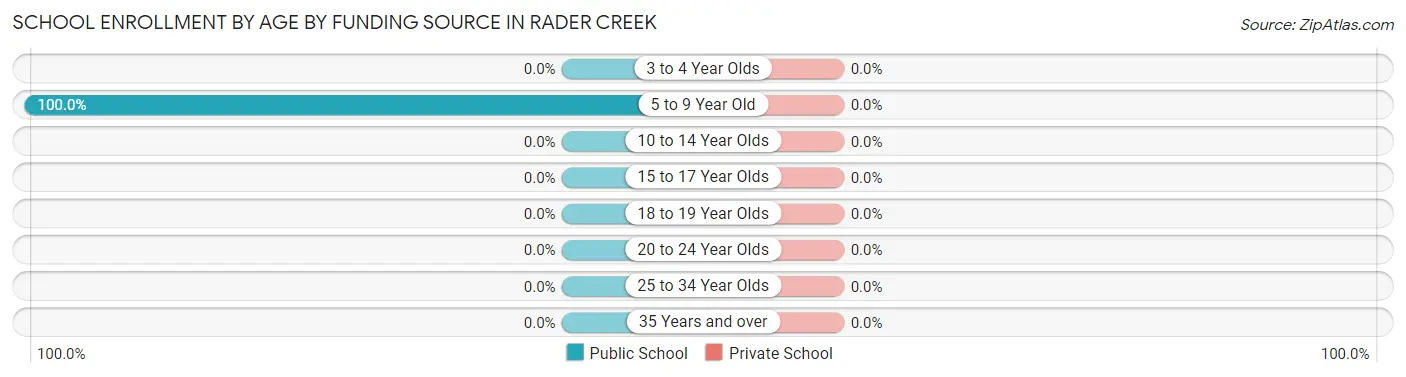
| Age Bracket | Public School | Private School |
| 3 to 4 Year Olds | 0 (0.0%) | 0 (0.0%) |
| 5 to 9 Year Old | 28 (100.0%) | 0 (0.0%) |
| 10 to 14 Year Olds | 0 (0.0%) | 0 (0.0%) |
| 15 to 17 Year Olds | 0 (0.0%) | 0 (0.0%) |
| 18 to 19 Year Olds | 0 (0.0%) | 0 (0.0%) |
| 20 to 24 Year Olds | 0 (0.0%) | 0 (0.0%) |
| 25 to 34 Year Olds | 0 (0.0%) | 0 (0.0%) |
| 35 Years and over | 0 (0.0%) | 0 (0.0%) |
| Total | 28 (100.0%) | 0 (0.0%) |
Educational Attainment by Field of Study in Rader Creek
Business (43 | 41.7%), science & technology (25 | 24.3%), social sciences (16 | 15.5%), bio, nature & agricultural (14 | 13.6%), and liberal arts & history (5 | 4.9%) are the most common fields of study among 103 individuals in Rader Creek who have obtained a bachelor's degree or higher.
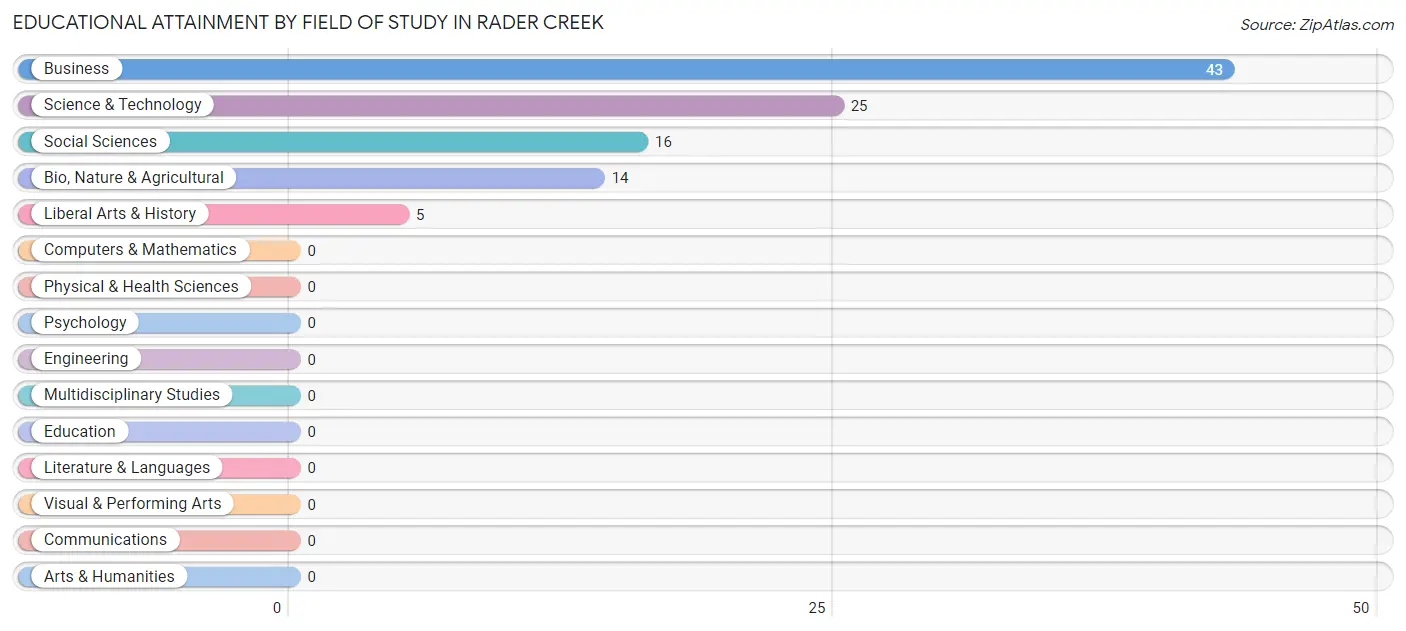
| Field of Study | # Graduates | % Graduates |
| Computers & Mathematics | 0 | 0.0% |
| Bio, Nature & Agricultural | 14 | 13.6% |
| Physical & Health Sciences | 0 | 0.0% |
| Psychology | 0 | 0.0% |
| Social Sciences | 16 | 15.5% |
| Engineering | 0 | 0.0% |
| Multidisciplinary Studies | 0 | 0.0% |
| Science & Technology | 25 | 24.3% |
| Business | 43 | 41.7% |
| Education | 0 | 0.0% |
| Literature & Languages | 0 | 0.0% |
| Liberal Arts & History | 5 | 4.9% |
| Visual & Performing Arts | 0 | 0.0% |
| Communications | 0 | 0.0% |
| Arts & Humanities | 0 | 0.0% |
| Total | 103 | 100.0% |
Transportation & Commute in Rader Creek
Vehicle Availability by Sex in Rader Creek
The most prevalent vehicle ownership categories in Rader Creek are males with 4 vehicles (26, accounting for 34.2%) and females with 4 vehicles (9, making up 100.0%).
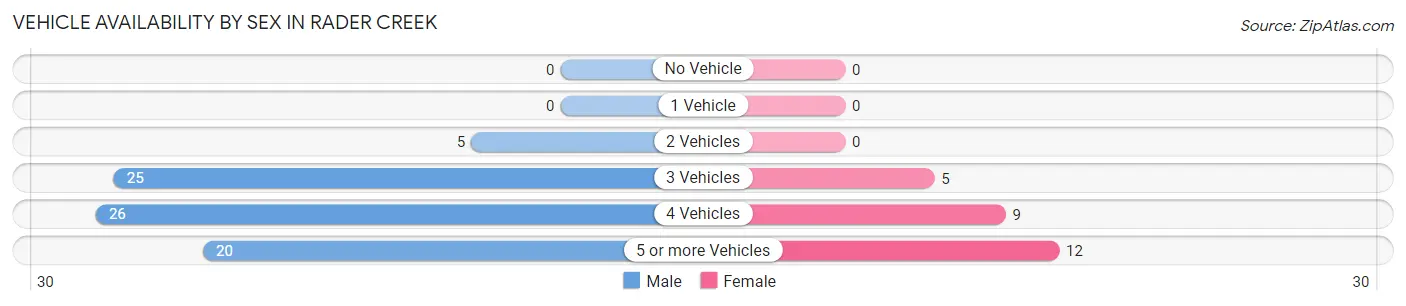
| Vehicles Available | Male | Female |
| No Vehicle | 0 (0.0%) | 0 (0.0%) |
| 1 Vehicle | 0 (0.0%) | 0 (0.0%) |
| 2 Vehicles | 5 (6.6%) | 0 (0.0%) |
| 3 Vehicles | 25 (32.9%) | 5 (19.2%) |
| 4 Vehicles | 26 (34.2%) | 9 (34.6%) |
| 5 or more Vehicles | 20 (26.3%) | 12 (46.2%) |
| Total | 76 (100.0%) | 26 (100.0%) |
Commute Time in Rader Creek
The most frequently occuring commute durations in Rader Creek are 45 to 59 minutes (29 commuters, 34.1%), 30 to 34 minutes (18 commuters, 21.2%), and 90 or more minutes (12 commuters, 14.1%).
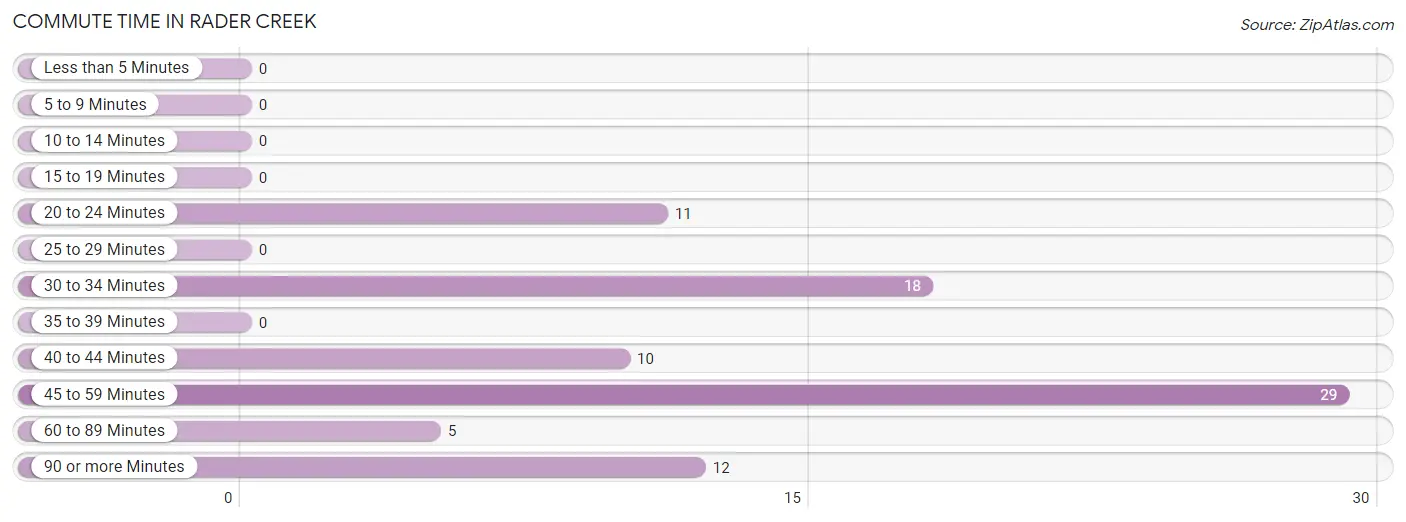
| Commute Time | # Commuters | % Commuters |
| Less than 5 Minutes | 0 | 0.0% |
| 5 to 9 Minutes | 0 | 0.0% |
| 10 to 14 Minutes | 0 | 0.0% |
| 15 to 19 Minutes | 0 | 0.0% |
| 20 to 24 Minutes | 11 | 12.9% |
| 25 to 29 Minutes | 0 | 0.0% |
| 30 to 34 Minutes | 18 | 21.2% |
| 35 to 39 Minutes | 0 | 0.0% |
| 40 to 44 Minutes | 10 | 11.8% |
| 45 to 59 Minutes | 29 | 34.1% |
| 60 to 89 Minutes | 5 | 5.9% |
| 90 or more Minutes | 12 | 14.1% |
Commute Time by Sex in Rader Creek
The most common commute times in Rader Creek are 45 to 59 minutes (20 commuters, 28.2%) for males and 45 to 59 minutes (9 commuters, 64.3%) for females.
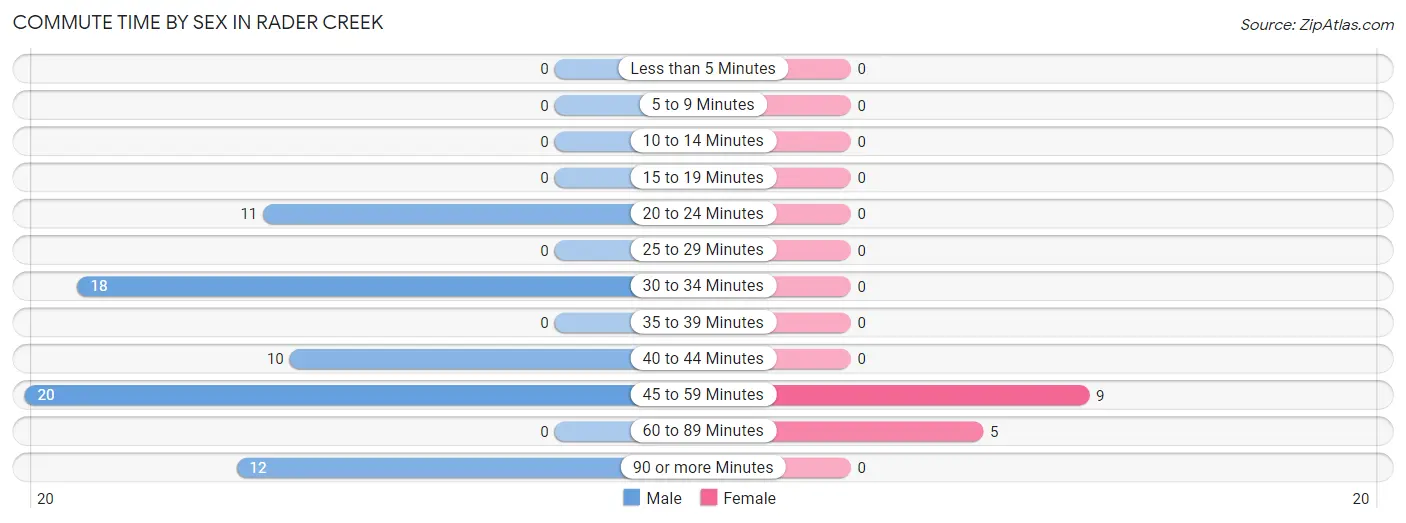
| Commute Time | Male | Female |
| Less than 5 Minutes | 0 (0.0%) | 0 (0.0%) |
| 5 to 9 Minutes | 0 (0.0%) | 0 (0.0%) |
| 10 to 14 Minutes | 0 (0.0%) | 0 (0.0%) |
| 15 to 19 Minutes | 0 (0.0%) | 0 (0.0%) |
| 20 to 24 Minutes | 11 (15.5%) | 0 (0.0%) |
| 25 to 29 Minutes | 0 (0.0%) | 0 (0.0%) |
| 30 to 34 Minutes | 18 (25.4%) | 0 (0.0%) |
| 35 to 39 Minutes | 0 (0.0%) | 0 (0.0%) |
| 40 to 44 Minutes | 10 (14.1%) | 0 (0.0%) |
| 45 to 59 Minutes | 20 (28.2%) | 9 (64.3%) |
| 60 to 89 Minutes | 0 (0.0%) | 5 (35.7%) |
| 90 or more Minutes | 12 (16.9%) | 0 (0.0%) |
Time of Departure to Work by Sex in Rader Creek
The most frequent times of departure to work in Rader Creek are 12:00 PM to 3:59 PM (20, 28.2%) for males and 12:00 PM to 3:59 PM (9, 64.3%) for females.
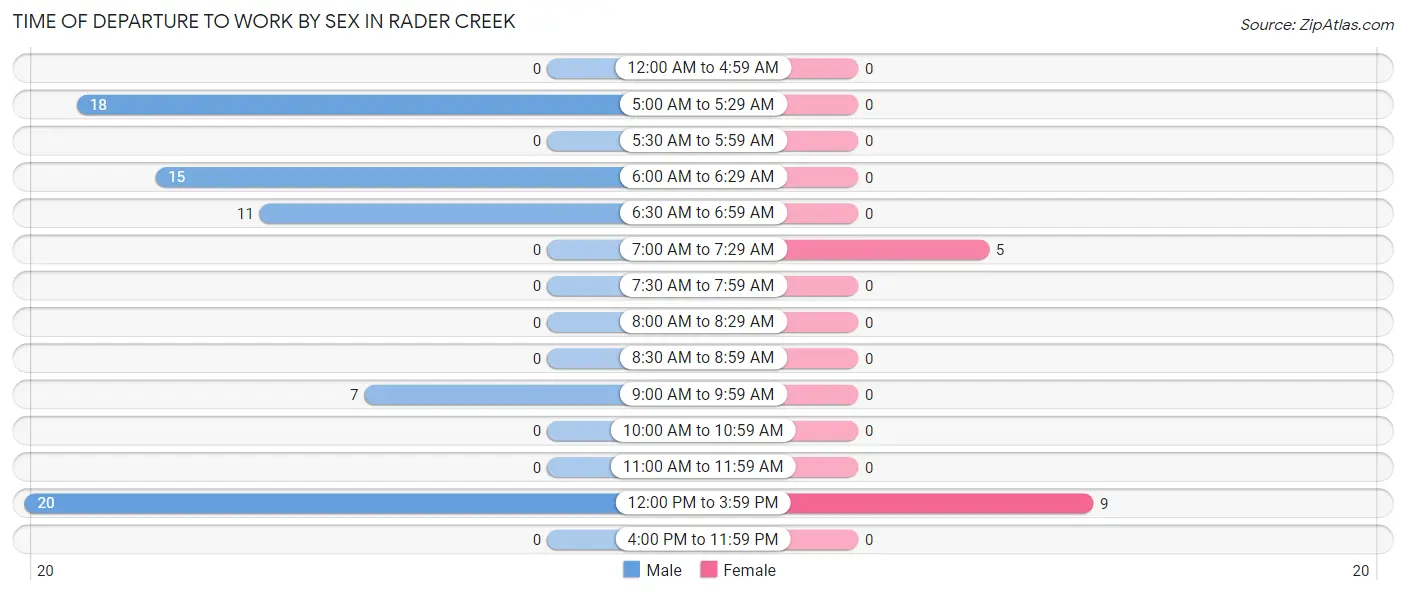
| Time of Departure | Male | Female |
| 12:00 AM to 4:59 AM | 0 (0.0%) | 0 (0.0%) |
| 5:00 AM to 5:29 AM | 18 (25.4%) | 0 (0.0%) |
| 5:30 AM to 5:59 AM | 0 (0.0%) | 0 (0.0%) |
| 6:00 AM to 6:29 AM | 15 (21.1%) | 0 (0.0%) |
| 6:30 AM to 6:59 AM | 11 (15.5%) | 0 (0.0%) |
| 7:00 AM to 7:29 AM | 0 (0.0%) | 5 (35.7%) |
| 7:30 AM to 7:59 AM | 0 (0.0%) | 0 (0.0%) |
| 8:00 AM to 8:29 AM | 0 (0.0%) | 0 (0.0%) |
| 8:30 AM to 8:59 AM | 0 (0.0%) | 0 (0.0%) |
| 9:00 AM to 9:59 AM | 7 (9.9%) | 0 (0.0%) |
| 10:00 AM to 10:59 AM | 0 (0.0%) | 0 (0.0%) |
| 11:00 AM to 11:59 AM | 0 (0.0%) | 0 (0.0%) |
| 12:00 PM to 3:59 PM | 20 (28.2%) | 9 (64.3%) |
| 4:00 PM to 11:59 PM | 0 (0.0%) | 0 (0.0%) |
| Total | 71 (100.0%) | 14 (100.0%) |
Housing Occupancy in Rader Creek
Occupancy by Ownership in Rader Creek
Of the total 190 dwellings in Rader Creek, owner-occupied units account for 182 (95.8%), while renter-occupied units make up 8 (4.2%).
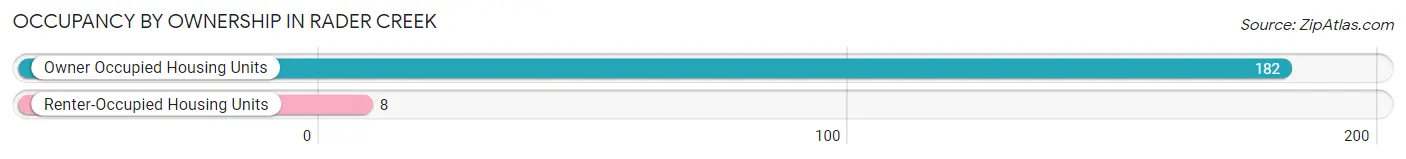
| Occupancy | # Housing Units | % Housing Units |
| Owner Occupied Housing Units | 182 | 95.8% |
| Renter-Occupied Housing Units | 8 | 4.2% |
| Total Occupied Housing Units | 190 | 100.0% |
Occupancy by Household Size in Rader Creek
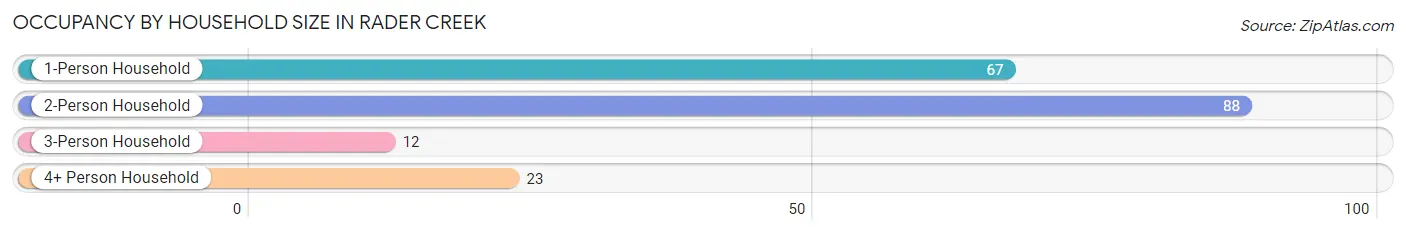
| Household Size | # Housing Units | % Housing Units |
| 1-Person Household | 67 | 35.3% |
| 2-Person Household | 88 | 46.3% |
| 3-Person Household | 12 | 6.3% |
| 4+ Person Household | 23 | 12.1% |
| Total Housing Units | 190 | 100.0% |
Occupancy by Ownership by Household Size in Rader Creek
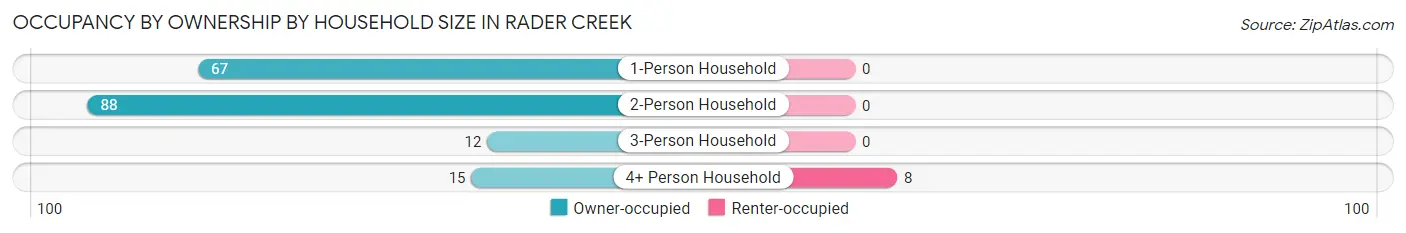
| Household Size | Owner-occupied | Renter-occupied |
| 1-Person Household | 67 (100.0%) | 0 (0.0%) |
| 2-Person Household | 88 (100.0%) | 0 (0.0%) |
| 3-Person Household | 12 (100.0%) | 0 (0.0%) |
| 4+ Person Household | 15 (65.2%) | 8 (34.8%) |
| Total Housing Units | 182 (95.8%) | 8 (4.2%) |
Occupancy by Educational Attainment in Rader Creek
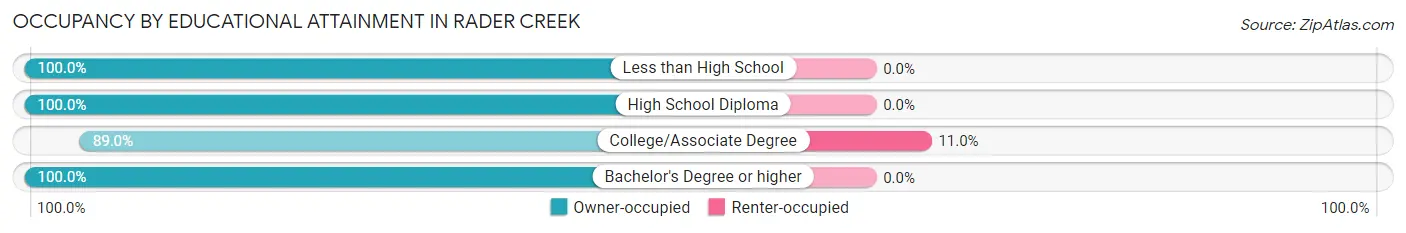
| Household Size | Owner-occupied | Renter-occupied |
| Less than High School | 10 (100.0%) | 0 (0.0%) |
| High School Diploma | 34 (100.0%) | 0 (0.0%) |
| College/Associate Degree | 65 (89.0%) | 8 (11.0%) |
| Bachelor's Degree or higher | 73 (100.0%) | 0 (0.0%) |
Occupancy by Age of Householder in Rader Creek
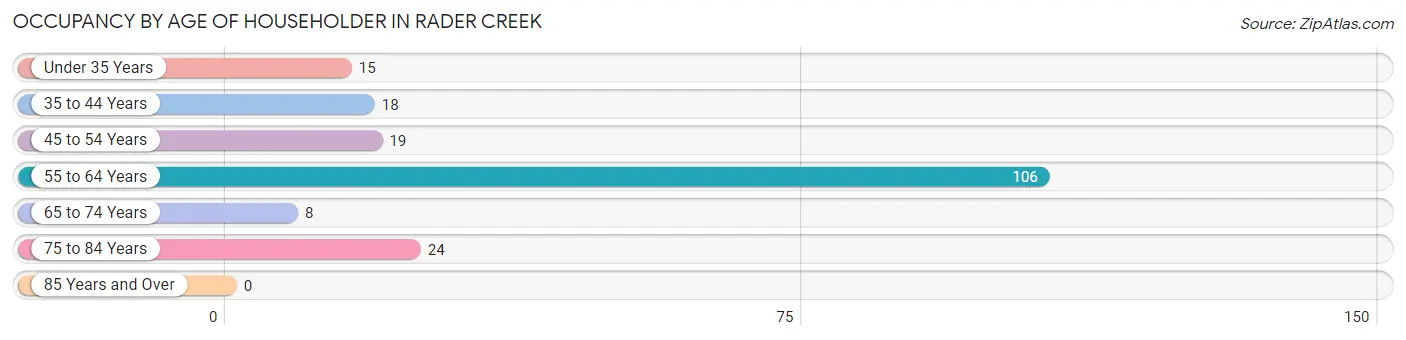
| Age Bracket | # Households | % Households |
| Under 35 Years | 15 | 7.9% |
| 35 to 44 Years | 18 | 9.5% |
| 45 to 54 Years | 19 | 10.0% |
| 55 to 64 Years | 106 | 55.8% |
| 65 to 74 Years | 8 | 4.2% |
| 75 to 84 Years | 24 | 12.6% |
| 85 Years and Over | 0 | 0.0% |
| Total | 190 | 100.0% |
Housing Finances in Rader Creek
Median Income by Occupancy in Rader Creek
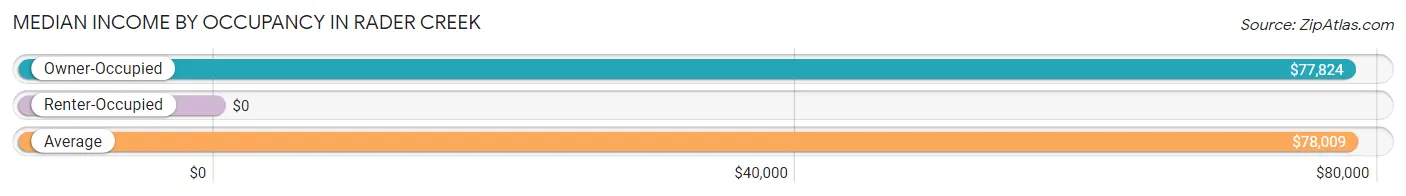
| Occupancy Type | # Households | Median Income |
| Owner-Occupied | 182 (95.8%) | $77,824 |
| Renter-Occupied | 8 (4.2%) | $0 |
| Average | 190 (100.0%) | $78,009 |
Occupancy by Householder Income Bracket in Rader Creek
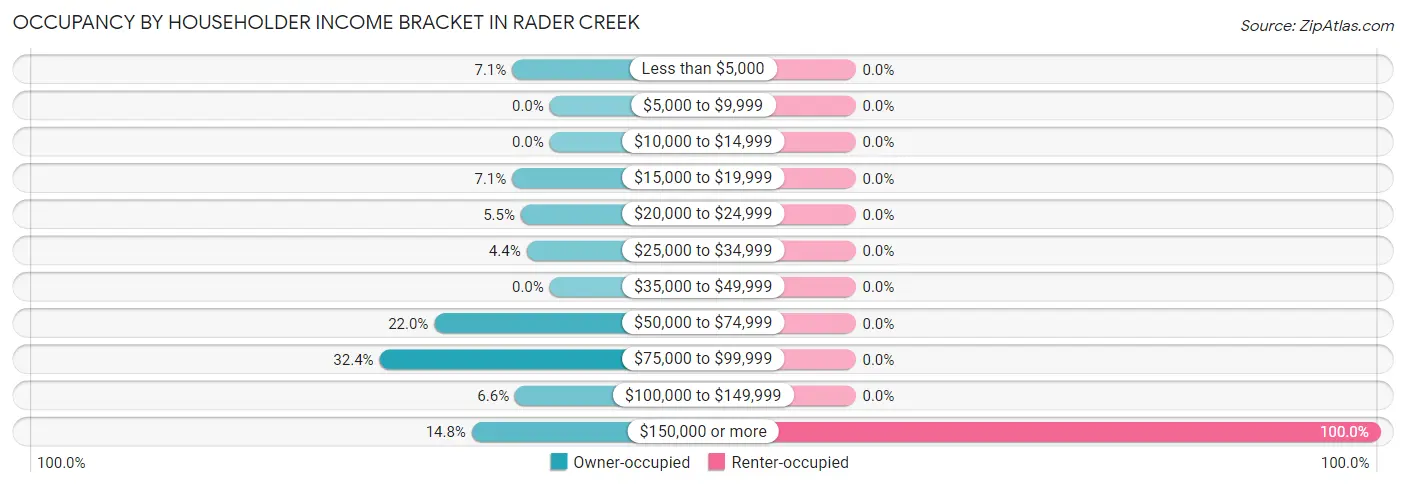
| Income Bracket | Owner-occupied | Renter-occupied |
| Less than $5,000 | 13 (7.1%) | 0 (0.0%) |
| $5,000 to $9,999 | 0 (0.0%) | 0 (0.0%) |
| $10,000 to $14,999 | 0 (0.0%) | 0 (0.0%) |
| $15,000 to $19,999 | 13 (7.1%) | 0 (0.0%) |
| $20,000 to $24,999 | 10 (5.5%) | 0 (0.0%) |
| $25,000 to $34,999 | 8 (4.4%) | 0 (0.0%) |
| $35,000 to $49,999 | 0 (0.0%) | 0 (0.0%) |
| $50,000 to $74,999 | 40 (22.0%) | 0 (0.0%) |
| $75,000 to $99,999 | 59 (32.4%) | 0 (0.0%) |
| $100,000 to $149,999 | 12 (6.6%) | 0 (0.0%) |
| $150,000 or more | 27 (14.8%) | 8 (100.0%) |
| Total | 182 (100.0%) | 8 (100.0%) |
Monthly Housing Cost Tiers in Rader Creek
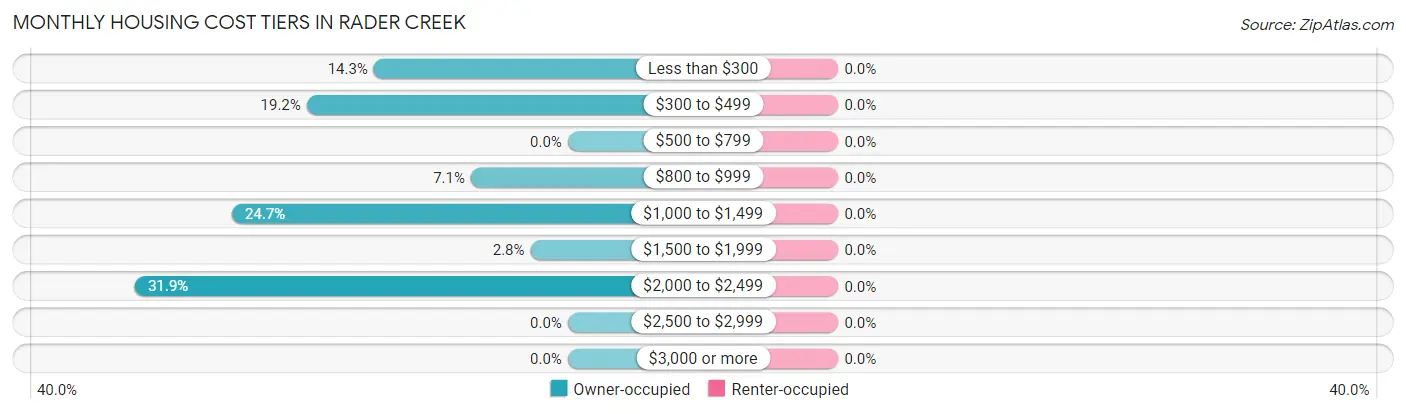
| Monthly Cost | Owner-occupied | Renter-occupied |
| Less than $300 | 26 (14.3%) | 0 (0.0%) |
| $300 to $499 | 35 (19.2%) | 0 (0.0%) |
| $500 to $799 | 0 (0.0%) | 0 (0.0%) |
| $800 to $999 | 13 (7.1%) | 0 (0.0%) |
| $1,000 to $1,499 | 45 (24.7%) | 0 (0.0%) |
| $1,500 to $1,999 | 5 (2.8%) | 0 (0.0%) |
| $2,000 to $2,499 | 58 (31.9%) | 0 (0.0%) |
| $2,500 to $2,999 | 0 (0.0%) | 0 (0.0%) |
| $3,000 or more | 0 (0.0%) | 0 (0.0%) |
| Total | 182 (100.0%) | 8 (100.0%) |
Physical Housing Characteristics in Rader Creek
Housing Structures in Rader Creek
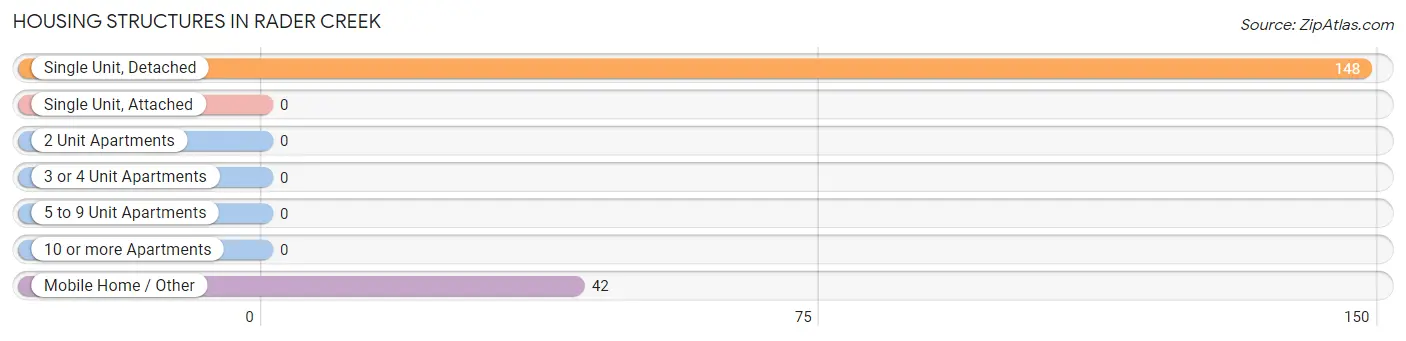
| Structure Type | # Housing Units | % Housing Units |
| Single Unit, Detached | 148 | 77.9% |
| Single Unit, Attached | 0 | 0.0% |
| 2 Unit Apartments | 0 | 0.0% |
| 3 or 4 Unit Apartments | 0 | 0.0% |
| 5 to 9 Unit Apartments | 0 | 0.0% |
| 10 or more Apartments | 0 | 0.0% |
| Mobile Home / Other | 42 | 22.1% |
| Total | 190 | 100.0% |
Housing Structures by Occupancy in Rader Creek
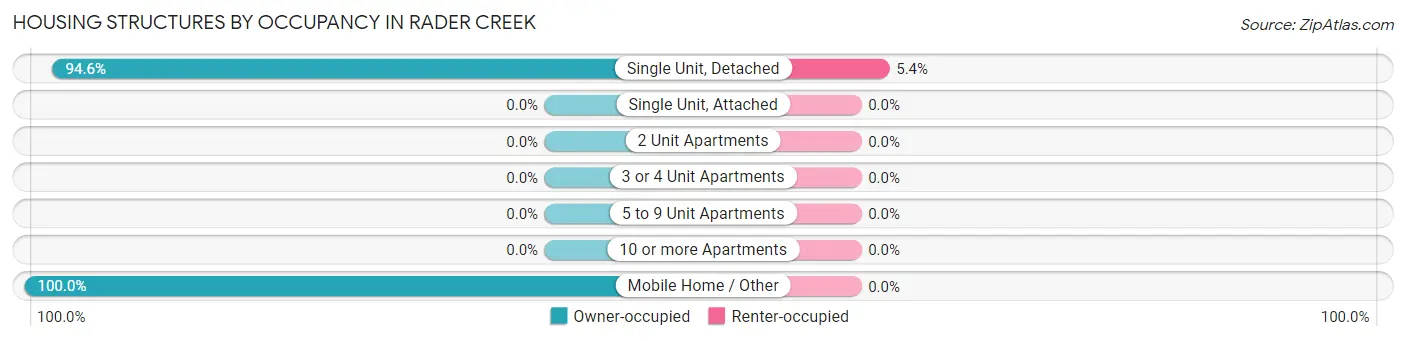
| Structure Type | Owner-occupied | Renter-occupied |
| Single Unit, Detached | 140 (94.6%) | 8 (5.4%) |
| Single Unit, Attached | 0 (0.0%) | 0 (0.0%) |
| 2 Unit Apartments | 0 (0.0%) | 0 (0.0%) |
| 3 or 4 Unit Apartments | 0 (0.0%) | 0 (0.0%) |
| 5 to 9 Unit Apartments | 0 (0.0%) | 0 (0.0%) |
| 10 or more Apartments | 0 (0.0%) | 0 (0.0%) |
| Mobile Home / Other | 42 (100.0%) | 0 (0.0%) |
| Total | 182 (95.8%) | 8 (4.2%) |
Housing Structures by Number of Rooms in Rader Creek
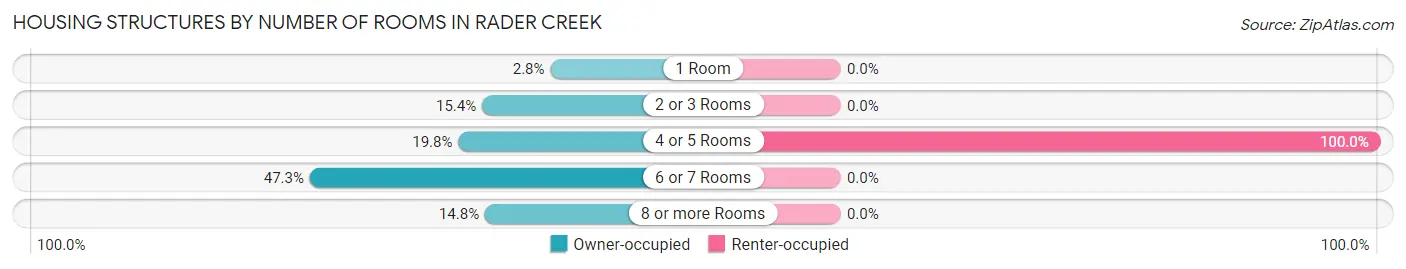
| Number of Rooms | Owner-occupied | Renter-occupied |
| 1 Room | 5 (2.8%) | 0 (0.0%) |
| 2 or 3 Rooms | 28 (15.4%) | 0 (0.0%) |
| 4 or 5 Rooms | 36 (19.8%) | 8 (100.0%) |
| 6 or 7 Rooms | 86 (47.2%) | 0 (0.0%) |
| 8 or more Rooms | 27 (14.8%) | 0 (0.0%) |
| Total | 182 (100.0%) | 8 (100.0%) |
Housing Structure by Heating Type in Rader Creek
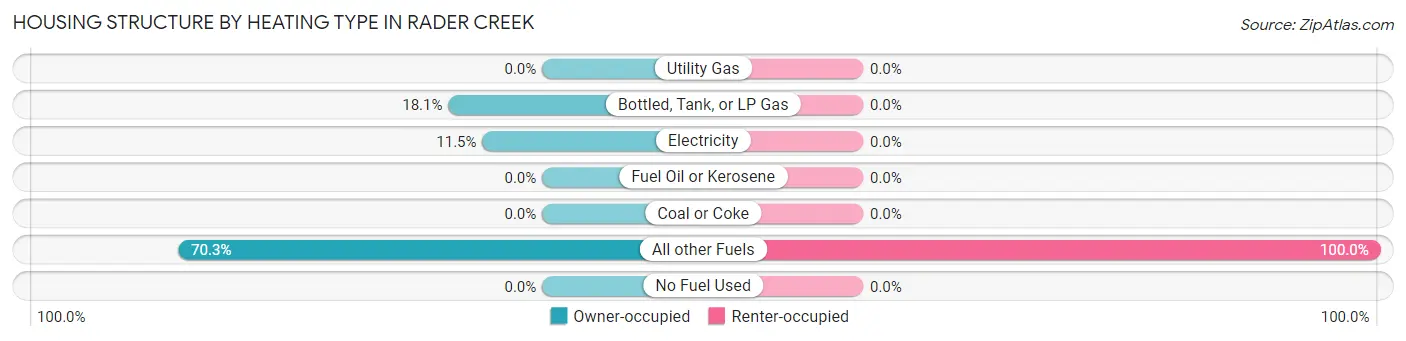
| Heating Type | Owner-occupied | Renter-occupied |
| Utility Gas | 0 (0.0%) | 0 (0.0%) |
| Bottled, Tank, or LP Gas | 33 (18.1%) | 0 (0.0%) |
| Electricity | 21 (11.5%) | 0 (0.0%) |
| Fuel Oil or Kerosene | 0 (0.0%) | 0 (0.0%) |
| Coal or Coke | 0 (0.0%) | 0 (0.0%) |
| All other Fuels | 128 (70.3%) | 8 (100.0%) |
| No Fuel Used | 0 (0.0%) | 0 (0.0%) |
| Total | 182 (100.0%) | 8 (100.0%) |
Household Vehicle Usage in Rader Creek
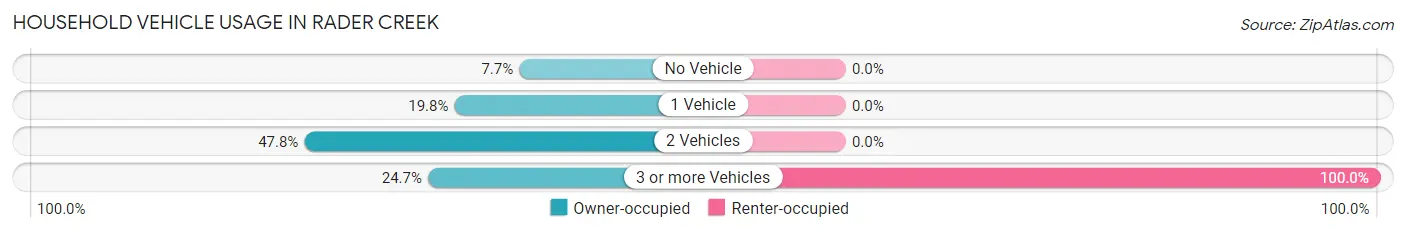
| Vehicles per Household | Owner-occupied | Renter-occupied |
| No Vehicle | 14 (7.7%) | 0 (0.0%) |
| 1 Vehicle | 36 (19.8%) | 0 (0.0%) |
| 2 Vehicles | 87 (47.8%) | 0 (0.0%) |
| 3 or more Vehicles | 45 (24.7%) | 8 (100.0%) |
| Total | 182 (100.0%) | 8 (100.0%) |
Real Estate & Mortgages in Rader Creek
Real Estate and Mortgage Overview in Rader Creek
| Characteristic | Without Mortgage | With Mortgage |
| Housing Units | 61 | 121 |
| Median Property Value | $215,600 | $307,900 |
| Median Household Income | $78,523 | $15 |
| Monthly Housing Costs | $328 | $0 |
| Real Estate Taxes | - | - |
Property Value by Mortgage Status in Rader Creek
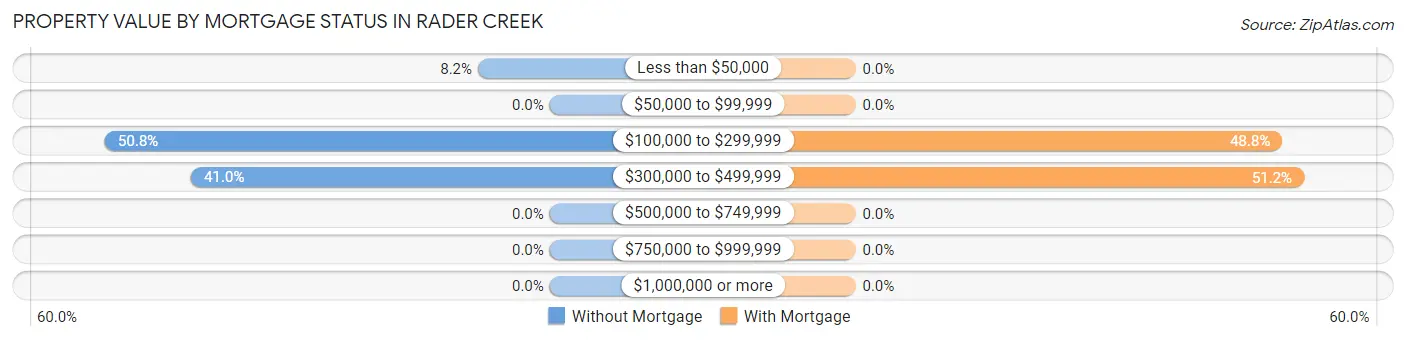
| Property Value | Without Mortgage | With Mortgage |
| Less than $50,000 | 5 (8.2%) | 0 (0.0%) |
| $50,000 to $99,999 | 0 (0.0%) | 0 (0.0%) |
| $100,000 to $299,999 | 31 (50.8%) | 59 (48.8%) |
| $300,000 to $499,999 | 25 (41.0%) | 62 (51.2%) |
| $500,000 to $749,999 | 0 (0.0%) | 0 (0.0%) |
| $750,000 to $999,999 | 0 (0.0%) | 0 (0.0%) |
| $1,000,000 or more | 0 (0.0%) | 0 (0.0%) |
| Total | 61 (100.0%) | 121 (100.0%) |
Household Income by Mortgage Status in Rader Creek
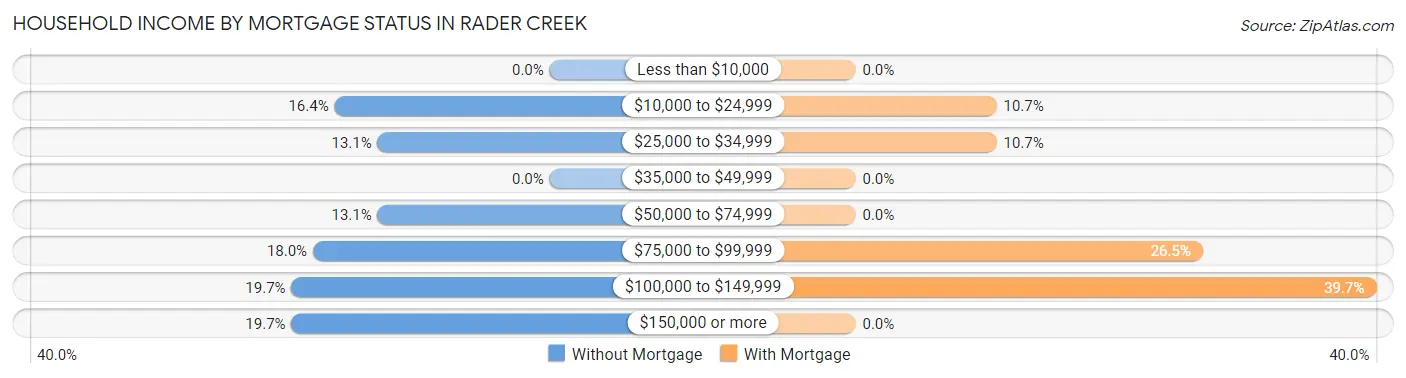
| Household Income | Without Mortgage | With Mortgage |
| Less than $10,000 | 0 (0.0%) | 0 (0.0%) |
| $10,000 to $24,999 | 10 (16.4%) | 13 (10.7%) |
| $25,000 to $34,999 | 8 (13.1%) | 13 (10.7%) |
| $35,000 to $49,999 | 0 (0.0%) | 0 (0.0%) |
| $50,000 to $74,999 | 8 (13.1%) | 0 (0.0%) |
| $75,000 to $99,999 | 11 (18.0%) | 32 (26.5%) |
| $100,000 to $149,999 | 12 (19.7%) | 48 (39.7%) |
| $150,000 or more | 12 (19.7%) | 0 (0.0%) |
| Total | 61 (100.0%) | 121 (100.0%) |
Property Value to Household Income Ratio in Rader Creek
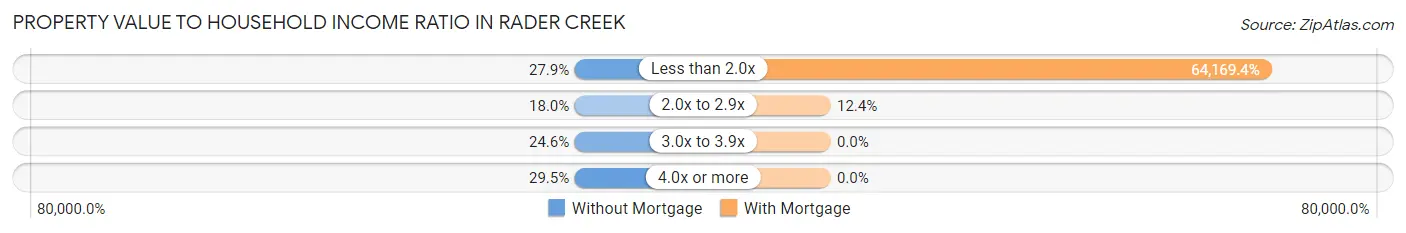
| Value-to-Income Ratio | Without Mortgage | With Mortgage |
| Less than 2.0x | 17 (27.9%) | 77,645 (64,169.4%) |
| 2.0x to 2.9x | 11 (18.0%) | 15 (12.4%) |
| 3.0x to 3.9x | 15 (24.6%) | 0 (0.0%) |
| 4.0x or more | 18 (29.5%) | 0 (0.0%) |
| Total | 61 (100.0%) | 121 (100.0%) |
Real Estate Taxes by Mortgage Status in Rader Creek
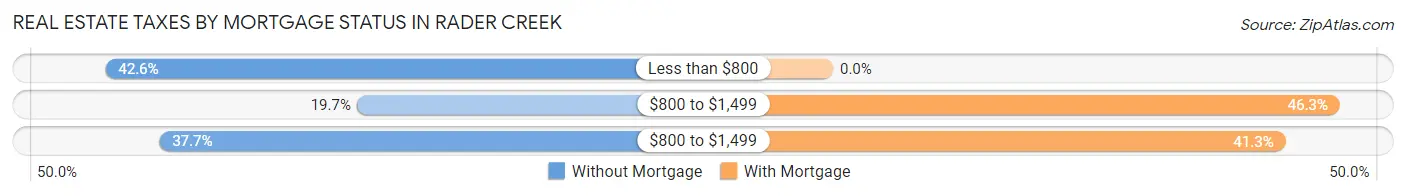
| Property Taxes | Without Mortgage | With Mortgage |
| Less than $800 | 26 (42.6%) | 0 (0.0%) |
| $800 to $1,499 | 12 (19.7%) | 56 (46.3%) |
| $800 to $1,499 | 23 (37.7%) | 50 (41.3%) |
| Total | 61 (100.0%) | 121 (100.0%) |
Health & Disability in Rader Creek
Health Insurance Coverage by Age in Rader Creek
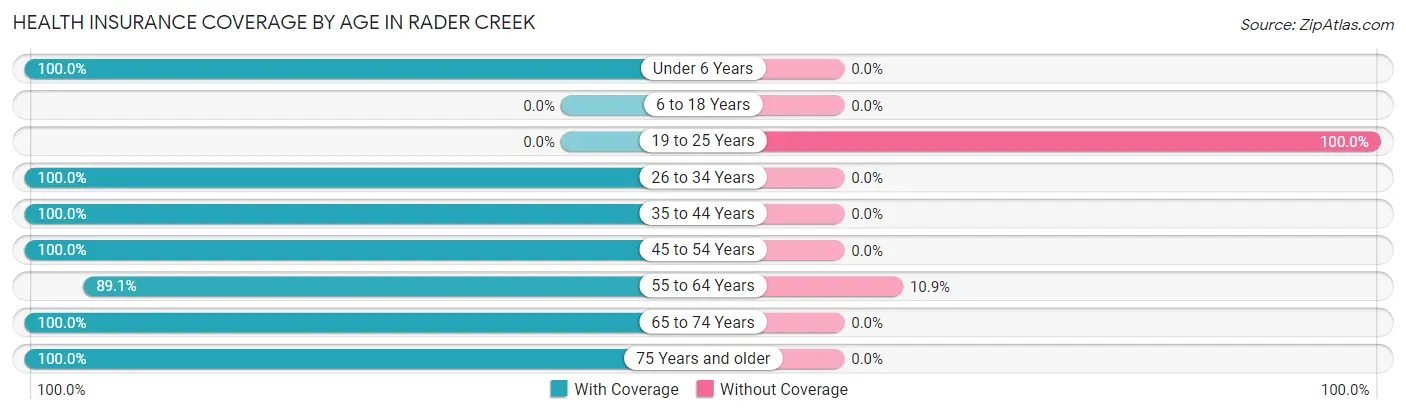
| Age Bracket | With Coverage | Without Coverage |
| Under 6 Years | 63 (100.0%) | 0 (0.0%) |
| 6 to 18 Years | 0 (0.0%) | 0 (0.0%) |
| 19 to 25 Years | 0 (0.0%) | 19 (100.0%) |
| 26 to 34 Years | 43 (100.0%) | 0 (0.0%) |
| 35 to 44 Years | 18 (100.0%) | 0 (0.0%) |
| 45 to 54 Years | 61 (100.0%) | 0 (0.0%) |
| 55 to 64 Years | 114 (89.1%) | 14 (10.9%) |
| 65 to 74 Years | 32 (100.0%) | 0 (0.0%) |
| 75 Years and older | 37 (100.0%) | 0 (0.0%) |
| Total | 368 (91.8%) | 33 (8.2%) |
Health Insurance Coverage by Citizenship Status in Rader Creek
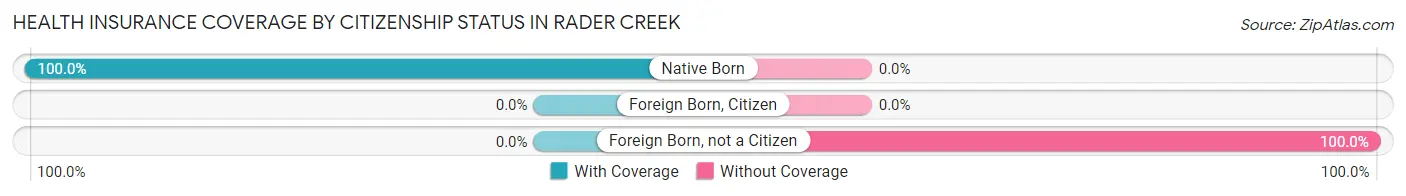
| Citizenship Status | With Coverage | Without Coverage |
| Native Born | 63 (100.0%) | 0 (0.0%) |
| Foreign Born, Citizen | 0 (0.0%) | 0 (0.0%) |
| Foreign Born, not a Citizen | 0 (0.0%) | 19 (100.0%) |
Health Insurance Coverage by Household Income in Rader Creek
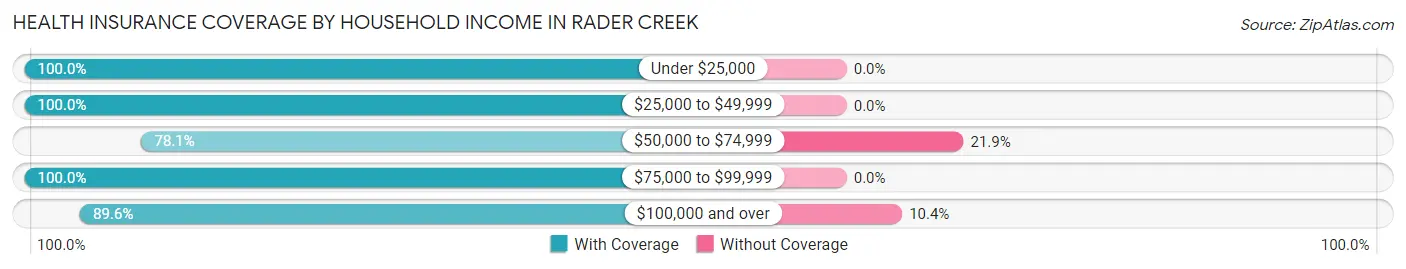
| Household Income | With Coverage | Without Coverage |
| Under $25,000 | 36 (100.0%) | 0 (0.0%) |
| $25,000 to $49,999 | 8 (100.0%) | 0 (0.0%) |
| $50,000 to $74,999 | 50 (78.1%) | 14 (21.9%) |
| $75,000 to $99,999 | 110 (100.0%) | 0 (0.0%) |
| $100,000 and over | 164 (89.6%) | 19 (10.4%) |
Public vs Private Health Insurance Coverage by Age in Rader Creek
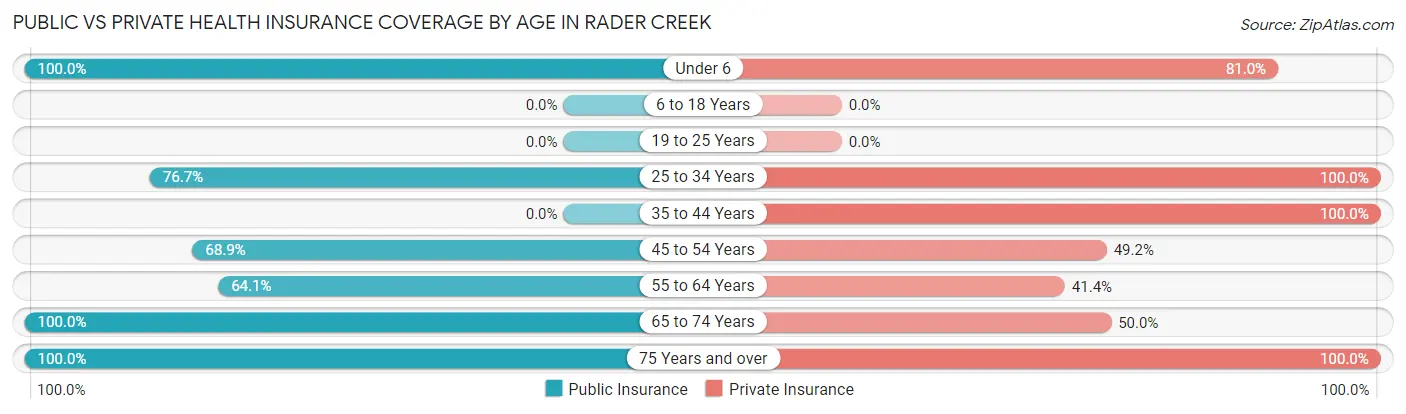
| Age Bracket | Public Insurance | Private Insurance |
| Under 6 | 63 (100.0%) | 51 (80.9%) |
| 6 to 18 Years | 0 (0.0%) | 0 (0.0%) |
| 19 to 25 Years | 0 (0.0%) | 0 (0.0%) |
| 25 to 34 Years | 33 (76.7%) | 43 (100.0%) |
| 35 to 44 Years | 0 (0.0%) | 18 (100.0%) |
| 45 to 54 Years | 42 (68.9%) | 30 (49.2%) |
| 55 to 64 Years | 82 (64.1%) | 53 (41.4%) |
| 65 to 74 Years | 32 (100.0%) | 16 (50.0%) |
| 75 Years and over | 37 (100.0%) | 37 (100.0%) |
| Total | 289 (72.1%) | 248 (61.9%) |
Disability Status by Sex by Age in Rader Creek
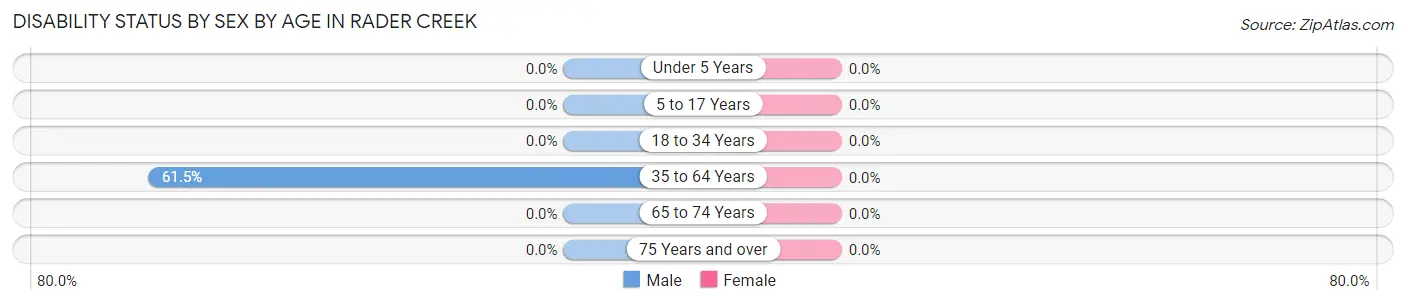
| Age Bracket | Male | Female |
| Under 5 Years | 0 (0.0%) | 0 (0.0%) |
| 5 to 17 Years | 0 (0.0%) | 0 (0.0%) |
| 18 to 34 Years | 0 (0.0%) | 0 (0.0%) |
| 35 to 64 Years | 64 (61.5%) | 0 (0.0%) |
| 65 to 74 Years | 0 (0.0%) | 0 (0.0%) |
| 75 Years and over | 0 (0.0%) | 0 (0.0%) |
Disability Class by Sex by Age in Rader Creek
Disability Class: Hearing Difficulty
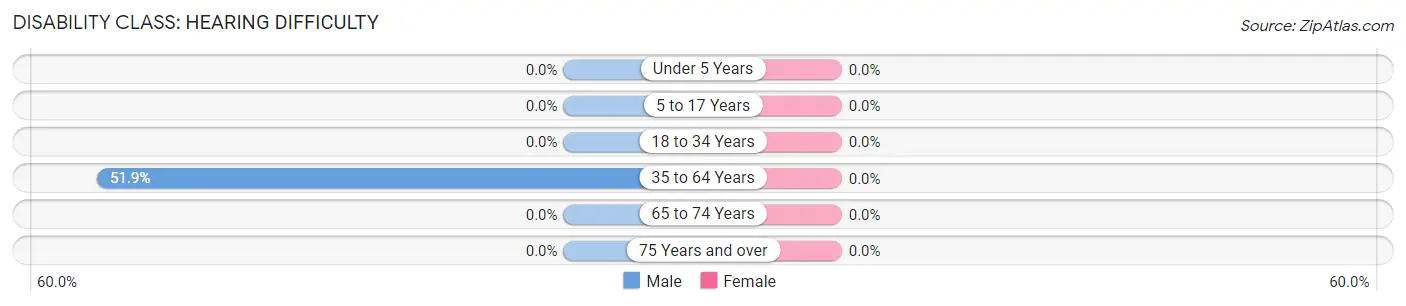
| Age Bracket | Male | Female |
| Under 5 Years | 0 (0.0%) | 0 (0.0%) |
| 5 to 17 Years | 0 (0.0%) | 0 (0.0%) |
| 18 to 34 Years | 0 (0.0%) | 0 (0.0%) |
| 35 to 64 Years | 54 (51.9%) | 0 (0.0%) |
| 65 to 74 Years | 0 (0.0%) | 0 (0.0%) |
| 75 Years and over | 0 (0.0%) | 0 (0.0%) |
Disability Class: Vision Difficulty
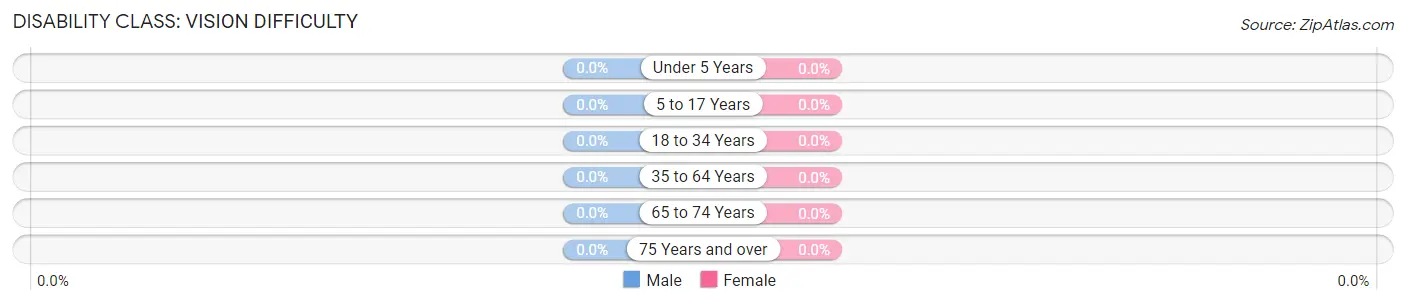
| Age Bracket | Male | Female |
| Under 5 Years | 0 (0.0%) | 0 (0.0%) |
| 5 to 17 Years | 0 (0.0%) | 0 (0.0%) |
| 18 to 34 Years | 0 (0.0%) | 0 (0.0%) |
| 35 to 64 Years | 0 (0.0%) | 0 (0.0%) |
| 65 to 74 Years | 0 (0.0%) | 0 (0.0%) |
| 75 Years and over | 0 (0.0%) | 0 (0.0%) |
Disability Class: Cognitive Difficulty
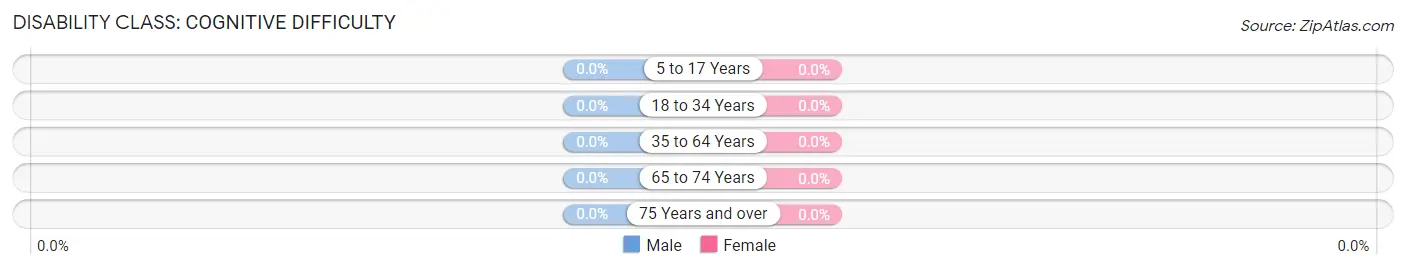
| Age Bracket | Male | Female |
| 5 to 17 Years | 0 (0.0%) | 0 (0.0%) |
| 18 to 34 Years | 0 (0.0%) | 0 (0.0%) |
| 35 to 64 Years | 0 (0.0%) | 0 (0.0%) |
| 65 to 74 Years | 0 (0.0%) | 0 (0.0%) |
| 75 Years and over | 0 (0.0%) | 0 (0.0%) |
Disability Class: Ambulatory Difficulty
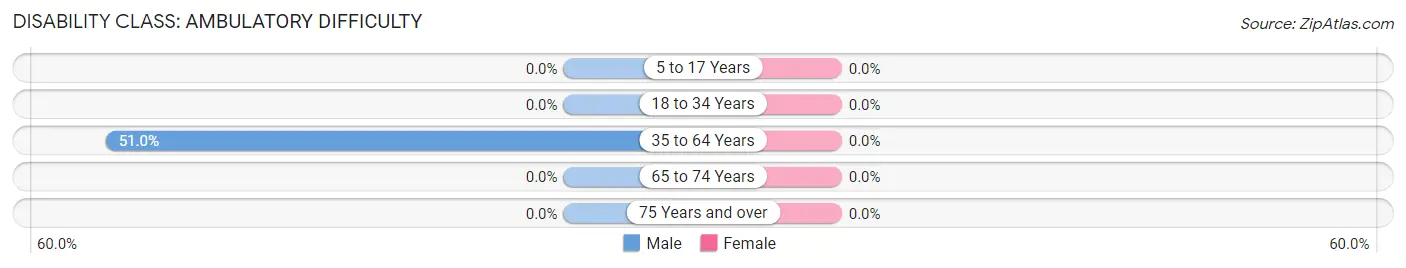
| Age Bracket | Male | Female |
| 5 to 17 Years | 0 (0.0%) | 0 (0.0%) |
| 18 to 34 Years | 0 (0.0%) | 0 (0.0%) |
| 35 to 64 Years | 53 (51.0%) | 0 (0.0%) |
| 65 to 74 Years | 0 (0.0%) | 0 (0.0%) |
| 75 Years and over | 0 (0.0%) | 0 (0.0%) |
Disability Class: Self-Care Difficulty
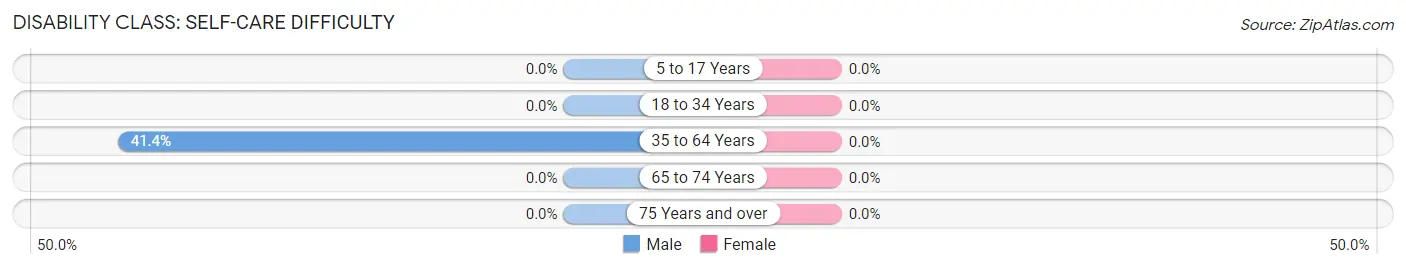
| Age Bracket | Male | Female |
| 5 to 17 Years | 0 (0.0%) | 0 (0.0%) |
| 18 to 34 Years | 0 (0.0%) | 0 (0.0%) |
| 35 to 64 Years | 43 (41.3%) | 0 (0.0%) |
| 65 to 74 Years | 0 (0.0%) | 0 (0.0%) |
| 75 Years and over | 0 (0.0%) | 0 (0.0%) |
Technology Access in Rader Creek
Computing Device Access in Rader Creek
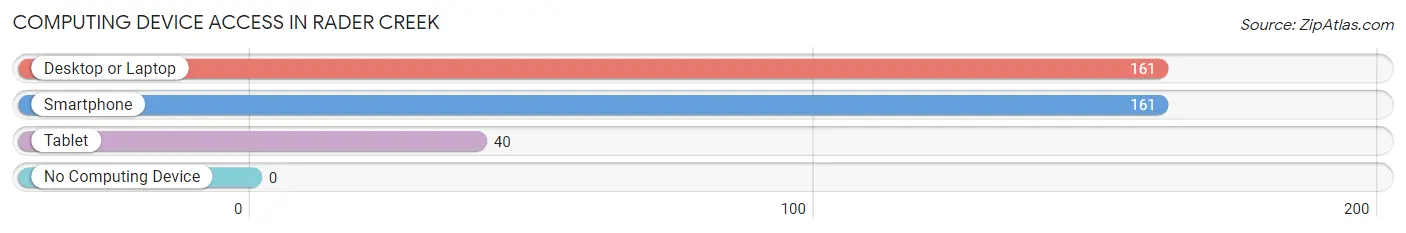
| Device Type | # Households | % Households |
| Desktop or Laptop | 161 | 84.7% |
| Smartphone | 161 | 84.7% |
| Tablet | 40 | 21.0% |
| No Computing Device | 0 | 0.0% |
| Total | 190 | 100.0% |
Internet Access in Rader Creek
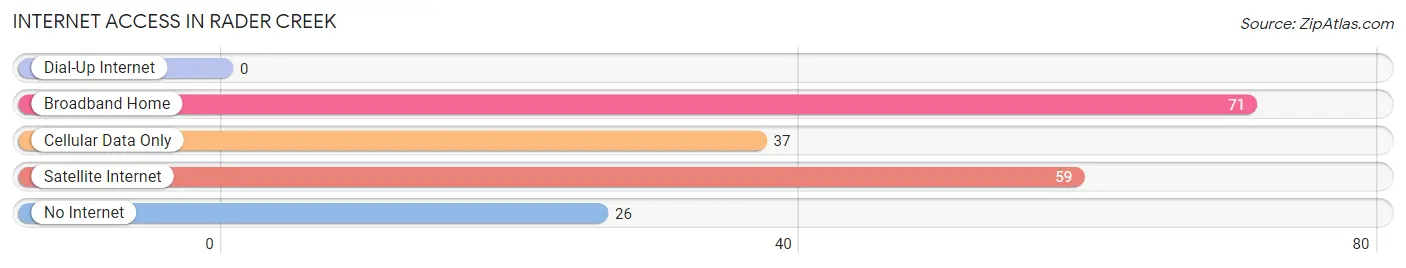
| Internet Type | # Households | % Households |
| Dial-Up Internet | 0 | 0.0% |
| Broadband Home | 71 | 37.4% |
| Cellular Data Only | 37 | 19.5% |
| Satellite Internet | 59 | 31.0% |
| No Internet | 26 | 13.7% |
| Total | 190 | 100.0% |
Rader Creek Summary
Rader Creek is a small unincorporated community located in the western part of Montana, in the United States. It is situated in the Flathead Valley, in the Flathead County, and is part of the Kalispell Micropolitan Statistical Area. The community is located on the banks of the Flathead River, and is surrounded by the Flathead National Forest.
History
Rader Creek was first settled in the late 1800s by homesteaders who were attracted to the area by its abundant natural resources. The first settlers were mostly of German and Scandinavian descent, and they established a small farming community. The community was named after the Rader family, who were among the first settlers in the area.
In the early 1900s, the community began to grow as more settlers moved to the area. The town was incorporated in 1909, and the first post office was established in 1910. The town was home to a variety of businesses, including a general store, a blacksmith shop, a sawmill, and a hotel.
Geography
Rader Creek is located in the western part of Montana, in the Flathead Valley. The community is situated on the banks of the Flathead River, and is surrounded by the Flathead National Forest. The area is characterized by rolling hills, lush forests, and abundant wildlife. The climate is generally mild, with warm summers and cold winters.
Economy
Rader Creek is a small, rural community with a limited economy. The primary economic activity in the area is agriculture, with the majority of the population engaged in farming and ranching. The area is also home to a variety of small businesses, including a general store, a sawmill, and a hotel.
Demographics
As of the 2010 census, the population of Rader Creek was 545. The racial makeup of the town was 97.3% White, 0.2% African American, 0.4% Native American, 0.2% Asian, 0.2% from other races, and 1.7% from two or more races. The median household income was $37,500, and the median family income was $41,250.
Conclusion
Rader Creek is a small, rural community located in the western part of Montana. The community was first settled in the late 1800s by homesteaders, and has since grown to become a small farming community. The economy of the area is primarily based on agriculture, with the majority of the population engaged in farming and ranching. The population of Rader Creek is 545, and the median household income is $37,500.
Common Questions
What is Per Capita Income in Rader Creek?
Per Capita income in Rader Creek is $40,735.
What is the Median Family Income in Rader Creek?
Median Family Income in Rader Creek is $79,329.
What is the Median Household income in Rader Creek?
Median Household Income in Rader Creek is $78,009.
What is Inequality or Gini Index in Rader Creek?
Inequality or Gini Index in Rader Creek is 0.39.
What is the Total Population of Rader Creek?
Total Population of Rader Creek is 401.
What is the Total Male Population of Rader Creek?
Total Male Population of Rader Creek is 228.
What is the Total Female Population of Rader Creek?
Total Female Population of Rader Creek is 173.
What is the Ratio of Males per 100 Females in Rader Creek?
There are 131.79 Males per 100 Females in Rader Creek.
What is the Ratio of Females per 100 Males in Rader Creek?
There are 75.88 Females per 100 Males in Rader Creek.
What is the Median Population Age in Rader Creek?
Median Population Age in Rader Creek is 54.8 Years.
What is the Average Family Size in Rader Creek
Average Family Size in Rader Creek is 2.6 People.
What is the Average Household Size in Rader Creek
Average Household Size in Rader Creek is 2.1 People.
How Large is the Labor Force in Rader Creek?
There are 135 People in the Labor Forcein in Rader Creek.
What is the Percentage of People in the Labor Force in Rader Creek?
39.9% of People are in the Labor Force in Rader Creek.
What is the Unemployment Rate in Rader Creek?
Unemployment Rate in Rader Creek is 13.3%.