Charlo, MT Map & Demographics
Charlo Map
Charlo Overview
$25,778
PER CAPITA INCOME
$65,417
AVG FAMILY INCOME
$39,167
AVG HOUSEHOLD INCOME
0.44
INEQUALITY / GINI INDEX
356
TOTAL POPULATION
189
MALE POPULATION
167
FEMALE POPULATION
113.17
MALES / 100 FEMALES
88.36
FEMALES / 100 MALES
45.0
MEDIAN AGE
3.0
AVG FAMILY SIZE
2.2
AVG HOUSEHOLD SIZE
180
LABOR FORCE [ PEOPLE ]
60.2%
PERCENT IN LABOR FORCE
5.6%
UNEMPLOYMENT RATE
Charlo Zip Codes
Charlo Area Codes
Income in Charlo
Income Overview in Charlo
Per Capita Income in Charlo is $25,778, while median incomes of families and households are $65,417 and $39,167 respectively.
| Characteristic | Number | Measure |
| Per Capita Income | 356 | $25,778 |
| Median Family Income | 85 | $65,417 |
| Mean Family Income | 85 | $69,287 |
| Median Household Income | 160 | $39,167 |
| Mean Household Income | 160 | $51,668 |
| Income Deficit | 85 | $0 |
| Wage / Income Gap (%) | 356 | 0.00% |
| Wage / Income Gap ($) | 356 | 100.00¢ per $1 |
| Gini / Inequality Index | 356 | 0.44 |
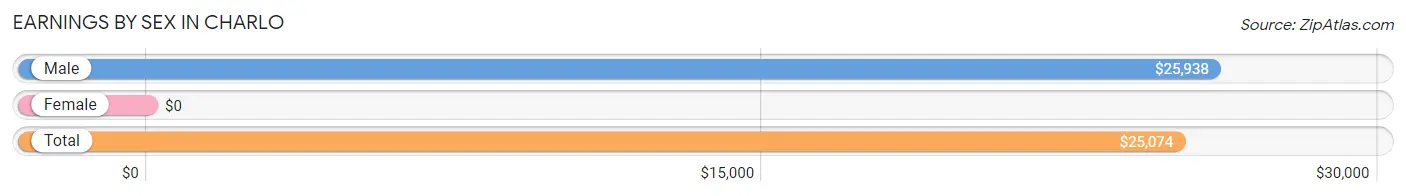
Earnings by Sex in Charlo
| Sex | Number | Average Earnings |
| Male | 109 (50.7%) | $25,938 |
| Female | 106 (49.3%) | $0 |
| Total | 215 (100.0%) | $25,074 |
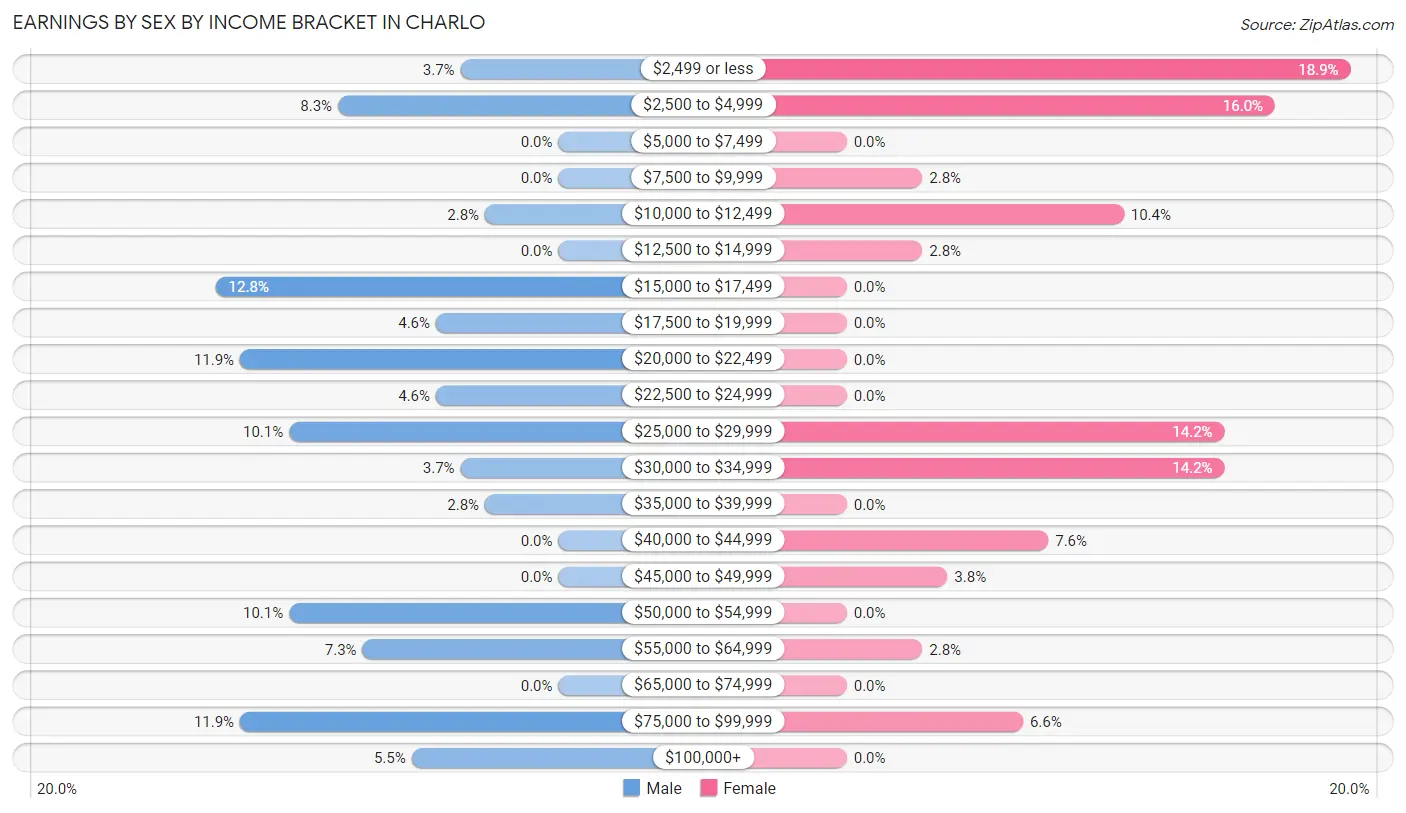
Earnings by Sex by Income Bracket in Charlo
The most common earnings brackets in Charlo are $15,000 to $17,499 for men (14 | 12.8%) and $2,499 or less for women (20 | 18.9%).
| Income | Male | Female |
| $2,499 or less | 4 (3.7%) | 20 (18.9%) |
| $2,500 to $4,999 | 9 (8.3%) | 17 (16.0%) |
| $5,000 to $7,499 | 0 (0.0%) | 0 (0.0%) |
| $7,500 to $9,999 | 0 (0.0%) | 3 (2.8%) |
| $10,000 to $12,499 | 3 (2.8%) | 11 (10.4%) |
| $12,500 to $14,999 | 0 (0.0%) | 3 (2.8%) |
| $15,000 to $17,499 | 14 (12.8%) | 0 (0.0%) |
| $17,500 to $19,999 | 5 (4.6%) | 0 (0.0%) |
| $20,000 to $22,499 | 13 (11.9%) | 0 (0.0%) |
| $22,500 to $24,999 | 5 (4.6%) | 0 (0.0%) |
| $25,000 to $29,999 | 11 (10.1%) | 15 (14.1%) |
| $30,000 to $34,999 | 4 (3.7%) | 15 (14.1%) |
| $35,000 to $39,999 | 3 (2.8%) | 0 (0.0%) |
| $40,000 to $44,999 | 0 (0.0%) | 8 (7.5%) |
| $45,000 to $49,999 | 0 (0.0%) | 4 (3.8%) |
| $50,000 to $54,999 | 11 (10.1%) | 0 (0.0%) |
| $55,000 to $64,999 | 8 (7.3%) | 3 (2.8%) |
| $65,000 to $74,999 | 0 (0.0%) | 0 (0.0%) |
| $75,000 to $99,999 | 13 (11.9%) | 7 (6.6%) |
| $100,000+ | 6 (5.5%) | 0 (0.0%) |
| Total | 109 (100.0%) | 106 (100.0%) |
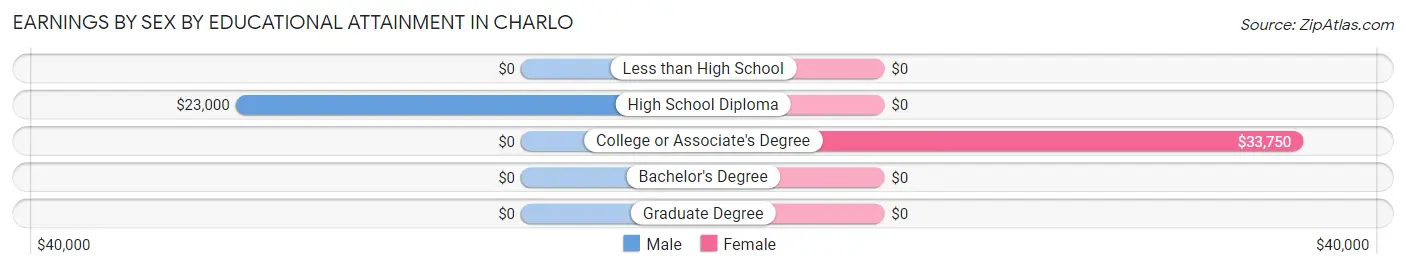
Earnings by Sex by Educational Attainment in Charlo
| Educational Attainment | Male Income | Female Income |
| Less than High School | - | - |
| High School Diploma | $23,000 | $0 |
| College or Associate's Degree | - | - |
| Bachelor's Degree | - | - |
| Graduate Degree | - | - |
| Total | $28,036 | $0 |
Family Income in Charlo
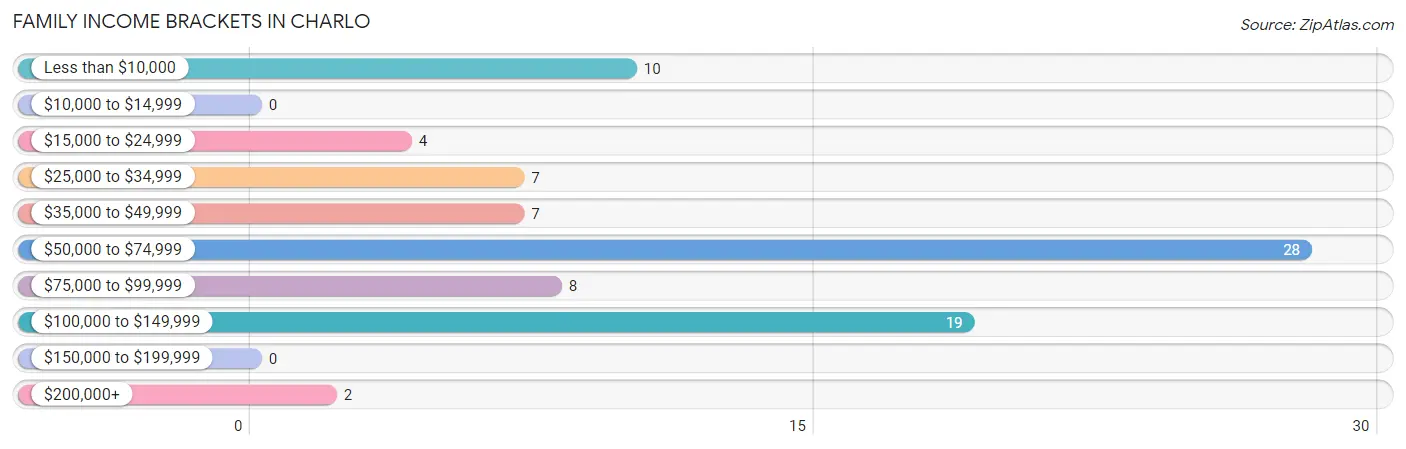
Family Income Brackets in Charlo
According to the Charlo family income data, there are 28 families falling into the $50,000 to $74,999 income range, which is the most common income bracket and makes up 32.9% of all families.
| Income Bracket | # Families | % Families |
| Less than $10,000 | 10 | 11.8% |
| $10,000 to $14,999 | 0 | 0.0% |
| $15,000 to $24,999 | 4 | 4.7% |
| $25,000 to $34,999 | 7 | 8.2% |
| $35,000 to $49,999 | 7 | 8.2% |
| $50,000 to $74,999 | 28 | 32.9% |
| $75,000 to $99,999 | 8 | 9.4% |
| $100,000 to $149,999 | 19 | 22.4% |
| $150,000 to $199,999 | 0 | 0.0% |
| $200,000+ | 2 | 2.4% |
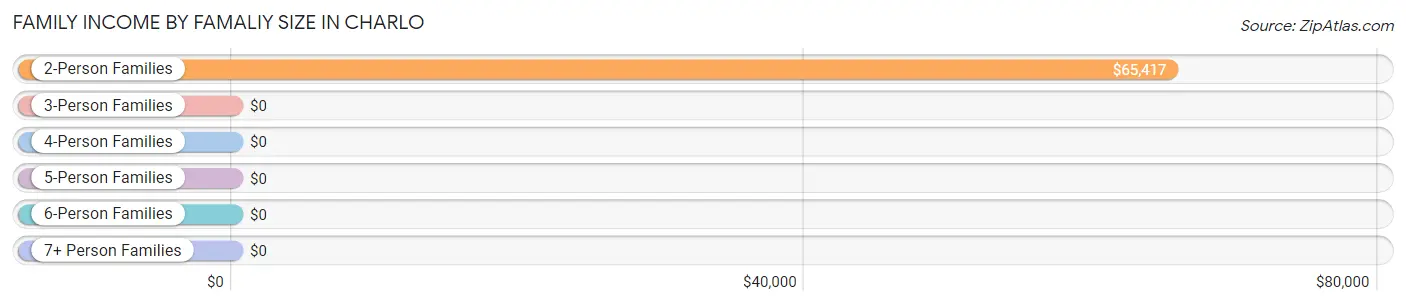
Family Income by Famaliy Size in Charlo
2-person families (43 | 50.6%) account for the highest median family income in Charlo with $65,417 per family, while 2-person families (43 | 50.6%) have the highest median income of $32,708 per family member.
| Income Bracket | # Families | Median Income |
| 2-Person Families | 43 (50.6%) | $65,417 |
| 3-Person Families | 21 (24.7%) | $0 |
| 4-Person Families | 13 (15.3%) | $0 |
| 5-Person Families | 8 (9.4%) | $0 |
| 6-Person Families | 0 (0.0%) | $0 |
| 7+ Person Families | 0 (0.0%) | $0 |
| Total | 85 (100.0%) | $65,417 |
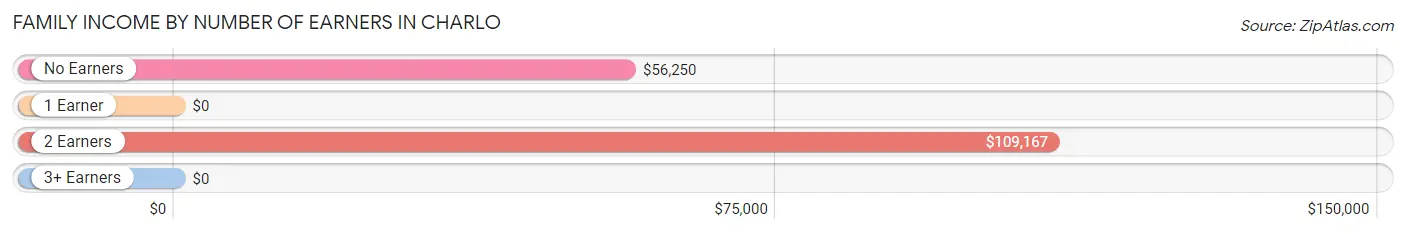
Family Income by Number of Earners in Charlo
| Number of Earners | # Families | Median Income |
| No Earners | 14 (16.5%) | $56,250 |
| 1 Earner | 26 (30.6%) | $0 |
| 2 Earners | 34 (40.0%) | $109,167 |
| 3+ Earners | 11 (12.9%) | $0 |
| Total | 85 (100.0%) | $65,417 |
Household Income in Charlo
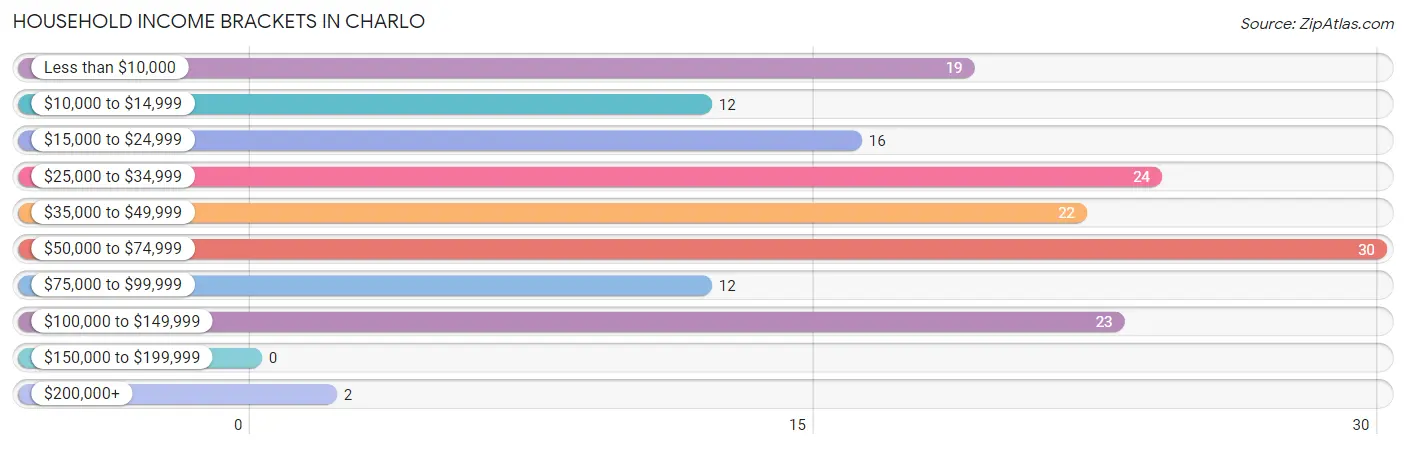
Household Income Brackets in Charlo
With 30 households falling in the category, the $50,000 to $74,999 income range is the most frequent in Charlo, accounting for 18.8% of all households.
| Income Bracket | # Households | % Households |
| Less than $10,000 | 19 | 11.9% |
| $10,000 to $14,999 | 12 | 7.5% |
| $15,000 to $24,999 | 16 | 10.0% |
| $25,000 to $34,999 | 24 | 15.0% |
| $35,000 to $49,999 | 22 | 13.8% |
| $50,000 to $74,999 | 30 | 18.8% |
| $75,000 to $99,999 | 12 | 7.5% |
| $100,000 to $149,999 | 23 | 14.4% |
| $150,000 to $199,999 | 0 | 0.0% |
| $200,000+ | 2 | 1.3% |
Household Income by Householder Age in Charlo
The median household income in Charlo is $39,167, with the highest median household income of $58,125 found in the 45 to 64 years age bracket for the primary householder. A total of 57 households (35.6%) fall into this category. Meanwhile, the 15 to 24 years age bracket for the primary householder has the lowest median household income of $0, with 4 households (2.5%) in this group.
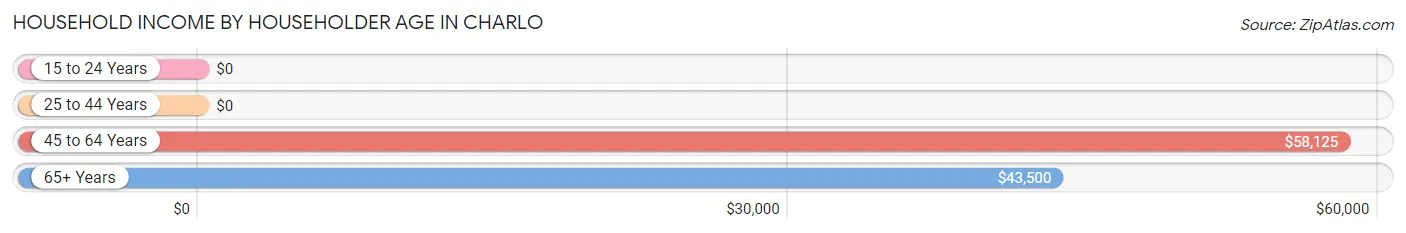
| Income Bracket | # Households | Median Income |
| 15 to 24 Years | 4 (2.5%) | $0 |
| 25 to 44 Years | 37 (23.1%) | $0 |
| 45 to 64 Years | 57 (35.6%) | $58,125 |
| 65+ Years | 62 (38.8%) | $43,500 |
| Total | 160 (100.0%) | $39,167 |
Poverty in Charlo
Income Below Poverty by Sex and Age in Charlo
With 7.9% poverty level for males and 20.4% for females among the residents of Charlo, 5 year old males and 6 to 11 year old females are the most vulnerable to poverty, with 4 males (50.0%) and 1 females (100.0%) in their respective age groups living below the poverty level.
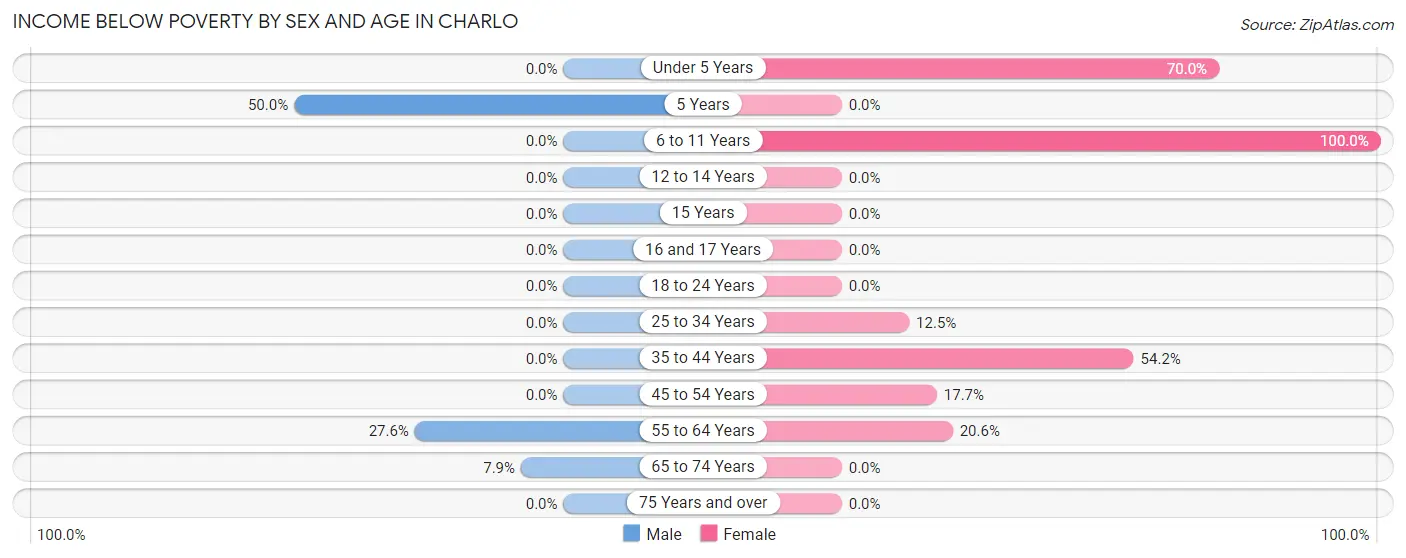
| Age Bracket | Male | Female |
| Under 5 Years | 0 (0.0%) | 7 (70.0%) |
| 5 Years | 4 (50.0%) | 0 (0.0%) |
| 6 to 11 Years | 0 (0.0%) | 1 (100.0%) |
| 12 to 14 Years | 0 (0.0%) | 0 (0.0%) |
| 15 Years | 0 (0.0%) | 0 (0.0%) |
| 16 and 17 Years | 0 (0.0%) | 0 (0.0%) |
| 18 to 24 Years | 0 (0.0%) | 0 (0.0%) |
| 25 to 34 Years | 0 (0.0%) | 3 (12.5%) |
| 35 to 44 Years | 0 (0.0%) | 13 (54.2%) |
| 45 to 54 Years | 0 (0.0%) | 3 (17.6%) |
| 55 to 64 Years | 8 (27.6%) | 7 (20.6%) |
| 65 to 74 Years | 3 (7.9%) | 0 (0.0%) |
| 75 Years and over | 0 (0.0%) | 0 (0.0%) |
| Total | 15 (7.9%) | 34 (20.4%) |
Income Above Poverty by Sex and Age in Charlo
According to the poverty statistics in Charlo, males aged under 5 years and females aged 5 years are the age groups that are most secure financially, with 100.0% of males and 100.0% of females in these age groups living above the poverty line.
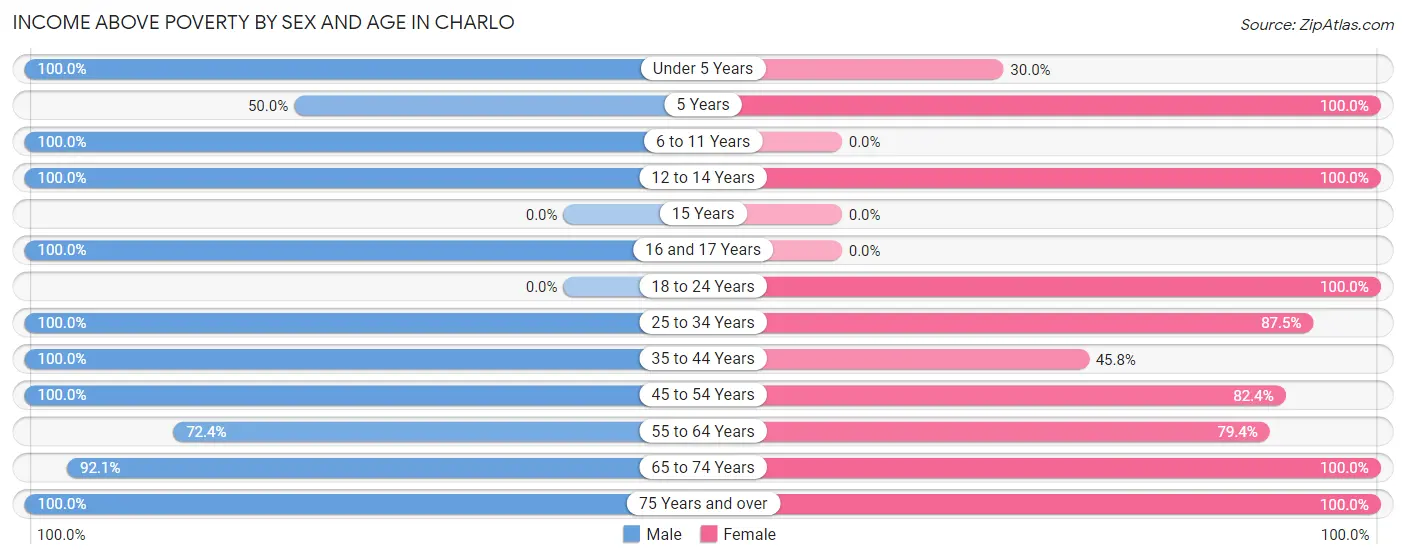
| Age Bracket | Male | Female |
| Under 5 Years | 7 (100.0%) | 3 (30.0%) |
| 5 Years | 4 (50.0%) | 3 (100.0%) |
| 6 to 11 Years | 14 (100.0%) | 0 (0.0%) |
| 12 to 14 Years | 7 (100.0%) | 7 (100.0%) |
| 15 Years | 0 (0.0%) | 0 (0.0%) |
| 16 and 17 Years | 8 (100.0%) | 0 (0.0%) |
| 18 to 24 Years | 0 (0.0%) | 11 (100.0%) |
| 25 to 34 Years | 28 (100.0%) | 21 (87.5%) |
| 35 to 44 Years | 26 (100.0%) | 11 (45.8%) |
| 45 to 54 Years | 14 (100.0%) | 14 (82.4%) |
| 55 to 64 Years | 21 (72.4%) | 27 (79.4%) |
| 65 to 74 Years | 35 (92.1%) | 33 (100.0%) |
| 75 Years and over | 10 (100.0%) | 3 (100.0%) |
| Total | 174 (92.1%) | 133 (79.6%) |
Income Below Poverty Among Married-Couple Families in Charlo
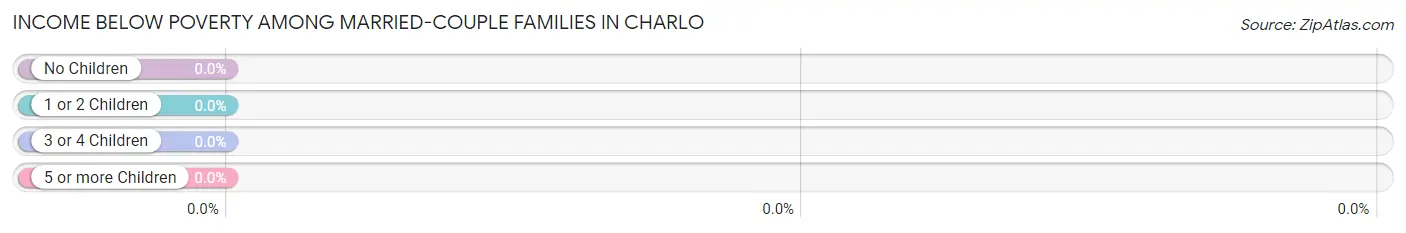
| Children | Above Poverty | Below Poverty |
| No Children | 39 (100.0%) | 0 (0.0%) |
| 1 or 2 Children | 12 (100.0%) | 0 (0.0%) |
| 3 or 4 Children | 0 (0.0%) | 0 (0.0%) |
| 5 or more Children | 0 (0.0%) | 0 (0.0%) |
| Total | 51 (100.0%) | 0 (0.0%) |
Income Below Poverty Among Single-Parent Households in Charlo
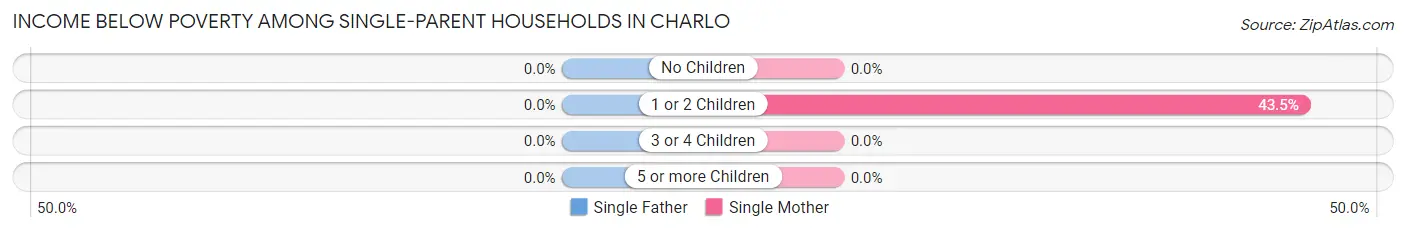
| Children | Single Father | Single Mother |
| No Children | 0 (0.0%) | 0 (0.0%) |
| 1 or 2 Children | 0 (0.0%) | 10 (43.5%) |
| 3 or 4 Children | 0 (0.0%) | 0 (0.0%) |
| 5 or more Children | 0 (0.0%) | 0 (0.0%) |
| Total | 0 (0.0%) | 10 (32.3%) |
Income Below Poverty Among Married-Couple vs Single-Parent Households in Charlo
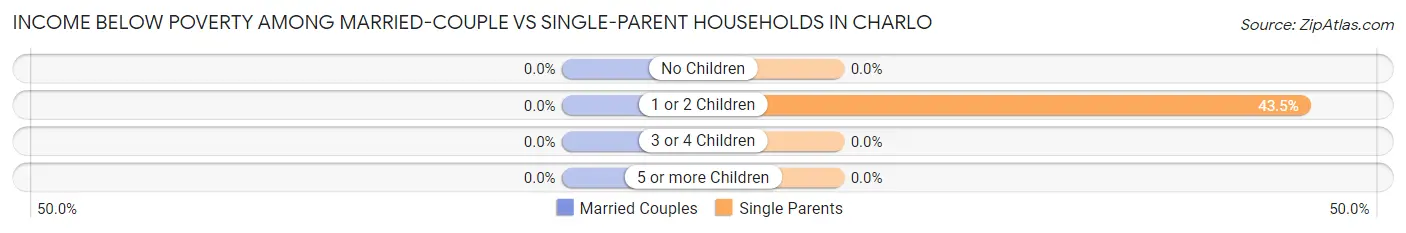
| Children | Married-Couple Families | Single-Parent Households |
| No Children | 0 (0.0%) | 0 (0.0%) |
| 1 or 2 Children | 0 (0.0%) | 10 (43.5%) |
| 3 or 4 Children | 0 (0.0%) | 0 (0.0%) |
| 5 or more Children | 0 (0.0%) | 0 (0.0%) |
| Total | 0 (0.0%) | 10 (29.4%) |
Race in Charlo
The most populous races in Charlo are White / Caucasian (259 | 72.8%), Native / Alaskan (52 | 14.6%), and Two or more Races (39 | 11.0%).
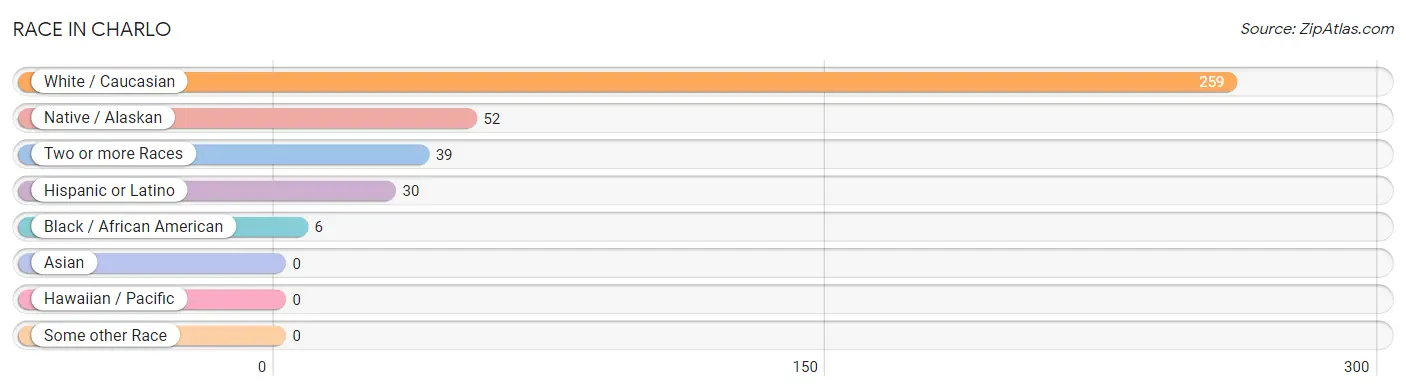
| Race | # Population | % Population |
| Asian | 0 | 0.0% |
| Black / African American | 6 | 1.7% |
| Hawaiian / Pacific | 0 | 0.0% |
| Hispanic or Latino | 30 | 8.4% |
| Native / Alaskan | 52 | 14.6% |
| White / Caucasian | 259 | 72.8% |
| Two or more Races | 39 | 11.0% |
| Some other Race | 0 | 0.0% |
| Total | 356 | 100.0% |
Ancestry in Charlo
The most populous ancestries reported in Charlo are Irish (73 | 20.5%), German (56 | 15.7%), Welsh (28 | 7.9%), Crow (21 | 5.9%), and French (19 | 5.3%), together accounting for 55.3% of all Charlo residents.
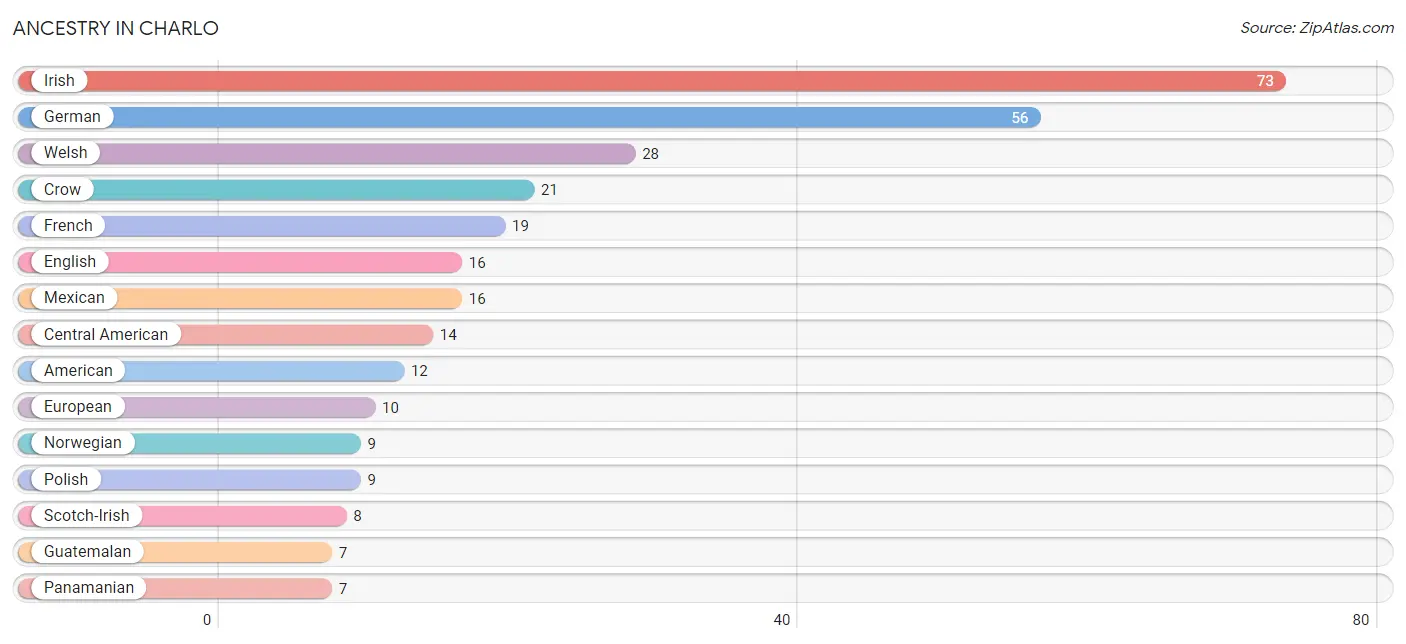
| Ancestry | # Population | % Population |
| American | 12 | 3.4% |
| Belgian | 4 | 1.1% |
| Blackfeet | 6 | 1.7% |
| Central American | 14 | 3.9% |
| Cherokee | 5 | 1.4% |
| Crow | 21 | 5.9% |
| Dutch | 6 | 1.7% |
| English | 16 | 4.5% |
| European | 10 | 2.8% |
| French | 19 | 5.3% |
| German | 56 | 15.7% |
| Guatemalan | 7 | 2.0% |
| Irish | 73 | 20.5% |
| Italian | 3 | 0.8% |
| Mexican | 16 | 4.5% |
| Norwegian | 9 | 2.5% |
| Panamanian | 7 | 2.0% |
| Polish | 9 | 2.5% |
| Scotch-Irish | 8 | 2.2% |
| Scottish | 7 | 2.0% |
| Swedish | 6 | 1.7% |
| Ukrainian | 3 | 0.8% |
| Welsh | 28 | 7.9% | View All 23 Rows |
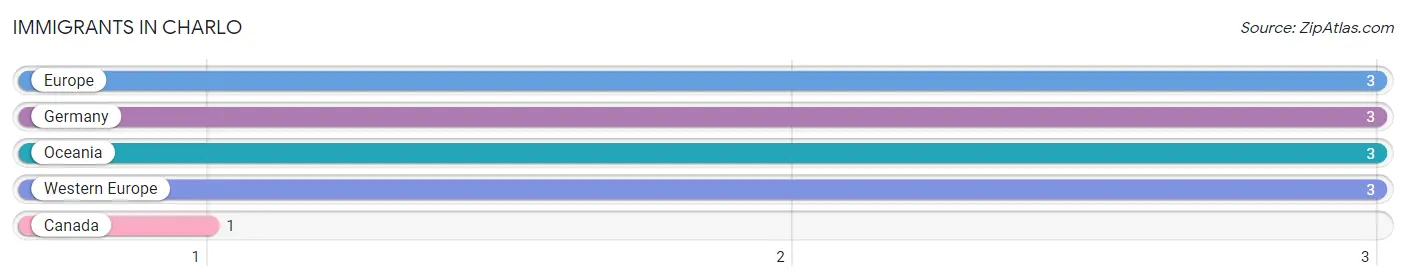
Immigrants in Charlo
The most numerous immigrant groups reported in Charlo came from Europe (3 | 0.8%), Germany (3 | 0.8%), Oceania (3 | 0.8%), Western Europe (3 | 0.8%), and Canada (1 | 0.3%), together accounting for 3.6% of all Charlo residents.
| Immigration Origin | # Population | % Population |
| Canada | 1 | 0.3% |
| Europe | 3 | 0.8% |
| Germany | 3 | 0.8% |
| Oceania | 3 | 0.8% |
| Western Europe | 3 | 0.8% | View All 5 Rows |
Sex and Age in Charlo
Sex and Age in Charlo
The most populous age groups in Charlo are 65 to 69 Years (29 | 15.3%) for men and 40 to 44 Years (23 | 13.8%) for women.
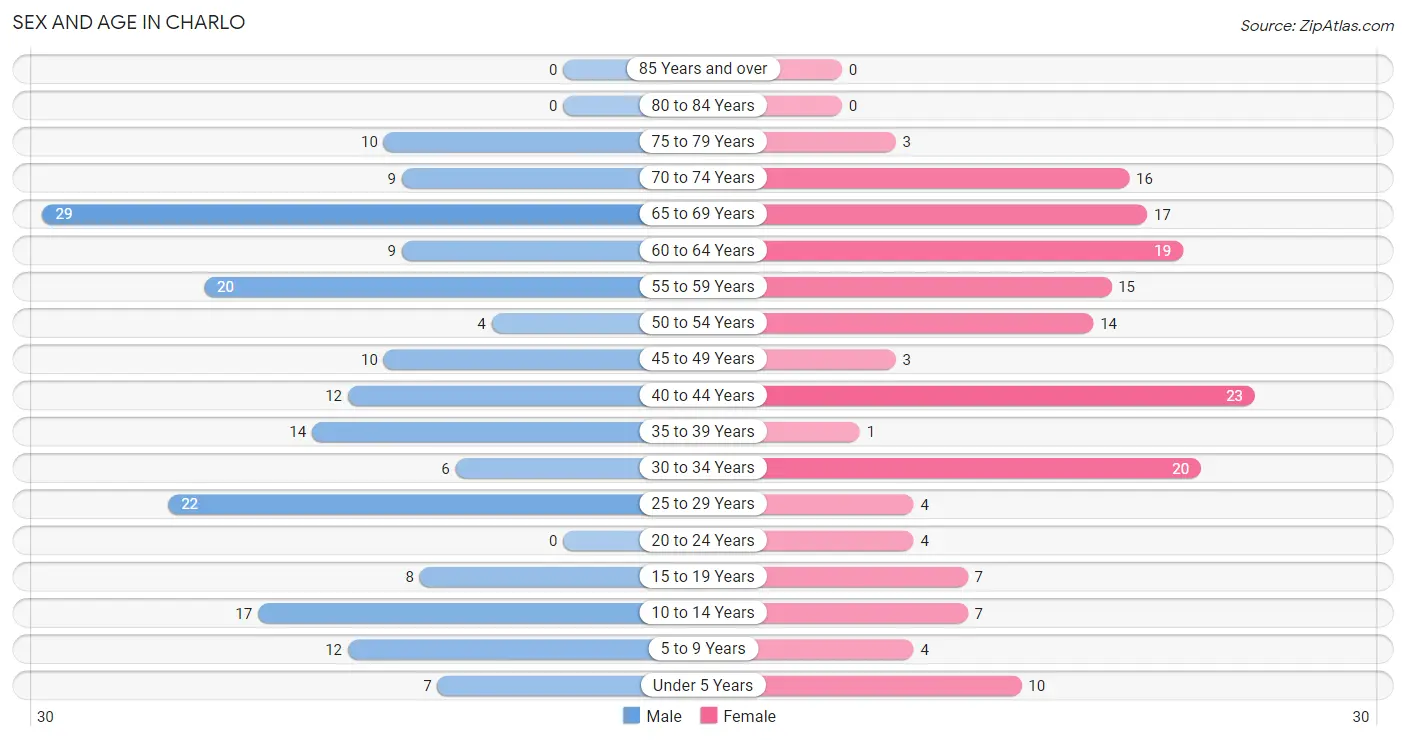
| Age Bracket | Male | Female |
| Under 5 Years | 7 (3.7%) | 10 (6.0%) |
| 5 to 9 Years | 12 (6.4%) | 4 (2.4%) |
| 10 to 14 Years | 17 (9.0%) | 7 (4.2%) |
| 15 to 19 Years | 8 (4.2%) | 7 (4.2%) |
| 20 to 24 Years | 0 (0.0%) | 4 (2.4%) |
| 25 to 29 Years | 22 (11.6%) | 4 (2.4%) |
| 30 to 34 Years | 6 (3.2%) | 20 (12.0%) |
| 35 to 39 Years | 14 (7.4%) | 1 (0.6%) |
| 40 to 44 Years | 12 (6.4%) | 23 (13.8%) |
| 45 to 49 Years | 10 (5.3%) | 3 (1.8%) |
| 50 to 54 Years | 4 (2.1%) | 14 (8.4%) |
| 55 to 59 Years | 20 (10.6%) | 15 (9.0%) |
| 60 to 64 Years | 9 (4.8%) | 19 (11.4%) |
| 65 to 69 Years | 29 (15.3%) | 17 (10.2%) |
| 70 to 74 Years | 9 (4.8%) | 16 (9.6%) |
| 75 to 79 Years | 10 (5.3%) | 3 (1.8%) |
| 80 to 84 Years | 0 (0.0%) | 0 (0.0%) |
| 85 Years and over | 0 (0.0%) | 0 (0.0%) |
| Total | 189 (100.0%) | 167 (100.0%) |
Families and Households in Charlo
Median Family Size in Charlo
The median family size in Charlo is 3.05 persons per family, with single male/father families (3 | 3.5%) accounting for the largest median family size of 6.67 persons per family. On the other hand, married-couple families (51 | 60.0%) represent the smallest median family size with 2.55 persons per family.
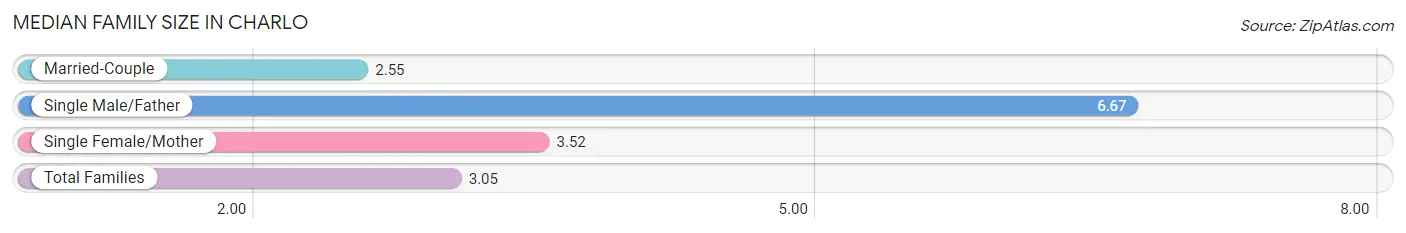
| Family Type | # Families | Family Size |
| Married-Couple | 51 (60.0%) | 2.55 |
| Single Male/Father | 3 (3.5%) | 6.67 |
| Single Female/Mother | 31 (36.5%) | 3.52 |
| Total Families | 85 (100.0%) | 3.05 |
Median Household Size in Charlo
The median household size in Charlo is 2.23 persons per household, with single male/father households (3 | 1.9%) accounting for the largest median household size of 6.67 persons per household. non-family households (75 | 46.9%) represent the smallest median household size with 1.29 persons per household.
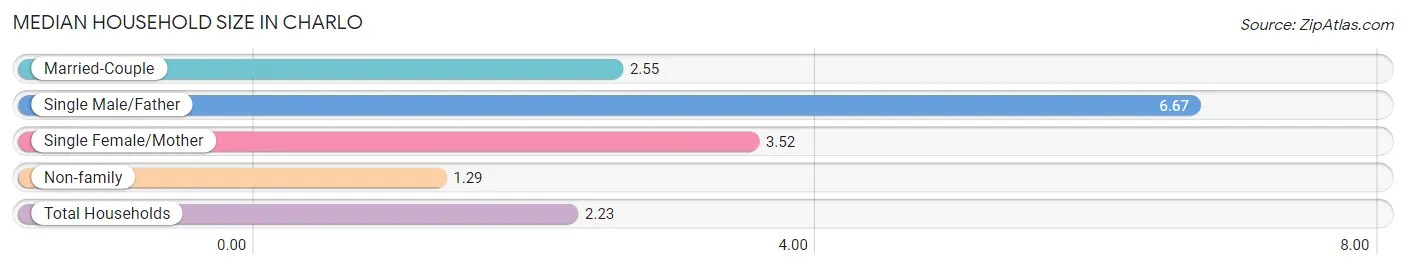
| Household Type | # Households | Household Size |
| Married-Couple | 51 (31.9%) | 2.55 |
| Single Male/Father | 3 (1.9%) | 6.67 |
| Single Female/Mother | 31 (19.4%) | 3.52 |
| Non-family | 75 (46.9%) | 1.29 |
| Total Households | 160 (100.0%) | 2.23 |
Household Size by Marriage Status in Charlo
Out of a total of 160 households in Charlo, 85 (53.1%) are family households, while 75 (46.9%) are nonfamily households. The most numerous type of family households are 2-person households, comprising 43, and the most common type of nonfamily households are 1-person households, comprising 62.
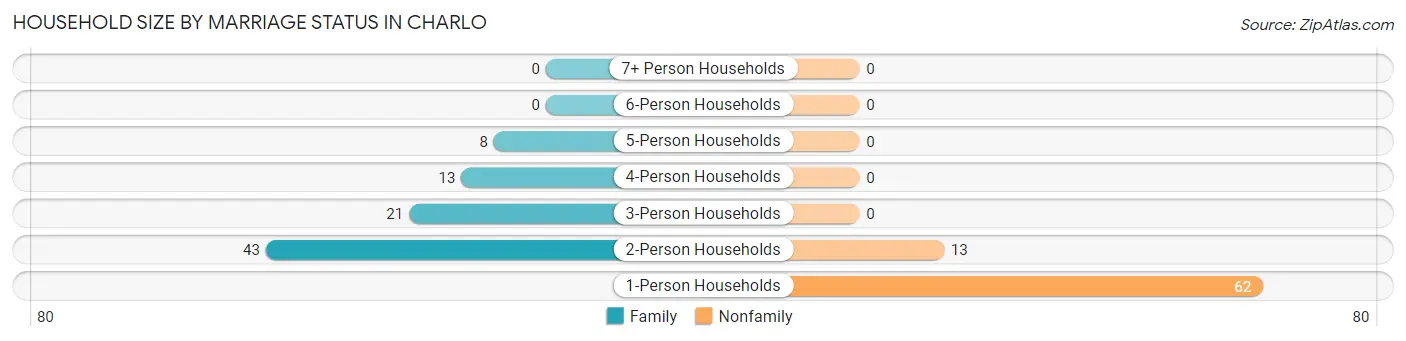
| Household Size | Family Households | Nonfamily Households |
| 1-Person Households | - | 62 (38.8%) |
| 2-Person Households | 43 (26.9%) | 13 (8.1%) |
| 3-Person Households | 21 (13.1%) | 0 (0.0%) |
| 4-Person Households | 13 (8.1%) | 0 (0.0%) |
| 5-Person Households | 8 (5.0%) | 0 (0.0%) |
| 6-Person Households | 0 (0.0%) | 0 (0.0%) |
| 7+ Person Households | 0 (0.0%) | 0 (0.0%) |
| Total | 85 (53.1%) | 75 (46.9%) |
Female Fertility in Charlo
Fertility by Age in Charlo
Average fertility rate in Charlo is 209.0 births per 1,000 women. Women in the age bracket of 20 to 34 years have the highest fertility rate with 500.0 births per 1,000 women. Women in the age bracket of 20 to 34 years acount for 100.0% of all women with births.
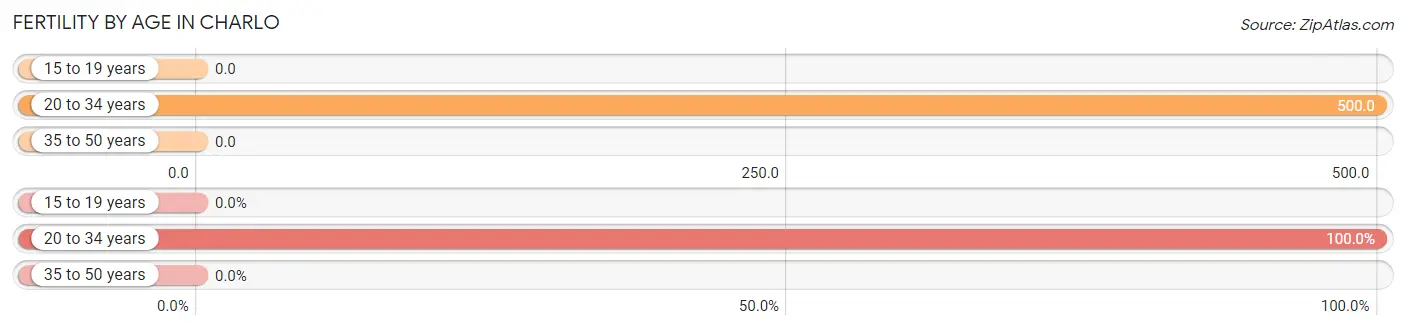
| Age Bracket | Women with Births | Births / 1,000 Women |
| 15 to 19 years | 0 (0.0%) | 0.0 |
| 20 to 34 years | 14 (100.0%) | 500.0 |
| 35 to 50 years | 0 (0.0%) | 0.0 |
| Total | 14 (100.0%) | 209.0 |
Fertility by Age by Marriage Status in Charlo
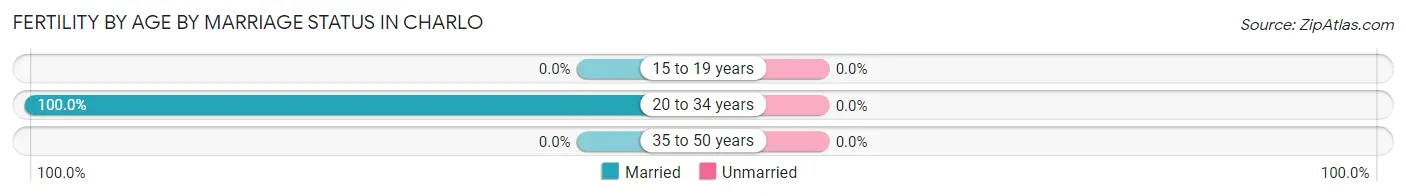
| Age Bracket | Married | Unmarried |
| 15 to 19 years | 0 (0.0%) | 0 (0.0%) |
| 20 to 34 years | 14 (100.0%) | 0 (0.0%) |
| 35 to 50 years | 0 (0.0%) | 0 (0.0%) |
| Total | 14 (100.0%) | 0 (0.0%) |
Fertility by Education in Charlo
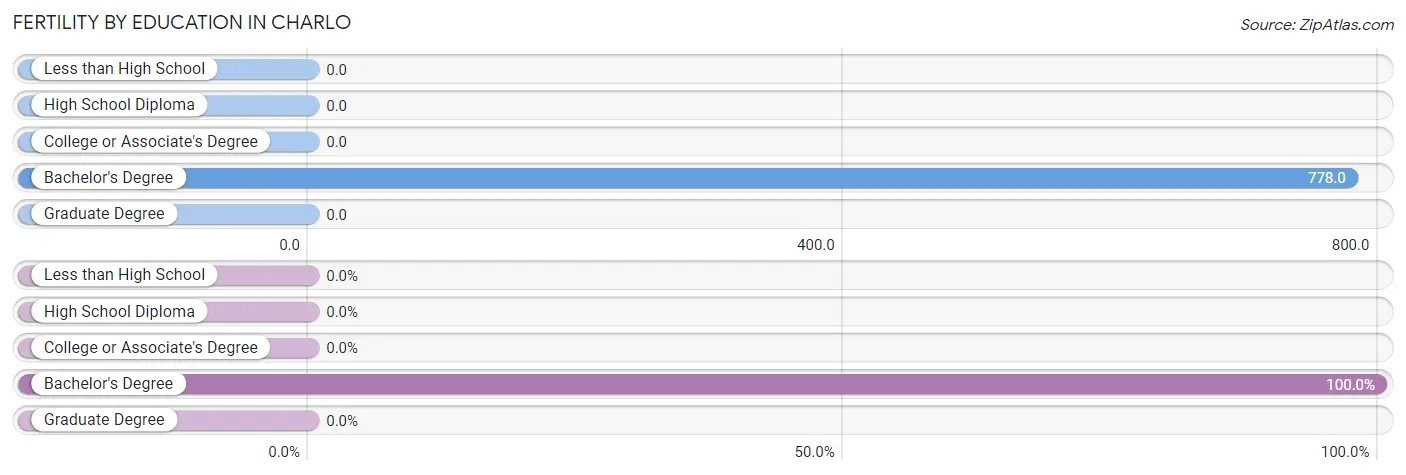
| Educational Attainment | Women with Births | Births / 1,000 Women |
| Less than High School | 0 (0.0%) | 0.0 |
| High School Diploma | 0 (0.0%) | 0.0 |
| College or Associate's Degree | 0 (0.0%) | 0.0 |
| Bachelor's Degree | 14 (100.0%) | 778.0 |
| Graduate Degree | 0 (0.0%) | 0.0 |
| Total | 14 (100.0%) | 209.0 |
Fertility by Education by Marriage Status in Charlo
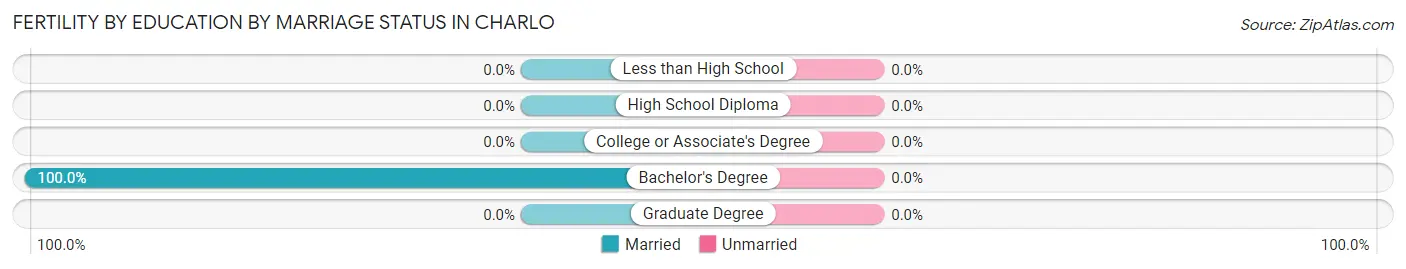
| Educational Attainment | Married | Unmarried |
| Less than High School | 0 (0.0%) | 0 (0.0%) |
| High School Diploma | 0 (0.0%) | 0 (0.0%) |
| College or Associate's Degree | 0 (0.0%) | 0 (0.0%) |
| Bachelor's Degree | 14 (100.0%) | 0 (0.0%) |
| Graduate Degree | 0 (0.0%) | 0 (0.0%) |
| Total | 14 (100.0%) | 0 (0.0%) |
Employment Characteristics in Charlo
Employment by Class of Employer in Charlo
Among the 155 employed individuals in Charlo, private company employees (85 | 54.8%), not-for-profit organizations (19 | 12.3%), and local government employees (19 | 12.3%) make up the most common classes of employment.
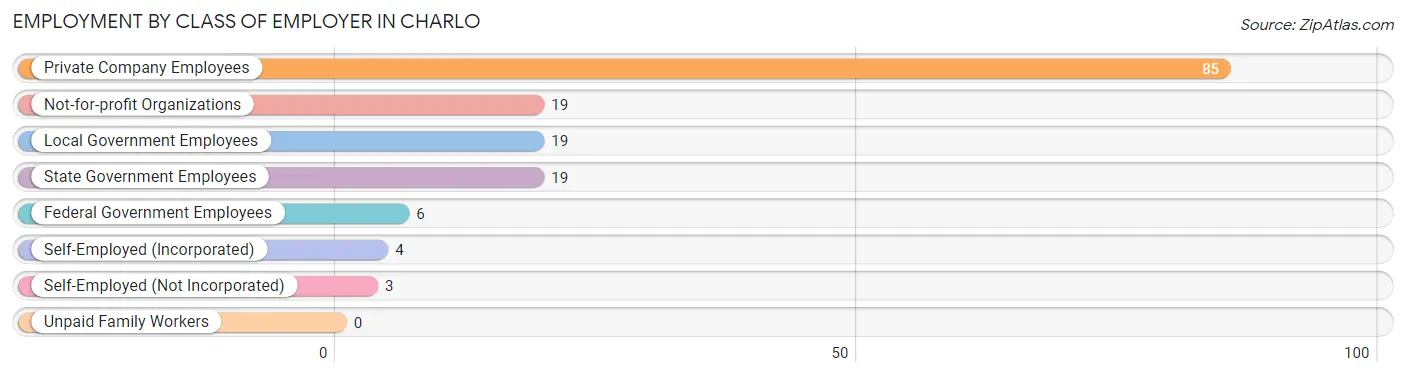
| Employer Class | # Employees | % Employees |
| Private Company Employees | 85 | 54.8% |
| Self-Employed (Incorporated) | 4 | 2.6% |
| Self-Employed (Not Incorporated) | 3 | 1.9% |
| Not-for-profit Organizations | 19 | 12.3% |
| Local Government Employees | 19 | 12.3% |
| State Government Employees | 19 | 12.3% |
| Federal Government Employees | 6 | 3.9% |
| Unpaid Family Workers | 0 | 0.0% |
| Total | 155 | 100.0% |
Employment Status by Age in Charlo
According to the labor force statistics for Charlo, out of the total population over 16 years of age (299), 60.2% or 180 individuals are in the labor force, with 5.6% or 10 of them unemployed. The age group with the highest labor force participation rate is 20 to 24 years, with 100.0% or 4 individuals in the labor force. Within the labor force, the 55 to 59 years age range has the highest percentage of unemployed individuals, with 25.0% or 6 of them being unemployed.
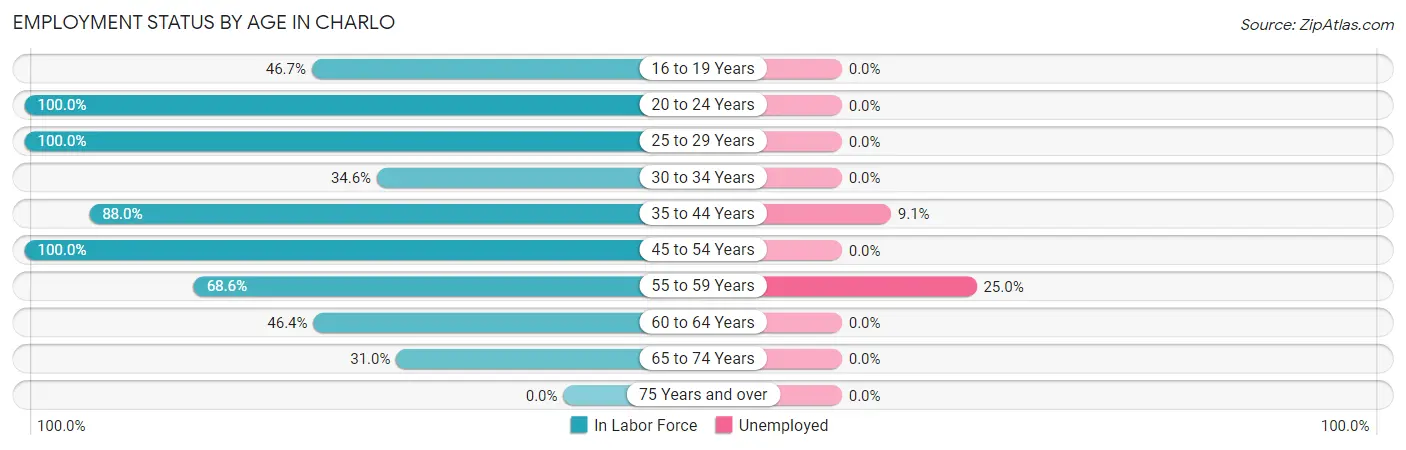
| Age Bracket | In Labor Force | Unemployed |
| 16 to 19 Years | 7 (46.7%) | 0 (0.0%) |
| 20 to 24 Years | 4 (100.0%) | 0 (0.0%) |
| 25 to 29 Years | 26 (100.0%) | 0 (0.0%) |
| 30 to 34 Years | 9 (34.6%) | 0 (0.0%) |
| 35 to 44 Years | 44 (88.0%) | 4 (9.1%) |
| 45 to 54 Years | 31 (100.0%) | 0 (0.0%) |
| 55 to 59 Years | 24 (68.6%) | 6 (25.0%) |
| 60 to 64 Years | 13 (46.4%) | 0 (0.0%) |
| 65 to 74 Years | 22 (31.0%) | 0 (0.0%) |
| 75 Years and over | 0 (0.0%) | 0 (0.0%) |
| Total | 180 (60.2%) | 10 (5.6%) |
Employment Status by Educational Attainment in Charlo
According to labor force statistics for Charlo, 75.0% of individuals (147) out of the total population between 25 and 64 years of age (196) are in the labor force, with 6.8% or 10 of them being unemployed. The group with the highest labor force participation rate are those with the educational attainment of high school diploma, with 82.9% or 63 individuals in the labor force. Within the labor force, individuals with college / associate degree education have the highest percentage of unemployment, with 15.6% or 10 of them being unemployed.
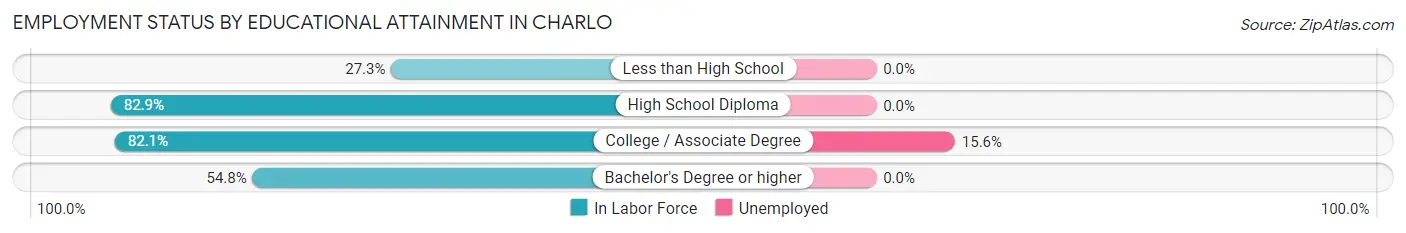
| Educational Attainment | In Labor Force | Unemployed |
| Less than High School | 3 (27.3%) | 0 (0.0%) |
| High School Diploma | 63 (82.9%) | 0 (0.0%) |
| College / Associate Degree | 64 (82.1%) | 12 (15.6%) |
| Bachelor's Degree or higher | 17 (54.8%) | 0 (0.0%) |
| Total | 147 (75.0%) | 13 (6.8%) |
Employment Occupations by Sex in Charlo
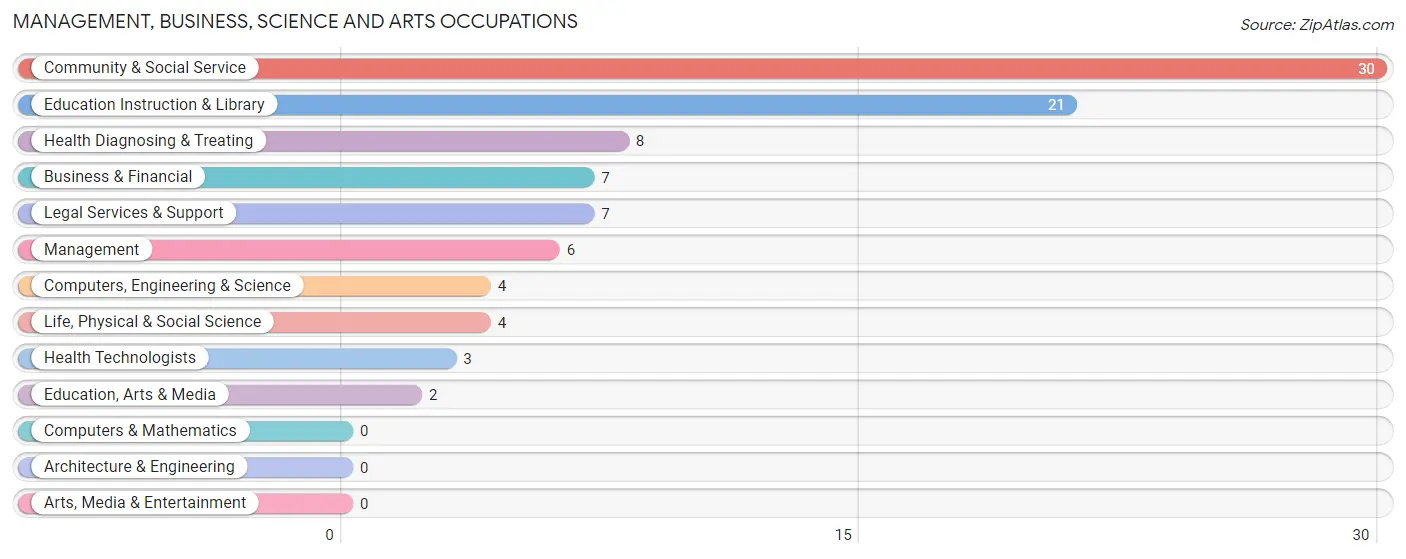
Management, Business, Science and Arts Occupations
The most common Management, Business, Science and Arts occupations in Charlo are Community & Social Service (30 | 17.6%), Education Instruction & Library (21 | 12.3%), Health Diagnosing & Treating (8 | 4.7%), Business & Financial (7 | 4.1%), and Legal Services & Support (7 | 4.1%).
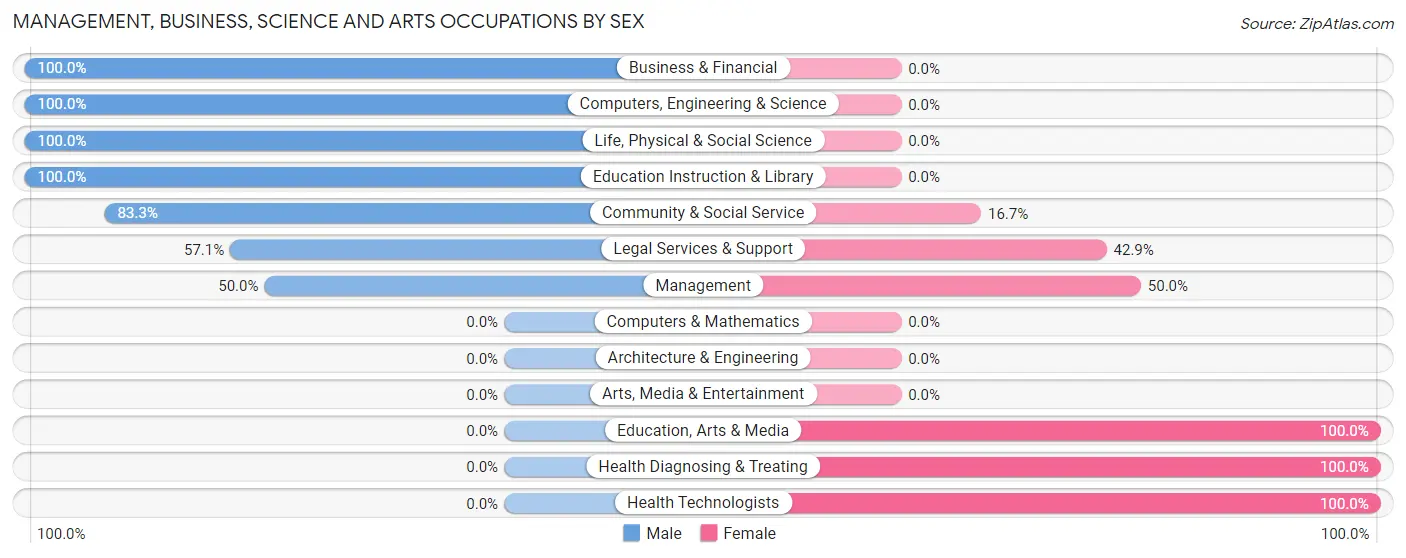
Management, Business, Science and Arts Occupations by Sex
Within the Management, Business, Science and Arts occupations in Charlo, the most male-oriented occupations are Business & Financial (100.0%), Computers, Engineering & Science (100.0%), and Life, Physical & Social Science (100.0%), while the most female-oriented occupations are Education, Arts & Media (100.0%), Health Diagnosing & Treating (100.0%), and Health Technologists (100.0%).
| Occupation | Male | Female |
| Management | 3 (50.0%) | 3 (50.0%) |
| Business & Financial | 7 (100.0%) | 0 (0.0%) |
| Computers, Engineering & Science | 4 (100.0%) | 0 (0.0%) |
| Computers & Mathematics | 0 (0.0%) | 0 (0.0%) |
| Architecture & Engineering | 0 (0.0%) | 0 (0.0%) |
| Life, Physical & Social Science | 4 (100.0%) | 0 (0.0%) |
| Community & Social Service | 25 (83.3%) | 5 (16.7%) |
| Education, Arts & Media | 0 (0.0%) | 2 (100.0%) |
| Legal Services & Support | 4 (57.1%) | 3 (42.9%) |
| Education Instruction & Library | 21 (100.0%) | 0 (0.0%) |
| Arts, Media & Entertainment | 0 (0.0%) | 0 (0.0%) |
| Health Diagnosing & Treating | 0 (0.0%) | 8 (100.0%) |
| Health Technologists | 0 (0.0%) | 3 (100.0%) |
| Total (Category) | 39 (70.9%) | 16 (29.1%) |
| Total (Overall) | 83 (48.8%) | 87 (51.2%) |
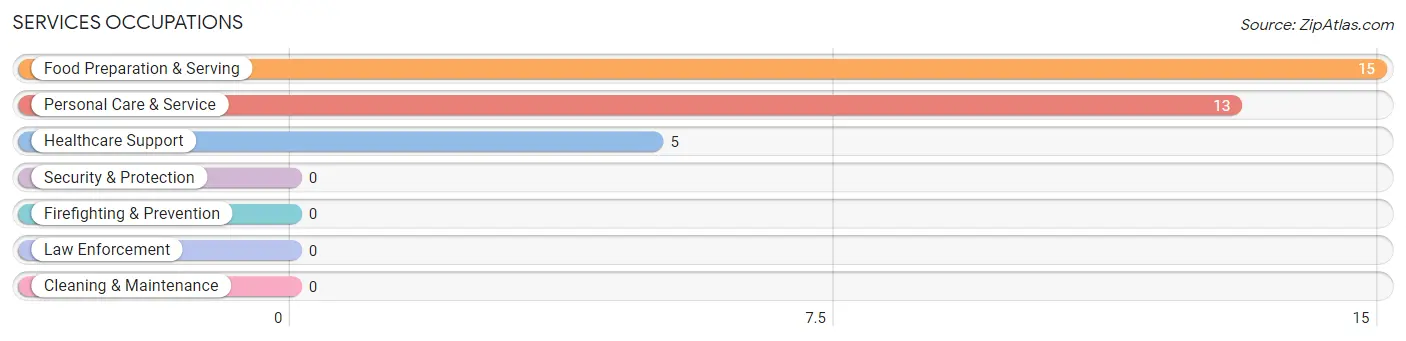
Services Occupations
The most common Services occupations in Charlo are Food Preparation & Serving (15 | 8.8%), Personal Care & Service (13 | 7.6%), and Healthcare Support (5 | 2.9%).
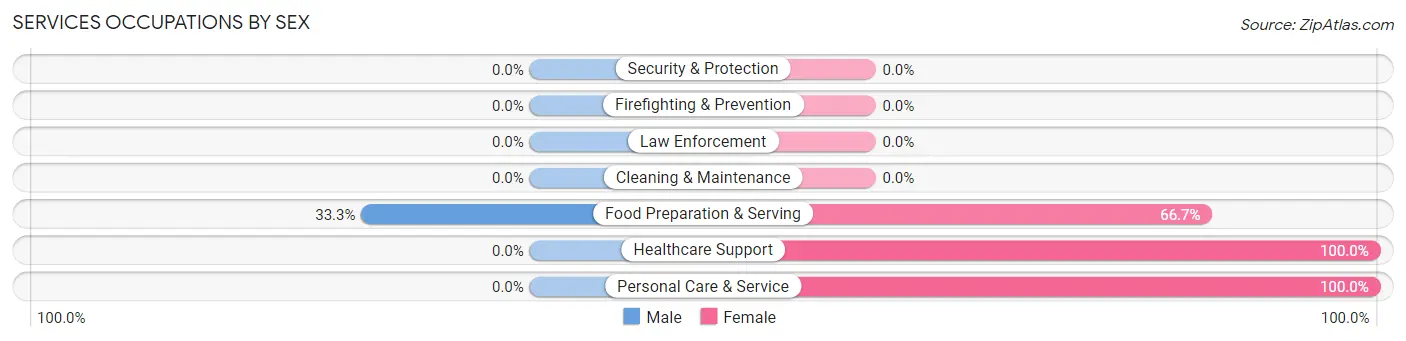
Services Occupations by Sex
| Occupation | Male | Female |
| Healthcare Support | 0 (0.0%) | 5 (100.0%) |
| Security & Protection | 0 (0.0%) | 0 (0.0%) |
| Firefighting & Prevention | 0 (0.0%) | 0 (0.0%) |
| Law Enforcement | 0 (0.0%) | 0 (0.0%) |
| Food Preparation & Serving | 5 (33.3%) | 10 (66.7%) |
| Cleaning & Maintenance | 0 (0.0%) | 0 (0.0%) |
| Personal Care & Service | 0 (0.0%) | 13 (100.0%) |
| Total (Category) | 5 (15.1%) | 28 (84.9%) |
| Total (Overall) | 83 (48.8%) | 87 (51.2%) |
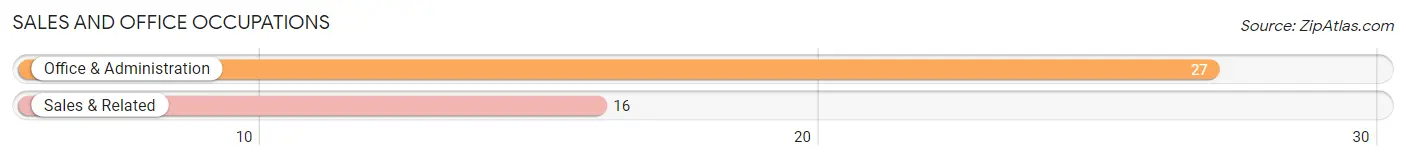
Sales and Office Occupations
The most common Sales and Office occupations in Charlo are Office & Administration (27 | 15.9%), and Sales & Related (16 | 9.4%).
Sales and Office Occupations by Sex
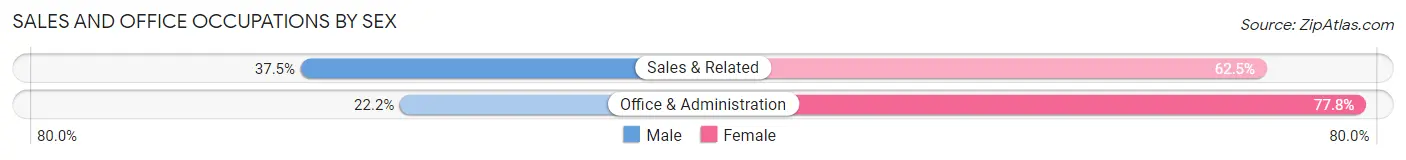
| Occupation | Male | Female |
| Sales & Related | 6 (37.5%) | 10 (62.5%) |
| Office & Administration | 6 (22.2%) | 21 (77.8%) |
| Total (Category) | 12 (27.9%) | 31 (72.1%) |
| Total (Overall) | 83 (48.8%) | 87 (51.2%) |
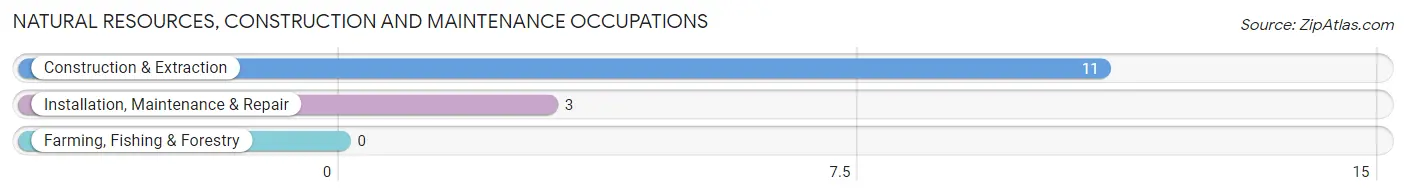
Natural Resources, Construction and Maintenance Occupations
The most common Natural Resources, Construction and Maintenance occupations in Charlo are Construction & Extraction (11 | 6.5%), and Installation, Maintenance & Repair (3 | 1.8%).
Natural Resources, Construction and Maintenance Occupations by Sex
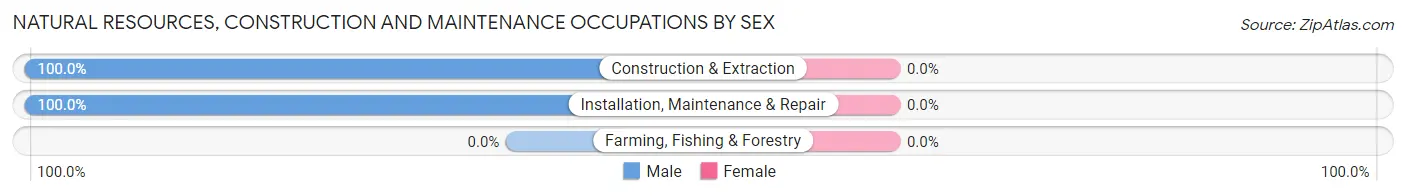
| Occupation | Male | Female |
| Farming, Fishing & Forestry | 0 (0.0%) | 0 (0.0%) |
| Construction & Extraction | 11 (100.0%) | 0 (0.0%) |
| Installation, Maintenance & Repair | 3 (100.0%) | 0 (0.0%) |
| Total (Category) | 14 (100.0%) | 0 (0.0%) |
| Total (Overall) | 83 (48.8%) | 87 (51.2%) |
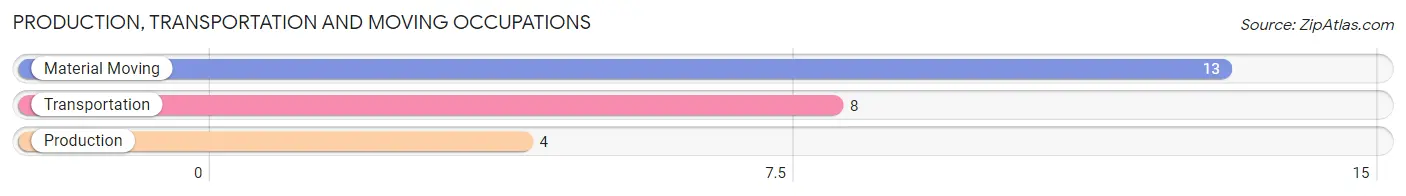
Production, Transportation and Moving Occupations
The most common Production, Transportation and Moving occupations in Charlo are Material Moving (13 | 7.6%), Transportation (8 | 4.7%), and Production (4 | 2.4%).
Production, Transportation and Moving Occupations by Sex
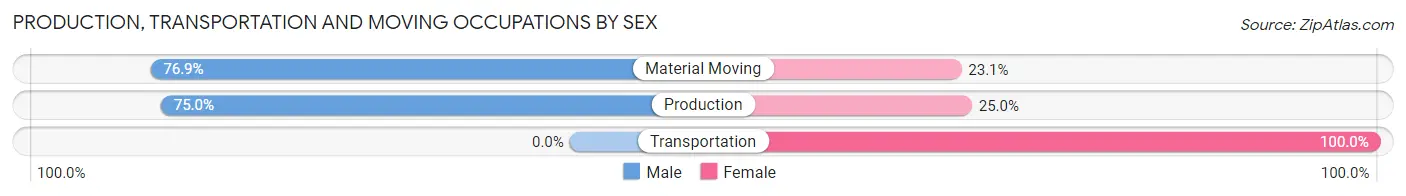
| Occupation | Male | Female |
| Production | 3 (75.0%) | 1 (25.0%) |
| Transportation | 0 (0.0%) | 8 (100.0%) |
| Material Moving | 10 (76.9%) | 3 (23.1%) |
| Total (Category) | 13 (52.0%) | 12 (48.0%) |
| Total (Overall) | 83 (48.8%) | 87 (51.2%) |
Employment Industries by Sex in Charlo
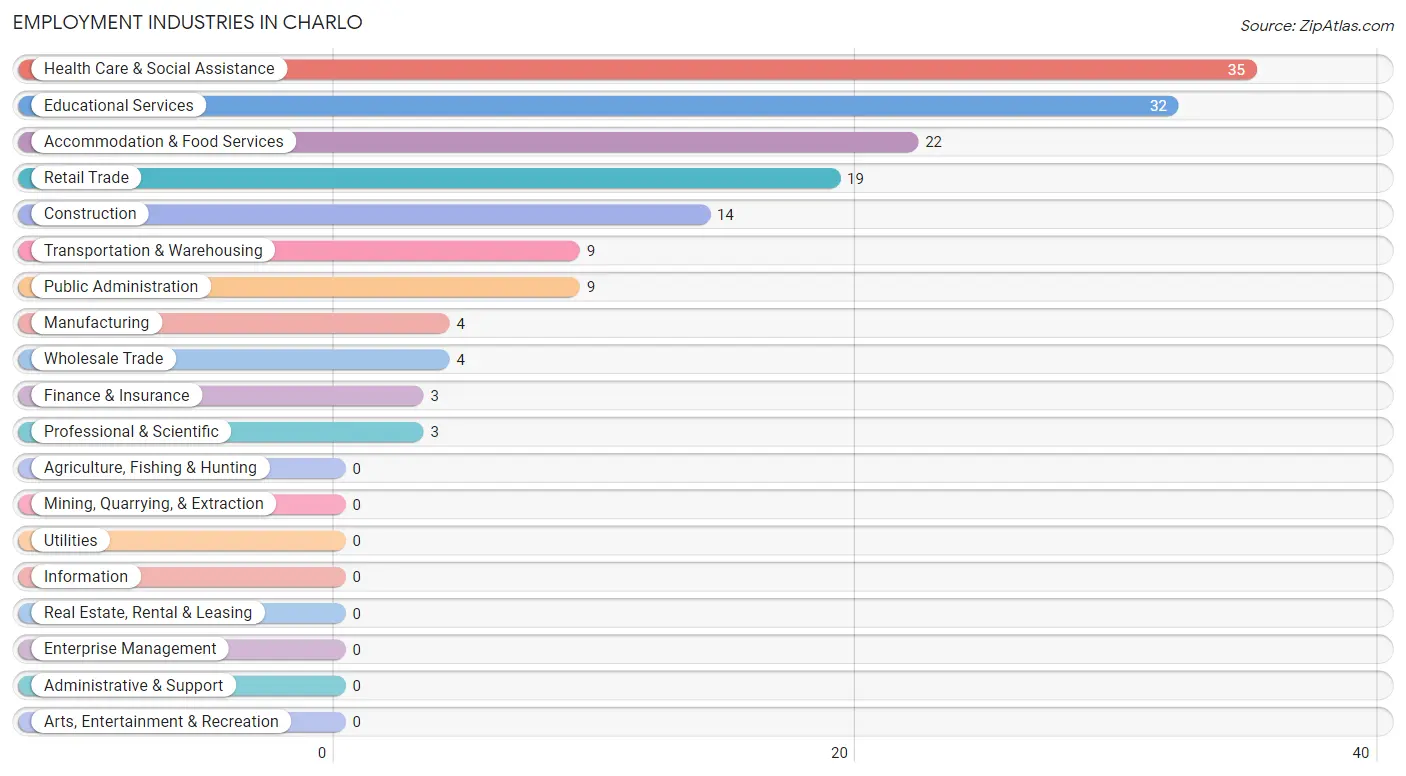
Employment Industries in Charlo
The major employment industries in Charlo include Health Care & Social Assistance (35 | 20.6%), Educational Services (32 | 18.8%), Accommodation & Food Services (22 | 12.9%), Retail Trade (19 | 11.2%), and Construction (14 | 8.2%).
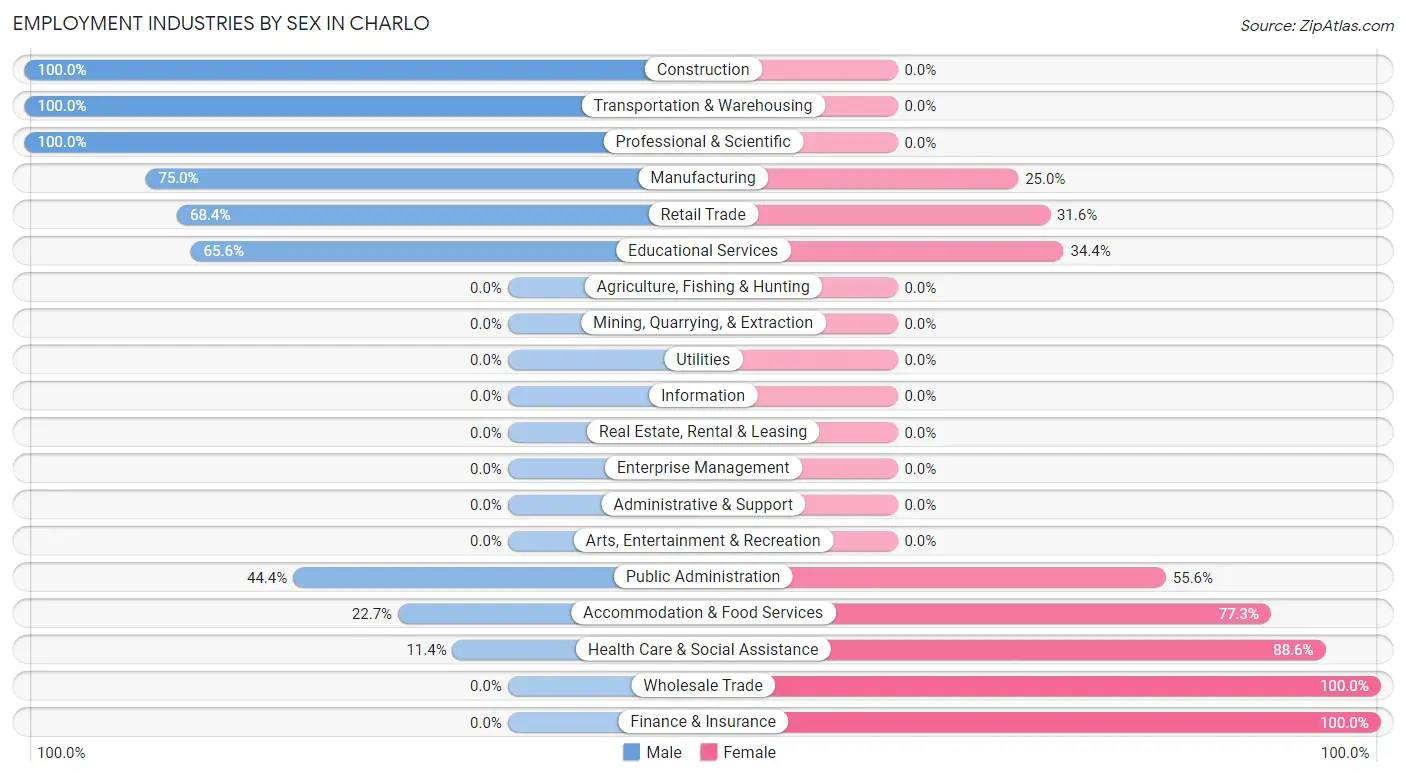
Employment Industries by Sex in Charlo
The Charlo industries that see more men than women are Construction (100.0%), Transportation & Warehousing (100.0%), and Professional & Scientific (100.0%), whereas the industries that tend to have a higher number of women are Wholesale Trade (100.0%), Finance & Insurance (100.0%), and Health Care & Social Assistance (88.6%).
| Industry | Male | Female |
| Agriculture, Fishing & Hunting | 0 (0.0%) | 0 (0.0%) |
| Mining, Quarrying, & Extraction | 0 (0.0%) | 0 (0.0%) |
| Construction | 14 (100.0%) | 0 (0.0%) |
| Manufacturing | 3 (75.0%) | 1 (25.0%) |
| Wholesale Trade | 0 (0.0%) | 4 (100.0%) |
| Retail Trade | 13 (68.4%) | 6 (31.6%) |
| Transportation & Warehousing | 9 (100.0%) | 0 (0.0%) |
| Utilities | 0 (0.0%) | 0 (0.0%) |
| Information | 0 (0.0%) | 0 (0.0%) |
| Finance & Insurance | 0 (0.0%) | 3 (100.0%) |
| Real Estate, Rental & Leasing | 0 (0.0%) | 0 (0.0%) |
| Professional & Scientific | 3 (100.0%) | 0 (0.0%) |
| Enterprise Management | 0 (0.0%) | 0 (0.0%) |
| Administrative & Support | 0 (0.0%) | 0 (0.0%) |
| Educational Services | 21 (65.6%) | 11 (34.4%) |
| Health Care & Social Assistance | 4 (11.4%) | 31 (88.6%) |
| Arts, Entertainment & Recreation | 0 (0.0%) | 0 (0.0%) |
| Accommodation & Food Services | 5 (22.7%) | 17 (77.3%) |
| Public Administration | 4 (44.4%) | 5 (55.6%) |
| Total | 83 (48.8%) | 87 (51.2%) |
Education in Charlo
School Enrollment in Charlo
The most common levels of schooling among the 59 students in Charlo are middle school (24 | 40.7%), high school (15 | 25.4%), and elementary school (8 | 13.6%).
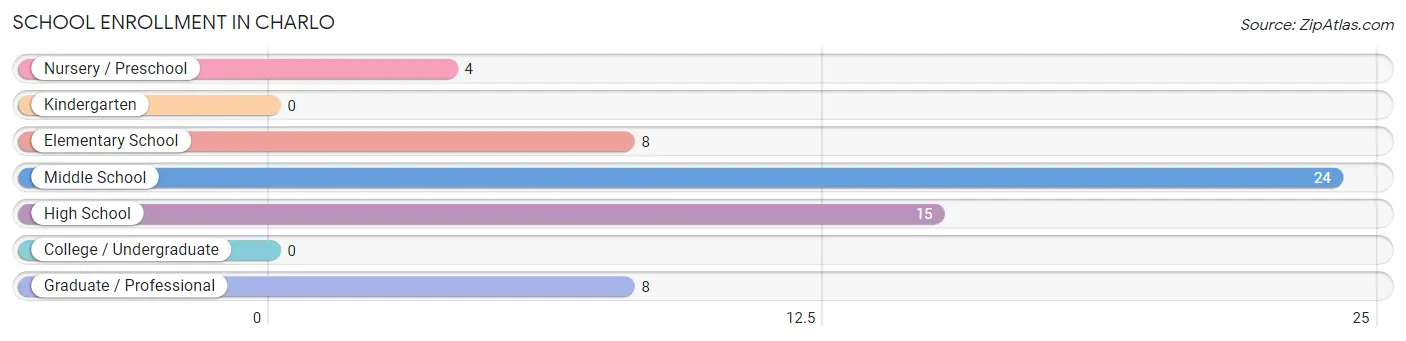
| School Level | # Students | % Students |
| Nursery / Preschool | 4 | 6.8% |
| Kindergarten | 0 | 0.0% |
| Elementary School | 8 | 13.6% |
| Middle School | 24 | 40.7% |
| High School | 15 | 25.4% |
| College / Undergraduate | 0 | 0.0% |
| Graduate / Professional | 8 | 13.6% |
| Total | 59 | 100.0% |
School Enrollment by Age by Funding Source in Charlo
Out of a total of 59 students who are enrolled in schools in Charlo, 4 (6.8%) attend a private institution, while the remaining 55 (93.2%) are enrolled in public schools. The age group of 25 to 34 year olds has the highest likelihood of being enrolled in private schools, with 4 (50.0% in the age bracket) enrolled. Conversely, the age group of 5 to 9 year old has the lowest likelihood of being enrolled in a private school, with 12 (100.0% in the age bracket) attending a public institution.
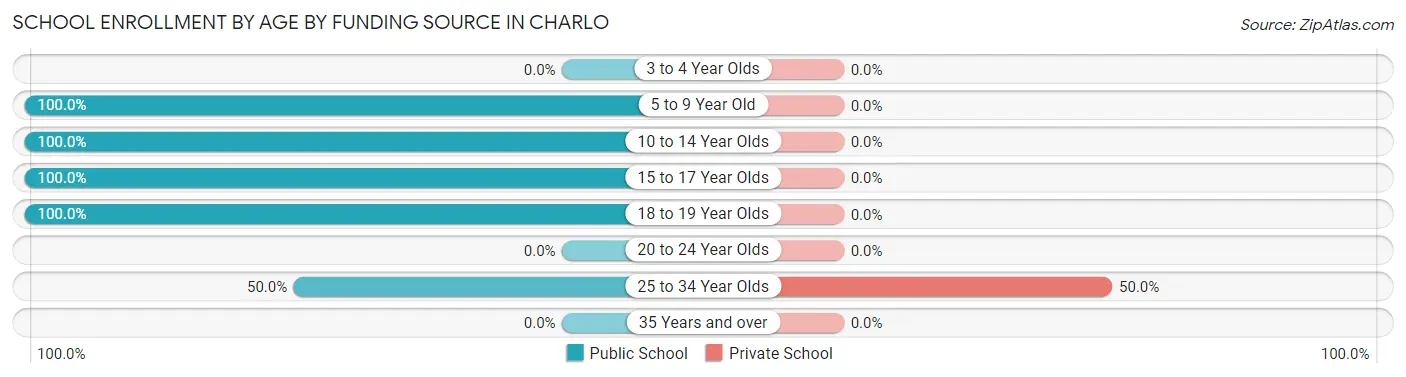
| Age Bracket | Public School | Private School |
| 3 to 4 Year Olds | 0 (0.0%) | 0 (0.0%) |
| 5 to 9 Year Old | 12 (100.0%) | 0 (0.0%) |
| 10 to 14 Year Olds | 24 (100.0%) | 0 (0.0%) |
| 15 to 17 Year Olds | 8 (100.0%) | 0 (0.0%) |
| 18 to 19 Year Olds | 7 (100.0%) | 0 (0.0%) |
| 20 to 24 Year Olds | 0 (0.0%) | 0 (0.0%) |
| 25 to 34 Year Olds | 4 (50.0%) | 4 (50.0%) |
| 35 Years and over | 0 (0.0%) | 0 (0.0%) |
| Total | 55 (93.2%) | 4 (6.8%) |
Educational Attainment by Field of Study in Charlo
Visual & performing arts (14 | 26.9%), education (10 | 19.2%), bio, nature & agricultural (7 | 13.5%), psychology (4 | 7.7%), and science & technology (4 | 7.7%) are the most common fields of study among 52 individuals in Charlo who have obtained a bachelor's degree or higher.
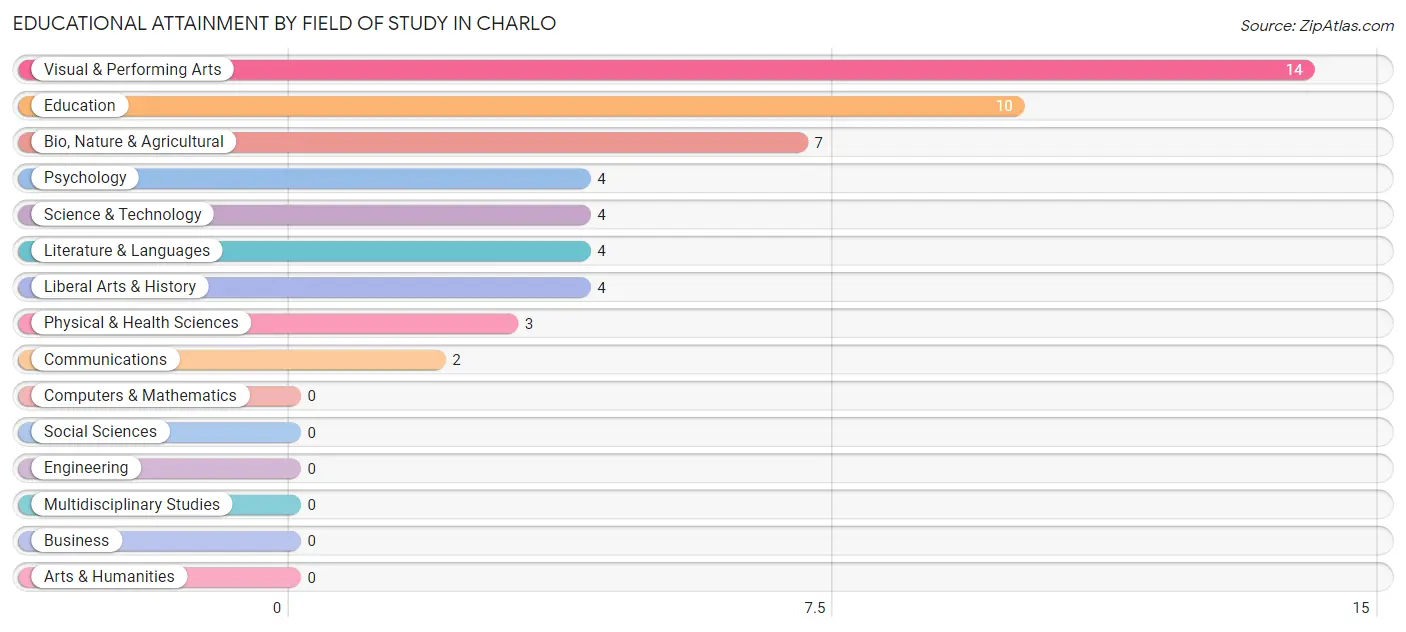
| Field of Study | # Graduates | % Graduates |
| Computers & Mathematics | 0 | 0.0% |
| Bio, Nature & Agricultural | 7 | 13.5% |
| Physical & Health Sciences | 3 | 5.8% |
| Psychology | 4 | 7.7% |
| Social Sciences | 0 | 0.0% |
| Engineering | 0 | 0.0% |
| Multidisciplinary Studies | 0 | 0.0% |
| Science & Technology | 4 | 7.7% |
| Business | 0 | 0.0% |
| Education | 10 | 19.2% |
| Literature & Languages | 4 | 7.7% |
| Liberal Arts & History | 4 | 7.7% |
| Visual & Performing Arts | 14 | 26.9% |
| Communications | 2 | 3.8% |
| Arts & Humanities | 0 | 0.0% |
| Total | 52 | 100.0% |
Transportation & Commute in Charlo
Vehicle Availability by Sex in Charlo
The most prevalent vehicle ownership categories in Charlo are males with 2 vehicles (54, accounting for 67.5%) and females with 2 vehicles (24, making up 72.0%).
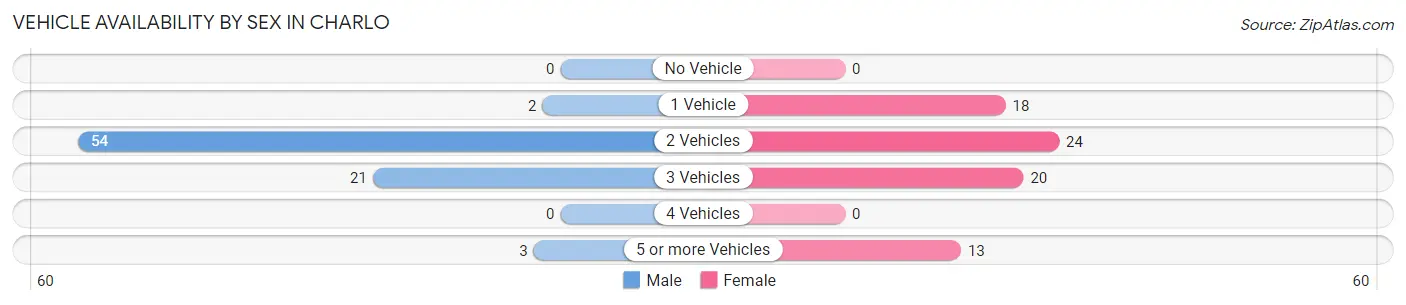
| Vehicles Available | Male | Female |
| No Vehicle | 0 (0.0%) | 0 (0.0%) |
| 1 Vehicle | 2 (2.5%) | 18 (24.0%) |
| 2 Vehicles | 54 (67.5%) | 24 (32.0%) |
| 3 Vehicles | 21 (26.3%) | 20 (26.7%) |
| 4 Vehicles | 0 (0.0%) | 0 (0.0%) |
| 5 or more Vehicles | 3 (3.7%) | 13 (17.3%) |
| Total | 80 (100.0%) | 75 (100.0%) |
Commute Time in Charlo
The most frequently occuring commute durations in Charlo are 30 to 34 minutes (47 commuters, 32.4%), 60 to 89 minutes (19 commuters, 13.1%), and 20 to 24 minutes (16 commuters, 11.0%).
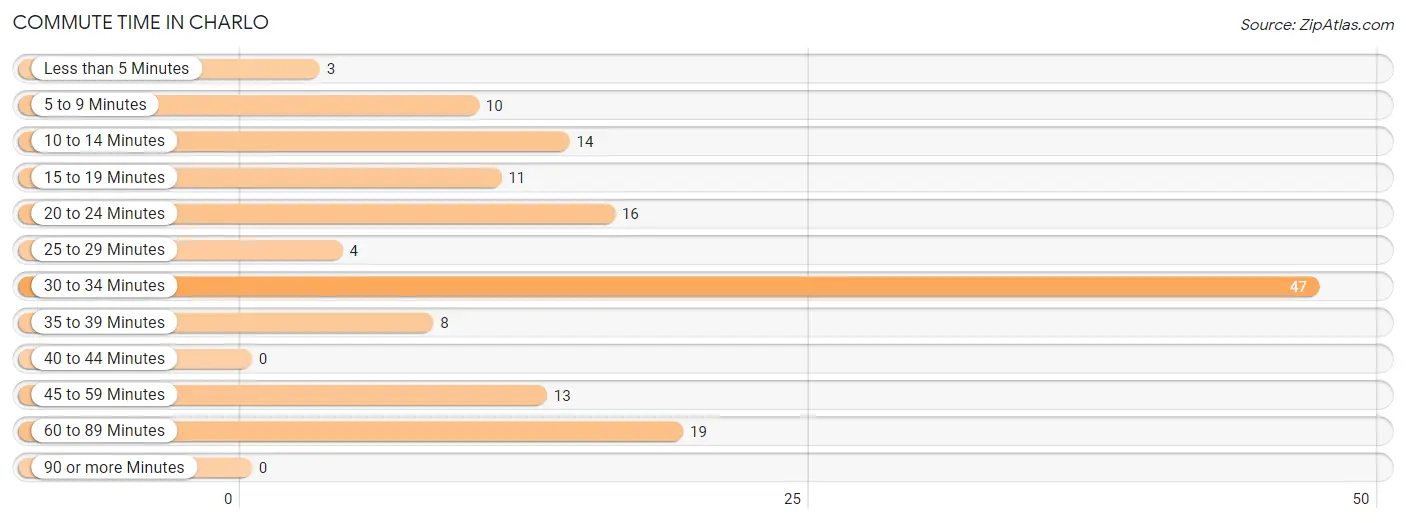
| Commute Time | # Commuters | % Commuters |
| Less than 5 Minutes | 3 | 2.1% |
| 5 to 9 Minutes | 10 | 6.9% |
| 10 to 14 Minutes | 14 | 9.7% |
| 15 to 19 Minutes | 11 | 7.6% |
| 20 to 24 Minutes | 16 | 11.0% |
| 25 to 29 Minutes | 4 | 2.8% |
| 30 to 34 Minutes | 47 | 32.4% |
| 35 to 39 Minutes | 8 | 5.5% |
| 40 to 44 Minutes | 0 | 0.0% |
| 45 to 59 Minutes | 13 | 9.0% |
| 60 to 89 Minutes | 19 | 13.1% |
| 90 or more Minutes | 0 | 0.0% |
Commute Time by Sex in Charlo
The most common commute times in Charlo are 30 to 34 minutes (33 commuters, 42.9%) for males and 30 to 34 minutes (14 commuters, 20.6%) for females.
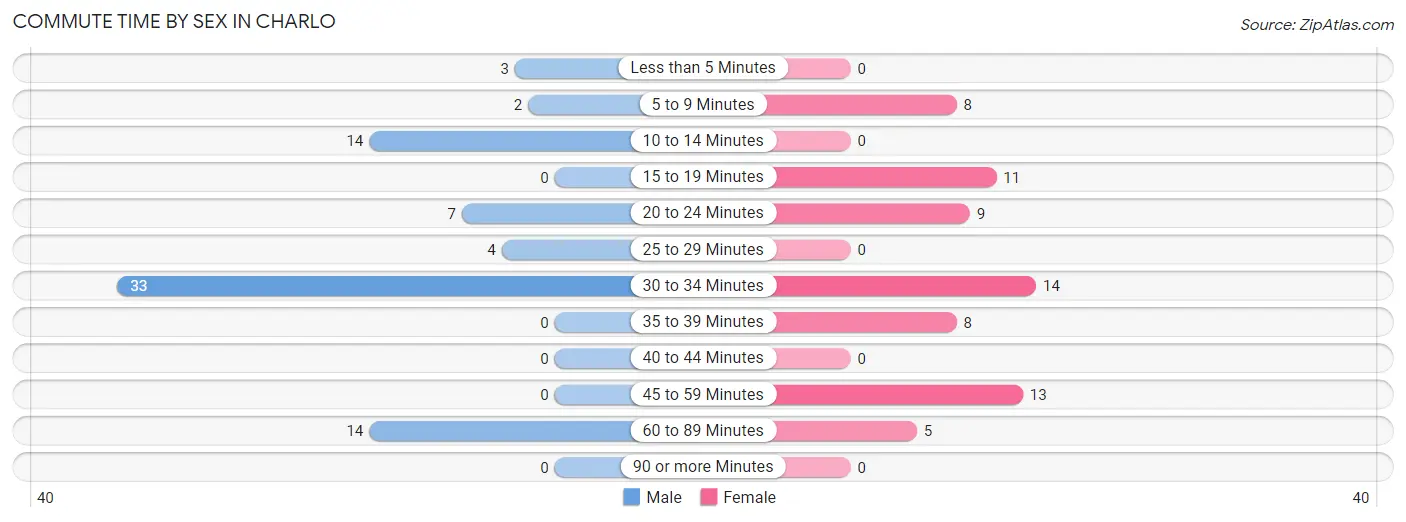
| Commute Time | Male | Female |
| Less than 5 Minutes | 3 (3.9%) | 0 (0.0%) |
| 5 to 9 Minutes | 2 (2.6%) | 8 (11.8%) |
| 10 to 14 Minutes | 14 (18.2%) | 0 (0.0%) |
| 15 to 19 Minutes | 0 (0.0%) | 11 (16.2%) |
| 20 to 24 Minutes | 7 (9.1%) | 9 (13.2%) |
| 25 to 29 Minutes | 4 (5.2%) | 0 (0.0%) |
| 30 to 34 Minutes | 33 (42.9%) | 14 (20.6%) |
| 35 to 39 Minutes | 0 (0.0%) | 8 (11.8%) |
| 40 to 44 Minutes | 0 (0.0%) | 0 (0.0%) |
| 45 to 59 Minutes | 0 (0.0%) | 13 (19.1%) |
| 60 to 89 Minutes | 14 (18.2%) | 5 (7.3%) |
| 90 or more Minutes | 0 (0.0%) | 0 (0.0%) |
Time of Departure to Work by Sex in Charlo
The most frequent times of departure to work in Charlo are 12:00 PM to 3:59 PM (21, 27.3%) for males and 8:00 AM to 8:29 AM (15, 22.1%) for females.
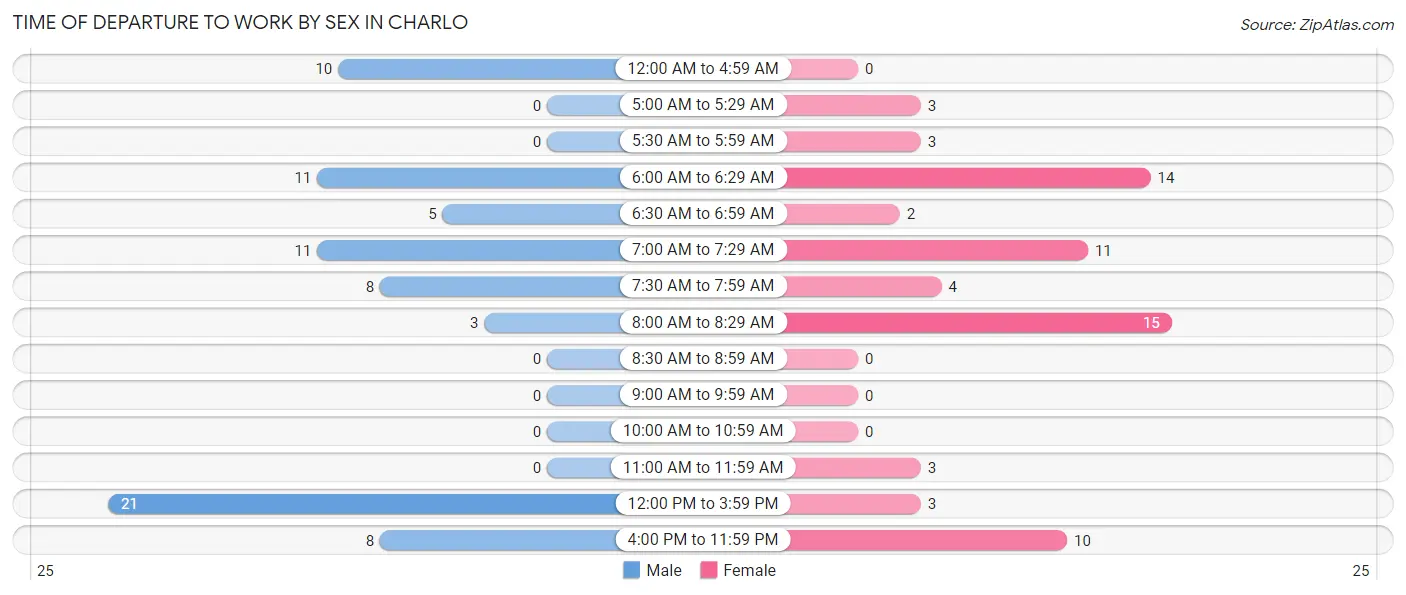
| Time of Departure | Male | Female |
| 12:00 AM to 4:59 AM | 10 (13.0%) | 0 (0.0%) |
| 5:00 AM to 5:29 AM | 0 (0.0%) | 3 (4.4%) |
| 5:30 AM to 5:59 AM | 0 (0.0%) | 3 (4.4%) |
| 6:00 AM to 6:29 AM | 11 (14.3%) | 14 (20.6%) |
| 6:30 AM to 6:59 AM | 5 (6.5%) | 2 (2.9%) |
| 7:00 AM to 7:29 AM | 11 (14.3%) | 11 (16.2%) |
| 7:30 AM to 7:59 AM | 8 (10.4%) | 4 (5.9%) |
| 8:00 AM to 8:29 AM | 3 (3.9%) | 15 (22.1%) |
| 8:30 AM to 8:59 AM | 0 (0.0%) | 0 (0.0%) |
| 9:00 AM to 9:59 AM | 0 (0.0%) | 0 (0.0%) |
| 10:00 AM to 10:59 AM | 0 (0.0%) | 0 (0.0%) |
| 11:00 AM to 11:59 AM | 0 (0.0%) | 3 (4.4%) |
| 12:00 PM to 3:59 PM | 21 (27.3%) | 3 (4.4%) |
| 4:00 PM to 11:59 PM | 8 (10.4%) | 10 (14.7%) |
| Total | 77 (100.0%) | 68 (100.0%) |
Housing Occupancy in Charlo
Occupancy by Ownership in Charlo
Of the total 160 dwellings in Charlo, owner-occupied units account for 97 (60.6%), while renter-occupied units make up 63 (39.4%).
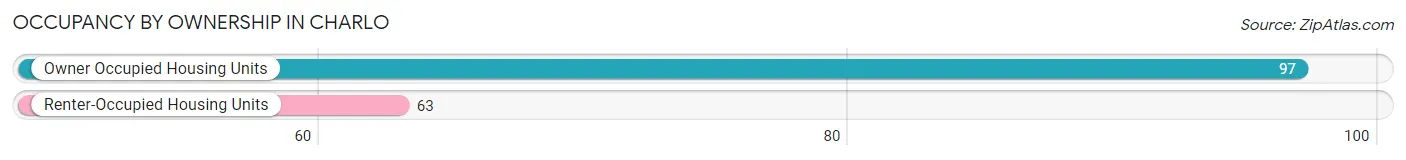
| Occupancy | # Housing Units | % Housing Units |
| Owner Occupied Housing Units | 97 | 60.6% |
| Renter-Occupied Housing Units | 63 | 39.4% |
| Total Occupied Housing Units | 160 | 100.0% |
Occupancy by Household Size in Charlo
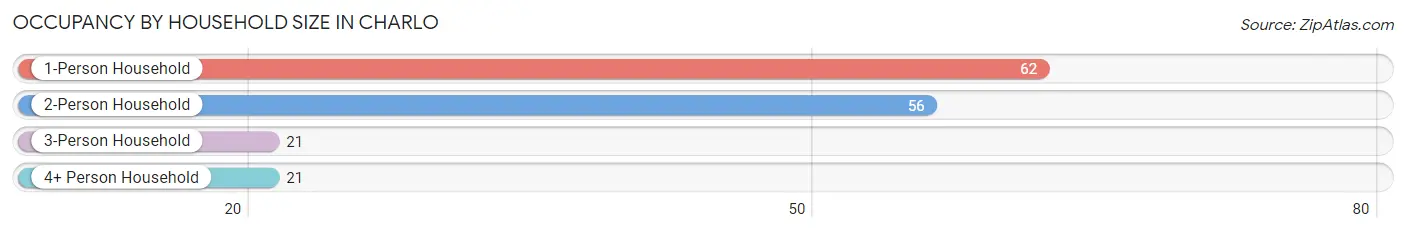
| Household Size | # Housing Units | % Housing Units |
| 1-Person Household | 62 | 38.8% |
| 2-Person Household | 56 | 35.0% |
| 3-Person Household | 21 | 13.1% |
| 4+ Person Household | 21 | 13.1% |
| Total Housing Units | 160 | 100.0% |
Occupancy by Ownership by Household Size in Charlo
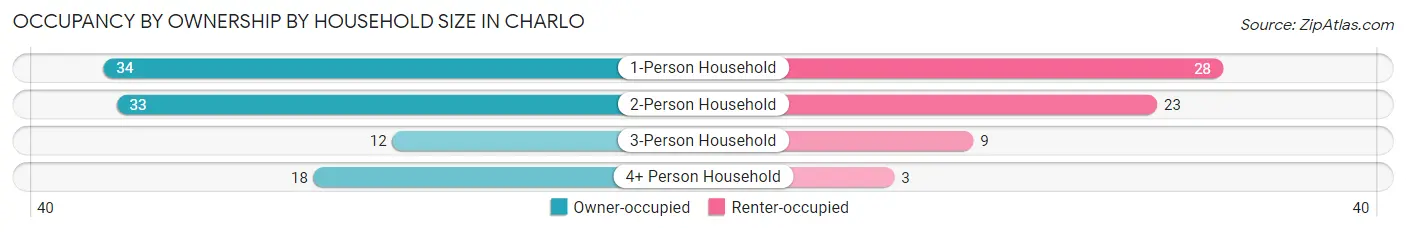
| Household Size | Owner-occupied | Renter-occupied |
| 1-Person Household | 34 (54.8%) | 28 (45.2%) |
| 2-Person Household | 33 (58.9%) | 23 (41.1%) |
| 3-Person Household | 12 (57.1%) | 9 (42.9%) |
| 4+ Person Household | 18 (85.7%) | 3 (14.3%) |
| Total Housing Units | 97 (60.6%) | 63 (39.4%) |
Occupancy by Educational Attainment in Charlo
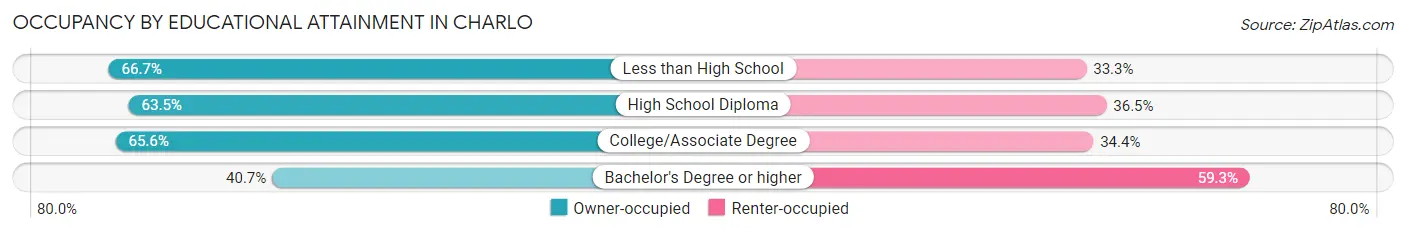
| Household Size | Owner-occupied | Renter-occupied |
| Less than High School | 6 (66.7%) | 3 (33.3%) |
| High School Diploma | 40 (63.5%) | 23 (36.5%) |
| College/Associate Degree | 40 (65.6%) | 21 (34.4%) |
| Bachelor's Degree or higher | 11 (40.7%) | 16 (59.3%) |
Occupancy by Age of Householder in Charlo
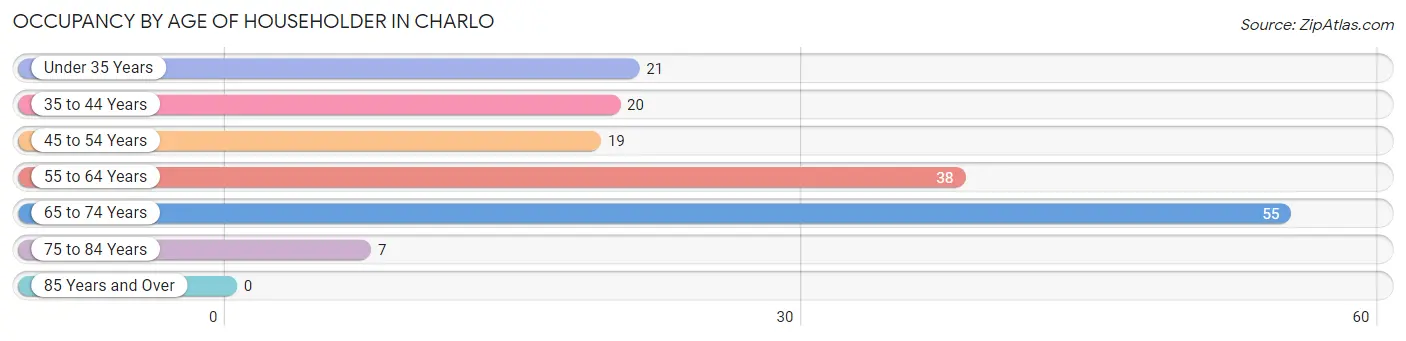
| Age Bracket | # Households | % Households |
| Under 35 Years | 21 | 13.1% |
| 35 to 44 Years | 20 | 12.5% |
| 45 to 54 Years | 19 | 11.9% |
| 55 to 64 Years | 38 | 23.7% |
| 65 to 74 Years | 55 | 34.4% |
| 75 to 84 Years | 7 | 4.4% |
| 85 Years and Over | 0 | 0.0% |
| Total | 160 | 100.0% |
Housing Finances in Charlo
Median Income by Occupancy in Charlo
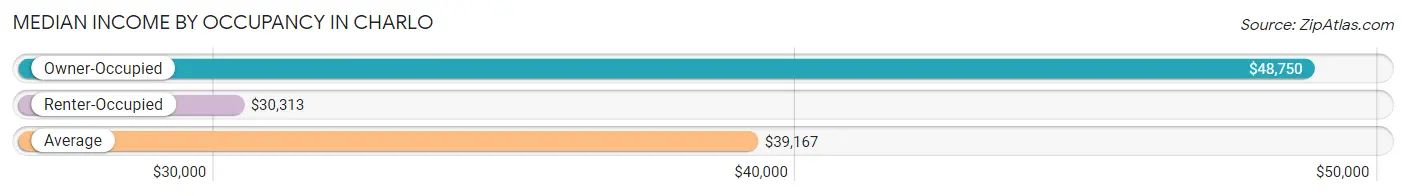
| Occupancy Type | # Households | Median Income |
| Owner-Occupied | 97 (60.6%) | $48,750 |
| Renter-Occupied | 63 (39.4%) | $30,313 |
| Average | 160 (100.0%) | $39,167 |
Occupancy by Householder Income Bracket in Charlo
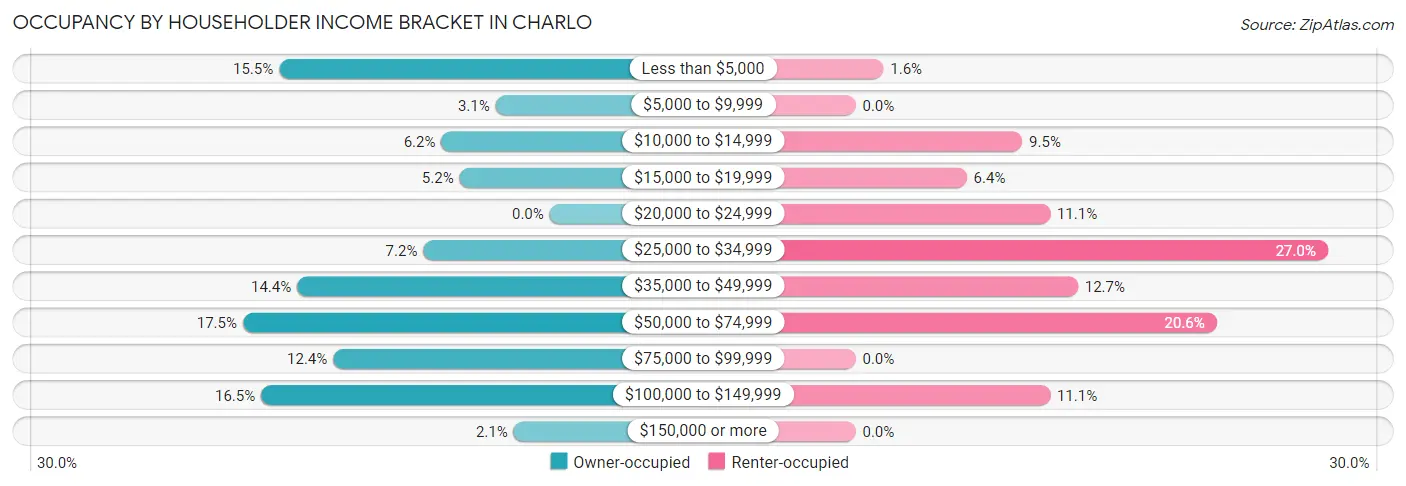
| Income Bracket | Owner-occupied | Renter-occupied |
| Less than $5,000 | 15 (15.5%) | 1 (1.6%) |
| $5,000 to $9,999 | 3 (3.1%) | 0 (0.0%) |
| $10,000 to $14,999 | 6 (6.2%) | 6 (9.5%) |
| $15,000 to $19,999 | 5 (5.1%) | 4 (6.4%) |
| $20,000 to $24,999 | 0 (0.0%) | 7 (11.1%) |
| $25,000 to $34,999 | 7 (7.2%) | 17 (27.0%) |
| $35,000 to $49,999 | 14 (14.4%) | 8 (12.7%) |
| $50,000 to $74,999 | 17 (17.5%) | 13 (20.6%) |
| $75,000 to $99,999 | 12 (12.4%) | 0 (0.0%) |
| $100,000 to $149,999 | 16 (16.5%) | 7 (11.1%) |
| $150,000 or more | 2 (2.1%) | 0 (0.0%) |
| Total | 97 (100.0%) | 63 (100.0%) |
Monthly Housing Cost Tiers in Charlo
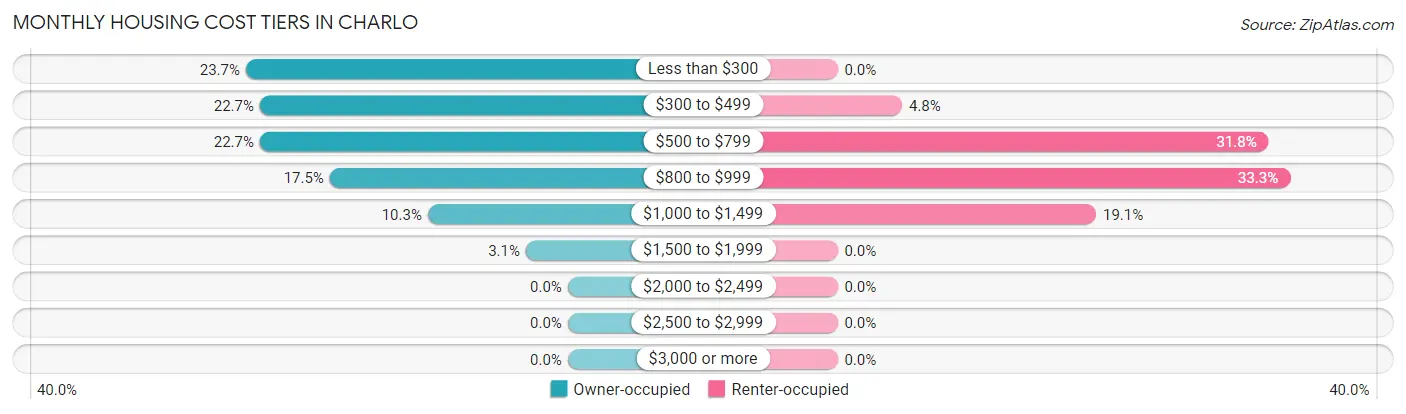
| Monthly Cost | Owner-occupied | Renter-occupied |
| Less than $300 | 23 (23.7%) | 0 (0.0%) |
| $300 to $499 | 22 (22.7%) | 3 (4.8%) |
| $500 to $799 | 22 (22.7%) | 20 (31.8%) |
| $800 to $999 | 17 (17.5%) | 21 (33.3%) |
| $1,000 to $1,499 | 10 (10.3%) | 12 (19.1%) |
| $1,500 to $1,999 | 3 (3.1%) | 0 (0.0%) |
| $2,000 to $2,499 | 0 (0.0%) | 0 (0.0%) |
| $2,500 to $2,999 | 0 (0.0%) | 0 (0.0%) |
| $3,000 or more | 0 (0.0%) | 0 (0.0%) |
| Total | 97 (100.0%) | 63 (100.0%) |
Physical Housing Characteristics in Charlo
Housing Structures in Charlo
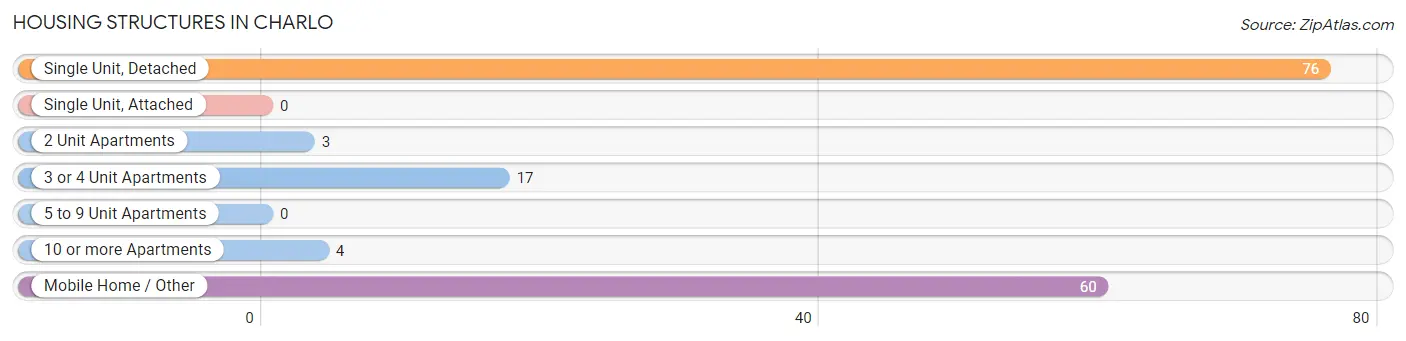
| Structure Type | # Housing Units | % Housing Units |
| Single Unit, Detached | 76 | 47.5% |
| Single Unit, Attached | 0 | 0.0% |
| 2 Unit Apartments | 3 | 1.9% |
| 3 or 4 Unit Apartments | 17 | 10.6% |
| 5 to 9 Unit Apartments | 0 | 0.0% |
| 10 or more Apartments | 4 | 2.5% |
| Mobile Home / Other | 60 | 37.5% |
| Total | 160 | 100.0% |
Housing Structures by Occupancy in Charlo
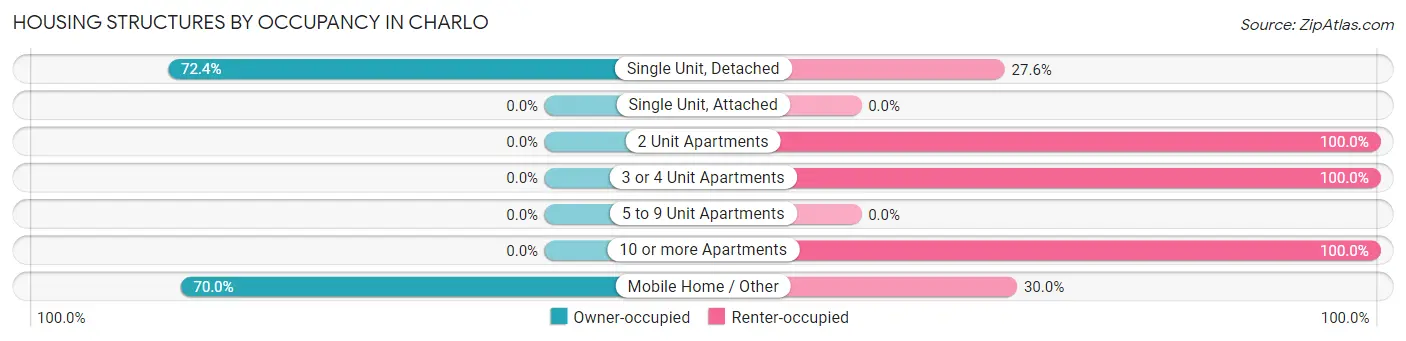
| Structure Type | Owner-occupied | Renter-occupied |
| Single Unit, Detached | 55 (72.4%) | 21 (27.6%) |
| Single Unit, Attached | 0 (0.0%) | 0 (0.0%) |
| 2 Unit Apartments | 0 (0.0%) | 3 (100.0%) |
| 3 or 4 Unit Apartments | 0 (0.0%) | 17 (100.0%) |
| 5 to 9 Unit Apartments | 0 (0.0%) | 0 (0.0%) |
| 10 or more Apartments | 0 (0.0%) | 4 (100.0%) |
| Mobile Home / Other | 42 (70.0%) | 18 (30.0%) |
| Total | 97 (60.6%) | 63 (39.4%) |
Housing Structures by Number of Rooms in Charlo
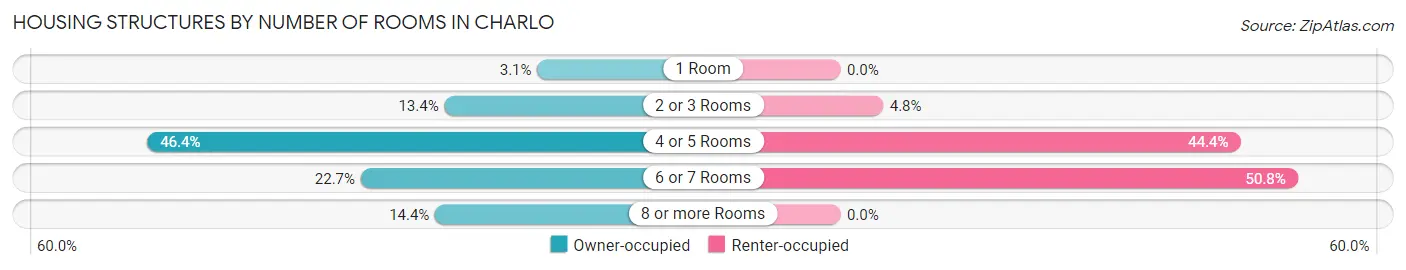
| Number of Rooms | Owner-occupied | Renter-occupied |
| 1 Room | 3 (3.1%) | 0 (0.0%) |
| 2 or 3 Rooms | 13 (13.4%) | 3 (4.8%) |
| 4 or 5 Rooms | 45 (46.4%) | 28 (44.4%) |
| 6 or 7 Rooms | 22 (22.7%) | 32 (50.8%) |
| 8 or more Rooms | 14 (14.4%) | 0 (0.0%) |
| Total | 97 (100.0%) | 63 (100.0%) |
Housing Structure by Heating Type in Charlo
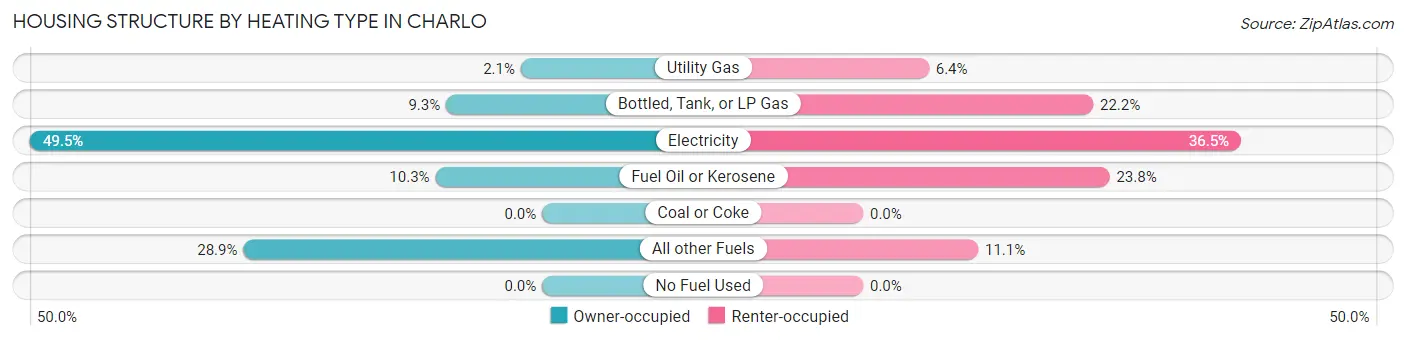
| Heating Type | Owner-occupied | Renter-occupied |
| Utility Gas | 2 (2.1%) | 4 (6.4%) |
| Bottled, Tank, or LP Gas | 9 (9.3%) | 14 (22.2%) |
| Electricity | 48 (49.5%) | 23 (36.5%) |
| Fuel Oil or Kerosene | 10 (10.3%) | 15 (23.8%) |
| Coal or Coke | 0 (0.0%) | 0 (0.0%) |
| All other Fuels | 28 (28.9%) | 7 (11.1%) |
| No Fuel Used | 0 (0.0%) | 0 (0.0%) |
| Total | 97 (100.0%) | 63 (100.0%) |
Household Vehicle Usage in Charlo
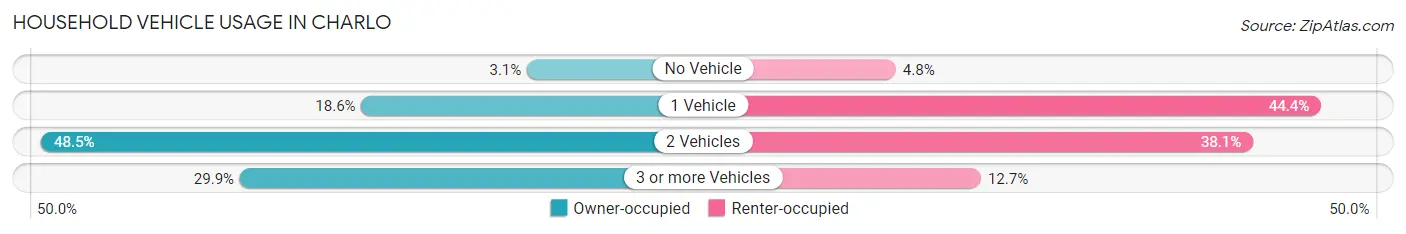
| Vehicles per Household | Owner-occupied | Renter-occupied |
| No Vehicle | 3 (3.1%) | 3 (4.8%) |
| 1 Vehicle | 18 (18.6%) | 28 (44.4%) |
| 2 Vehicles | 47 (48.4%) | 24 (38.1%) |
| 3 or more Vehicles | 29 (29.9%) | 8 (12.7%) |
| Total | 97 (100.0%) | 63 (100.0%) |
Real Estate & Mortgages in Charlo
Real Estate and Mortgage Overview in Charlo
| Characteristic | Without Mortgage | With Mortgage |
| Housing Units | 63 | 34 |
| Median Property Value | - | - |
| Median Household Income | - | - |
| Monthly Housing Costs | $371 | $0 |
| Real Estate Taxes | $725 | $0 |
Property Value by Mortgage Status in Charlo
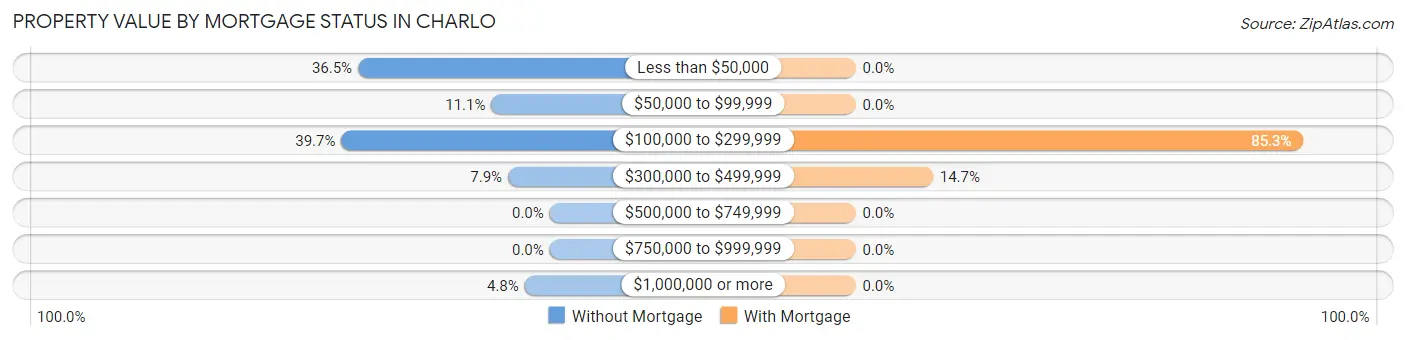
| Property Value | Without Mortgage | With Mortgage |
| Less than $50,000 | 23 (36.5%) | 0 (0.0%) |
| $50,000 to $99,999 | 7 (11.1%) | 0 (0.0%) |
| $100,000 to $299,999 | 25 (39.7%) | 29 (85.3%) |
| $300,000 to $499,999 | 5 (7.9%) | 5 (14.7%) |
| $500,000 to $749,999 | 0 (0.0%) | 0 (0.0%) |
| $750,000 to $999,999 | 0 (0.0%) | 0 (0.0%) |
| $1,000,000 or more | 3 (4.8%) | 0 (0.0%) |
| Total | 63 (100.0%) | 34 (100.0%) |
Household Income by Mortgage Status in Charlo
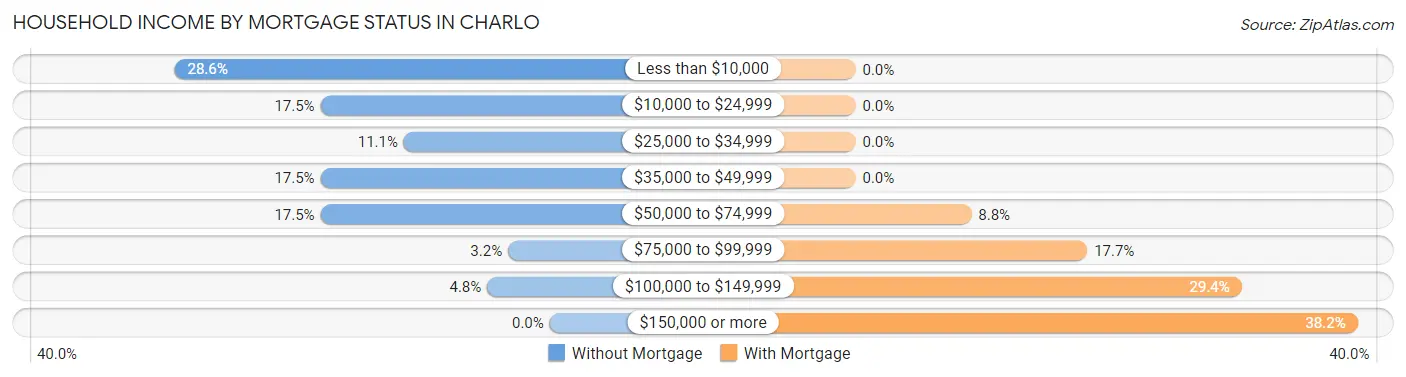
| Household Income | Without Mortgage | With Mortgage |
| Less than $10,000 | 18 (28.6%) | 0 (0.0%) |
| $10,000 to $24,999 | 11 (17.5%) | 0 (0.0%) |
| $25,000 to $34,999 | 7 (11.1%) | 0 (0.0%) |
| $35,000 to $49,999 | 11 (17.5%) | 0 (0.0%) |
| $50,000 to $74,999 | 11 (17.5%) | 3 (8.8%) |
| $75,000 to $99,999 | 2 (3.2%) | 6 (17.6%) |
| $100,000 to $149,999 | 3 (4.8%) | 10 (29.4%) |
| $150,000 or more | 0 (0.0%) | 13 (38.2%) |
| Total | 63 (100.0%) | 34 (100.0%) |
Property Value to Household Income Ratio in Charlo
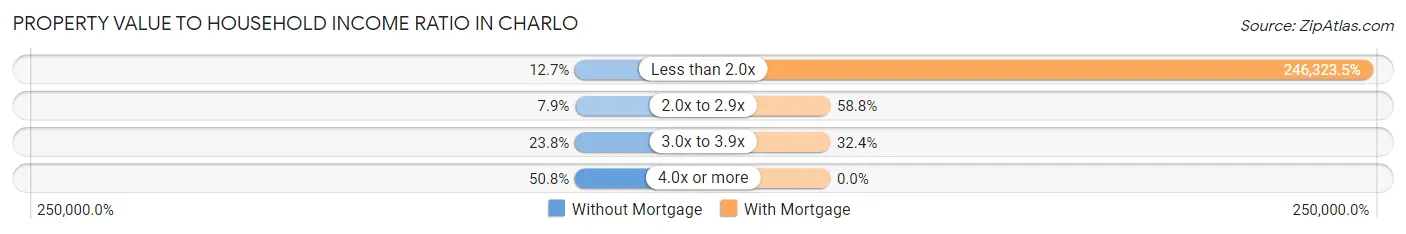
| Value-to-Income Ratio | Without Mortgage | With Mortgage |
| Less than 2.0x | 8 (12.7%) | 83,750 (246,323.5%) |
| 2.0x to 2.9x | 5 (7.9%) | 20 (58.8%) |
| 3.0x to 3.9x | 15 (23.8%) | 11 (32.4%) |
| 4.0x or more | 32 (50.8%) | 0 (0.0%) |
| Total | 63 (100.0%) | 34 (100.0%) |
Real Estate Taxes by Mortgage Status in Charlo
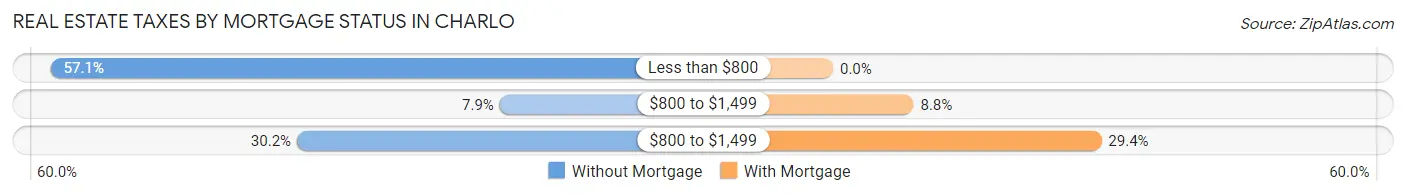
| Property Taxes | Without Mortgage | With Mortgage |
| Less than $800 | 36 (57.1%) | 0 (0.0%) |
| $800 to $1,499 | 5 (7.9%) | 3 (8.8%) |
| $800 to $1,499 | 19 (30.2%) | 10 (29.4%) |
| Total | 63 (100.0%) | 34 (100.0%) |
Health & Disability in Charlo
Health Insurance Coverage by Age in Charlo
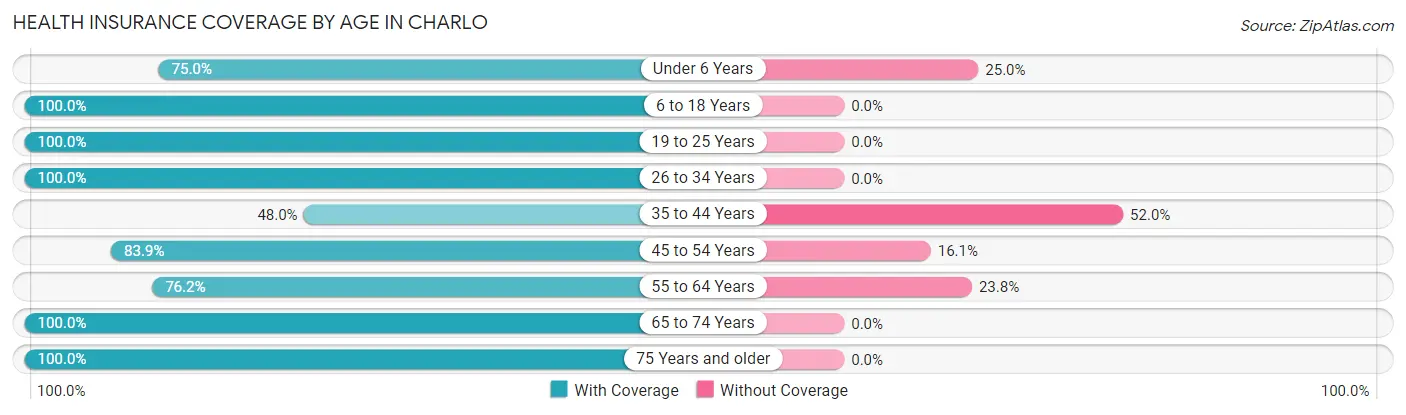
| Age Bracket | With Coverage | Without Coverage |
| Under 6 Years | 21 (75.0%) | 7 (25.0%) |
| 6 to 18 Years | 44 (100.0%) | 0 (0.0%) |
| 19 to 25 Years | 8 (100.0%) | 0 (0.0%) |
| 26 to 34 Years | 48 (100.0%) | 0 (0.0%) |
| 35 to 44 Years | 24 (48.0%) | 26 (52.0%) |
| 45 to 54 Years | 26 (83.9%) | 5 (16.1%) |
| 55 to 64 Years | 48 (76.2%) | 15 (23.8%) |
| 65 to 74 Years | 71 (100.0%) | 0 (0.0%) |
| 75 Years and older | 13 (100.0%) | 0 (0.0%) |
| Total | 303 (85.1%) | 53 (14.9%) |
Health Insurance Coverage by Citizenship Status in Charlo
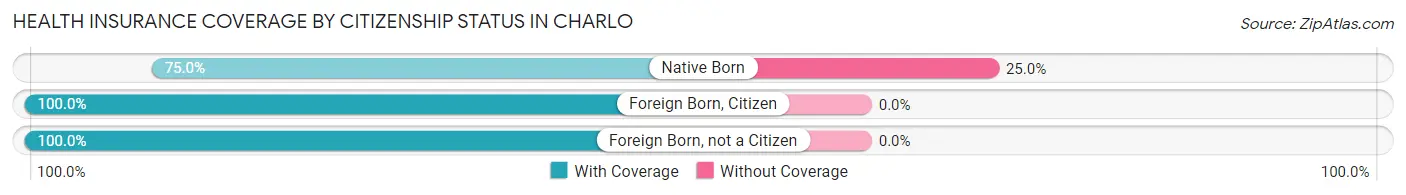
| Citizenship Status | With Coverage | Without Coverage |
| Native Born | 21 (75.0%) | 7 (25.0%) |
| Foreign Born, Citizen | 44 (100.0%) | 0 (0.0%) |
| Foreign Born, not a Citizen | 8 (100.0%) | 0 (0.0%) |
Health Insurance Coverage by Household Income in Charlo
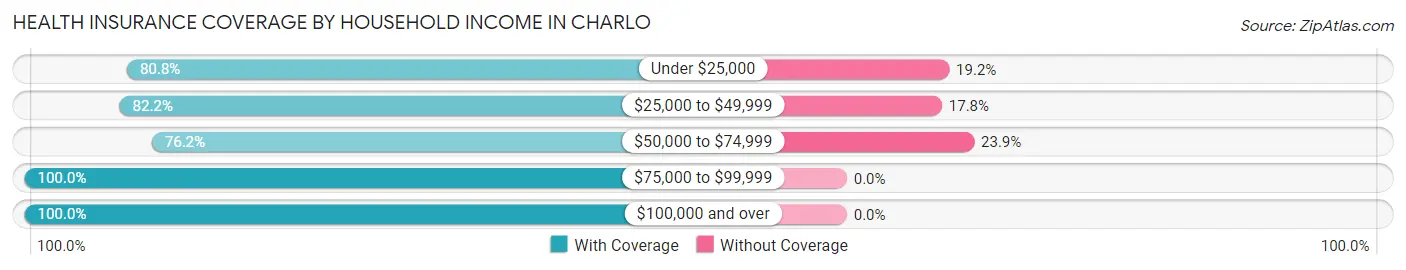
| Household Income | With Coverage | Without Coverage |
| Under $25,000 | 59 (80.8%) | 14 (19.2%) |
| $25,000 to $49,999 | 60 (82.2%) | 13 (17.8%) |
| $50,000 to $74,999 | 83 (76.1%) | 26 (23.8%) |
| $75,000 to $99,999 | 21 (100.0%) | 0 (0.0%) |
| $100,000 and over | 80 (100.0%) | 0 (0.0%) |
Public vs Private Health Insurance Coverage by Age in Charlo
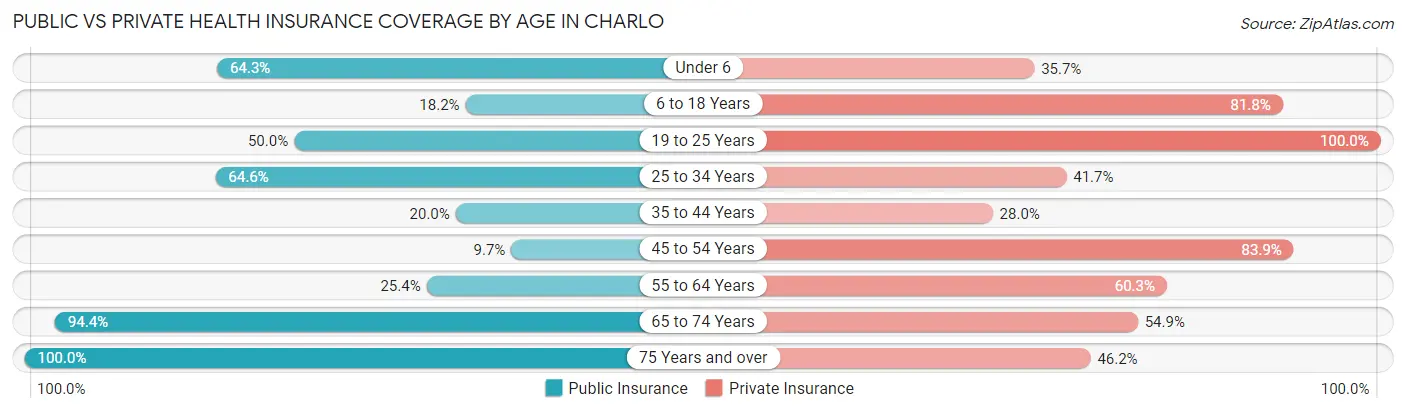
| Age Bracket | Public Insurance | Private Insurance |
| Under 6 | 18 (64.3%) | 10 (35.7%) |
| 6 to 18 Years | 8 (18.2%) | 36 (81.8%) |
| 19 to 25 Years | 4 (50.0%) | 8 (100.0%) |
| 25 to 34 Years | 31 (64.6%) | 20 (41.7%) |
| 35 to 44 Years | 10 (20.0%) | 14 (28.0%) |
| 45 to 54 Years | 3 (9.7%) | 26 (83.9%) |
| 55 to 64 Years | 16 (25.4%) | 38 (60.3%) |
| 65 to 74 Years | 67 (94.4%) | 39 (54.9%) |
| 75 Years and over | 13 (100.0%) | 6 (46.2%) |
| Total | 170 (47.7%) | 197 (55.3%) |
Disability Status by Sex by Age in Charlo
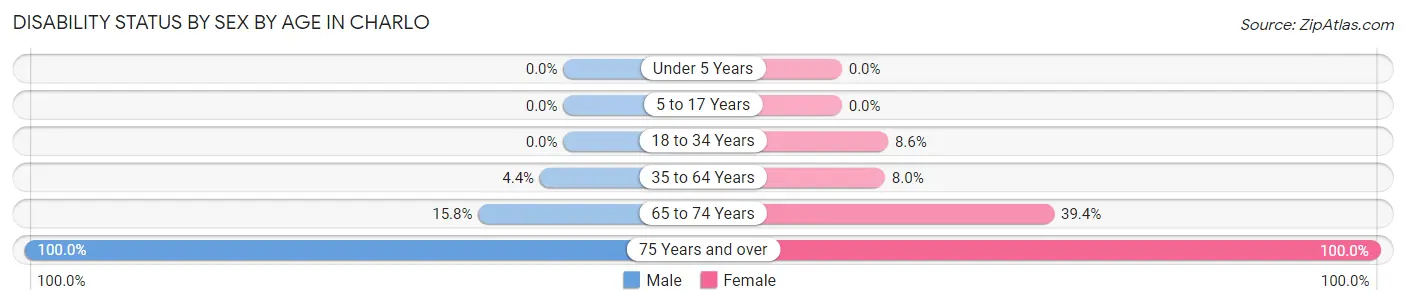
| Age Bracket | Male | Female |
| Under 5 Years | 0 (0.0%) | 0 (0.0%) |
| 5 to 17 Years | 0 (0.0%) | 0 (0.0%) |
| 18 to 34 Years | 0 (0.0%) | 3 (8.6%) |
| 35 to 64 Years | 3 (4.3%) | 6 (8.0%) |
| 65 to 74 Years | 6 (15.8%) | 13 (39.4%) |
| 75 Years and over | 10 (100.0%) | 3 (100.0%) |
Disability Class by Sex by Age in Charlo
Disability Class: Hearing Difficulty
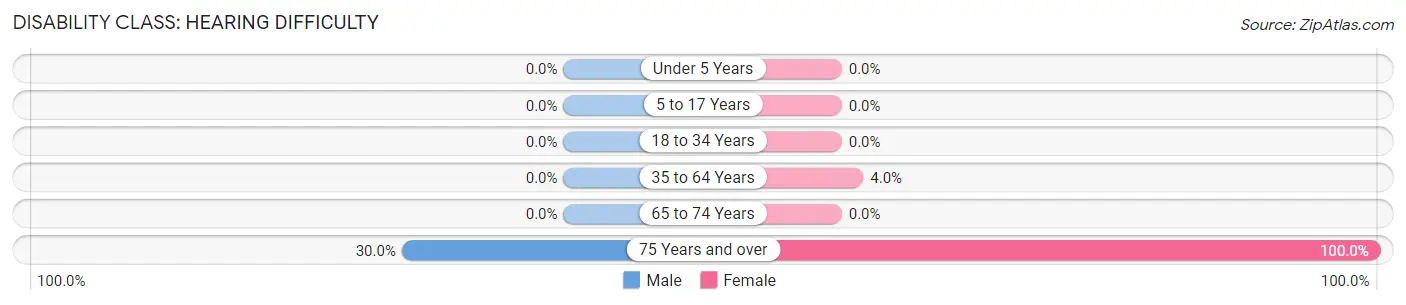
| Age Bracket | Male | Female |
| Under 5 Years | 0 (0.0%) | 0 (0.0%) |
| 5 to 17 Years | 0 (0.0%) | 0 (0.0%) |
| 18 to 34 Years | 0 (0.0%) | 0 (0.0%) |
| 35 to 64 Years | 0 (0.0%) | 3 (4.0%) |
| 65 to 74 Years | 0 (0.0%) | 0 (0.0%) |
| 75 Years and over | 3 (30.0%) | 3 (100.0%) |
Disability Class: Vision Difficulty
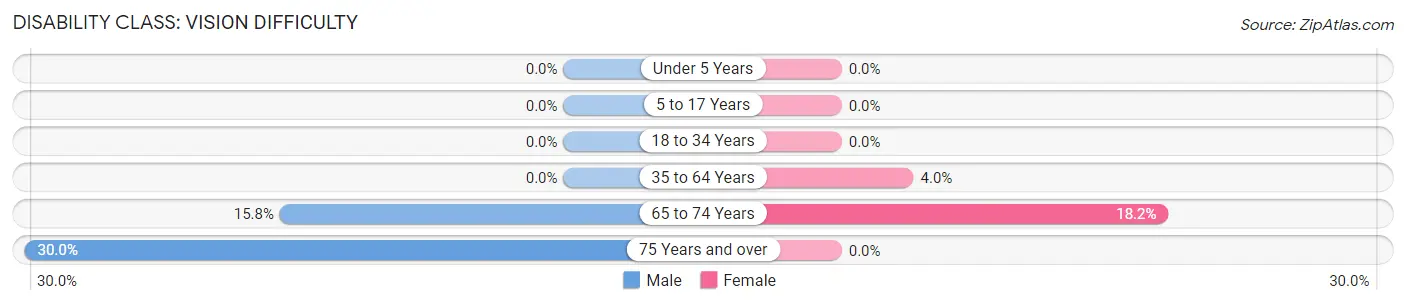
| Age Bracket | Male | Female |
| Under 5 Years | 0 (0.0%) | 0 (0.0%) |
| 5 to 17 Years | 0 (0.0%) | 0 (0.0%) |
| 18 to 34 Years | 0 (0.0%) | 0 (0.0%) |
| 35 to 64 Years | 0 (0.0%) | 3 (4.0%) |
| 65 to 74 Years | 6 (15.8%) | 6 (18.2%) |
| 75 Years and over | 3 (30.0%) | 0 (0.0%) |
Disability Class: Cognitive Difficulty
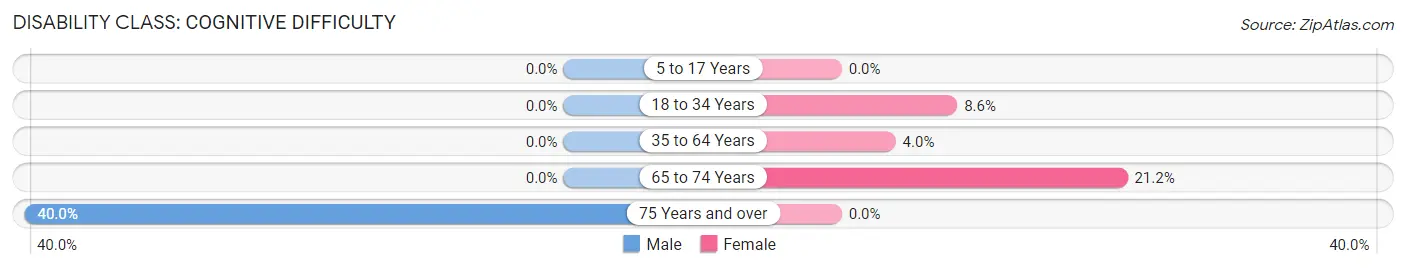
| Age Bracket | Male | Female |
| 5 to 17 Years | 0 (0.0%) | 0 (0.0%) |
| 18 to 34 Years | 0 (0.0%) | 3 (8.6%) |
| 35 to 64 Years | 0 (0.0%) | 3 (4.0%) |
| 65 to 74 Years | 0 (0.0%) | 7 (21.2%) |
| 75 Years and over | 4 (40.0%) | 0 (0.0%) |
Disability Class: Ambulatory Difficulty
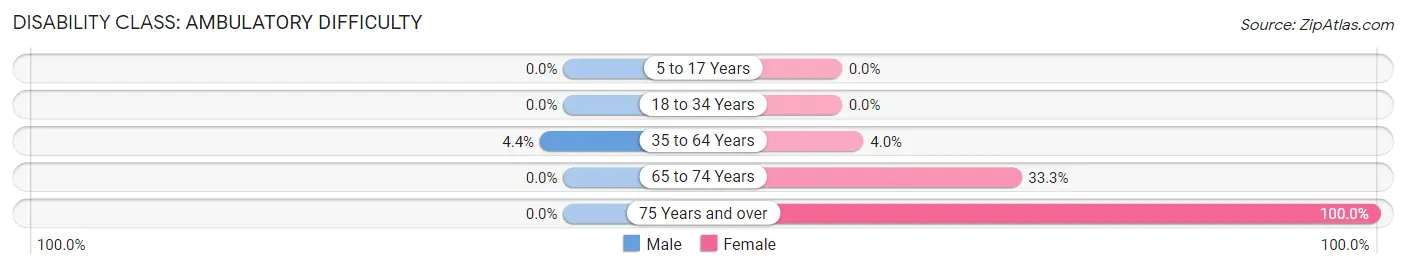
| Age Bracket | Male | Female |
| 5 to 17 Years | 0 (0.0%) | 0 (0.0%) |
| 18 to 34 Years | 0 (0.0%) | 0 (0.0%) |
| 35 to 64 Years | 3 (4.3%) | 3 (4.0%) |
| 65 to 74 Years | 0 (0.0%) | 11 (33.3%) |
| 75 Years and over | 0 (0.0%) | 3 (100.0%) |
Disability Class: Self-Care Difficulty
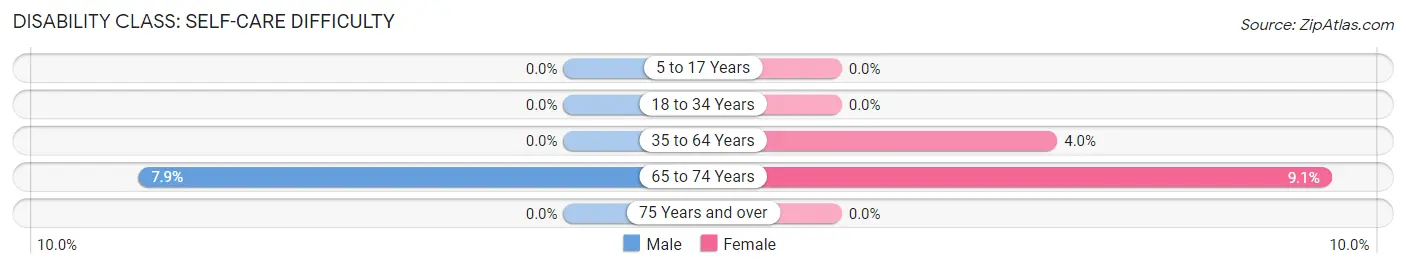
| Age Bracket | Male | Female |
| 5 to 17 Years | 0 (0.0%) | 0 (0.0%) |
| 18 to 34 Years | 0 (0.0%) | 0 (0.0%) |
| 35 to 64 Years | 0 (0.0%) | 3 (4.0%) |
| 65 to 74 Years | 3 (7.9%) | 3 (9.1%) |
| 75 Years and over | 0 (0.0%) | 0 (0.0%) |
Technology Access in Charlo
Computing Device Access in Charlo
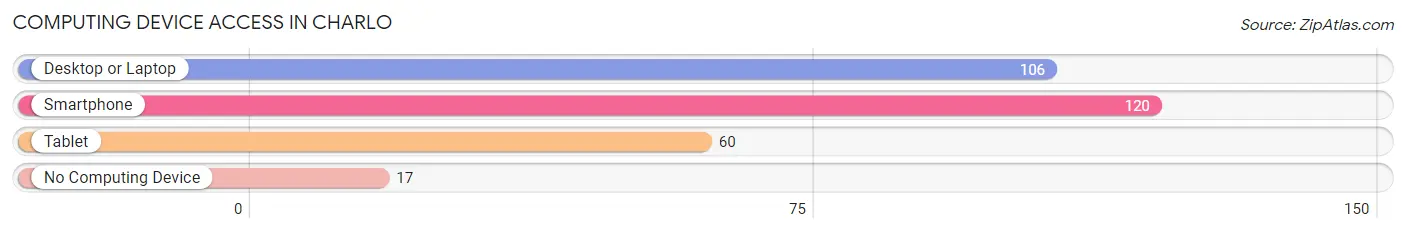
| Device Type | # Households | % Households |
| Desktop or Laptop | 106 | 66.2% |
| Smartphone | 120 | 75.0% |
| Tablet | 60 | 37.5% |
| No Computing Device | 17 | 10.6% |
| Total | 160 | 100.0% |
Internet Access in Charlo
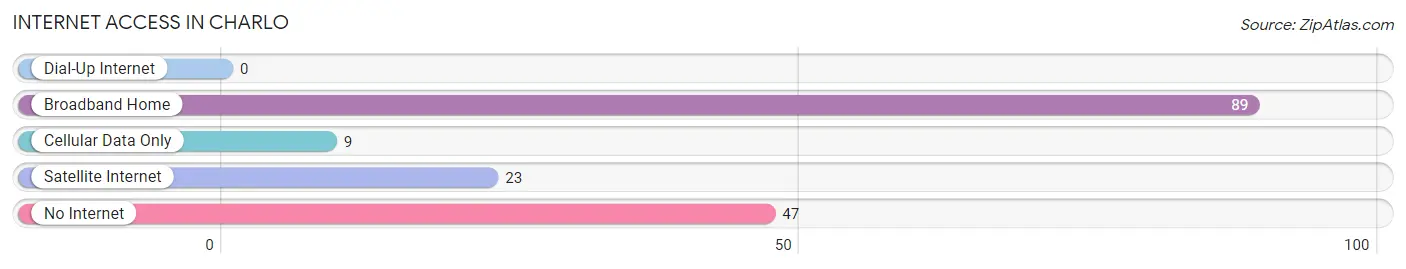
| Internet Type | # Households | % Households |
| Dial-Up Internet | 0 | 0.0% |
| Broadband Home | 89 | 55.6% |
| Cellular Data Only | 9 | 5.6% |
| Satellite Internet | 23 | 14.4% |
| No Internet | 47 | 29.4% |
| Total | 160 | 100.0% |
Charlo Summary
Charlo, Montana is a small town located in the northwestern corner of the state, near the Idaho border. It is situated in Lake County, and is part of the Flathead Indian Reservation. The town was founded in 1891 and has a population of about 500 people.
Geography
Charlo is located in the Flathead Valley, which is a large, flat valley surrounded by mountains. The Flathead River runs through the valley, and the town is situated on the banks of the river. The town is located at an elevation of 3,400 feet, and the surrounding area is mostly flat, with some rolling hills. The climate is semi-arid, with hot summers and cold winters.
Economy
The economy of Charlo is largely based on agriculture and tourism. The town is home to several farms, which produce a variety of crops, including wheat, barley, hay, and potatoes. The town also has a small tourism industry, with several local attractions, such as the Flathead River, the Flathead National Forest, and the nearby National Bison Range.
Demographics
As of the 2010 census, the population of Charlo was 498 people. The racial makeup of the town was 95.2% White, 0.2% African American, 1.2% Native American, 0.2% Asian, 0.2% Pacific Islander, 0.4% from other races, and 2.8% from two or more races. The median household income was $30,000, and the median family income was $35,000.
History
Charlo was founded in 1891 by a group of settlers from the Flathead Indian Reservation. The town was named after Chief Charlo, a leader of the Salish tribe. The town quickly grew, and by the early 1900s, it had become a bustling community with a variety of businesses, including a hotel, a general store, and a post office.
In the early 1900s, the town was a popular destination for tourists, who came to enjoy the scenery and the outdoor activities. The town also had a thriving lumber industry, and several sawmills were built in the area.
In the 1950s, the town began to decline, as the lumber industry moved away and the tourist industry declined. The town has since seen a resurgence, as the tourism industry has grown and the town has become a popular destination for outdoor recreation.
Today, Charlo is a small, quiet town with a population of about 500 people. The town is still largely agricultural, and the local economy is based on farming and tourism. The town is also home to several local attractions, such as the Flathead River, the Flathead National Forest, and the nearby National Bison Range.
Common Questions
What is Per Capita Income in Charlo?
Per Capita income in Charlo is $25,778.
What is the Median Family Income in Charlo?
Median Family Income in Charlo is $65,417.
What is the Median Household income in Charlo?
Median Household Income in Charlo is $39,167.
What is Inequality or Gini Index in Charlo?
Inequality or Gini Index in Charlo is 0.44.
What is the Total Population of Charlo?
Total Population of Charlo is 356.
What is the Total Male Population of Charlo?
Total Male Population of Charlo is 189.
What is the Total Female Population of Charlo?
Total Female Population of Charlo is 167.
What is the Ratio of Males per 100 Females in Charlo?
There are 113.17 Males per 100 Females in Charlo.
What is the Ratio of Females per 100 Males in Charlo?
There are 88.36 Females per 100 Males in Charlo.
What is the Median Population Age in Charlo?
Median Population Age in Charlo is 45.0 Years.
What is the Average Family Size in Charlo
Average Family Size in Charlo is 3.0 People.
What is the Average Household Size in Charlo
Average Household Size in Charlo is 2.2 People.
How Large is the Labor Force in Charlo?
There are 180 People in the Labor Forcein in Charlo.
What is the Percentage of People in the Labor Force in Charlo?
60.2% of People are in the Labor Force in Charlo.
What is the Unemployment Rate in Charlo?
Unemployment Rate in Charlo is 5.6%.