Condon, MT Map & Demographics
Condon Map
Condon Overview
$34,959
PER CAPITA INCOME
$61,786
AVG FAMILY INCOME
$53,125
AVG HOUSEHOLD INCOME
14.7%
WAGE / INCOME GAP [ % ]
85.3¢/ $1
WAGE / INCOME GAP [ $ ]
0.40
INEQUALITY / GINI INDEX
307
TOTAL POPULATION
160
MALE POPULATION
147
FEMALE POPULATION
108.84
MALES / 100 FEMALES
91.88
FEMALES / 100 MALES
64.8
MEDIAN AGE
2.2
AVG FAMILY SIZE
1.6
AVG HOUSEHOLD SIZE
91
LABOR FORCE [ PEOPLE ]
30.5%
PERCENT IN LABOR FORCE
3.3%
UNEMPLOYMENT RATE
Condon Zip Codes
Condon Area Codes
Income in Condon
Income Overview in Condon
Per Capita Income in Condon is $34,959, while median incomes of families and households are $61,786 and $53,125 respectively.
| Characteristic | Number | Measure |
| Per Capita Income | 307 | $34,959 |
| Median Family Income | 90 | $61,786 |
| Mean Family Income | 90 | $75,656 |
| Median Household Income | 186 | $53,125 |
| Mean Household Income | 186 | $55,181 |
| Income Deficit | 90 | $0 |
| Wage / Income Gap (%) | 307 | 14.67% |
| Wage / Income Gap ($) | 307 | 85.33¢ per $1 |
| Gini / Inequality Index | 307 | 0.40 |
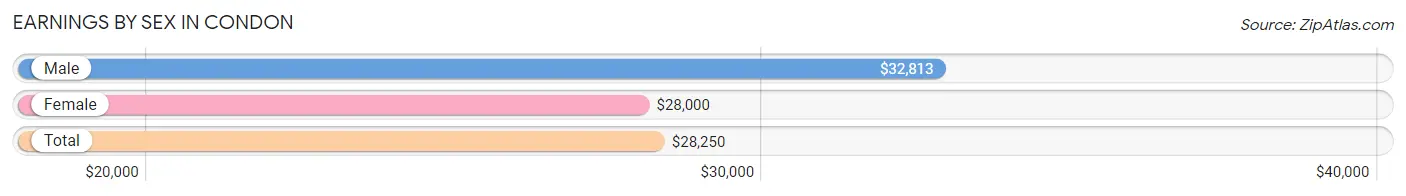
Earnings by Sex in Condon
Average Earnings in Condon are $28,250, $32,813 for men and $28,000 for women, a difference of 14.7%.
| Sex | Number | Average Earnings |
| Male | 63 (66.3%) | $32,813 |
| Female | 32 (33.7%) | $28,000 |
| Total | 95 (100.0%) | $28,250 |
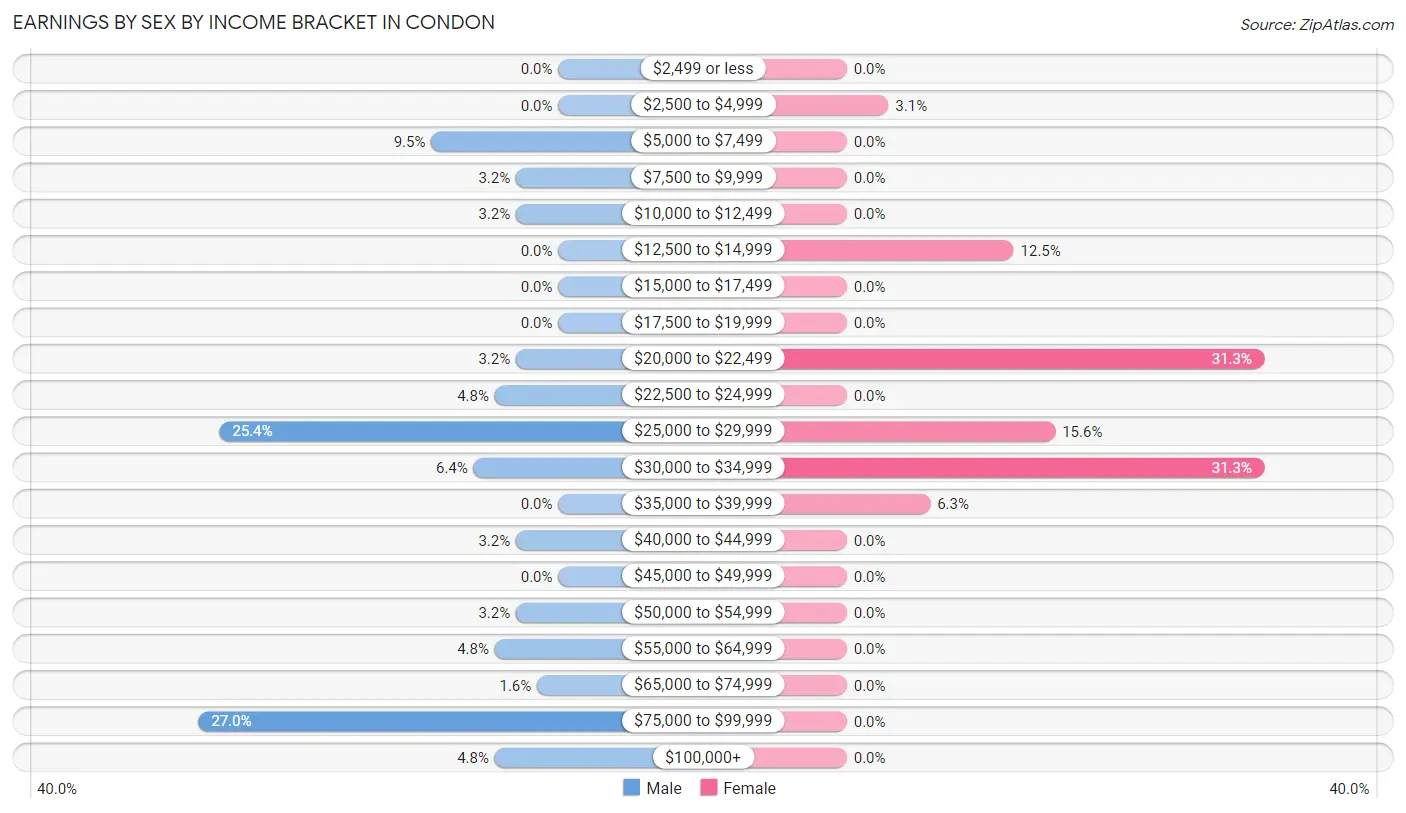
Earnings by Sex by Income Bracket in Condon
The most common earnings brackets in Condon are $75,000 to $99,999 for men (17 | 27.0%) and $20,000 to $22,499 for women (10 | 31.2%).
| Income | Male | Female |
| $2,499 or less | 0 (0.0%) | 0 (0.0%) |
| $2,500 to $4,999 | 0 (0.0%) | 1 (3.1%) |
| $5,000 to $7,499 | 6 (9.5%) | 0 (0.0%) |
| $7,500 to $9,999 | 2 (3.2%) | 0 (0.0%) |
| $10,000 to $12,499 | 2 (3.2%) | 0 (0.0%) |
| $12,500 to $14,999 | 0 (0.0%) | 4 (12.5%) |
| $15,000 to $17,499 | 0 (0.0%) | 0 (0.0%) |
| $17,500 to $19,999 | 0 (0.0%) | 0 (0.0%) |
| $20,000 to $22,499 | 2 (3.2%) | 10 (31.2%) |
| $22,500 to $24,999 | 3 (4.8%) | 0 (0.0%) |
| $25,000 to $29,999 | 16 (25.4%) | 5 (15.6%) |
| $30,000 to $34,999 | 4 (6.4%) | 10 (31.2%) |
| $35,000 to $39,999 | 0 (0.0%) | 2 (6.2%) |
| $40,000 to $44,999 | 2 (3.2%) | 0 (0.0%) |
| $45,000 to $49,999 | 0 (0.0%) | 0 (0.0%) |
| $50,000 to $54,999 | 2 (3.2%) | 0 (0.0%) |
| $55,000 to $64,999 | 3 (4.8%) | 0 (0.0%) |
| $65,000 to $74,999 | 1 (1.6%) | 0 (0.0%) |
| $75,000 to $99,999 | 17 (27.0%) | 0 (0.0%) |
| $100,000+ | 3 (4.8%) | 0 (0.0%) |
| Total | 63 (100.0%) | 32 (100.0%) |
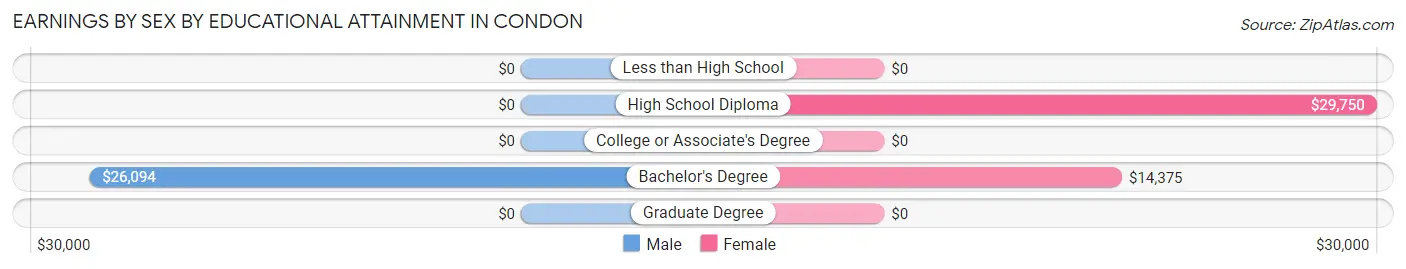
Earnings by Sex by Educational Attainment in Condon
Average earnings in Condon are $32,813 for men and $28,000 for women, a difference of 14.7%. Men with an educational attainment of bachelor's degree enjoy the highest average annual earnings of $26,094, while those with bachelor's degree education earn the least with $26,094. Women with an educational attainment of high school diploma earn the most with the average annual earnings of $29,750, while those with bachelor's degree education have the smallest earnings of $14,375.
| Educational Attainment | Male Income | Female Income |
| Less than High School | - | - |
| High School Diploma | - | - |
| College or Associate's Degree | - | - |
| Bachelor's Degree | $26,094 | $14,375 |
| Graduate Degree | - | - |
| Total | $32,813 | $28,000 |
Family Income in Condon
Family Income Brackets in Condon
According to the Condon family income data, there are 34 families falling into the $50,000 to $74,999 income range, which is the most common income bracket and makes up 37.8% of all families.
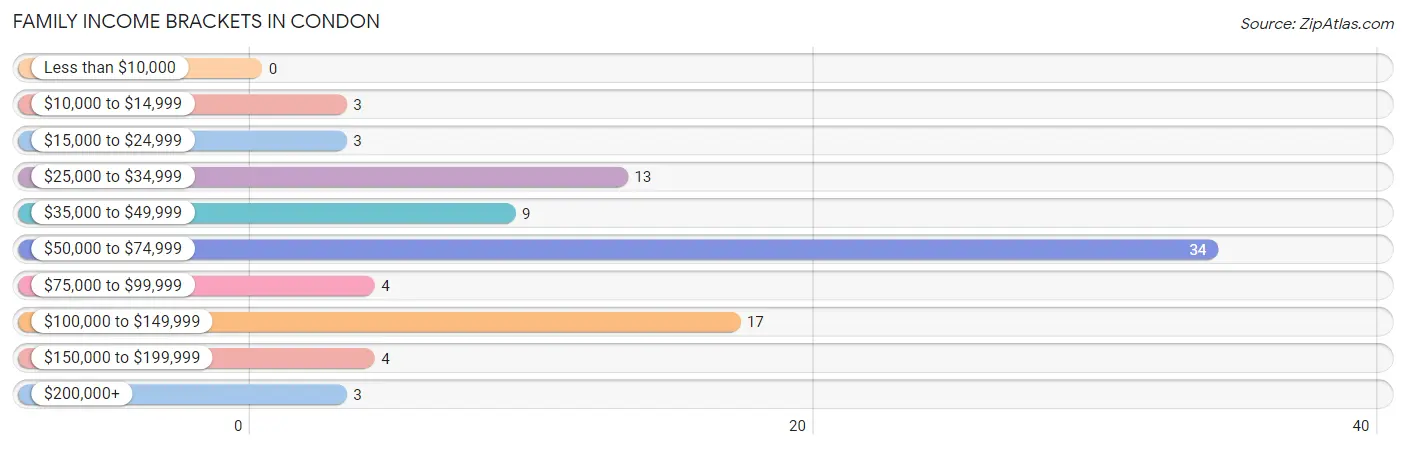
| Income Bracket | # Families | % Families |
| Less than $10,000 | 0 | 0.0% |
| $10,000 to $14,999 | 3 | 3.3% |
| $15,000 to $24,999 | 3 | 3.3% |
| $25,000 to $34,999 | 13 | 14.4% |
| $35,000 to $49,999 | 9 | 10.0% |
| $50,000 to $74,999 | 34 | 37.8% |
| $75,000 to $99,999 | 4 | 4.4% |
| $100,000 to $149,999 | 17 | 18.9% |
| $150,000 to $199,999 | 4 | 4.4% |
| $200,000+ | 3 | 3.3% |
Family Income by Famaliy Size in Condon
2-person families (82 | 91.1%) account for the highest median family income in Condon with $61,071 per family, while 2-person families (82 | 91.1%) have the highest median income of $30,536 per family member.
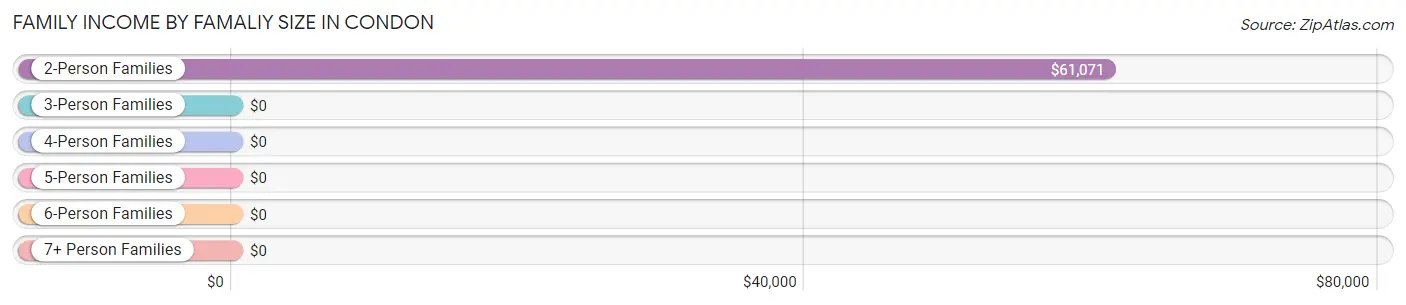
| Income Bracket | # Families | Median Income |
| 2-Person Families | 82 (91.1%) | $61,071 |
| 3-Person Families | 8 (8.9%) | $0 |
| 4-Person Families | 0 (0.0%) | $0 |
| 5-Person Families | 0 (0.0%) | $0 |
| 6-Person Families | 0 (0.0%) | $0 |
| 7+ Person Families | 0 (0.0%) | $0 |
| Total | 90 (100.0%) | $61,786 |
Family Income by Number of Earners in Condon
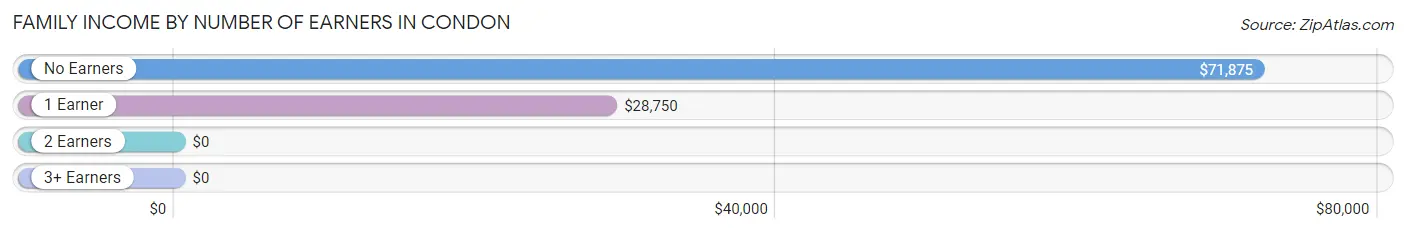
| Number of Earners | # Families | Median Income |
| No Earners | 40 (44.4%) | $71,875 |
| 1 Earner | 25 (27.8%) | $28,750 |
| 2 Earners | 25 (27.8%) | $0 |
| 3+ Earners | 0 (0.0%) | $0 |
| Total | 90 (100.0%) | $61,786 |
Household Income in Condon
Household Income Brackets in Condon
With 61 households falling in the category, the $50,000 to $74,999 income range is the most frequent in Condon, accounting for 32.8% of all households. In contrast, only 3 households (1.6%) fall into the $200,000+ income bracket, making it the least populous group.
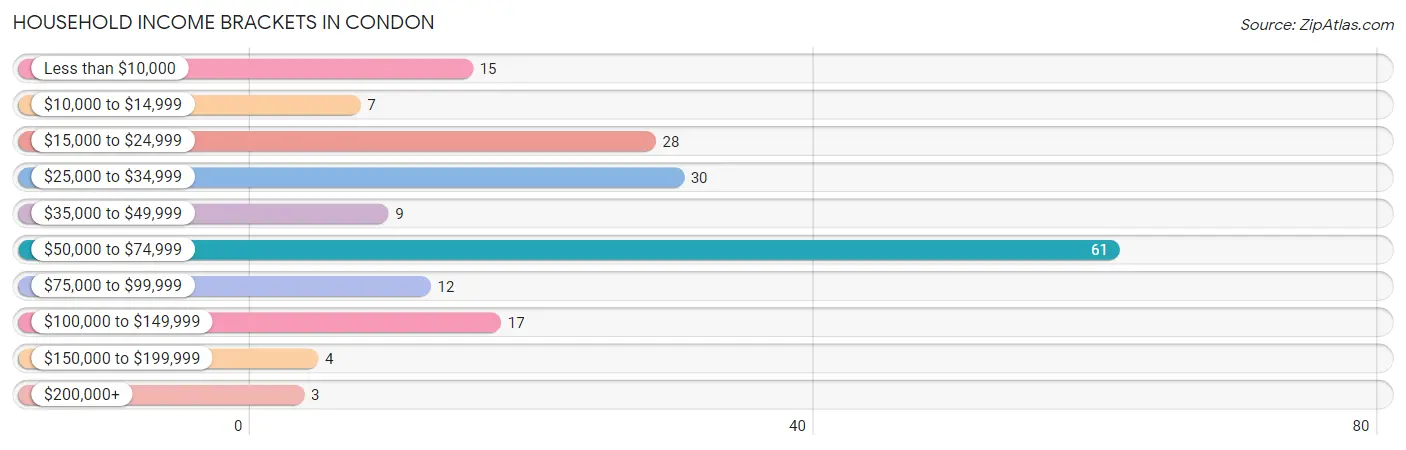
| Income Bracket | # Households | % Households |
| Less than $10,000 | 15 | 8.1% |
| $10,000 to $14,999 | 7 | 3.8% |
| $15,000 to $24,999 | 28 | 15.1% |
| $25,000 to $34,999 | 30 | 16.1% |
| $35,000 to $49,999 | 9 | 4.8% |
| $50,000 to $74,999 | 61 | 32.8% |
| $75,000 to $99,999 | 12 | 6.5% |
| $100,000 to $149,999 | 17 | 9.1% |
| $150,000 to $199,999 | 4 | 2.2% |
| $200,000+ | 3 | 1.6% |
Household Income by Householder Age in Condon
The median household income in Condon is $53,125, with the highest median household income of $118,214 found in the 25 to 44 years age bracket for the primary householder. A total of 10 households (5.4%) fall into this category.
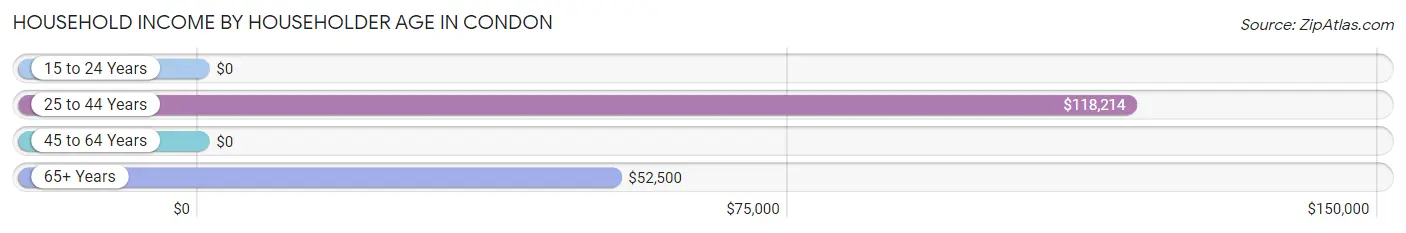
| Income Bracket | # Households | Median Income |
| 15 to 24 Years | 0 (0.0%) | $0 |
| 25 to 44 Years | 10 (5.4%) | $118,214 |
| 45 to 64 Years | 72 (38.7%) | $0 |
| 65+ Years | 104 (55.9%) | $52,500 |
| Total | 186 (100.0%) | $53,125 |
Poverty in Condon
Income Below Poverty by Sex and Age in Condon
With 18.8% poverty level for males and 8.2% for females among the residents of Condon, 25 to 34 year old males and 55 to 64 year old females are the most vulnerable to poverty, with 14 males (87.5%) and 6 females (14.6%) in their respective age groups living below the poverty level.
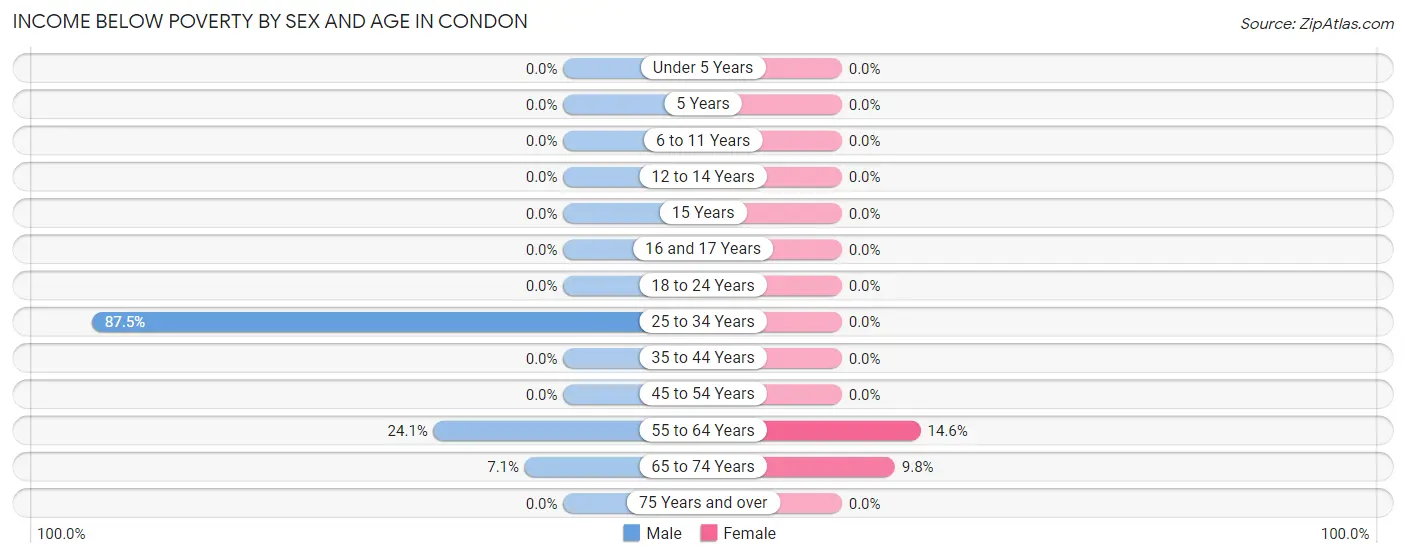
| Age Bracket | Male | Female |
| Under 5 Years | 0 (0.0%) | 0 (0.0%) |
| 5 Years | 0 (0.0%) | 0 (0.0%) |
| 6 to 11 Years | 0 (0.0%) | 0 (0.0%) |
| 12 to 14 Years | 0 (0.0%) | 0 (0.0%) |
| 15 Years | 0 (0.0%) | 0 (0.0%) |
| 16 and 17 Years | 0 (0.0%) | 0 (0.0%) |
| 18 to 24 Years | 0 (0.0%) | 0 (0.0%) |
| 25 to 34 Years | 14 (87.5%) | 0 (0.0%) |
| 35 to 44 Years | 0 (0.0%) | 0 (0.0%) |
| 45 to 54 Years | 0 (0.0%) | 0 (0.0%) |
| 55 to 64 Years | 13 (24.1%) | 6 (14.6%) |
| 65 to 74 Years | 3 (7.1%) | 6 (9.8%) |
| 75 Years and over | 0 (0.0%) | 0 (0.0%) |
| Total | 30 (18.8%) | 12 (8.2%) |
Income Above Poverty by Sex and Age in Condon
According to the poverty statistics in Condon, males aged 12 to 14 years and females aged 25 to 34 years are the age groups that are most secure financially, with 100.0% of males and 100.0% of females in these age groups living above the poverty line.
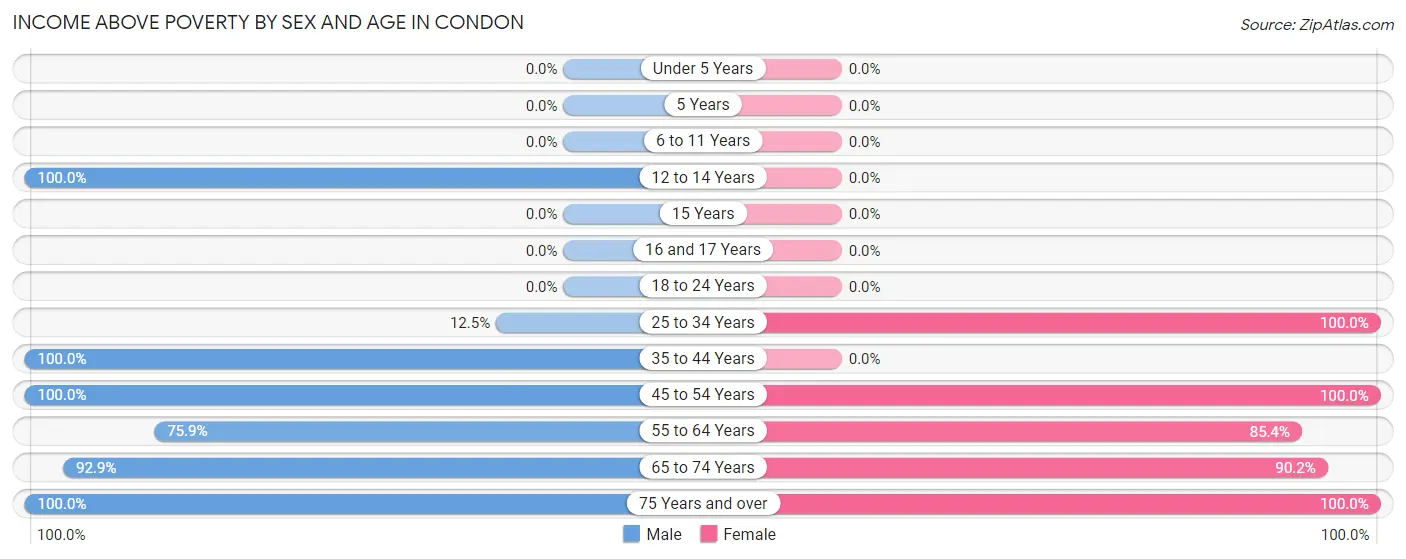
| Age Bracket | Male | Female |
| Under 5 Years | 0 (0.0%) | 0 (0.0%) |
| 5 Years | 0 (0.0%) | 0 (0.0%) |
| 6 to 11 Years | 0 (0.0%) | 0 (0.0%) |
| 12 to 14 Years | 9 (100.0%) | 0 (0.0%) |
| 15 Years | 0 (0.0%) | 0 (0.0%) |
| 16 and 17 Years | 0 (0.0%) | 0 (0.0%) |
| 18 to 24 Years | 0 (0.0%) | 0 (0.0%) |
| 25 to 34 Years | 2 (12.5%) | 11 (100.0%) |
| 35 to 44 Years | 7 (100.0%) | 0 (0.0%) |
| 45 to 54 Years | 11 (100.0%) | 12 (100.0%) |
| 55 to 64 Years | 41 (75.9%) | 35 (85.4%) |
| 65 to 74 Years | 39 (92.9%) | 55 (90.2%) |
| 75 Years and over | 21 (100.0%) | 22 (100.0%) |
| Total | 130 (81.2%) | 135 (91.8%) |
Income Below Poverty Among Married-Couple Families in Condon
The poverty statistics for married-couple families in Condon show that 3.4% or 3 of the total 88 families live below the poverty line. Families with no children have the highest poverty rate of 3.7%, comprising of 3 families. On the other hand, families with 1 or 2 children have the lowest poverty rate of 0.0%, which includes 0 families.
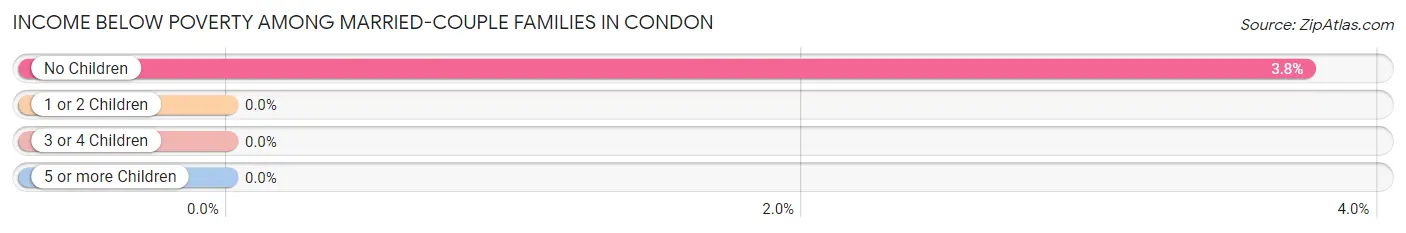
| Children | Above Poverty | Below Poverty |
| No Children | 77 (96.3%) | 3 (3.7%) |
| 1 or 2 Children | 8 (100.0%) | 0 (0.0%) |
| 3 or 4 Children | 0 (0.0%) | 0 (0.0%) |
| 5 or more Children | 0 (0.0%) | 0 (0.0%) |
| Total | 85 (96.6%) | 3 (3.4%) |
Income Below Poverty Among Single-Parent Households in Condon
| Children | Single Father | Single Mother |
| No Children | 0 (0.0%) | 0 (0.0%) |
| 1 or 2 Children | 0 (0.0%) | 0 (0.0%) |
| 3 or 4 Children | 0 (0.0%) | 0 (0.0%) |
| 5 or more Children | 0 (0.0%) | 0 (0.0%) |
| Total | 0 (0.0%) | 0 (0.0%) |
Income Below Poverty Among Married-Couple vs Single-Parent Households in Condon
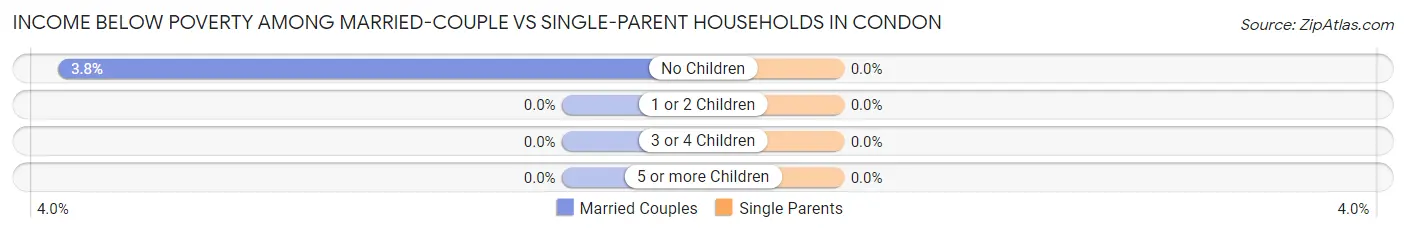
| Children | Married-Couple Families | Single-Parent Households |
| No Children | 3 (3.7%) | 0 (0.0%) |
| 1 or 2 Children | 0 (0.0%) | 0 (0.0%) |
| 3 or 4 Children | 0 (0.0%) | 0 (0.0%) |
| 5 or more Children | 0 (0.0%) | 0 (0.0%) |
| Total | 3 (3.4%) | 0 (0.0%) |
Race in Condon
The most populous races in Condon are White / Caucasian (297 | 96.7%), Hispanic or Latino (9 | 2.9%), and Two or more Races (8 | 2.6%).
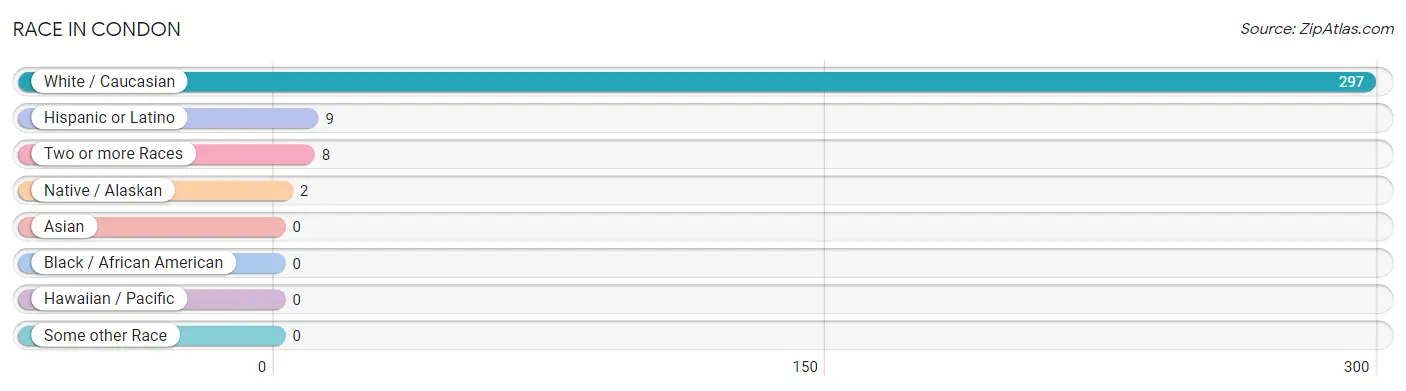
| Race | # Population | % Population |
| Asian | 0 | 0.0% |
| Black / African American | 0 | 0.0% |
| Hawaiian / Pacific | 0 | 0.0% |
| Hispanic or Latino | 9 | 2.9% |
| Native / Alaskan | 2 | 0.6% |
| White / Caucasian | 297 | 96.7% |
| Two or more Races | 8 | 2.6% |
| Some other Race | 0 | 0.0% |
| Total | 307 | 100.0% |
Ancestry in Condon
The most populous ancestries reported in Condon are German (147 | 47.9%), English (65 | 21.2%), Irish (52 | 16.9%), Norwegian (34 | 11.1%), and Italian (23 | 7.5%), together accounting for 104.6% of all Condon residents.
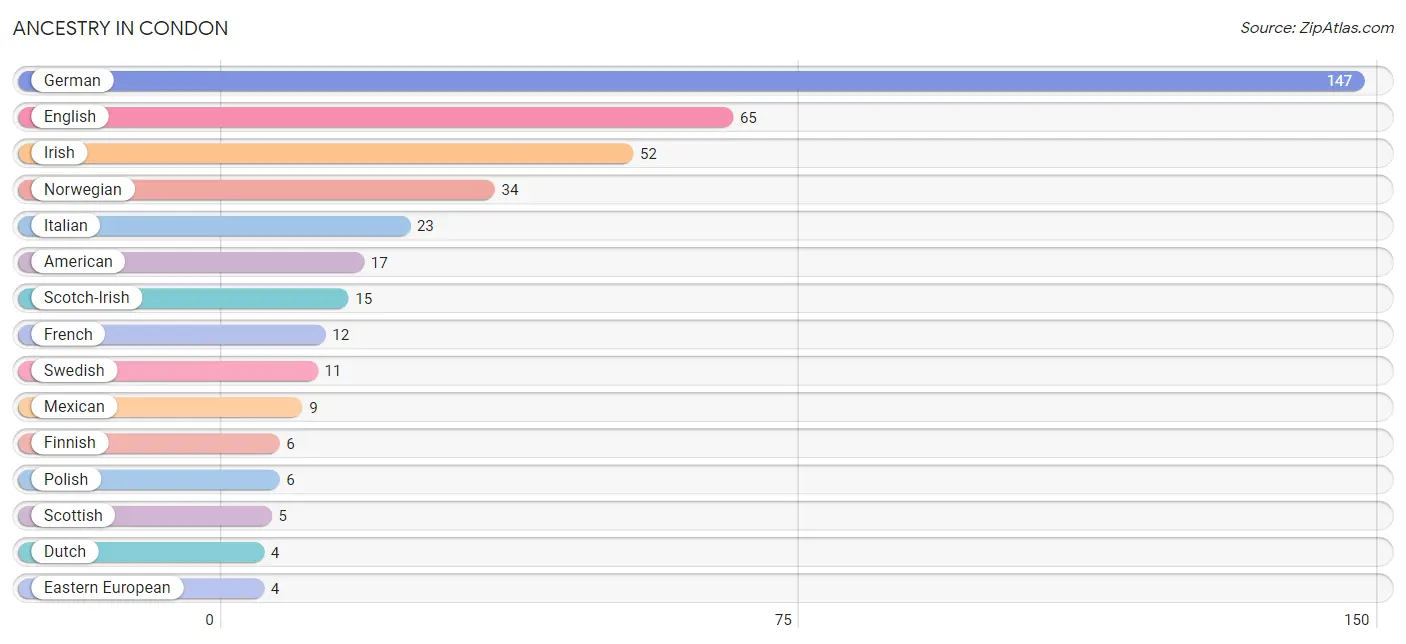
| Ancestry | # Population | % Population |
| American | 17 | 5.5% |
| Blackfeet | 2 | 0.6% |
| Dutch | 4 | 1.3% |
| Eastern European | 4 | 1.3% |
| English | 65 | 21.2% |
| Finnish | 6 | 1.9% |
| French | 12 | 3.9% |
| German | 147 | 47.9% |
| Irish | 52 | 16.9% |
| Italian | 23 | 7.5% |
| Mexican | 9 | 2.9% |
| Norwegian | 34 | 11.1% |
| Polish | 6 | 1.9% |
| Scandinavian | 4 | 1.3% |
| Scotch-Irish | 15 | 4.9% |
| Scottish | 5 | 1.6% |
| Swedish | 11 | 3.6% |
| Ukrainian | 1 | 0.3% | View All 18 Rows |
Immigrants in Condon
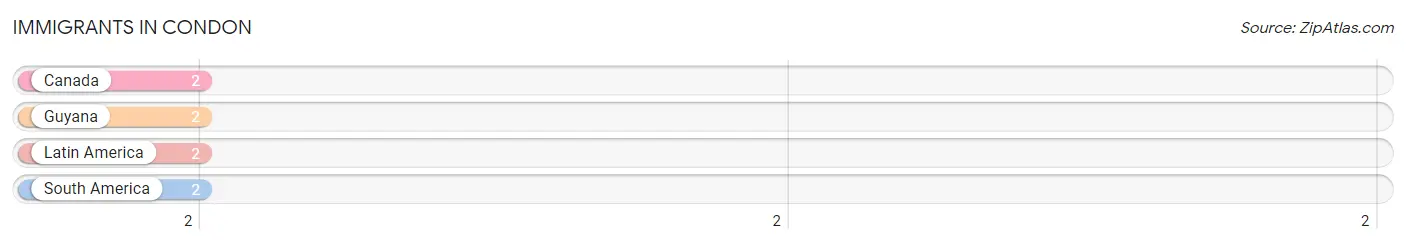
The most numerous immigrant groups reported in Condon came from Canada (2 | 0.6%), Guyana (2 | 0.6%), Latin America (2 | 0.6%), and South America (2 | 0.6%), together accounting for 2.6% of all Condon residents.
| Immigration Origin | # Population | % Population |
| Canada | 2 | 0.6% |
| Guyana | 2 | 0.6% |
| Latin America | 2 | 0.6% |
| South America | 2 | 0.6% | View All 4 Rows |
Sex and Age in Condon
Sex and Age in Condon
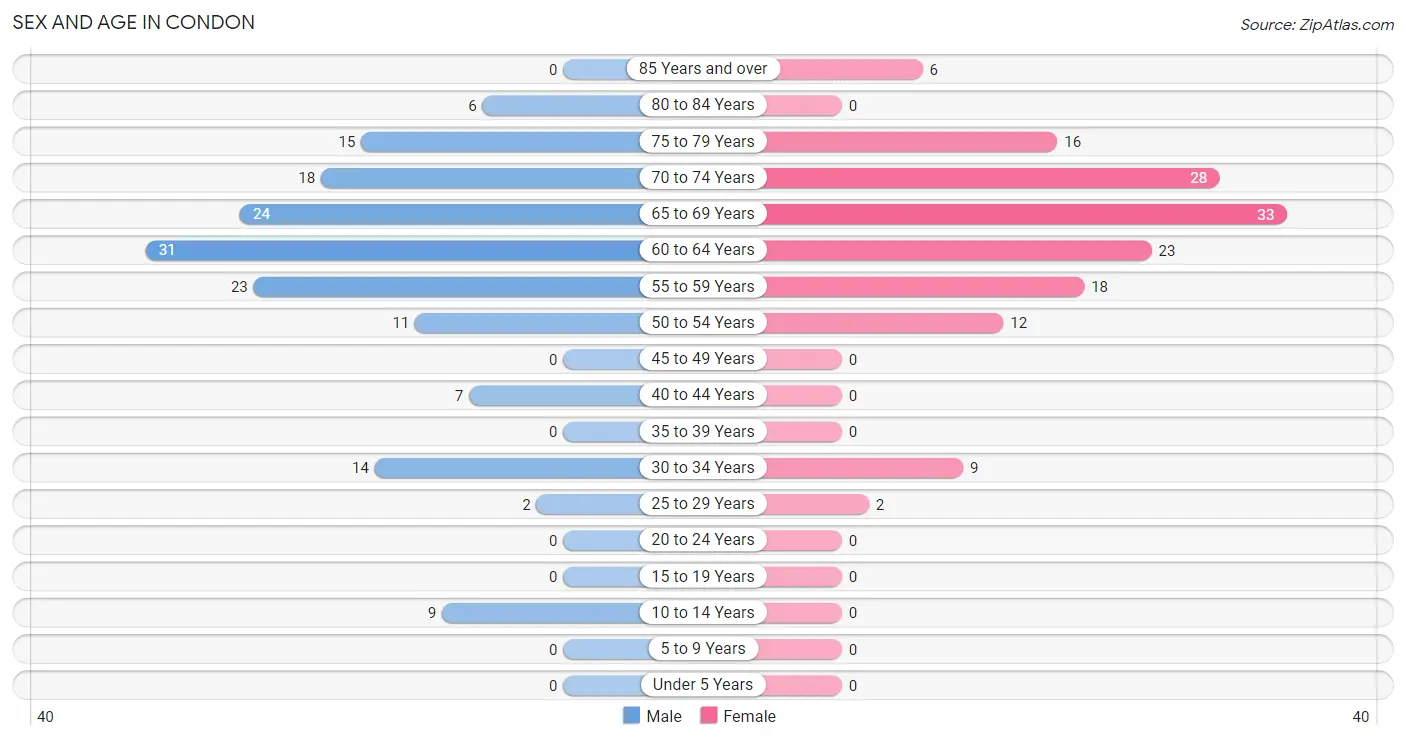
The most populous age groups in Condon are 60 to 64 Years (31 | 19.4%) for men and 65 to 69 Years (33 | 22.5%) for women.
| Age Bracket | Male | Female |
| Under 5 Years | 0 (0.0%) | 0 (0.0%) |
| 5 to 9 Years | 0 (0.0%) | 0 (0.0%) |
| 10 to 14 Years | 9 (5.6%) | 0 (0.0%) |
| 15 to 19 Years | 0 (0.0%) | 0 (0.0%) |
| 20 to 24 Years | 0 (0.0%) | 0 (0.0%) |
| 25 to 29 Years | 2 (1.3%) | 2 (1.4%) |
| 30 to 34 Years | 14 (8.7%) | 9 (6.1%) |
| 35 to 39 Years | 0 (0.0%) | 0 (0.0%) |
| 40 to 44 Years | 7 (4.4%) | 0 (0.0%) |
| 45 to 49 Years | 0 (0.0%) | 0 (0.0%) |
| 50 to 54 Years | 11 (6.9%) | 12 (8.2%) |
| 55 to 59 Years | 23 (14.4%) | 18 (12.2%) |
| 60 to 64 Years | 31 (19.4%) | 23 (15.7%) |
| 65 to 69 Years | 24 (15.0%) | 33 (22.5%) |
| 70 to 74 Years | 18 (11.3%) | 28 (19.1%) |
| 75 to 79 Years | 15 (9.4%) | 16 (10.9%) |
| 80 to 84 Years | 6 (3.7%) | 0 (0.0%) |
| 85 Years and over | 0 (0.0%) | 6 (4.1%) |
| Total | 160 (100.0%) | 147 (100.0%) |
Families and Households in Condon
Median Family Size in Condon
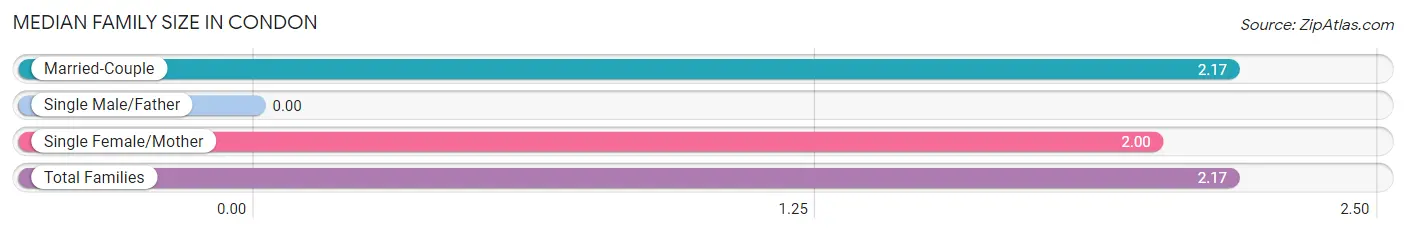
| Family Type | # Families | Family Size |
| Married-Couple | 88 (97.8%) | 2.17 |
| Single Male/Father | 0 (0.0%) | - |
| Single Female/Mother | 2 (2.2%) | 2.00 |
| Total Families | 90 (100.0%) | 2.17 |
Median Household Size in Condon
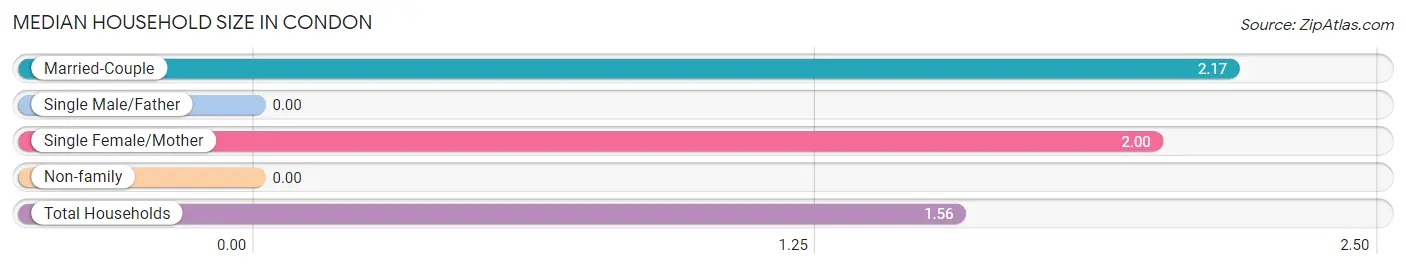
| Household Type | # Households | Household Size |
| Married-Couple | 88 (47.3%) | 2.17 |
| Single Male/Father | 0 (0.0%) | - |
| Single Female/Mother | 2 (1.1%) | 2.00 |
| Non-family | 96 (51.6%) | - |
| Total Households | 186 (100.0%) | 1.56 |
Household Size by Marriage Status in Condon
Out of a total of 186 households in Condon, 90 (48.4%) are family households, while 96 (51.6%) are nonfamily households. The most numerous type of family households are 2-person households, comprising 82, and the most common type of nonfamily households are 1-person households, comprising 96.
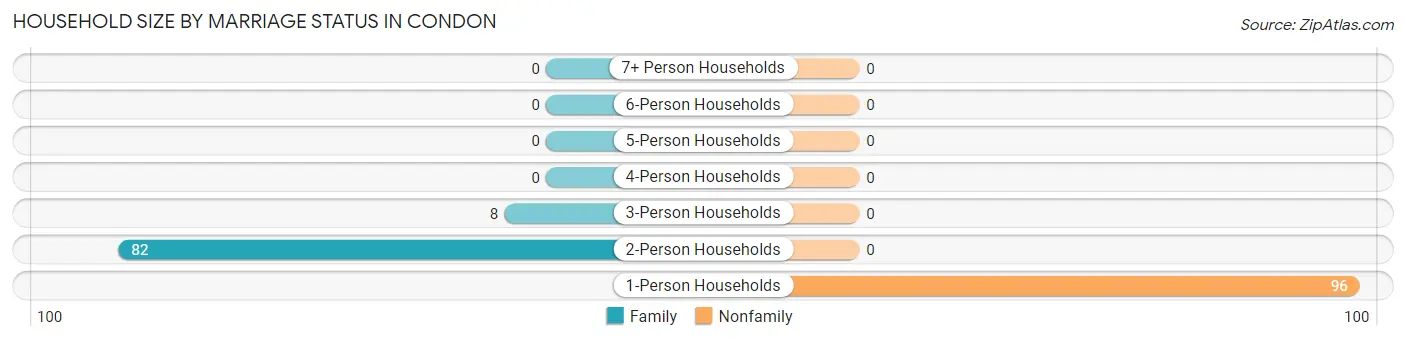
| Household Size | Family Households | Nonfamily Households |
| 1-Person Households | - | 96 (51.6%) |
| 2-Person Households | 82 (44.1%) | 0 (0.0%) |
| 3-Person Households | 8 (4.3%) | 0 (0.0%) |
| 4-Person Households | 0 (0.0%) | 0 (0.0%) |
| 5-Person Households | 0 (0.0%) | 0 (0.0%) |
| 6-Person Households | 0 (0.0%) | 0 (0.0%) |
| 7+ Person Households | 0 (0.0%) | 0 (0.0%) |
| Total | 90 (48.4%) | 96 (51.6%) |
Female Fertility in Condon
Fertility by Age in Condon
| Age Bracket | Women with Births | Births / 1,000 Women |
| 15 to 19 years | 0 (0.0%) | 0.0 |
| 20 to 34 years | 0 (0.0%) | 0.0 |
| 35 to 50 years | 0 (0.0%) | 0.0 |
| Total | 0 (0.0%) | 0.0 |
Fertility by Age by Marriage Status in Condon
| Age Bracket | Married | Unmarried |
| 15 to 19 years | 0 (0.0%) | 0 (0.0%) |
| 20 to 34 years | 0 (0.0%) | 0 (0.0%) |
| 35 to 50 years | 0 (0.0%) | 0 (0.0%) |
| Total | 0 (0.0%) | 0 (0.0%) |
Fertility by Education in Condon
| Educational Attainment | Women with Births | Births / 1,000 Women |
| Less than High School | 0 (0.0%) | 0.0 |
| High School Diploma | 0 (0.0%) | 0.0 |
| College or Associate's Degree | 0 (0.0%) | 0.0 |
| Bachelor's Degree | 0 (0.0%) | 0.0 |
| Graduate Degree | 0 (0.0%) | 0.0 |
| Total | 0 (0.0%) | 0.0 |
Fertility by Education by Marriage Status in Condon
| Educational Attainment | Married | Unmarried |
| Less than High School | 0 (0.0%) | 0 (0.0%) |
| High School Diploma | 0 (0.0%) | 0 (0.0%) |
| College or Associate's Degree | 0 (0.0%) | 0 (0.0%) |
| Bachelor's Degree | 0 (0.0%) | 0 (0.0%) |
| Graduate Degree | 0 (0.0%) | 0 (0.0%) |
| Total | 0 (0.0%) | 0 (0.0%) |
Employment Characteristics in Condon
Employment by Class of Employer in Condon
Among the 70 employed individuals in Condon, private company employees (35 | 50.0%), self-employed (not incorporated) (29 | 41.4%), and local government employees (5 | 7.1%) make up the most common classes of employment.
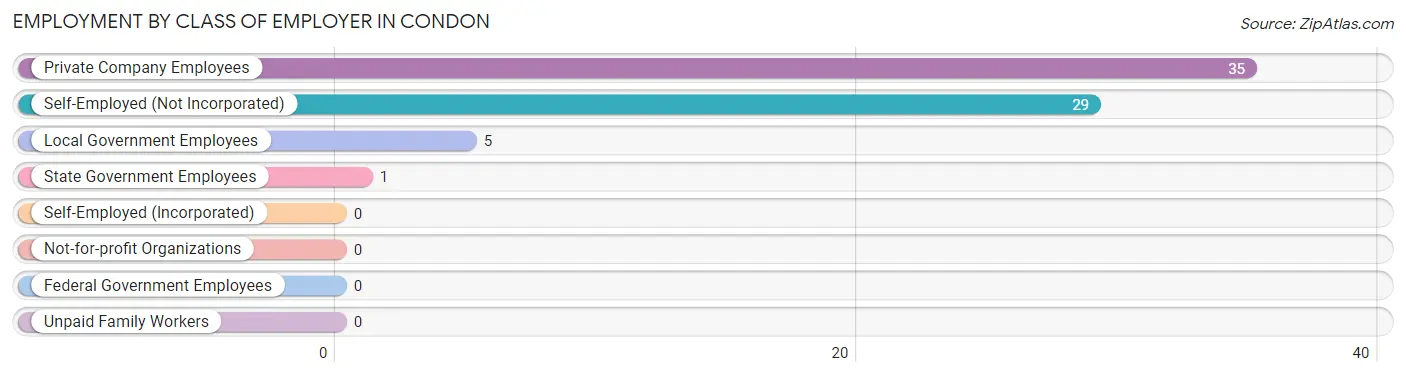
| Employer Class | # Employees | % Employees |
| Private Company Employees | 35 | 50.0% |
| Self-Employed (Incorporated) | 0 | 0.0% |
| Self-Employed (Not Incorporated) | 29 | 41.4% |
| Not-for-profit Organizations | 0 | 0.0% |
| Local Government Employees | 5 | 7.1% |
| State Government Employees | 1 | 1.4% |
| Federal Government Employees | 0 | 0.0% |
| Unpaid Family Workers | 0 | 0.0% |
| Total | 70 | 100.0% |
Employment Status by Age in Condon
According to the labor force statistics for Condon, out of the total population over 16 years of age (298), 30.5% or 91 individuals are in the labor force, with 3.3% or 3 of them unemployed. The age group with the highest labor force participation rate is 35 to 44 years, with 100.0% or 7 individuals in the labor force. Within the labor force, the 55 to 59 years age range has the highest percentage of unemployed individuals, with 9.1% or 3 of them being unemployed.
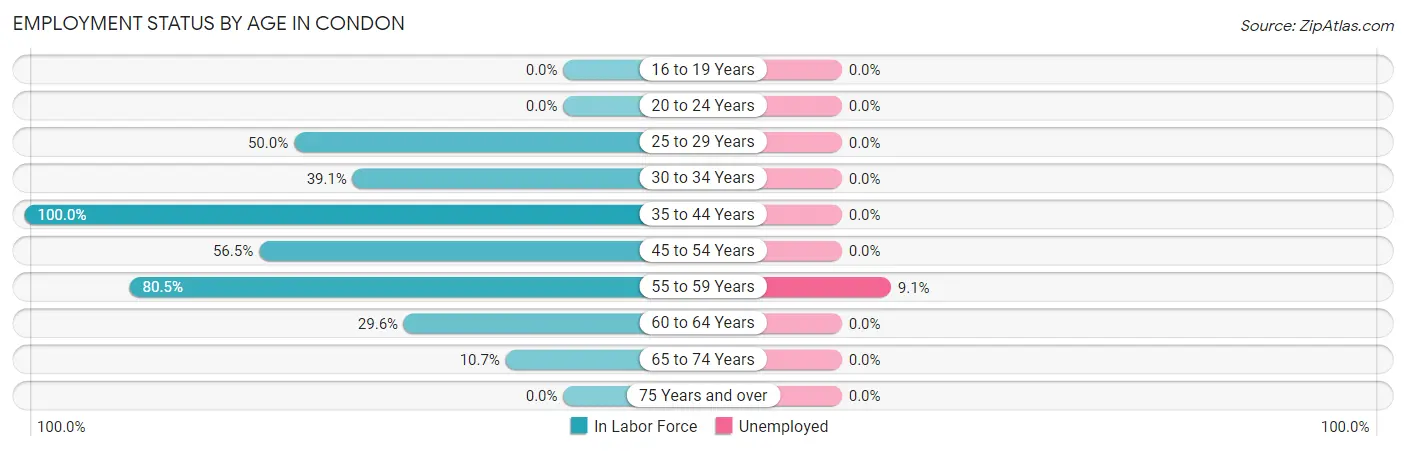
| Age Bracket | In Labor Force | Unemployed |
| 16 to 19 Years | 0 (0.0%) | 0 (0.0%) |
| 20 to 24 Years | 0 (0.0%) | 0 (0.0%) |
| 25 to 29 Years | 2 (50.0%) | 0 (0.0%) |
| 30 to 34 Years | 9 (39.1%) | 0 (0.0%) |
| 35 to 44 Years | 7 (100.0%) | 0 (0.0%) |
| 45 to 54 Years | 13 (56.5%) | 0 (0.0%) |
| 55 to 59 Years | 33 (80.5%) | 3 (9.1%) |
| 60 to 64 Years | 16 (29.6%) | 0 (0.0%) |
| 65 to 74 Years | 11 (10.7%) | 0 (0.0%) |
| 75 Years and over | 0 (0.0%) | 0 (0.0%) |
| Total | 91 (30.5%) | 3 (3.3%) |
Employment Status by Educational Attainment in Condon
According to labor force statistics for Condon, 52.6% of individuals (80) out of the total population between 25 and 64 years of age (152) are in the labor force, with 3.8% or 3 of them being unemployed. The group with the highest labor force participation rate are those with the educational attainment of high school diploma, with 71.1% or 54 individuals in the labor force. Within the labor force, individuals with high school diploma education have the highest percentage of unemployment, with 5.6% or 3 of them being unemployed.
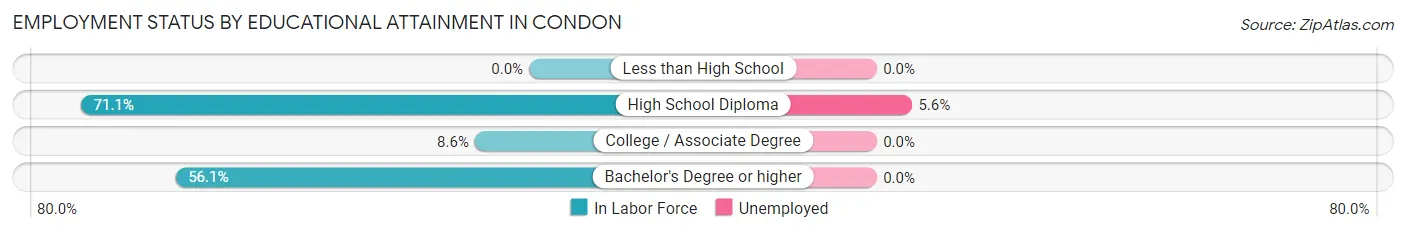
| Educational Attainment | In Labor Force | Unemployed |
| Less than High School | 0 (0.0%) | 0 (0.0%) |
| High School Diploma | 54 (71.1%) | 4 (5.6%) |
| College / Associate Degree | 3 (8.6%) | 0 (0.0%) |
| Bachelor's Degree or higher | 23 (56.1%) | 0 (0.0%) |
| Total | 80 (52.6%) | 6 (3.8%) |
Employment Occupations by Sex in Condon
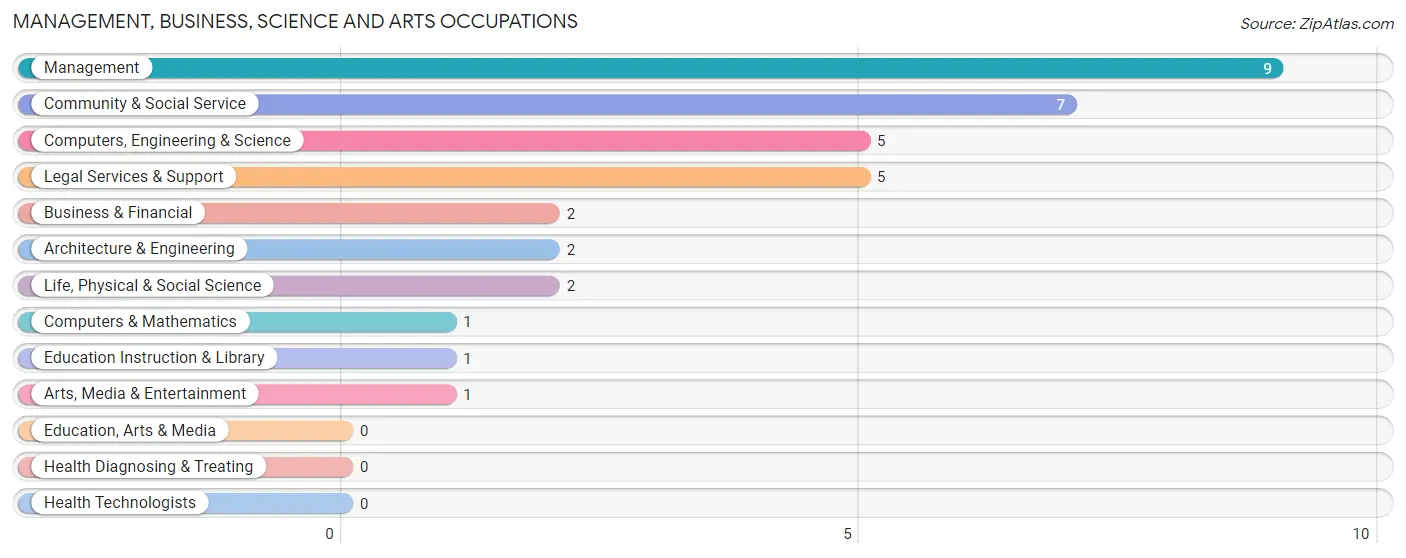
Management, Business, Science and Arts Occupations
The most common Management, Business, Science and Arts occupations in Condon are Management (9 | 10.2%), Community & Social Service (7 | 8.0%), Computers, Engineering & Science (5 | 5.7%), Legal Services & Support (5 | 5.7%), and Business & Financial (2 | 2.3%).
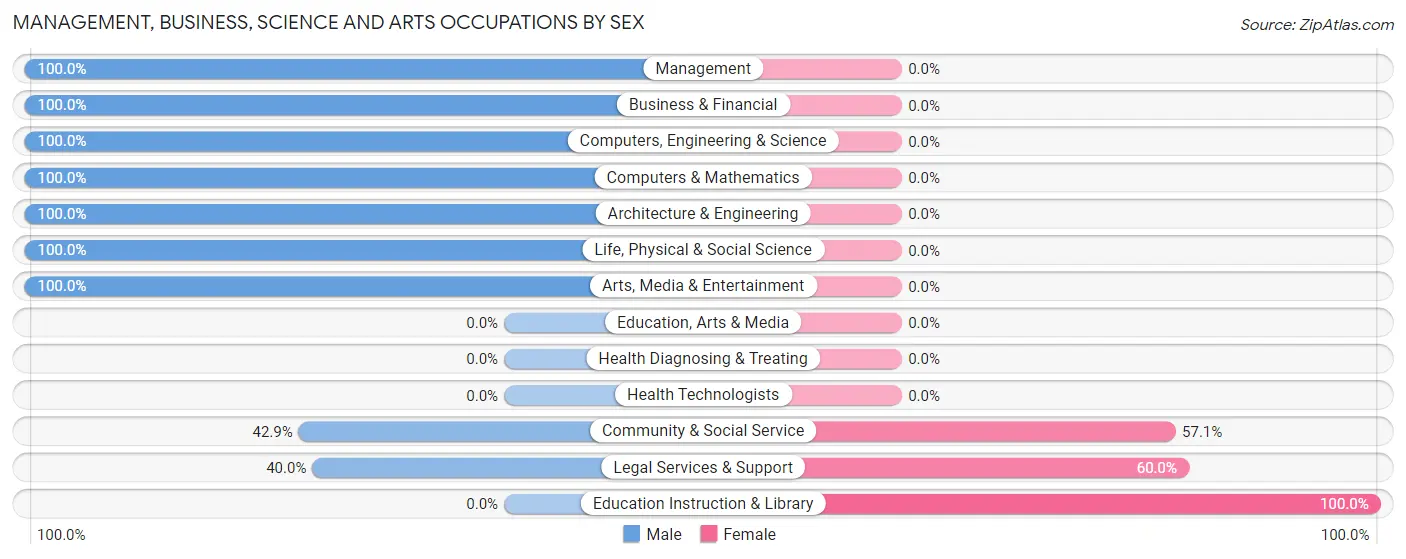
Management, Business, Science and Arts Occupations by Sex
Within the Management, Business, Science and Arts occupations in Condon, the most male-oriented occupations are Management (100.0%), Business & Financial (100.0%), and Computers, Engineering & Science (100.0%), while the most female-oriented occupations are Education Instruction & Library (100.0%), Legal Services & Support (60.0%), and Community & Social Service (57.1%).
| Occupation | Male | Female |
| Management | 9 (100.0%) | 0 (0.0%) |
| Business & Financial | 2 (100.0%) | 0 (0.0%) |
| Computers, Engineering & Science | 5 (100.0%) | 0 (0.0%) |
| Computers & Mathematics | 1 (100.0%) | 0 (0.0%) |
| Architecture & Engineering | 2 (100.0%) | 0 (0.0%) |
| Life, Physical & Social Science | 2 (100.0%) | 0 (0.0%) |
| Community & Social Service | 3 (42.9%) | 4 (57.1%) |
| Education, Arts & Media | 0 (0.0%) | 0 (0.0%) |
| Legal Services & Support | 2 (40.0%) | 3 (60.0%) |
| Education Instruction & Library | 0 (0.0%) | 1 (100.0%) |
| Arts, Media & Entertainment | 1 (100.0%) | 0 (0.0%) |
| Health Diagnosing & Treating | 0 (0.0%) | 0 (0.0%) |
| Health Technologists | 0 (0.0%) | 0 (0.0%) |
| Total (Category) | 19 (82.6%) | 4 (17.4%) |
| Total (Overall) | 60 (68.2%) | 28 (31.8%) |
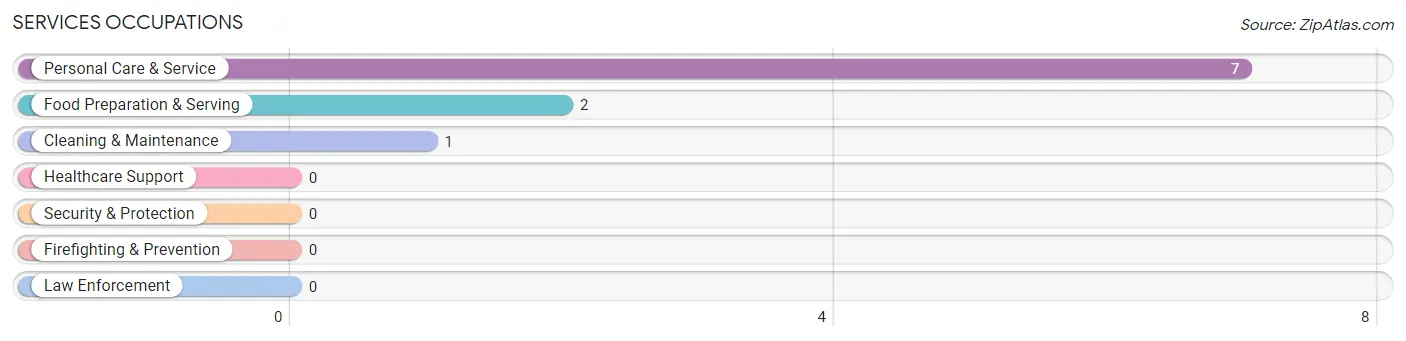
Services Occupations
The most common Services occupations in Condon are Personal Care & Service (7 | 8.0%), Food Preparation & Serving (2 | 2.3%), and Cleaning & Maintenance (1 | 1.1%).
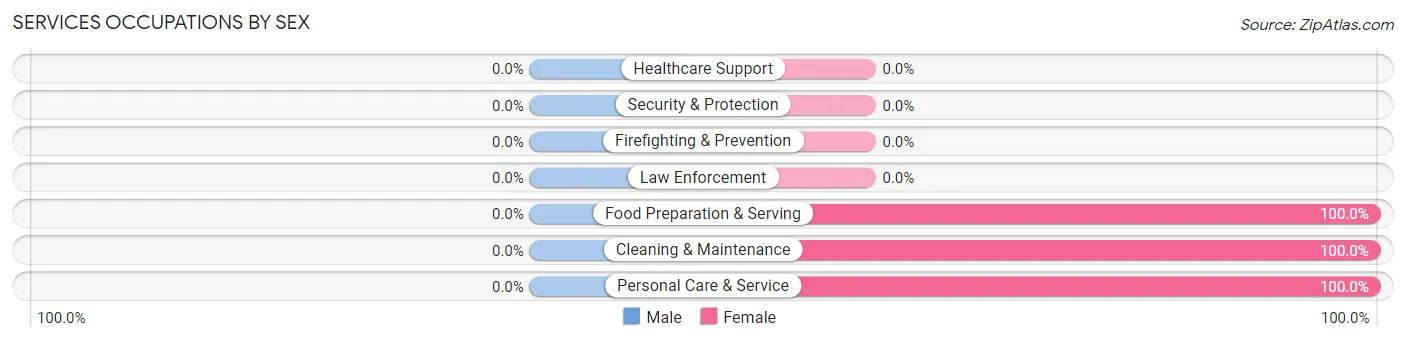
Services Occupations by Sex
| Occupation | Male | Female |
| Healthcare Support | 0 (0.0%) | 0 (0.0%) |
| Security & Protection | 0 (0.0%) | 0 (0.0%) |
| Firefighting & Prevention | 0 (0.0%) | 0 (0.0%) |
| Law Enforcement | 0 (0.0%) | 0 (0.0%) |
| Food Preparation & Serving | 0 (0.0%) | 2 (100.0%) |
| Cleaning & Maintenance | 0 (0.0%) | 1 (100.0%) |
| Personal Care & Service | 0 (0.0%) | 7 (100.0%) |
| Total (Category) | 0 (0.0%) | 10 (100.0%) |
| Total (Overall) | 60 (68.2%) | 28 (31.8%) |
Sales and Office Occupations
The most common Sales and Office occupations in Condon are Sales & Related (5 | 5.7%), and Office & Administration (2 | 2.3%).
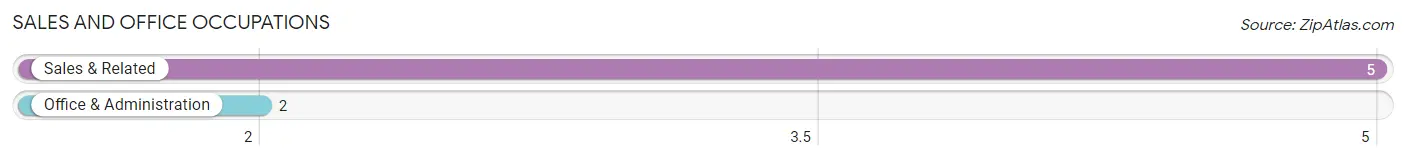
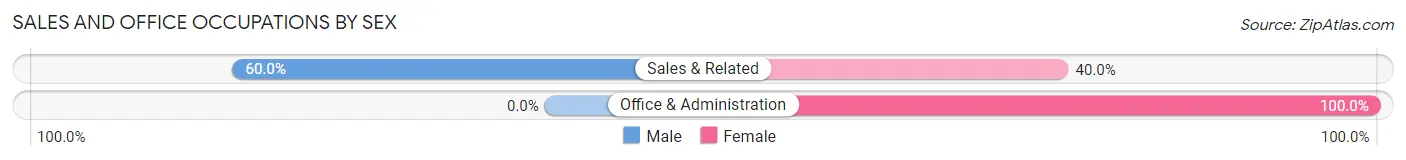
Sales and Office Occupations by Sex
| Occupation | Male | Female |
| Sales & Related | 3 (60.0%) | 2 (40.0%) |
| Office & Administration | 0 (0.0%) | 2 (100.0%) |
| Total (Category) | 3 (42.9%) | 4 (57.1%) |
| Total (Overall) | 60 (68.2%) | 28 (31.8%) |
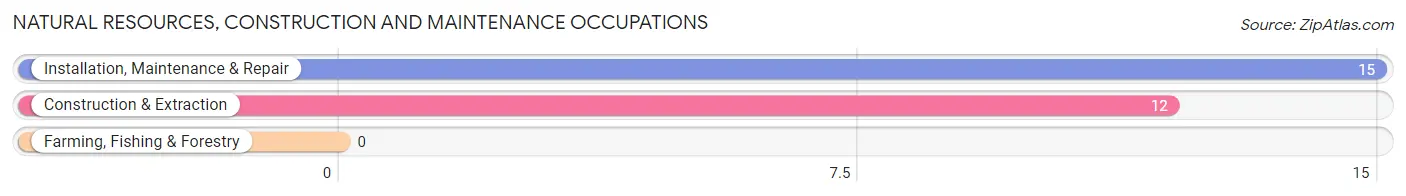
Natural Resources, Construction and Maintenance Occupations
The most common Natural Resources, Construction and Maintenance occupations in Condon are Installation, Maintenance & Repair (15 | 17.1%), and Construction & Extraction (12 | 13.6%).
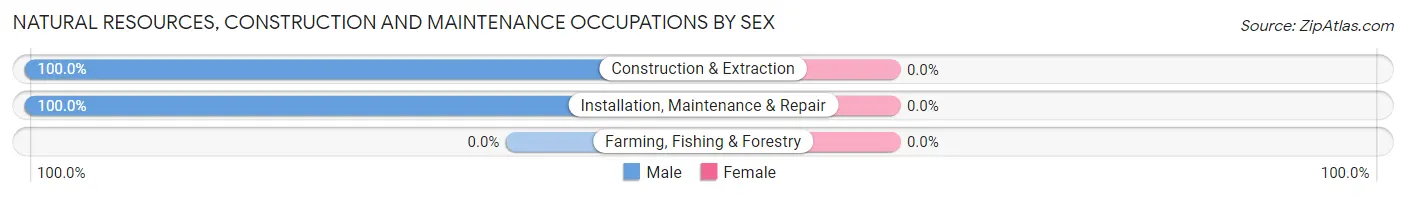
Natural Resources, Construction and Maintenance Occupations by Sex
| Occupation | Male | Female |
| Farming, Fishing & Forestry | 0 (0.0%) | 0 (0.0%) |
| Construction & Extraction | 12 (100.0%) | 0 (0.0%) |
| Installation, Maintenance & Repair | 15 (100.0%) | 0 (0.0%) |
| Total (Category) | 27 (100.0%) | 0 (0.0%) |
| Total (Overall) | 60 (68.2%) | 28 (31.8%) |
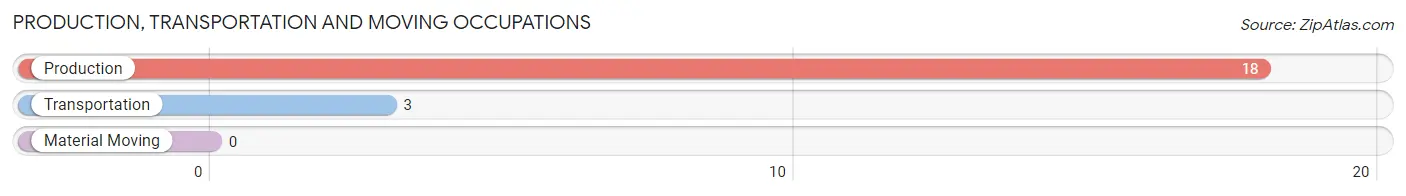
Production, Transportation and Moving Occupations
The most common Production, Transportation and Moving occupations in Condon are Production (18 | 20.4%), and Transportation (3 | 3.4%).
Production, Transportation and Moving Occupations by Sex
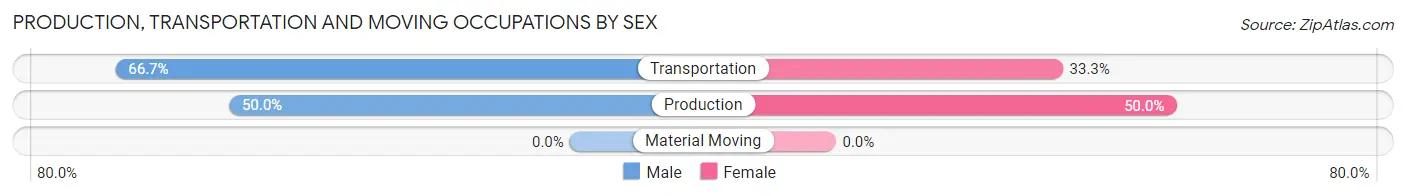
| Occupation | Male | Female |
| Production | 9 (50.0%) | 9 (50.0%) |
| Transportation | 2 (66.7%) | 1 (33.3%) |
| Material Moving | 0 (0.0%) | 0 (0.0%) |
| Total (Category) | 11 (52.4%) | 10 (47.6%) |
| Total (Overall) | 60 (68.2%) | 28 (31.8%) |
Employment Industries by Sex in Condon
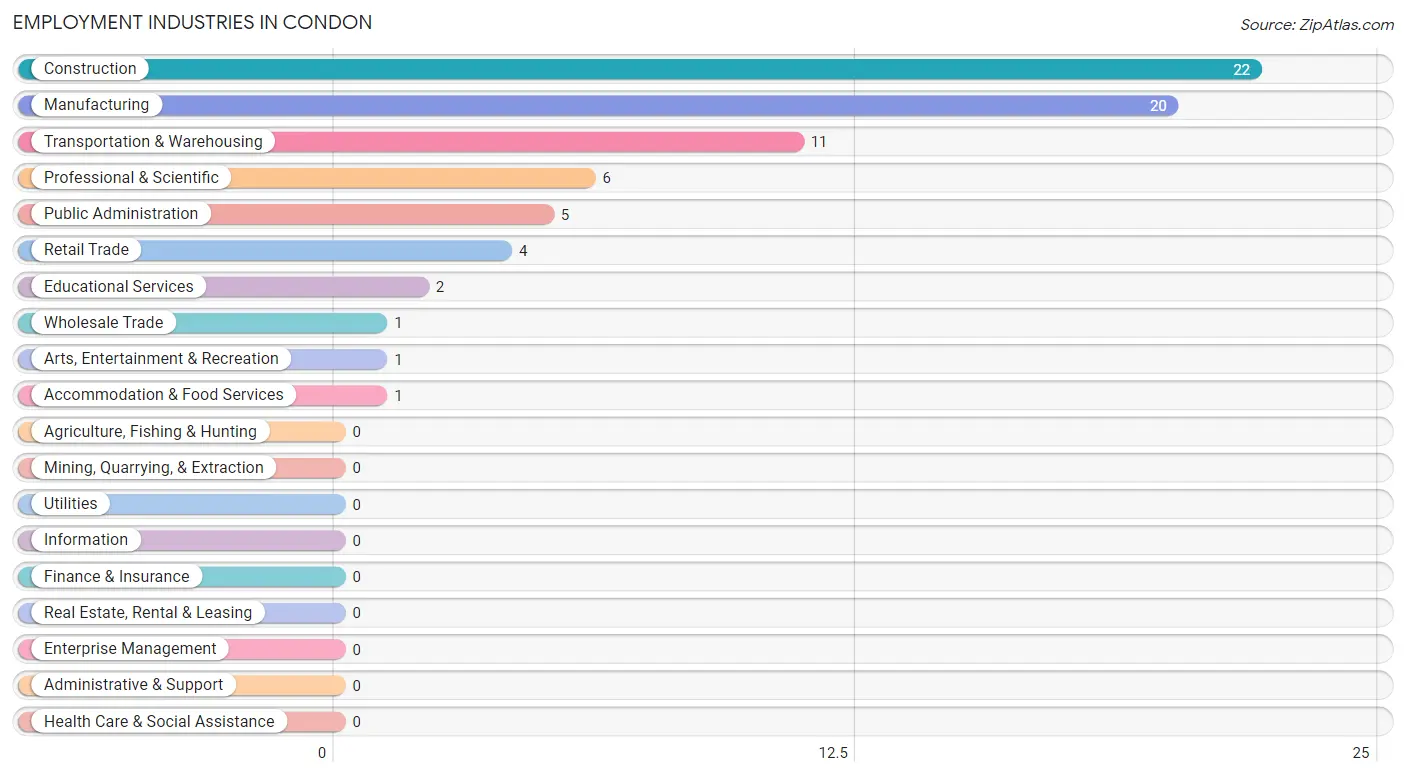
Employment Industries in Condon
The major employment industries in Condon include Construction (22 | 25.0%), Manufacturing (20 | 22.7%), Transportation & Warehousing (11 | 12.5%), Professional & Scientific (6 | 6.8%), and Public Administration (5 | 5.7%).
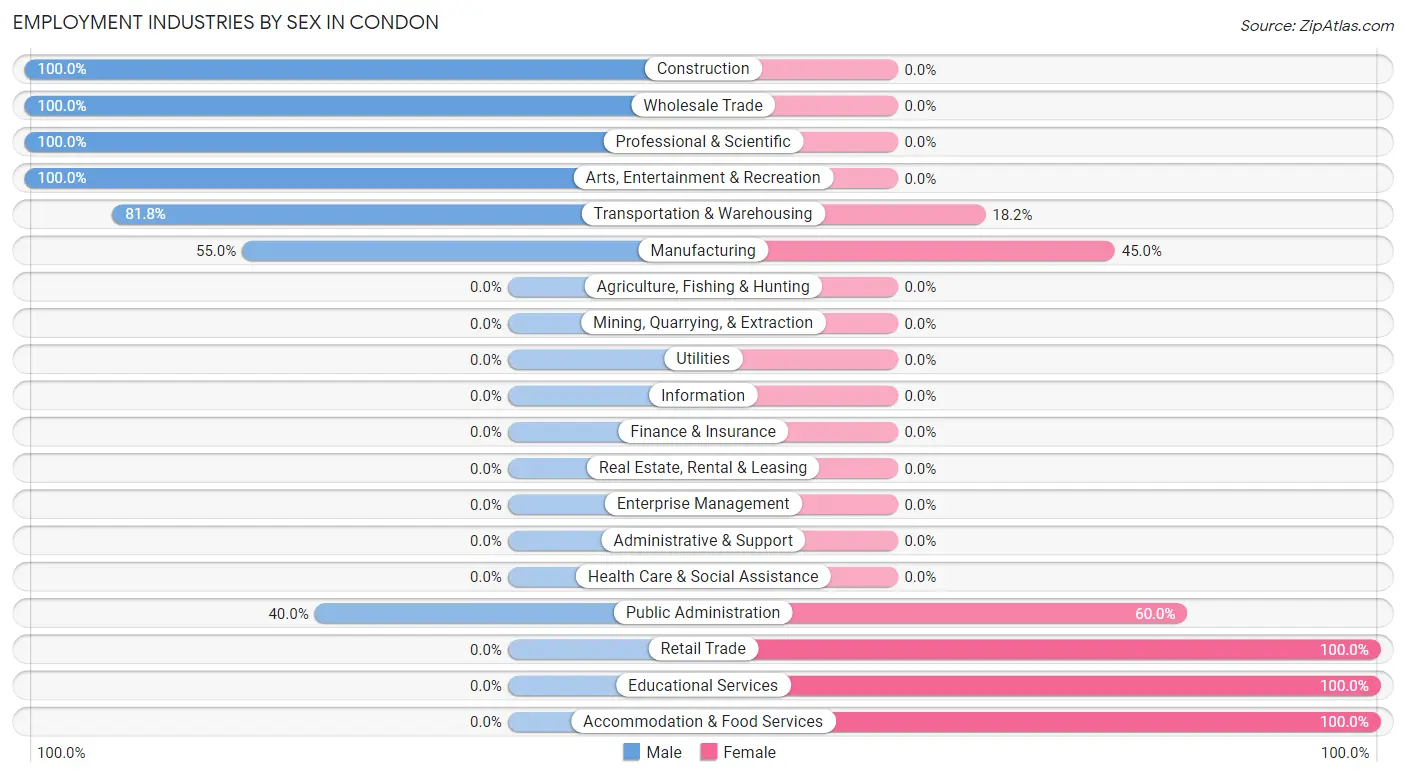
Employment Industries by Sex in Condon
The Condon industries that see more men than women are Construction (100.0%), Wholesale Trade (100.0%), and Professional & Scientific (100.0%), whereas the industries that tend to have a higher number of women are Retail Trade (100.0%), Educational Services (100.0%), and Accommodation & Food Services (100.0%).
| Industry | Male | Female |
| Agriculture, Fishing & Hunting | 0 (0.0%) | 0 (0.0%) |
| Mining, Quarrying, & Extraction | 0 (0.0%) | 0 (0.0%) |
| Construction | 22 (100.0%) | 0 (0.0%) |
| Manufacturing | 11 (55.0%) | 9 (45.0%) |
| Wholesale Trade | 1 (100.0%) | 0 (0.0%) |
| Retail Trade | 0 (0.0%) | 4 (100.0%) |
| Transportation & Warehousing | 9 (81.8%) | 2 (18.2%) |
| Utilities | 0 (0.0%) | 0 (0.0%) |
| Information | 0 (0.0%) | 0 (0.0%) |
| Finance & Insurance | 0 (0.0%) | 0 (0.0%) |
| Real Estate, Rental & Leasing | 0 (0.0%) | 0 (0.0%) |
| Professional & Scientific | 6 (100.0%) | 0 (0.0%) |
| Enterprise Management | 0 (0.0%) | 0 (0.0%) |
| Administrative & Support | 0 (0.0%) | 0 (0.0%) |
| Educational Services | 0 (0.0%) | 2 (100.0%) |
| Health Care & Social Assistance | 0 (0.0%) | 0 (0.0%) |
| Arts, Entertainment & Recreation | 1 (100.0%) | 0 (0.0%) |
| Accommodation & Food Services | 0 (0.0%) | 1 (100.0%) |
| Public Administration | 2 (40.0%) | 3 (60.0%) |
| Total | 60 (68.2%) | 28 (31.8%) |
Education in Condon
School Enrollment in Condon
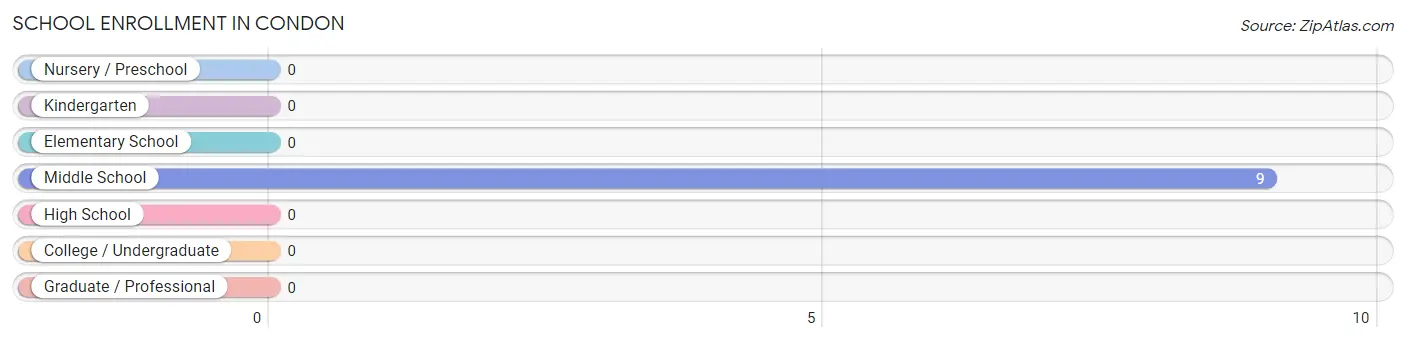
| School Level | # Students | % Students |
| Nursery / Preschool | 0 | 0.0% |
| Kindergarten | 0 | 0.0% |
| Elementary School | 0 | 0.0% |
| Middle School | 9 | 100.0% |
| High School | 0 | 0.0% |
| College / Undergraduate | 0 | 0.0% |
| Graduate / Professional | 0 | 0.0% |
| Total | 9 | 100.0% |
School Enrollment by Age by Funding Source in Condon
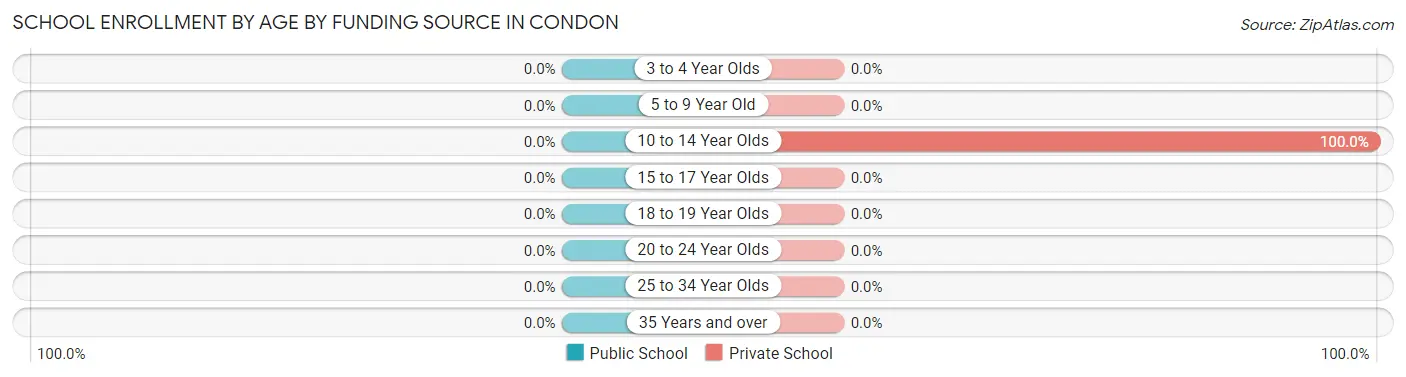
| Age Bracket | Public School | Private School |
| 3 to 4 Year Olds | 0 (0.0%) | 0 (0.0%) |
| 5 to 9 Year Old | 0 (0.0%) | 0 (0.0%) |
| 10 to 14 Year Olds | 0 (0.0%) | 9 (100.0%) |
| 15 to 17 Year Olds | 0 (0.0%) | 0 (0.0%) |
| 18 to 19 Year Olds | 0 (0.0%) | 0 (0.0%) |
| 20 to 24 Year Olds | 0 (0.0%) | 0 (0.0%) |
| 25 to 34 Year Olds | 0 (0.0%) | 0 (0.0%) |
| 35 Years and over | 0 (0.0%) | 0 (0.0%) |
| Total | 0 (0.0%) | 9 (100.0%) |
Educational Attainment by Field of Study in Condon
Business (15 | 17.2%), communications (13 | 14.9%), education (12 | 13.8%), bio, nature & agricultural (10 | 11.5%), and psychology (8 | 9.2%) are the most common fields of study among 87 individuals in Condon who have obtained a bachelor's degree or higher.
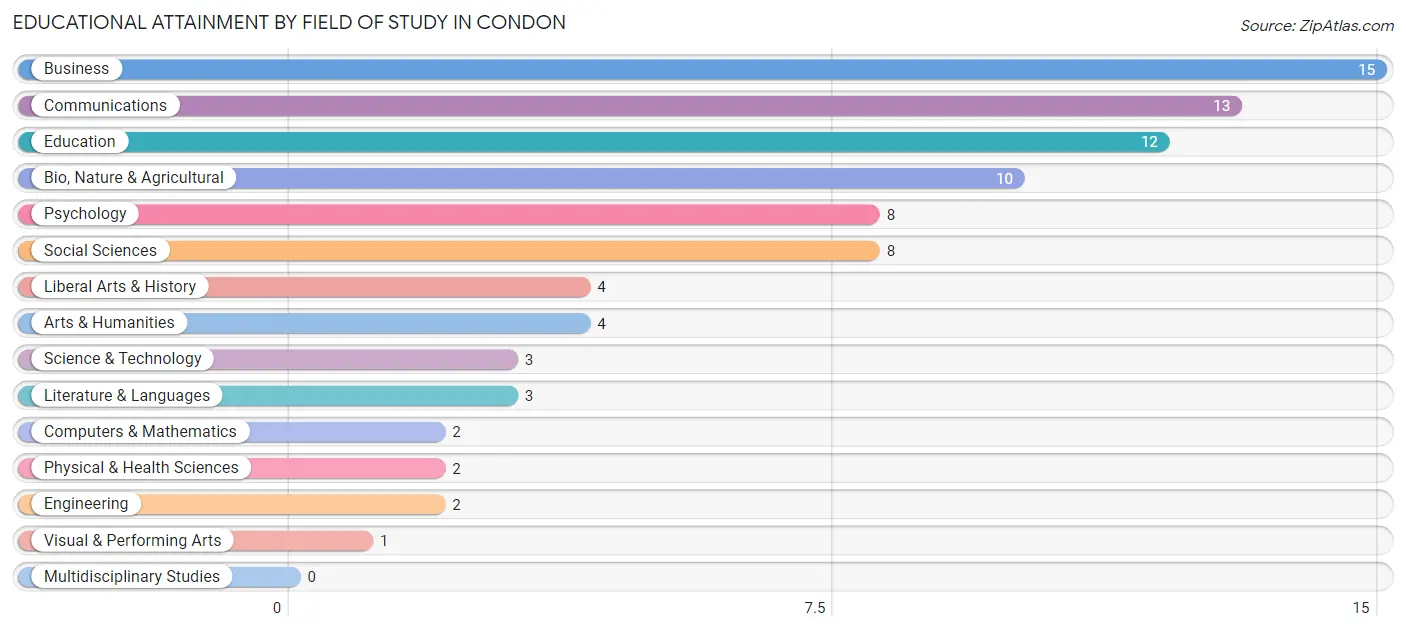
| Field of Study | # Graduates | % Graduates |
| Computers & Mathematics | 2 | 2.3% |
| Bio, Nature & Agricultural | 10 | 11.5% |
| Physical & Health Sciences | 2 | 2.3% |
| Psychology | 8 | 9.2% |
| Social Sciences | 8 | 9.2% |
| Engineering | 2 | 2.3% |
| Multidisciplinary Studies | 0 | 0.0% |
| Science & Technology | 3 | 3.5% |
| Business | 15 | 17.2% |
| Education | 12 | 13.8% |
| Literature & Languages | 3 | 3.5% |
| Liberal Arts & History | 4 | 4.6% |
| Visual & Performing Arts | 1 | 1.1% |
| Communications | 13 | 14.9% |
| Arts & Humanities | 4 | 4.6% |
| Total | 87 | 100.0% |
Transportation & Commute in Condon
Vehicle Availability by Sex in Condon
The most prevalent vehicle ownership categories in Condon are males with 2 vehicles (22, accounting for 51.2%) and females with 2 vehicles (14, making up 81.5%).
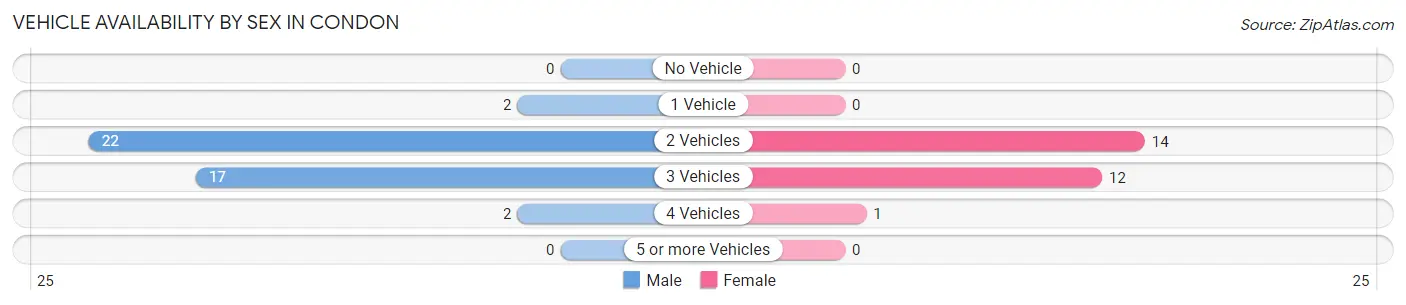
| Vehicles Available | Male | Female |
| No Vehicle | 0 (0.0%) | 0 (0.0%) |
| 1 Vehicle | 2 (4.6%) | 0 (0.0%) |
| 2 Vehicles | 22 (51.2%) | 14 (51.8%) |
| 3 Vehicles | 17 (39.5%) | 12 (44.4%) |
| 4 Vehicles | 2 (4.6%) | 1 (3.7%) |
| 5 or more Vehicles | 0 (0.0%) | 0 (0.0%) |
| Total | 43 (100.0%) | 27 (100.0%) |
Commute Time in Condon
The most frequently occuring commute durations in Condon are 15 to 19 minutes (38 commuters, 64.4%), 5 to 9 minutes (5 commuters, 8.5%), and 30 to 34 minutes (4 commuters, 6.8%).
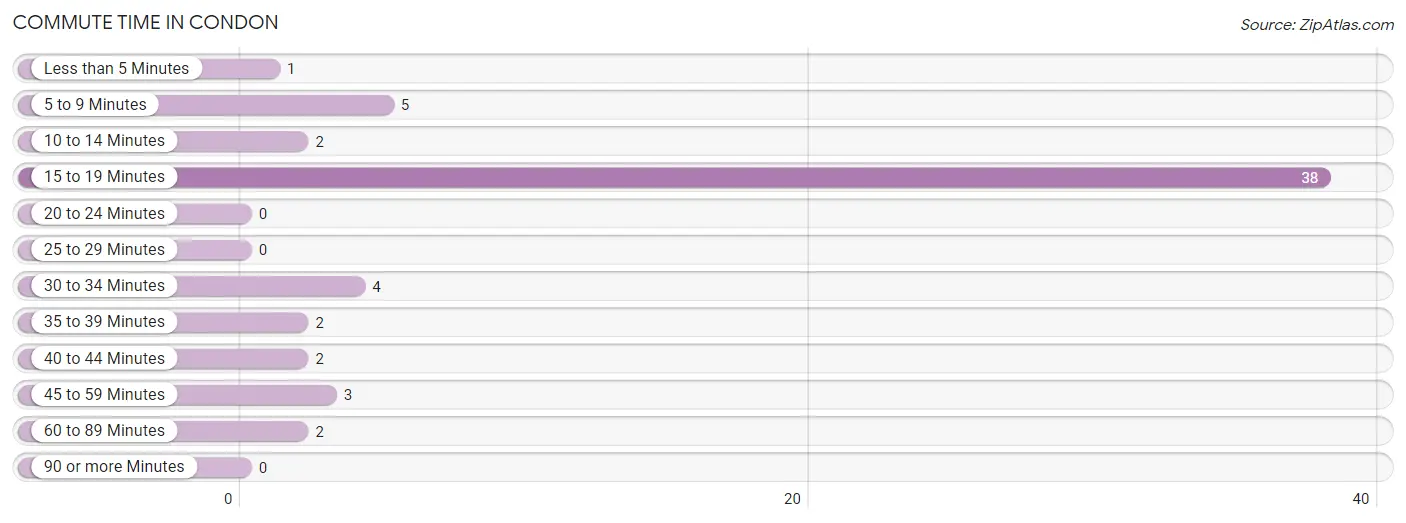
| Commute Time | # Commuters | % Commuters |
| Less than 5 Minutes | 1 | 1.7% |
| 5 to 9 Minutes | 5 | 8.5% |
| 10 to 14 Minutes | 2 | 3.4% |
| 15 to 19 Minutes | 38 | 64.4% |
| 20 to 24 Minutes | 0 | 0.0% |
| 25 to 29 Minutes | 0 | 0.0% |
| 30 to 34 Minutes | 4 | 6.8% |
| 35 to 39 Minutes | 2 | 3.4% |
| 40 to 44 Minutes | 2 | 3.4% |
| 45 to 59 Minutes | 3 | 5.1% |
| 60 to 89 Minutes | 2 | 3.4% |
| 90 or more Minutes | 0 | 0.0% |
Commute Time by Sex in Condon
The most common commute times in Condon are 15 to 19 minutes (20 commuters, 60.6%) for males and 15 to 19 minutes (18 commuters, 69.2%) for females.
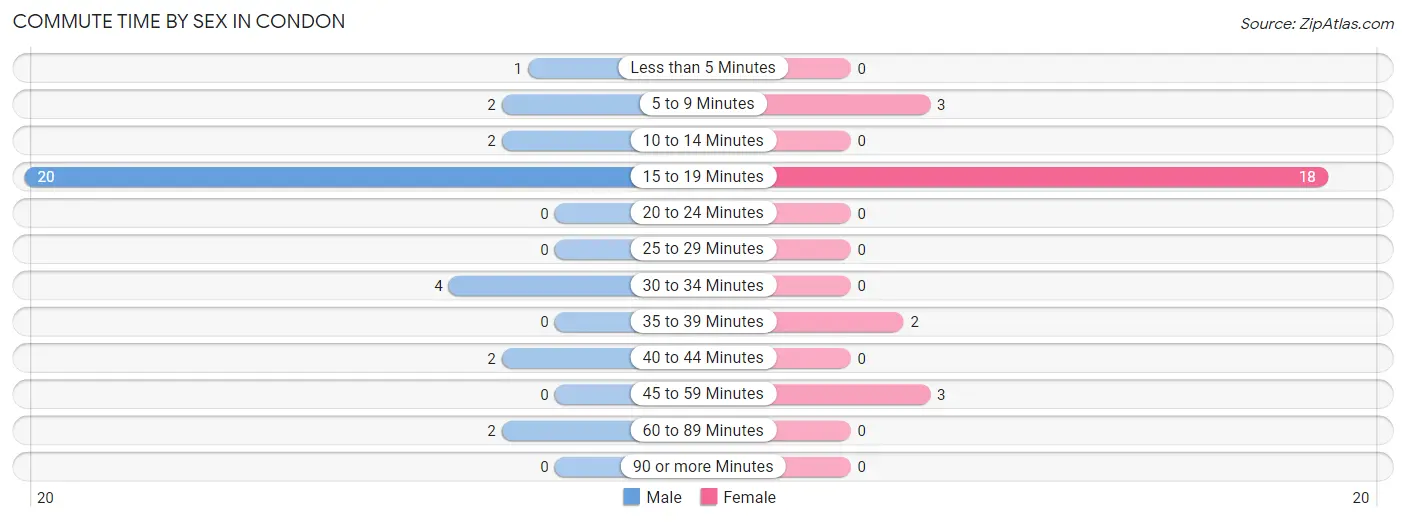
| Commute Time | Male | Female |
| Less than 5 Minutes | 1 (3.0%) | 0 (0.0%) |
| 5 to 9 Minutes | 2 (6.1%) | 3 (11.5%) |
| 10 to 14 Minutes | 2 (6.1%) | 0 (0.0%) |
| 15 to 19 Minutes | 20 (60.6%) | 18 (69.2%) |
| 20 to 24 Minutes | 0 (0.0%) | 0 (0.0%) |
| 25 to 29 Minutes | 0 (0.0%) | 0 (0.0%) |
| 30 to 34 Minutes | 4 (12.1%) | 0 (0.0%) |
| 35 to 39 Minutes | 0 (0.0%) | 2 (7.7%) |
| 40 to 44 Minutes | 2 (6.1%) | 0 (0.0%) |
| 45 to 59 Minutes | 0 (0.0%) | 3 (11.5%) |
| 60 to 89 Minutes | 2 (6.1%) | 0 (0.0%) |
| 90 or more Minutes | 0 (0.0%) | 0 (0.0%) |
Time of Departure to Work by Sex in Condon
The most frequent times of departure to work in Condon are 8:00 AM to 8:29 AM (16, 48.5%) for males and 10:00 AM to 10:59 AM (13, 50.0%) for females.
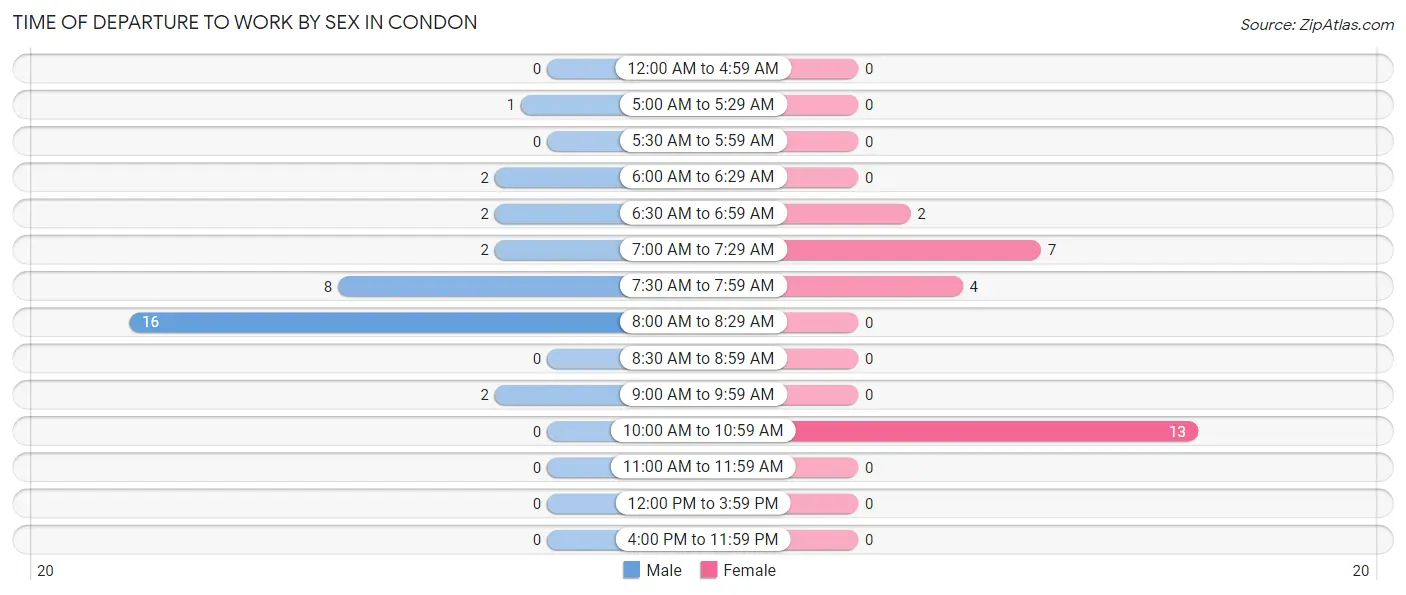
| Time of Departure | Male | Female |
| 12:00 AM to 4:59 AM | 0 (0.0%) | 0 (0.0%) |
| 5:00 AM to 5:29 AM | 1 (3.0%) | 0 (0.0%) |
| 5:30 AM to 5:59 AM | 0 (0.0%) | 0 (0.0%) |
| 6:00 AM to 6:29 AM | 2 (6.1%) | 0 (0.0%) |
| 6:30 AM to 6:59 AM | 2 (6.1%) | 2 (7.7%) |
| 7:00 AM to 7:29 AM | 2 (6.1%) | 7 (26.9%) |
| 7:30 AM to 7:59 AM | 8 (24.2%) | 4 (15.4%) |
| 8:00 AM to 8:29 AM | 16 (48.5%) | 0 (0.0%) |
| 8:30 AM to 8:59 AM | 0 (0.0%) | 0 (0.0%) |
| 9:00 AM to 9:59 AM | 2 (6.1%) | 0 (0.0%) |
| 10:00 AM to 10:59 AM | 0 (0.0%) | 13 (50.0%) |
| 11:00 AM to 11:59 AM | 0 (0.0%) | 0 (0.0%) |
| 12:00 PM to 3:59 PM | 0 (0.0%) | 0 (0.0%) |
| 4:00 PM to 11:59 PM | 0 (0.0%) | 0 (0.0%) |
| Total | 33 (100.0%) | 26 (100.0%) |
Housing Occupancy in Condon
Occupancy by Ownership in Condon
Of the total 186 dwellings in Condon, owner-occupied units account for 170 (91.4%), while renter-occupied units make up 16 (8.6%).
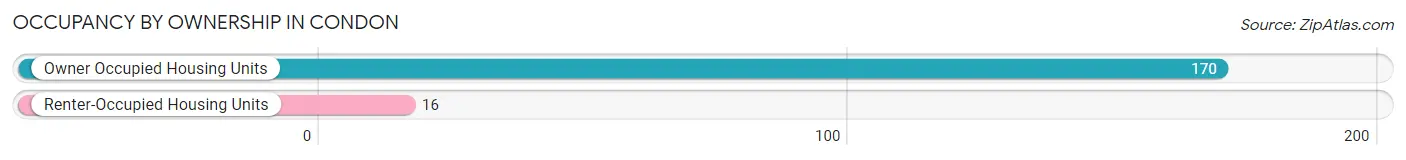
| Occupancy | # Housing Units | % Housing Units |
| Owner Occupied Housing Units | 170 | 91.4% |
| Renter-Occupied Housing Units | 16 | 8.6% |
| Total Occupied Housing Units | 186 | 100.0% |
Occupancy by Household Size in Condon
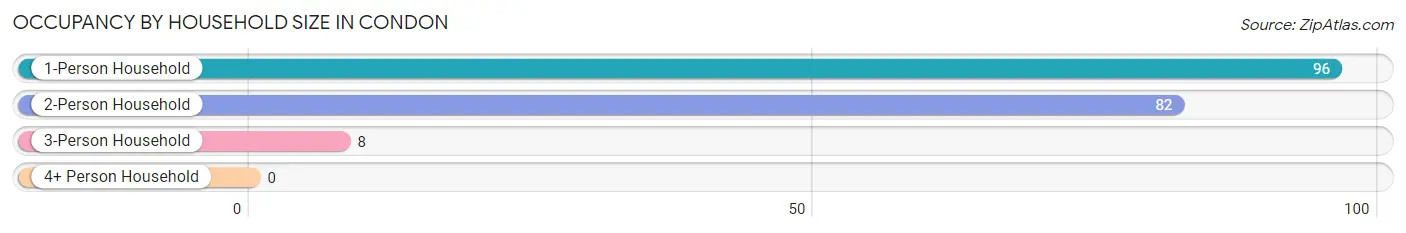
| Household Size | # Housing Units | % Housing Units |
| 1-Person Household | 96 | 51.6% |
| 2-Person Household | 82 | 44.1% |
| 3-Person Household | 8 | 4.3% |
| 4+ Person Household | 0 | 0.0% |
| Total Housing Units | 186 | 100.0% |
Occupancy by Ownership by Household Size in Condon
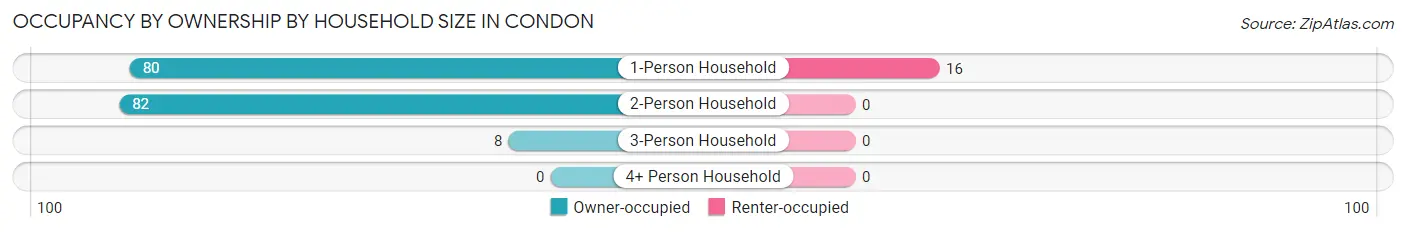
| Household Size | Owner-occupied | Renter-occupied |
| 1-Person Household | 80 (83.3%) | 16 (16.7%) |
| 2-Person Household | 82 (100.0%) | 0 (0.0%) |
| 3-Person Household | 8 (100.0%) | 0 (0.0%) |
| 4+ Person Household | 0 (0.0%) | 0 (0.0%) |
| Total Housing Units | 170 (91.4%) | 16 (8.6%) |
Occupancy by Educational Attainment in Condon
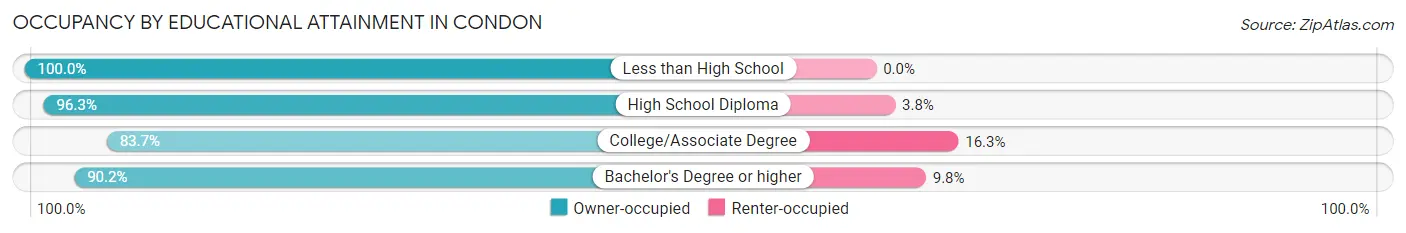
| Household Size | Owner-occupied | Renter-occupied |
| Less than High School | 2 (100.0%) | 0 (0.0%) |
| High School Diploma | 77 (96.3%) | 3 (3.7%) |
| College/Associate Degree | 36 (83.7%) | 7 (16.3%) |
| Bachelor's Degree or higher | 55 (90.2%) | 6 (9.8%) |
Occupancy by Age of Householder in Condon
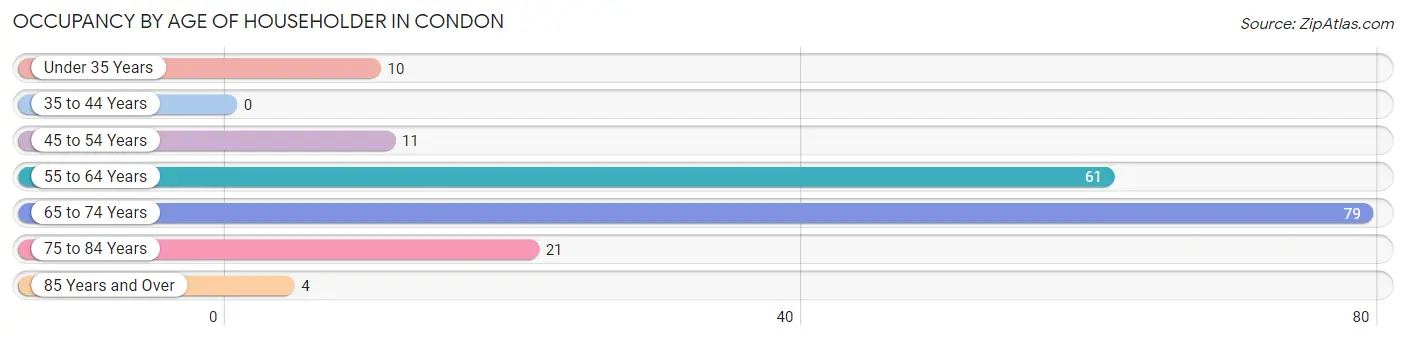
| Age Bracket | # Households | % Households |
| Under 35 Years | 10 | 5.4% |
| 35 to 44 Years | 0 | 0.0% |
| 45 to 54 Years | 11 | 5.9% |
| 55 to 64 Years | 61 | 32.8% |
| 65 to 74 Years | 79 | 42.5% |
| 75 to 84 Years | 21 | 11.3% |
| 85 Years and Over | 4 | 2.1% |
| Total | 186 | 100.0% |
Housing Finances in Condon
Median Income by Occupancy in Condon
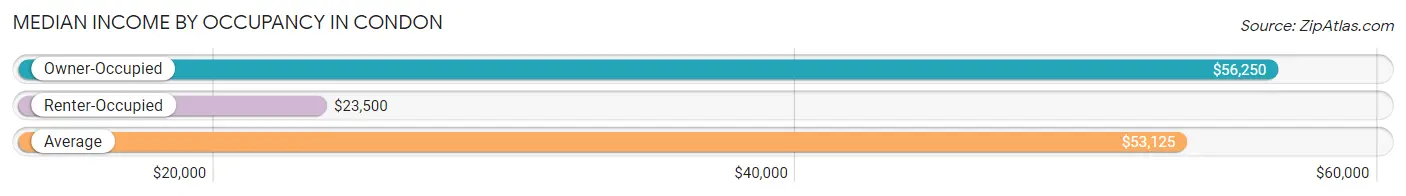
| Occupancy Type | # Households | Median Income |
| Owner-Occupied | 170 (91.4%) | $56,250 |
| Renter-Occupied | 16 (8.6%) | $23,500 |
| Average | 186 (100.0%) | $53,125 |
Occupancy by Householder Income Bracket in Condon
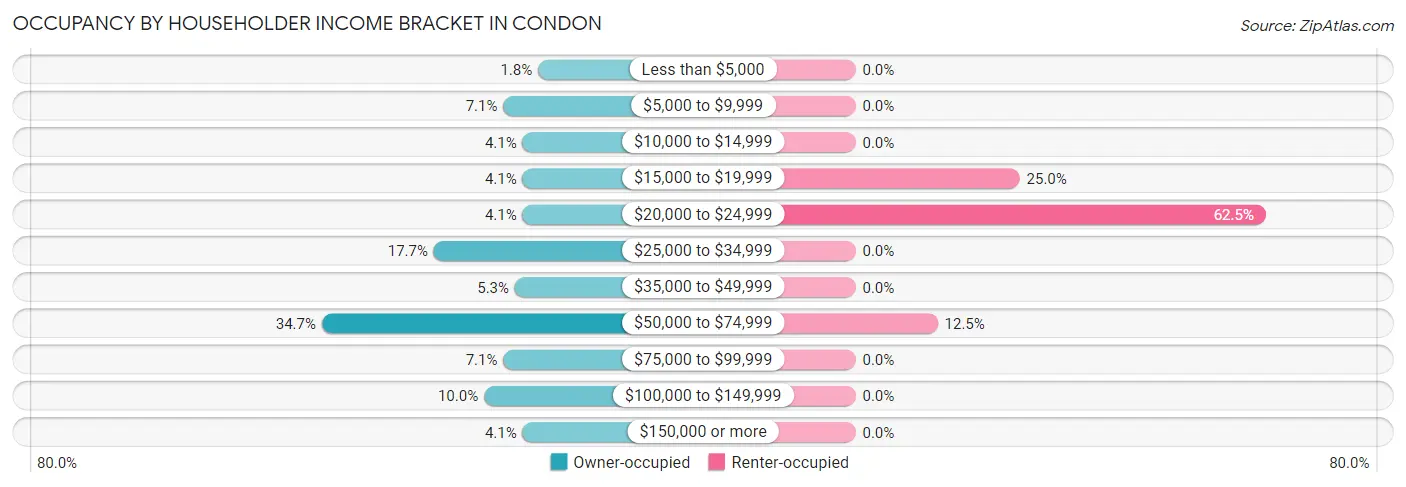
| Income Bracket | Owner-occupied | Renter-occupied |
| Less than $5,000 | 3 (1.8%) | 0 (0.0%) |
| $5,000 to $9,999 | 12 (7.1%) | 0 (0.0%) |
| $10,000 to $14,999 | 7 (4.1%) | 0 (0.0%) |
| $15,000 to $19,999 | 7 (4.1%) | 4 (25.0%) |
| $20,000 to $24,999 | 7 (4.1%) | 10 (62.5%) |
| $25,000 to $34,999 | 30 (17.6%) | 0 (0.0%) |
| $35,000 to $49,999 | 9 (5.3%) | 0 (0.0%) |
| $50,000 to $74,999 | 59 (34.7%) | 2 (12.5%) |
| $75,000 to $99,999 | 12 (7.1%) | 0 (0.0%) |
| $100,000 to $149,999 | 17 (10.0%) | 0 (0.0%) |
| $150,000 or more | 7 (4.1%) | 0 (0.0%) |
| Total | 170 (100.0%) | 16 (100.0%) |
Monthly Housing Cost Tiers in Condon
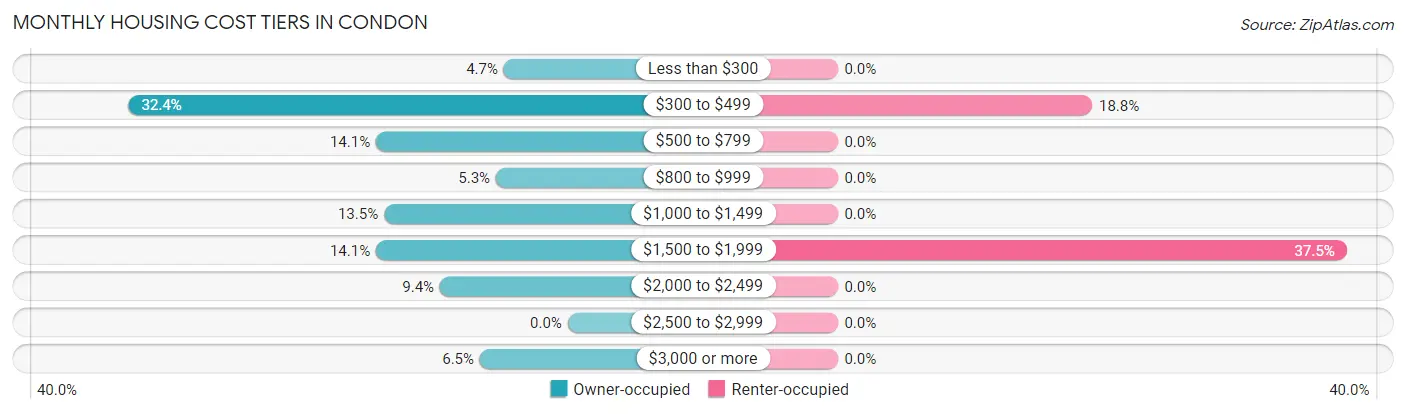
| Monthly Cost | Owner-occupied | Renter-occupied |
| Less than $300 | 8 (4.7%) | 0 (0.0%) |
| $300 to $499 | 55 (32.4%) | 3 (18.8%) |
| $500 to $799 | 24 (14.1%) | 0 (0.0%) |
| $800 to $999 | 9 (5.3%) | 0 (0.0%) |
| $1,000 to $1,499 | 23 (13.5%) | 0 (0.0%) |
| $1,500 to $1,999 | 24 (14.1%) | 6 (37.5%) |
| $2,000 to $2,499 | 16 (9.4%) | 0 (0.0%) |
| $2,500 to $2,999 | 0 (0.0%) | 0 (0.0%) |
| $3,000 or more | 11 (6.5%) | 0 (0.0%) |
| Total | 170 (100.0%) | 16 (100.0%) |
Physical Housing Characteristics in Condon
Housing Structures in Condon
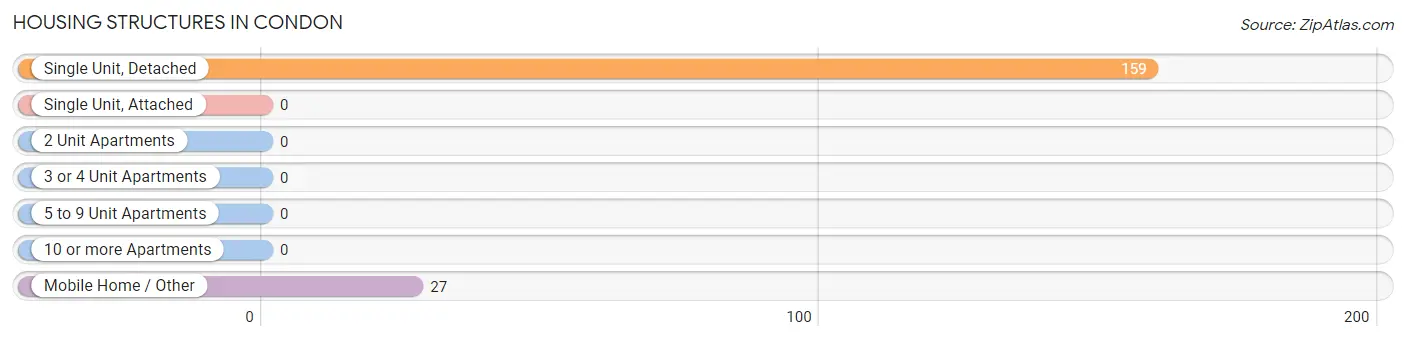
| Structure Type | # Housing Units | % Housing Units |
| Single Unit, Detached | 159 | 85.5% |
| Single Unit, Attached | 0 | 0.0% |
| 2 Unit Apartments | 0 | 0.0% |
| 3 or 4 Unit Apartments | 0 | 0.0% |
| 5 to 9 Unit Apartments | 0 | 0.0% |
| 10 or more Apartments | 0 | 0.0% |
| Mobile Home / Other | 27 | 14.5% |
| Total | 186 | 100.0% |
Housing Structures by Occupancy in Condon
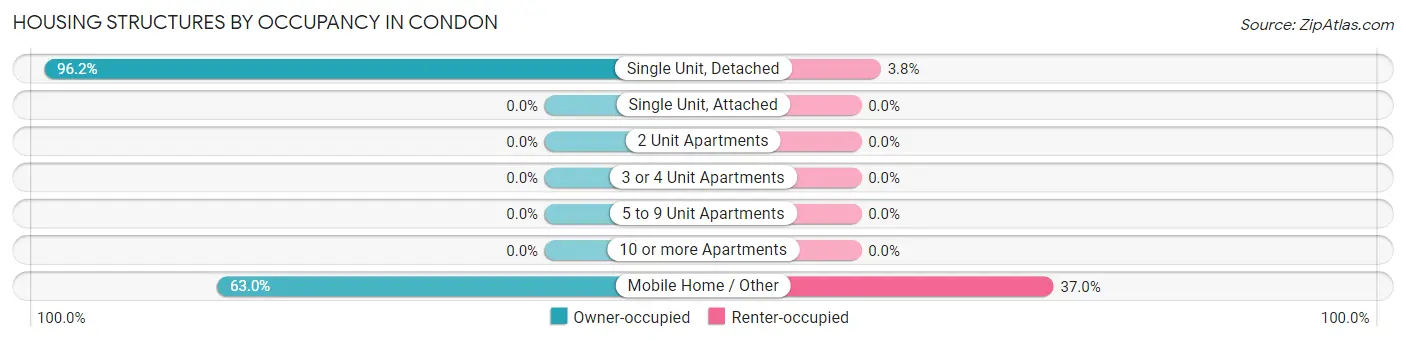
| Structure Type | Owner-occupied | Renter-occupied |
| Single Unit, Detached | 153 (96.2%) | 6 (3.8%) |
| Single Unit, Attached | 0 (0.0%) | 0 (0.0%) |
| 2 Unit Apartments | 0 (0.0%) | 0 (0.0%) |
| 3 or 4 Unit Apartments | 0 (0.0%) | 0 (0.0%) |
| 5 to 9 Unit Apartments | 0 (0.0%) | 0 (0.0%) |
| 10 or more Apartments | 0 (0.0%) | 0 (0.0%) |
| Mobile Home / Other | 17 (63.0%) | 10 (37.0%) |
| Total | 170 (91.4%) | 16 (8.6%) |
Housing Structures by Number of Rooms in Condon
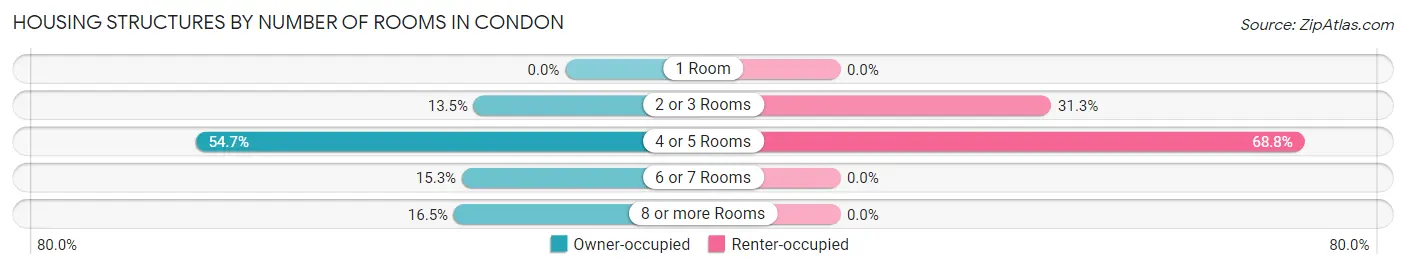
| Number of Rooms | Owner-occupied | Renter-occupied |
| 1 Room | 0 (0.0%) | 0 (0.0%) |
| 2 or 3 Rooms | 23 (13.5%) | 5 (31.2%) |
| 4 or 5 Rooms | 93 (54.7%) | 11 (68.8%) |
| 6 or 7 Rooms | 26 (15.3%) | 0 (0.0%) |
| 8 or more Rooms | 28 (16.5%) | 0 (0.0%) |
| Total | 170 (100.0%) | 16 (100.0%) |
Housing Structure by Heating Type in Condon
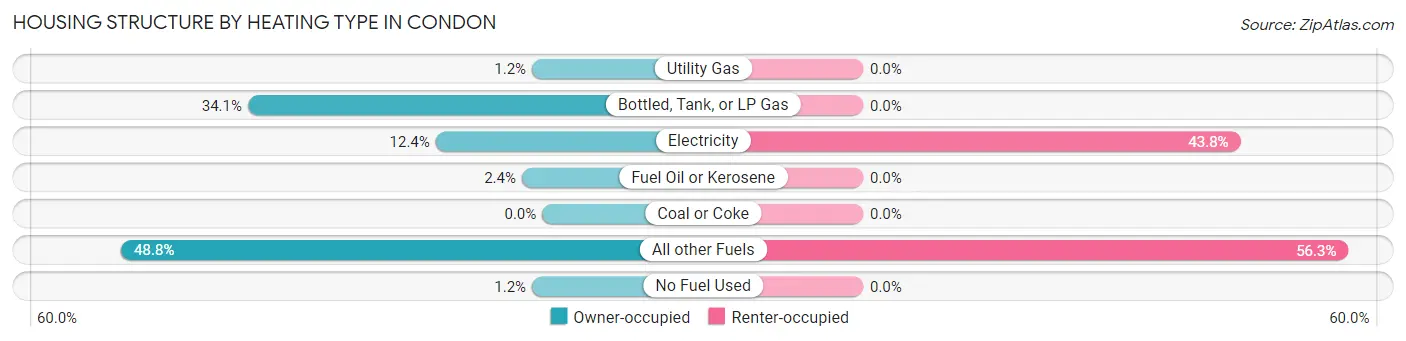
| Heating Type | Owner-occupied | Renter-occupied |
| Utility Gas | 2 (1.2%) | 0 (0.0%) |
| Bottled, Tank, or LP Gas | 58 (34.1%) | 0 (0.0%) |
| Electricity | 21 (12.3%) | 7 (43.8%) |
| Fuel Oil or Kerosene | 4 (2.4%) | 0 (0.0%) |
| Coal or Coke | 0 (0.0%) | 0 (0.0%) |
| All other Fuels | 83 (48.8%) | 9 (56.2%) |
| No Fuel Used | 2 (1.2%) | 0 (0.0%) |
| Total | 170 (100.0%) | 16 (100.0%) |
Household Vehicle Usage in Condon
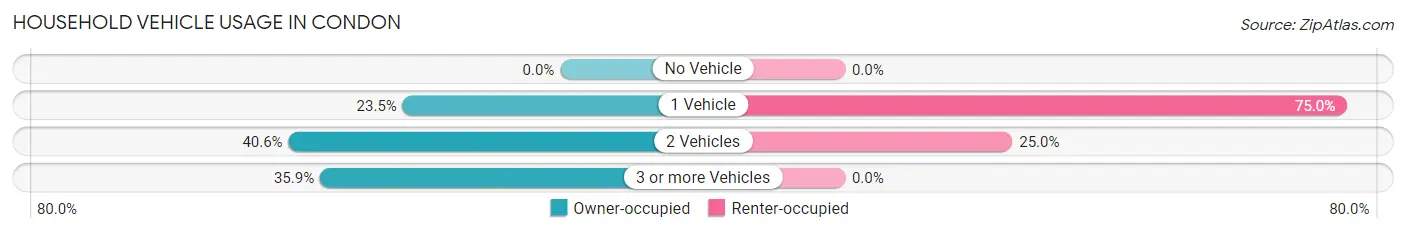
| Vehicles per Household | Owner-occupied | Renter-occupied |
| No Vehicle | 0 (0.0%) | 0 (0.0%) |
| 1 Vehicle | 40 (23.5%) | 12 (75.0%) |
| 2 Vehicles | 69 (40.6%) | 4 (25.0%) |
| 3 or more Vehicles | 61 (35.9%) | 0 (0.0%) |
| Total | 170 (100.0%) | 16 (100.0%) |
Real Estate & Mortgages in Condon
Real Estate and Mortgage Overview in Condon
| Characteristic | Without Mortgage | With Mortgage |
| Housing Units | 94 | 76 |
| Median Property Value | $452,400 | $454,500 |
| Median Household Income | $54,167 | $4 |
| Monthly Housing Costs | $346 | $11 |
| Real Estate Taxes | $1,974 | $0 |
Property Value by Mortgage Status in Condon
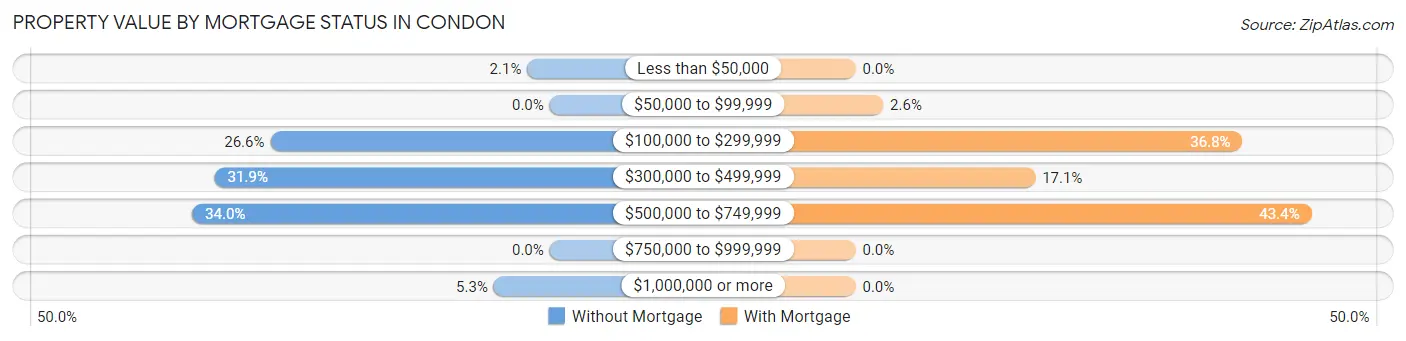
| Property Value | Without Mortgage | With Mortgage |
| Less than $50,000 | 2 (2.1%) | 0 (0.0%) |
| $50,000 to $99,999 | 0 (0.0%) | 2 (2.6%) |
| $100,000 to $299,999 | 25 (26.6%) | 28 (36.8%) |
| $300,000 to $499,999 | 30 (31.9%) | 13 (17.1%) |
| $500,000 to $749,999 | 32 (34.0%) | 33 (43.4%) |
| $750,000 to $999,999 | 0 (0.0%) | 0 (0.0%) |
| $1,000,000 or more | 5 (5.3%) | 0 (0.0%) |
| Total | 94 (100.0%) | 76 (100.0%) |
Household Income by Mortgage Status in Condon
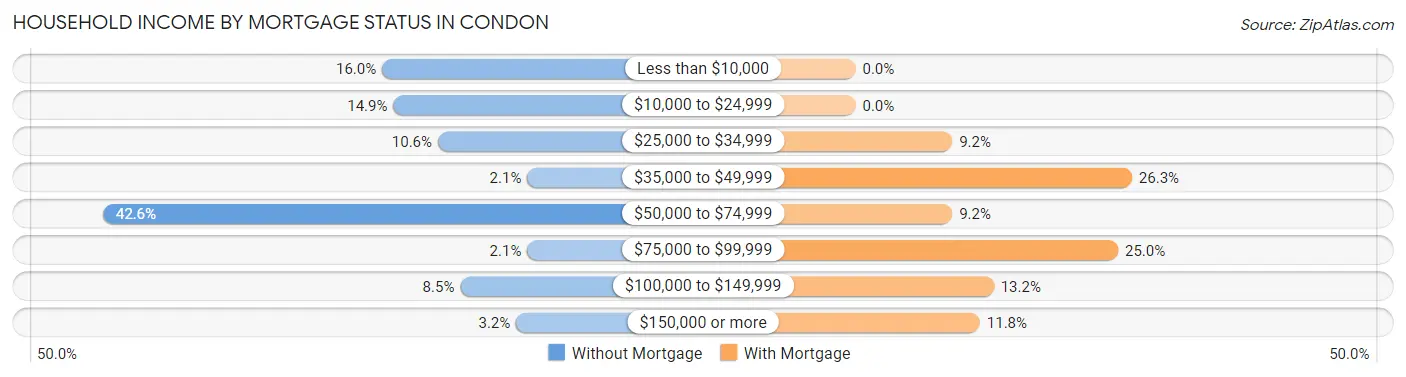
| Household Income | Without Mortgage | With Mortgage |
| Less than $10,000 | 15 (16.0%) | 0 (0.0%) |
| $10,000 to $24,999 | 14 (14.9%) | 0 (0.0%) |
| $25,000 to $34,999 | 10 (10.6%) | 7 (9.2%) |
| $35,000 to $49,999 | 2 (2.1%) | 20 (26.3%) |
| $50,000 to $74,999 | 40 (42.5%) | 7 (9.2%) |
| $75,000 to $99,999 | 2 (2.1%) | 19 (25.0%) |
| $100,000 to $149,999 | 8 (8.5%) | 10 (13.2%) |
| $150,000 or more | 3 (3.2%) | 9 (11.8%) |
| Total | 94 (100.0%) | 76 (100.0%) |
Property Value to Household Income Ratio in Condon
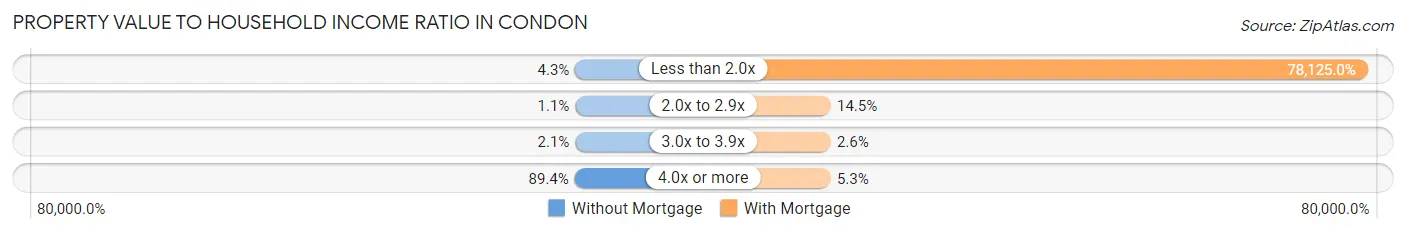
| Value-to-Income Ratio | Without Mortgage | With Mortgage |
| Less than 2.0x | 4 (4.3%) | 59,375 (78,125.0%) |
| 2.0x to 2.9x | 1 (1.1%) | 11 (14.5%) |
| 3.0x to 3.9x | 2 (2.1%) | 2 (2.6%) |
| 4.0x or more | 84 (89.4%) | 4 (5.3%) |
| Total | 94 (100.0%) | 76 (100.0%) |
Real Estate Taxes by Mortgage Status in Condon
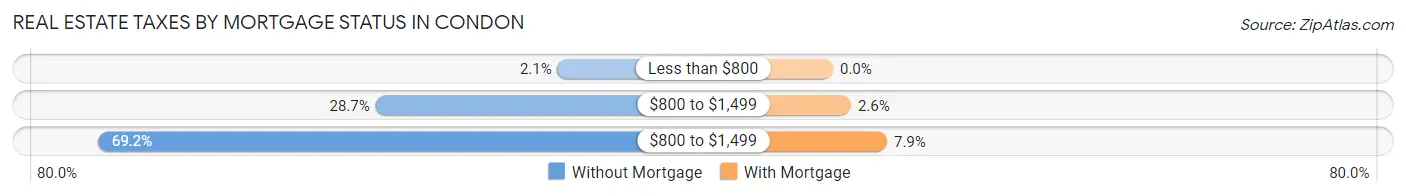
| Property Taxes | Without Mortgage | With Mortgage |
| Less than $800 | 2 (2.1%) | 0 (0.0%) |
| $800 to $1,499 | 27 (28.7%) | 2 (2.6%) |
| $800 to $1,499 | 65 (69.2%) | 6 (7.9%) |
| Total | 94 (100.0%) | 76 (100.0%) |
Health & Disability in Condon
Health Insurance Coverage by Age in Condon
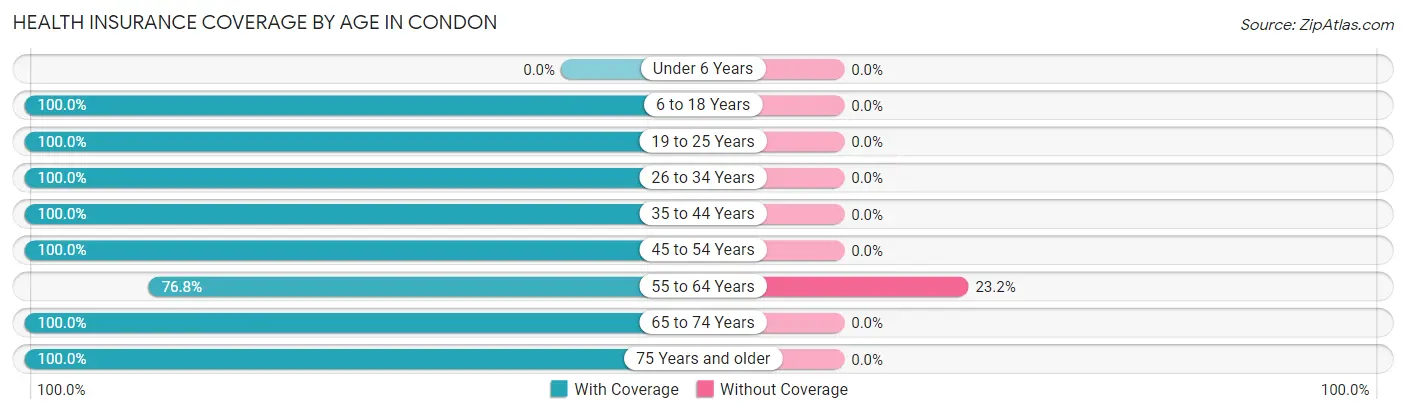
| Age Bracket | With Coverage | Without Coverage |
| Under 6 Years | 0 (0.0%) | 0 (0.0%) |
| 6 to 18 Years | 9 (100.0%) | 0 (0.0%) |
| 19 to 25 Years | 2 (100.0%) | 0 (0.0%) |
| 26 to 34 Years | 25 (100.0%) | 0 (0.0%) |
| 35 to 44 Years | 7 (100.0%) | 0 (0.0%) |
| 45 to 54 Years | 23 (100.0%) | 0 (0.0%) |
| 55 to 64 Years | 73 (76.8%) | 22 (23.2%) |
| 65 to 74 Years | 103 (100.0%) | 0 (0.0%) |
| 75 Years and older | 43 (100.0%) | 0 (0.0%) |
| Total | 285 (92.8%) | 22 (7.2%) |
Health Insurance Coverage by Citizenship Status in Condon
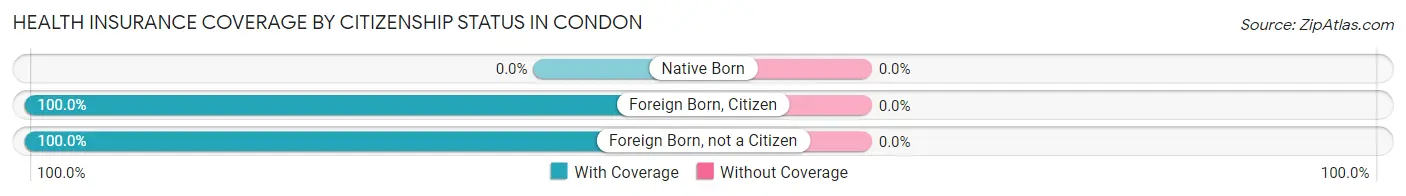
| Citizenship Status | With Coverage | Without Coverage |
| Native Born | 0 (0.0%) | 0 (0.0%) |
| Foreign Born, Citizen | 9 (100.0%) | 0 (0.0%) |
| Foreign Born, not a Citizen | 2 (100.0%) | 0 (0.0%) |
Health Insurance Coverage by Household Income in Condon
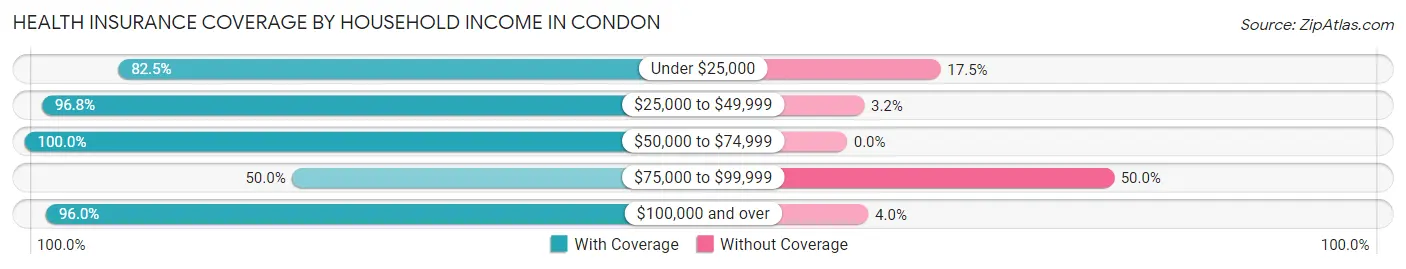
| Household Income | With Coverage | Without Coverage |
| Under $25,000 | 47 (82.5%) | 10 (17.5%) |
| $25,000 to $49,999 | 60 (96.8%) | 2 (3.2%) |
| $50,000 to $74,999 | 106 (100.0%) | 0 (0.0%) |
| $75,000 to $99,999 | 8 (50.0%) | 8 (50.0%) |
| $100,000 and over | 48 (96.0%) | 2 (4.0%) |
Public vs Private Health Insurance Coverage by Age in Condon
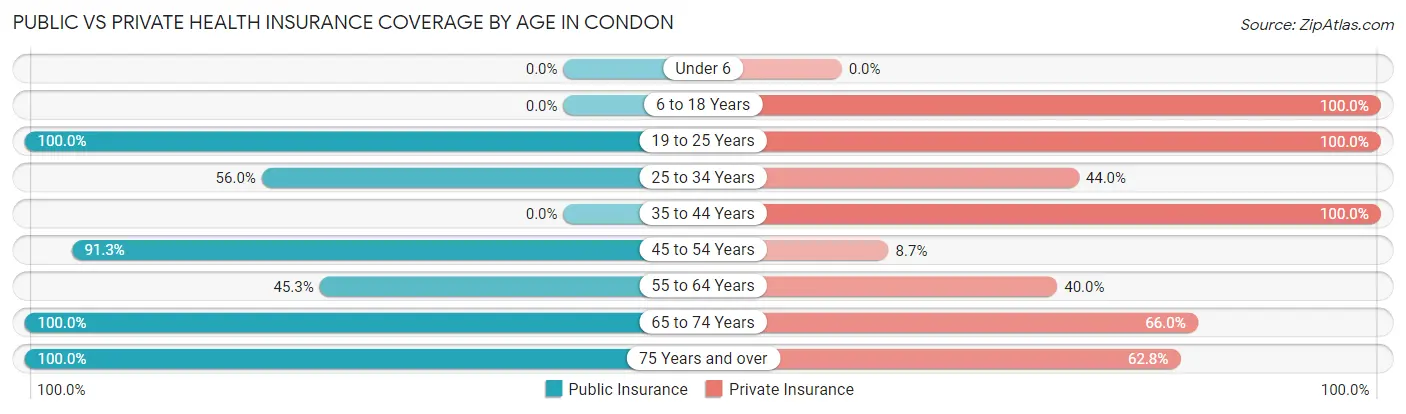
| Age Bracket | Public Insurance | Private Insurance |
| Under 6 | 0 (0.0%) | 0 (0.0%) |
| 6 to 18 Years | 0 (0.0%) | 9 (100.0%) |
| 19 to 25 Years | 2 (100.0%) | 2 (100.0%) |
| 25 to 34 Years | 14 (56.0%) | 11 (44.0%) |
| 35 to 44 Years | 0 (0.0%) | 7 (100.0%) |
| 45 to 54 Years | 21 (91.3%) | 2 (8.7%) |
| 55 to 64 Years | 43 (45.3%) | 38 (40.0%) |
| 65 to 74 Years | 103 (100.0%) | 68 (66.0%) |
| 75 Years and over | 43 (100.0%) | 27 (62.8%) |
| Total | 226 (73.6%) | 164 (53.4%) |
Disability Status by Sex by Age in Condon
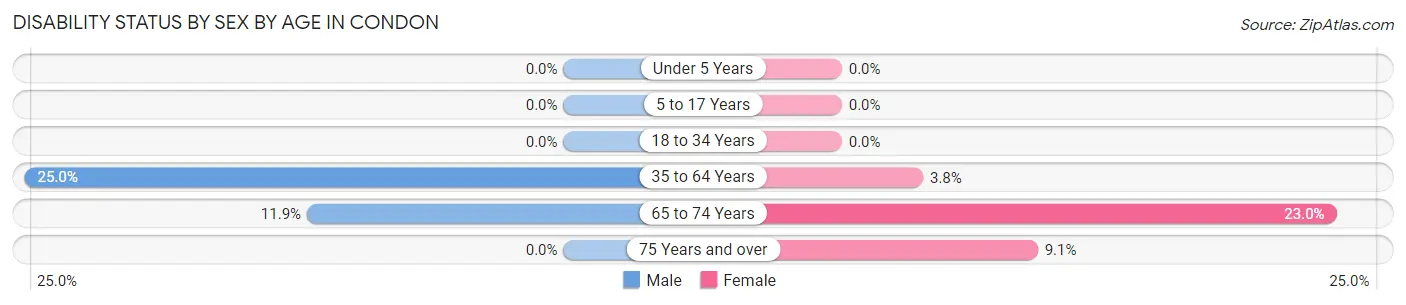
| Age Bracket | Male | Female |
| Under 5 Years | 0 (0.0%) | 0 (0.0%) |
| 5 to 17 Years | 0 (0.0%) | 0 (0.0%) |
| 18 to 34 Years | 0 (0.0%) | 0 (0.0%) |
| 35 to 64 Years | 18 (25.0%) | 2 (3.8%) |
| 65 to 74 Years | 5 (11.9%) | 14 (23.0%) |
| 75 Years and over | 0 (0.0%) | 2 (9.1%) |
Disability Class by Sex by Age in Condon
Disability Class: Hearing Difficulty
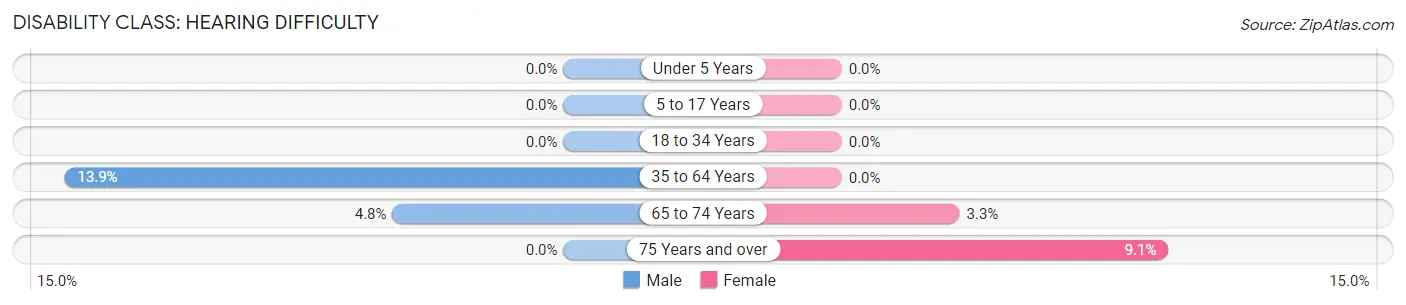
| Age Bracket | Male | Female |
| Under 5 Years | 0 (0.0%) | 0 (0.0%) |
| 5 to 17 Years | 0 (0.0%) | 0 (0.0%) |
| 18 to 34 Years | 0 (0.0%) | 0 (0.0%) |
| 35 to 64 Years | 10 (13.9%) | 0 (0.0%) |
| 65 to 74 Years | 2 (4.8%) | 2 (3.3%) |
| 75 Years and over | 0 (0.0%) | 2 (9.1%) |
Disability Class: Vision Difficulty
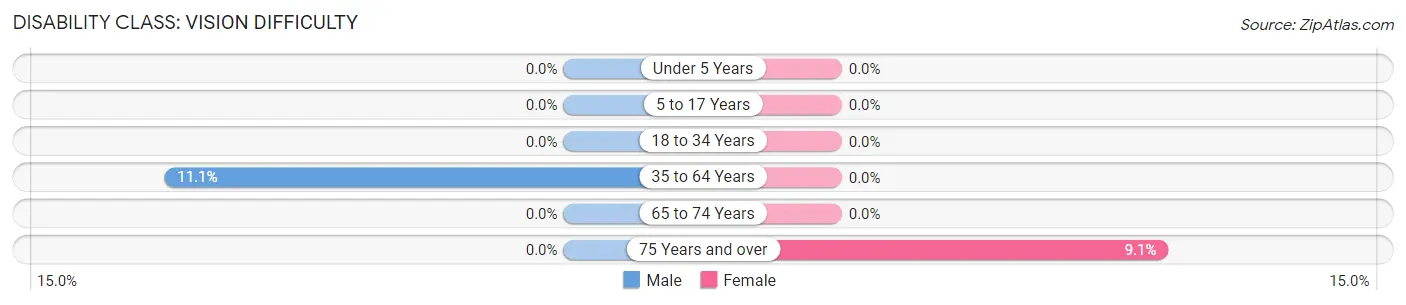
| Age Bracket | Male | Female |
| Under 5 Years | 0 (0.0%) | 0 (0.0%) |
| 5 to 17 Years | 0 (0.0%) | 0 (0.0%) |
| 18 to 34 Years | 0 (0.0%) | 0 (0.0%) |
| 35 to 64 Years | 8 (11.1%) | 0 (0.0%) |
| 65 to 74 Years | 0 (0.0%) | 0 (0.0%) |
| 75 Years and over | 0 (0.0%) | 2 (9.1%) |
Disability Class: Cognitive Difficulty
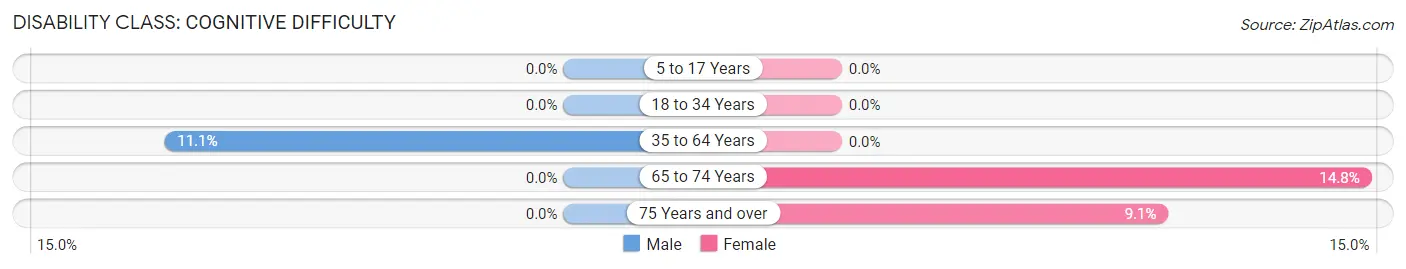
| Age Bracket | Male | Female |
| 5 to 17 Years | 0 (0.0%) | 0 (0.0%) |
| 18 to 34 Years | 0 (0.0%) | 0 (0.0%) |
| 35 to 64 Years | 8 (11.1%) | 0 (0.0%) |
| 65 to 74 Years | 0 (0.0%) | 9 (14.7%) |
| 75 Years and over | 0 (0.0%) | 2 (9.1%) |
Disability Class: Ambulatory Difficulty
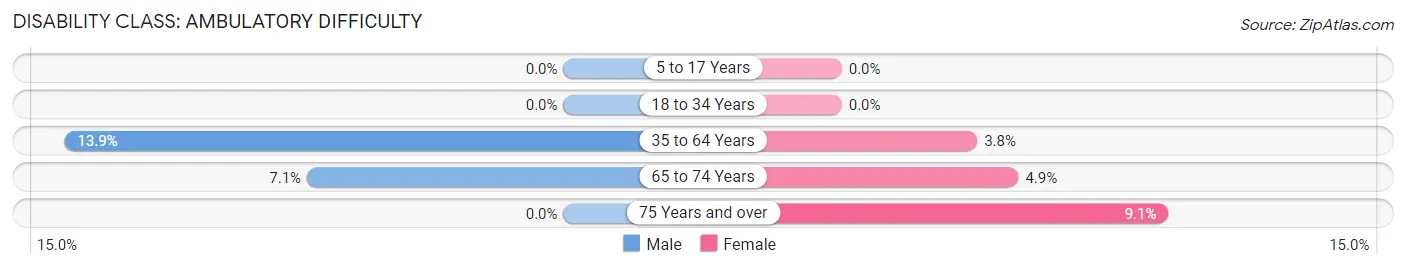
| Age Bracket | Male | Female |
| 5 to 17 Years | 0 (0.0%) | 0 (0.0%) |
| 18 to 34 Years | 0 (0.0%) | 0 (0.0%) |
| 35 to 64 Years | 10 (13.9%) | 2 (3.8%) |
| 65 to 74 Years | 3 (7.1%) | 3 (4.9%) |
| 75 Years and over | 0 (0.0%) | 2 (9.1%) |
Disability Class: Self-Care Difficulty
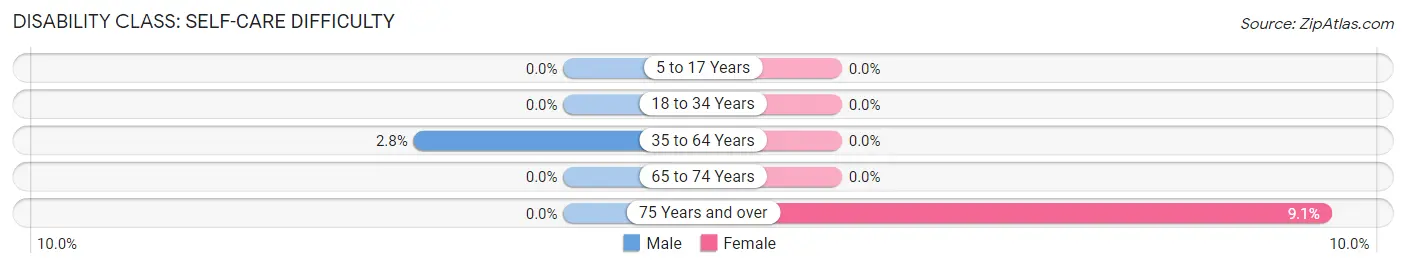
| Age Bracket | Male | Female |
| 5 to 17 Years | 0 (0.0%) | 0 (0.0%) |
| 18 to 34 Years | 0 (0.0%) | 0 (0.0%) |
| 35 to 64 Years | 2 (2.8%) | 0 (0.0%) |
| 65 to 74 Years | 0 (0.0%) | 0 (0.0%) |
| 75 Years and over | 0 (0.0%) | 2 (9.1%) |
Technology Access in Condon
Computing Device Access in Condon
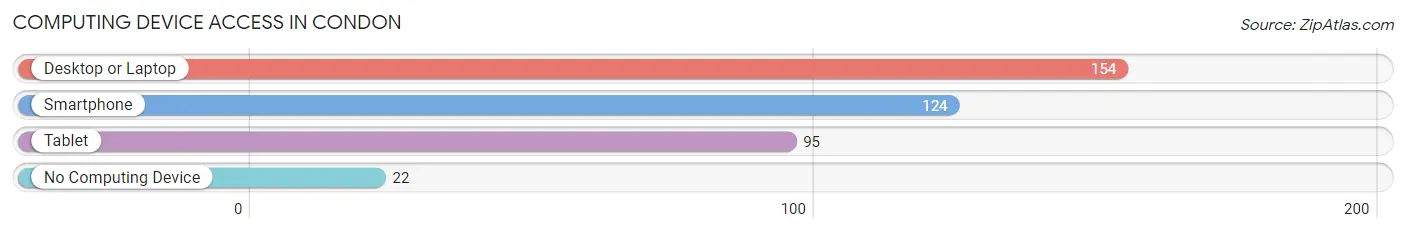
| Device Type | # Households | % Households |
| Desktop or Laptop | 154 | 82.8% |
| Smartphone | 124 | 66.7% |
| Tablet | 95 | 51.1% |
| No Computing Device | 22 | 11.8% |
| Total | 186 | 100.0% |
Internet Access in Condon
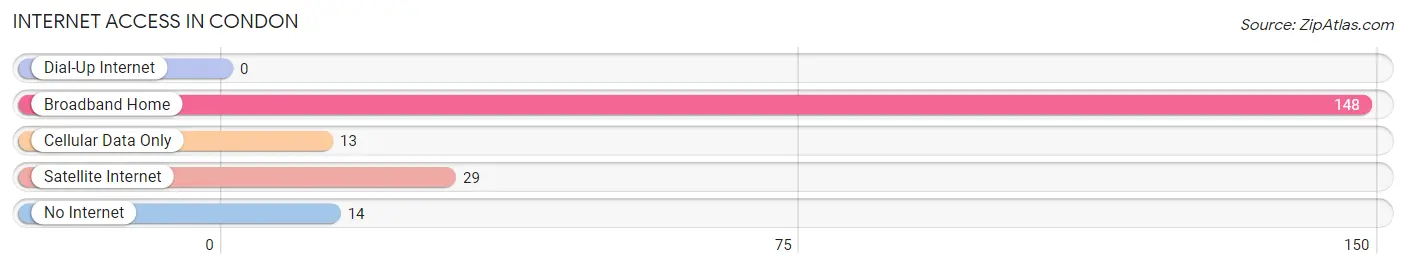
| Internet Type | # Households | % Households |
| Dial-Up Internet | 0 | 0.0% |
| Broadband Home | 148 | 79.6% |
| Cellular Data Only | 13 | 7.0% |
| Satellite Internet | 29 | 15.6% |
| No Internet | 14 | 7.5% |
| Total | 186 | 100.0% |
Condon Summary
Condon is a small town located in the state of Montana, in the United States. It is situated in the Flathead Valley, in the northwestern part of the state. The town is located in the Flathead County, and is part of the Kalispell Micropolitan Statistical Area. The population of Condon was estimated to be 1,072 in 2019.
History
The area around Condon was first settled in the late 1800s by homesteaders. The town was officially founded in 1891, and was named after the Condon family, who were among the first settlers in the area. The town was incorporated in 1909.
In the early 1900s, Condon was a thriving agricultural community, with many farms and ranches in the area. The town was also home to several businesses, including a sawmill, a flour mill, and a creamery.
Geography
Condon is located in the Flathead Valley, in the northwestern part of Montana. The town is situated at an elevation of 3,400 feet (1,036 m). The Flathead River runs through the town, and the Flathead National Forest is located nearby.
The climate in Condon is semi-arid, with cold winters and hot summers. The average annual temperature is 44°F (7°C). The average annual precipitation is 16 inches (406 mm).
Economy
The economy of Condon is largely based on agriculture and tourism. The town is home to several farms and ranches, and the surrounding area is known for its production of hay, wheat, and other crops.
Tourism is also an important part of the local economy. The town is located near several popular attractions, including Glacier National Park, Flathead Lake, and the Bob Marshall Wilderness.
Demographics
As of 2019, the population of Condon was estimated to be 1,072. The racial makeup of the town was 94.3% White, 0.7% Native American, 0.3% Asian, 0.2% African American, and 4.5% from other races. The median household income was $41,250, and the median age was 44.
Condon is a small town with a close-knit community. The town is home to several churches, and there are several local events and festivals held throughout the year. The town is also home to a public library, a museum, and a community center.
Common Questions
What is Per Capita Income in Condon?
Per Capita income in Condon is $34,959.
What is the Median Family Income in Condon?
Median Family Income in Condon is $61,786.
What is the Median Household income in Condon?
Median Household Income in Condon is $53,125.
What is Income or Wage Gap in Condon?
Income or Wage Gap in Condon is 14.7%.
Women in Condon earn 85.3 cents for every dollar earned by a man.
What is Inequality or Gini Index in Condon?
Inequality or Gini Index in Condon is 0.40.
What is the Total Population of Condon?
Total Population of Condon is 307.
What is the Total Male Population of Condon?
Total Male Population of Condon is 160.
What is the Total Female Population of Condon?
Total Female Population of Condon is 147.
What is the Ratio of Males per 100 Females in Condon?
There are 108.84 Males per 100 Females in Condon.
What is the Ratio of Females per 100 Males in Condon?
There are 91.88 Females per 100 Males in Condon.
What is the Median Population Age in Condon?
Median Population Age in Condon is 64.8 Years.
What is the Average Family Size in Condon
Average Family Size in Condon is 2.2 People.
What is the Average Household Size in Condon
Average Household Size in Condon is 1.6 People.
How Large is the Labor Force in Condon?
There are 91 People in the Labor Forcein in Condon.
What is the Percentage of People in the Labor Force in Condon?
30.5% of People are in the Labor Force in Condon.
What is the Unemployment Rate in Condon?
Unemployment Rate in Condon is 3.3%.