King Arthur Park, MT Map & Demographics
King Arthur Park Map
King Arthur Park Overview
$34,646
PER CAPITA INCOME
$106,438
AVG FAMILY INCOME
$101,281
AVG HOUSEHOLD INCOME
13.2%
WAGE / INCOME GAP [ % ]
86.8¢/ $1
WAGE / INCOME GAP [ $ ]
0.23
INEQUALITY / GINI INDEX
2,033
TOTAL POPULATION
1,284
MALE POPULATION
749
FEMALE POPULATION
171.43
MALES / 100 FEMALES
58.33
FEMALES / 100 MALES
34.9
MEDIAN AGE
3.8
AVG FAMILY SIZE
3.3
AVG HOUSEHOLD SIZE
1,396
LABOR FORCE [ PEOPLE ]
88.6%
PERCENT IN LABOR FORCE
Income in King Arthur Park
Income Overview in King Arthur Park
Per Capita Income in King Arthur Park is $34,646, while median incomes of families and households are $106,438 and $101,281 respectively.
| Characteristic | Number | Measure |
| Per Capita Income | 2,033 | $34,646 |
| Median Family Income | 328 | $106,438 |
| Mean Family Income | 328 | $108,388 |
| Median Household Income | 614 | $101,281 |
| Mean Household Income | 614 | $113,271 |
| Income Deficit | 328 | $0 |
| Wage / Income Gap (%) | 2,033 | 13.22% |
| Wage / Income Gap ($) | 2,033 | 86.78¢ per $1 |
| Gini / Inequality Index | 2,033 | 0.23 |
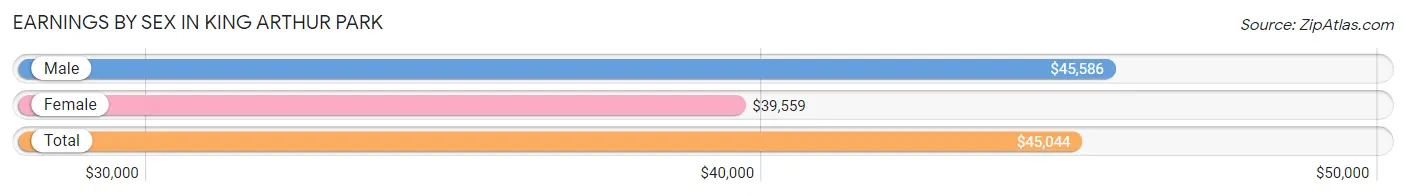
Earnings by Sex in King Arthur Park
Average Earnings in King Arthur Park are $45,044, $45,586 for men and $39,559 for women, a difference of 13.2%.
| Sex | Number | Average Earnings |
| Male | 1,007 (68.7%) | $45,586 |
| Female | 458 (31.3%) | $39,559 |
| Total | 1,465 (100.0%) | $45,044 |
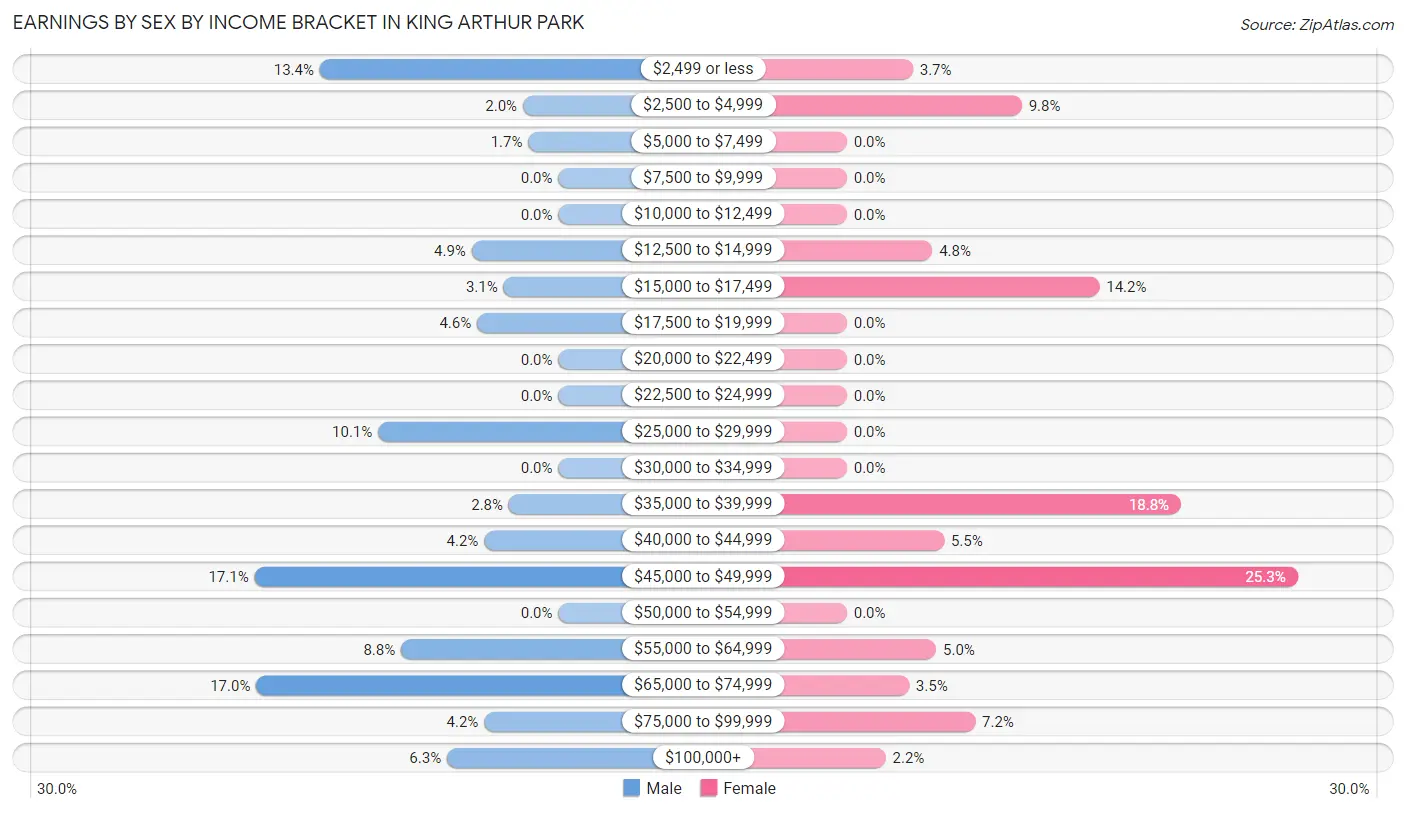
Earnings by Sex by Income Bracket in King Arthur Park
The most common earnings brackets in King Arthur Park are $45,000 to $49,999 for men (172 | 17.1%) and $45,000 to $49,999 for women (116 | 25.3%).
| Income | Male | Female |
| $2,499 or less | 135 (13.4%) | 17 (3.7%) |
| $2,500 to $4,999 | 20 (2.0%) | 45 (9.8%) |
| $5,000 to $7,499 | 17 (1.7%) | 0 (0.0%) |
| $7,500 to $9,999 | 0 (0.0%) | 0 (0.0%) |
| $10,000 to $12,499 | 0 (0.0%) | 0 (0.0%) |
| $12,500 to $14,999 | 49 (4.9%) | 22 (4.8%) |
| $15,000 to $17,499 | 31 (3.1%) | 65 (14.2%) |
| $17,500 to $19,999 | 46 (4.6%) | 0 (0.0%) |
| $20,000 to $22,499 | 0 (0.0%) | 0 (0.0%) |
| $22,500 to $24,999 | 0 (0.0%) | 0 (0.0%) |
| $25,000 to $29,999 | 102 (10.1%) | 0 (0.0%) |
| $30,000 to $34,999 | 0 (0.0%) | 0 (0.0%) |
| $35,000 to $39,999 | 28 (2.8%) | 86 (18.8%) |
| $40,000 to $44,999 | 42 (4.2%) | 25 (5.5%) |
| $45,000 to $49,999 | 172 (17.1%) | 116 (25.3%) |
| $50,000 to $54,999 | 0 (0.0%) | 0 (0.0%) |
| $55,000 to $64,999 | 89 (8.8%) | 23 (5.0%) |
| $65,000 to $74,999 | 171 (17.0%) | 16 (3.5%) |
| $75,000 to $99,999 | 42 (4.2%) | 33 (7.2%) |
| $100,000+ | 63 (6.3%) | 10 (2.2%) |
| Total | 1,007 (100.0%) | 458 (100.0%) |
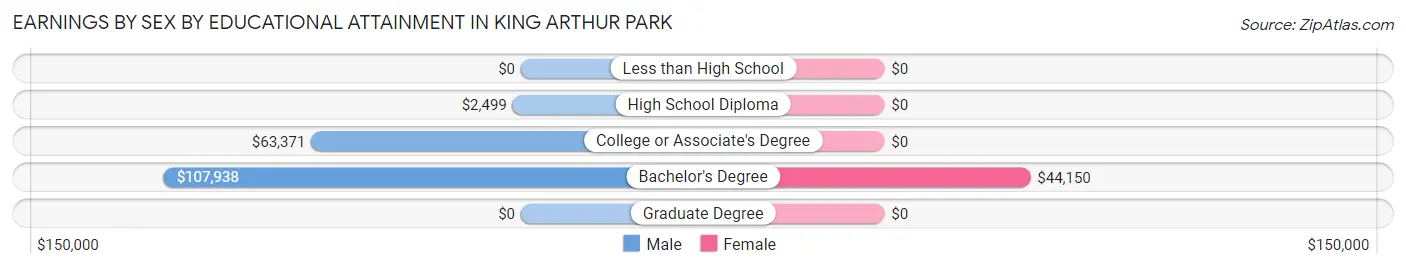
Earnings by Sex by Educational Attainment in King Arthur Park
Average earnings in King Arthur Park are $47,316 for men and $43,900 for women, a difference of 7.2%. Men with an educational attainment of bachelor's degree enjoy the highest average annual earnings of $107,938, while those with high school diploma education earn the least with $2,499. Women with an educational attainment of bachelor's degree earn the most with the average annual earnings of $44,150, while those with bachelor's degree education have the smallest earnings of $44,150.
| Educational Attainment | Male Income | Female Income |
| Less than High School | - | - |
| High School Diploma | $2,499 | $0 |
| College or Associate's Degree | $63,371 | $0 |
| Bachelor's Degree | $107,938 | $44,150 |
| Graduate Degree | - | - |
| Total | $47,316 | $43,900 |
Family Income in King Arthur Park
Family Income Brackets in King Arthur Park
According to the King Arthur Park family income data, there are 132 families falling into the $100,000 to $149,999 income range, which is the most common income bracket and makes up 40.2% of all families.
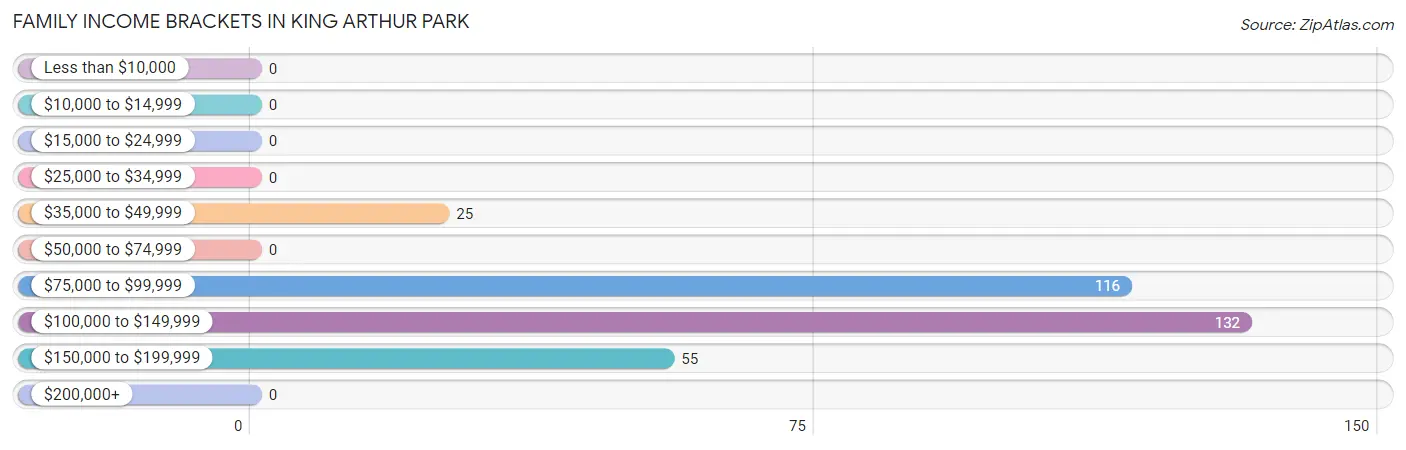
| Income Bracket | # Families | % Families |
| Less than $10,000 | 0 | 0.0% |
| $10,000 to $14,999 | 0 | 0.0% |
| $15,000 to $24,999 | 0 | 0.0% |
| $25,000 to $34,999 | 0 | 0.0% |
| $35,000 to $49,999 | 25 | 7.6% |
| $50,000 to $74,999 | 0 | 0.0% |
| $75,000 to $99,999 | 116 | 35.4% |
| $100,000 to $149,999 | 132 | 40.2% |
| $150,000 to $199,999 | 55 | 16.8% |
| $200,000+ | 0 | 0.0% |
Family Income by Famaliy Size in King Arthur Park
2-person families (181 | 55.2%) account for the highest median family income in King Arthur Park with $94,154 per family, while 2-person families (181 | 55.2%) have the highest median income of $47,077 per family member.
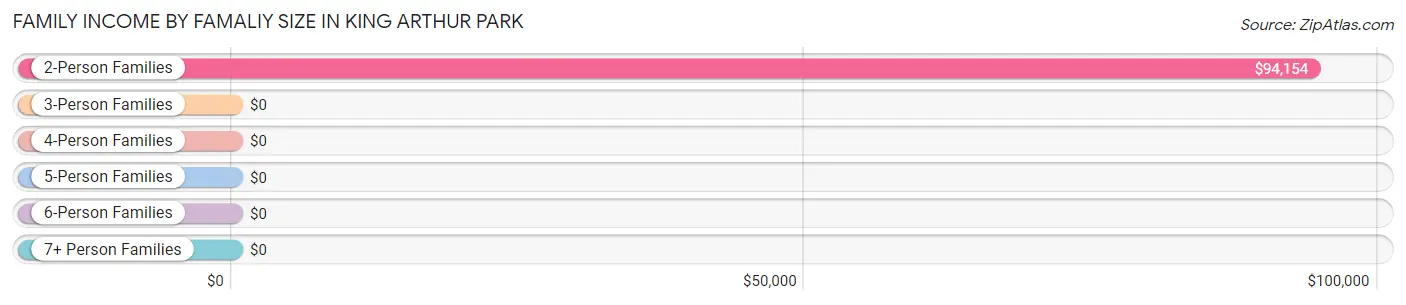
| Income Bracket | # Families | Median Income |
| 2-Person Families | 181 (55.2%) | $94,154 |
| 3-Person Families | 40 (12.2%) | $0 |
| 4-Person Families | 52 (15.9%) | $0 |
| 5-Person Families | 16 (4.9%) | $0 |
| 6-Person Families | 0 (0.0%) | $0 |
| 7+ Person Families | 39 (11.9%) | $0 |
| Total | 328 (100.0%) | $106,438 |
Family Income by Number of Earners in King Arthur Park
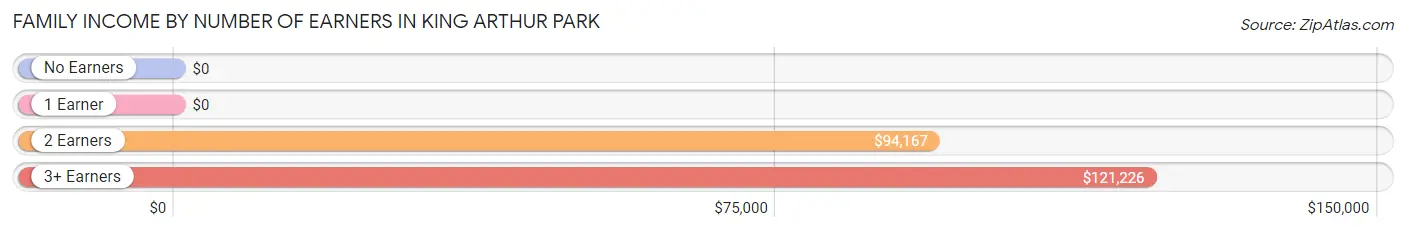
| Number of Earners | # Families | Median Income |
| No Earners | 0 (0.0%) | $0 |
| 1 Earner | 65 (19.8%) | $0 |
| 2 Earners | 132 (40.2%) | $94,167 |
| 3+ Earners | 131 (39.9%) | $121,226 |
| Total | 328 (100.0%) | $106,438 |
Household Income in King Arthur Park
Household Income Brackets in King Arthur Park
With 220 households falling in the category, the $100,000 to $149,999 income range is the most frequent in King Arthur Park, accounting for 35.8% of all households.
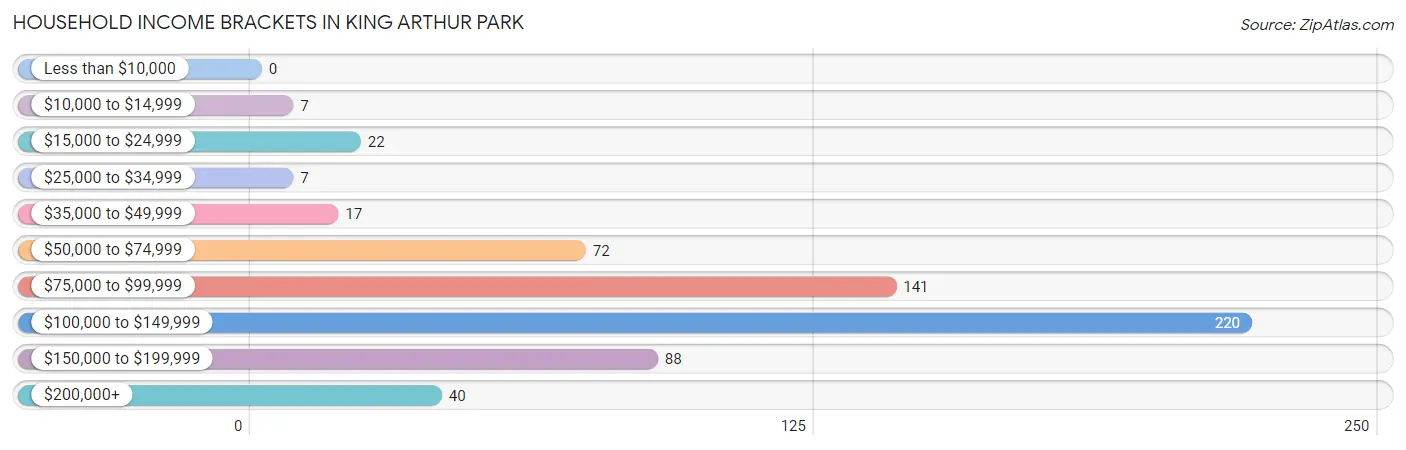
| Income Bracket | # Households | % Households |
| Less than $10,000 | 0 | 0.0% |
| $10,000 to $14,999 | 7 | 1.1% |
| $15,000 to $24,999 | 22 | 3.6% |
| $25,000 to $34,999 | 7 | 1.1% |
| $35,000 to $49,999 | 17 | 2.8% |
| $50,000 to $74,999 | 72 | 11.7% |
| $75,000 to $99,999 | 141 | 23.0% |
| $100,000 to $149,999 | 220 | 35.8% |
| $150,000 to $199,999 | 88 | 14.3% |
| $200,000+ | 40 | 6.5% |
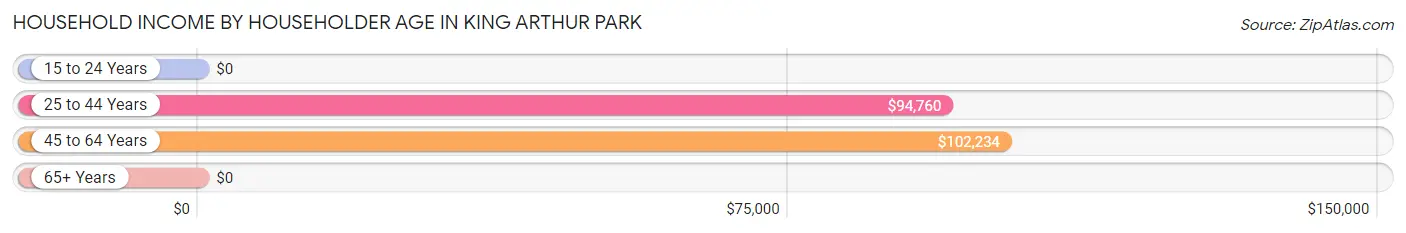
Household Income by Householder Age in King Arthur Park
The median household income in King Arthur Park is $101,281, with the highest median household income of $102,234 found in the 45 to 64 years age bracket for the primary householder. A total of 177 households (28.8%) fall into this category. Meanwhile, the 15 to 24 years age bracket for the primary householder has the lowest median household income of $0, with 59 households (9.6%) in this group.
| Income Bracket | # Households | Median Income |
| 15 to 24 Years | 59 (9.6%) | $0 |
| 25 to 44 Years | 317 (51.6%) | $94,760 |
| 45 to 64 Years | 177 (28.8%) | $102,234 |
| 65+ Years | 61 (9.9%) | $0 |
| Total | 614 (100.0%) | $101,281 |
Poverty in King Arthur Park
Income Below Poverty by Sex and Age in King Arthur Park
With 5.7% poverty level for males and 11.3% for females among the residents of King Arthur Park, 18 to 24 year old males and 18 to 24 year old females are the most vulnerable to poverty, with 73 males (35.6%) and 60 females (100.0%) in their respective age groups living below the poverty level.
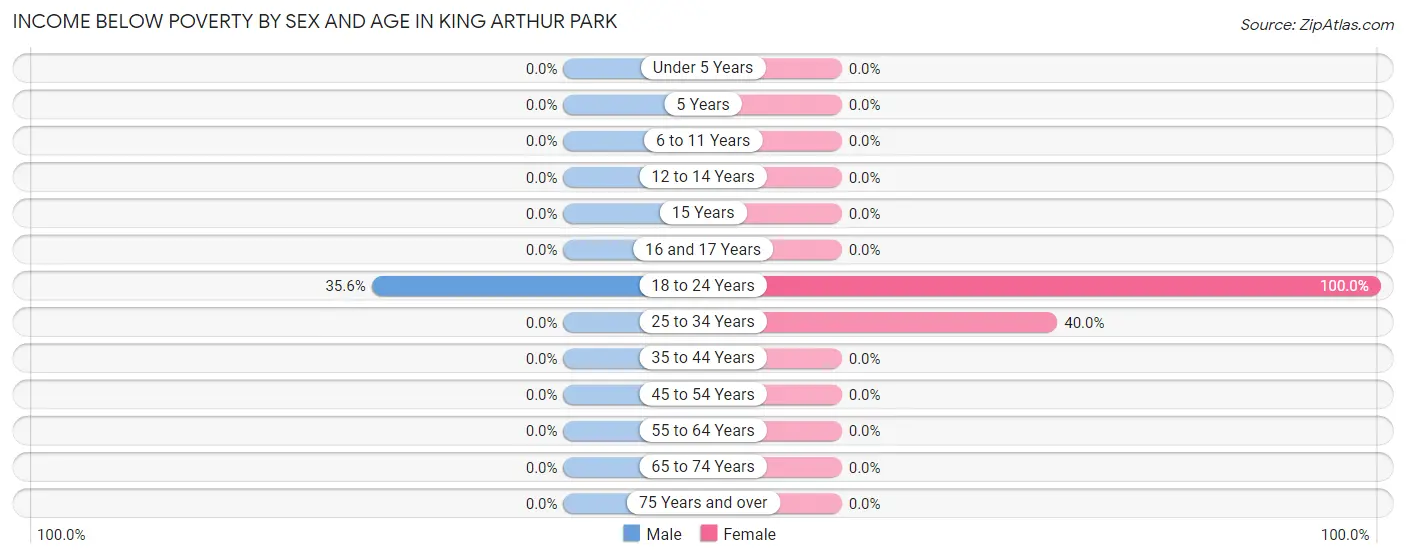
| Age Bracket | Male | Female |
| Under 5 Years | 0 (0.0%) | 0 (0.0%) |
| 5 Years | 0 (0.0%) | 0 (0.0%) |
| 6 to 11 Years | 0 (0.0%) | 0 (0.0%) |
| 12 to 14 Years | 0 (0.0%) | 0 (0.0%) |
| 15 Years | 0 (0.0%) | 0 (0.0%) |
| 16 and 17 Years | 0 (0.0%) | 0 (0.0%) |
| 18 to 24 Years | 73 (35.6%) | 60 (100.0%) |
| 25 to 34 Years | 0 (0.0%) | 22 (40.0%) |
| 35 to 44 Years | 0 (0.0%) | 0 (0.0%) |
| 45 to 54 Years | 0 (0.0%) | 0 (0.0%) |
| 55 to 64 Years | 0 (0.0%) | 0 (0.0%) |
| 65 to 74 Years | 0 (0.0%) | 0 (0.0%) |
| 75 Years and over | 0 (0.0%) | 0 (0.0%) |
| Total | 73 (5.7%) | 82 (11.3%) |
Income Above Poverty by Sex and Age in King Arthur Park
According to the poverty statistics in King Arthur Park, males aged 6 to 11 years and females aged under 5 years are the age groups that are most secure financially, with 100.0% of males and 100.0% of females in these age groups living above the poverty line.
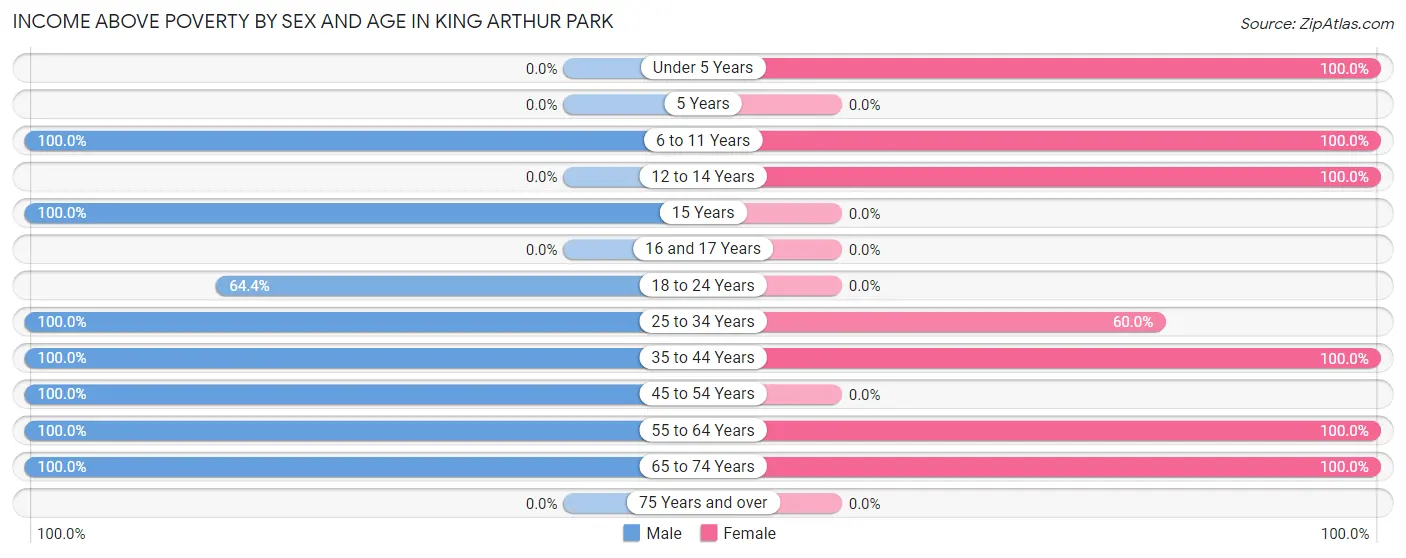
| Age Bracket | Male | Female |
| Under 5 Years | 0 (0.0%) | 118 (100.0%) |
| 5 Years | 0 (0.0%) | 0 (0.0%) |
| 6 to 11 Years | 225 (100.0%) | 33 (100.0%) |
| 12 to 14 Years | 0 (0.0%) | 16 (100.0%) |
| 15 Years | 45 (100.0%) | 0 (0.0%) |
| 16 and 17 Years | 0 (0.0%) | 0 (0.0%) |
| 18 to 24 Years | 132 (64.4%) | 0 (0.0%) |
| 25 to 34 Years | 246 (100.0%) | 33 (60.0%) |
| 35 to 44 Years | 315 (100.0%) | 259 (100.0%) |
| 45 to 54 Years | 189 (100.0%) | 0 (0.0%) |
| 55 to 64 Years | 17 (100.0%) | 17 (100.0%) |
| 65 to 74 Years | 42 (100.0%) | 171 (100.0%) |
| 75 Years and over | 0 (0.0%) | 0 (0.0%) |
| Total | 1,211 (94.3%) | 647 (88.7%) |
Income Below Poverty Among Married-Couple Families in King Arthur Park
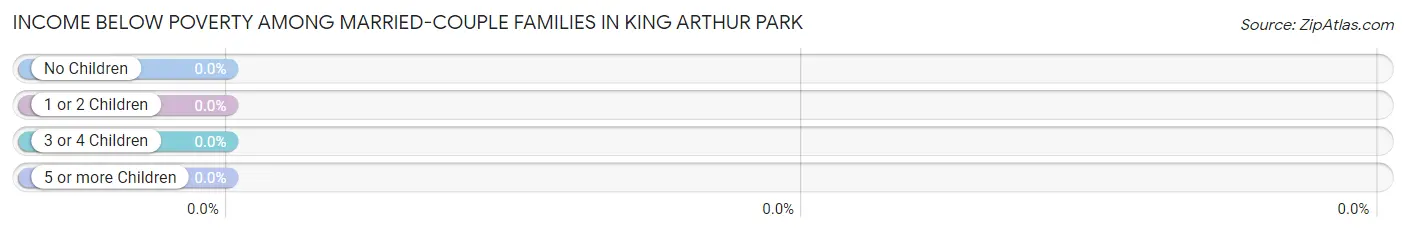
| Children | Above Poverty | Below Poverty |
| No Children | 156 (100.0%) | 0 (0.0%) |
| 1 or 2 Children | 52 (100.0%) | 0 (0.0%) |
| 3 or 4 Children | 16 (100.0%) | 0 (0.0%) |
| 5 or more Children | 0 (0.0%) | 0 (0.0%) |
| Total | 224 (100.0%) | 0 (0.0%) |
Income Below Poverty Among Single-Parent Households in King Arthur Park
| Children | Single Father | Single Mother |
| No Children | 0 (0.0%) | 0 (0.0%) |
| 1 or 2 Children | 0 (0.0%) | 0 (0.0%) |
| 3 or 4 Children | 0 (0.0%) | 0 (0.0%) |
| 5 or more Children | 0 (0.0%) | 0 (0.0%) |
| Total | 0 (0.0%) | 0 (0.0%) |
Income Below Poverty Among Married-Couple vs Single-Parent Households in King Arthur Park
| Children | Married-Couple Families | Single-Parent Households |
| No Children | 0 (0.0%) | 0 (0.0%) |
| 1 or 2 Children | 0 (0.0%) | 0 (0.0%) |
| 3 or 4 Children | 0 (0.0%) | 0 (0.0%) |
| 5 or more Children | 0 (0.0%) | 0 (0.0%) |
| Total | 0 (0.0%) | 0 (0.0%) |
Race in King Arthur Park
The most populous races in King Arthur Park are White / Caucasian (2,011 | 98.9%), and Two or more Races (22 | 1.1%).
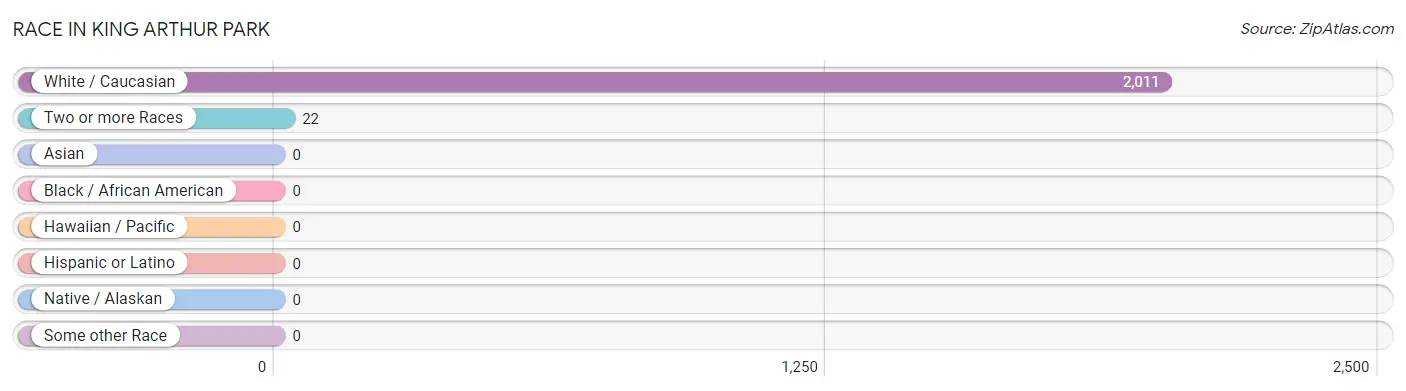
| Race | # Population | % Population |
| Asian | 0 | 0.0% |
| Black / African American | 0 | 0.0% |
| Hawaiian / Pacific | 0 | 0.0% |
| Hispanic or Latino | 0 | 0.0% |
| Native / Alaskan | 0 | 0.0% |
| White / Caucasian | 2,011 | 98.9% |
| Two or more Races | 22 | 1.1% |
| Some other Race | 0 | 0.0% |
| Total | 2,033 | 100.0% |
Ancestry in King Arthur Park
The most populous ancestries reported in King Arthur Park are English (332 | 16.3%), German (286 | 14.1%), Irish (246 | 12.1%), Norwegian (207 | 10.2%), and Polish (158 | 7.8%), together accounting for 60.4% of all King Arthur Park residents.
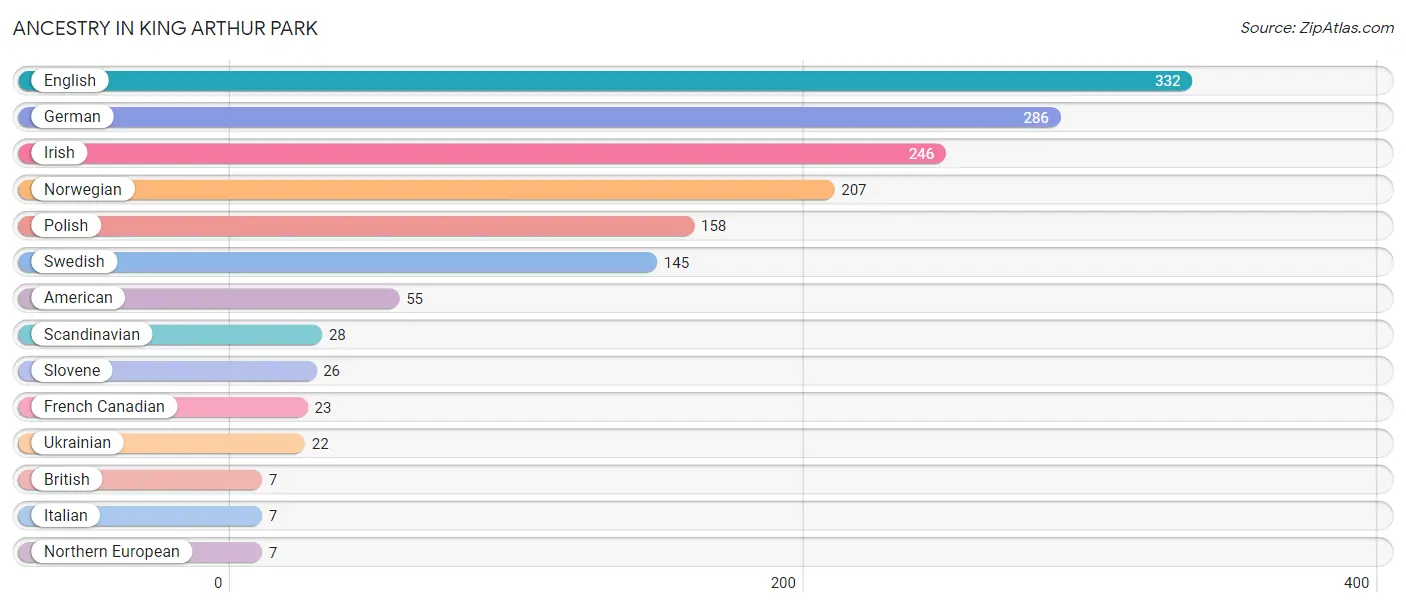
| Ancestry | # Population | % Population |
| American | 55 | 2.7% |
| British | 7 | 0.3% |
| English | 332 | 16.3% |
| French Canadian | 23 | 1.1% |
| German | 286 | 14.1% |
| Irish | 246 | 12.1% |
| Italian | 7 | 0.3% |
| Northern European | 7 | 0.3% |
| Norwegian | 207 | 10.2% |
| Polish | 158 | 7.8% |
| Scandinavian | 28 | 1.4% |
| Slovene | 26 | 1.3% |
| Swedish | 145 | 7.1% |
| Ukrainian | 22 | 1.1% | View All 14 Rows |
Immigrants in King Arthur Park
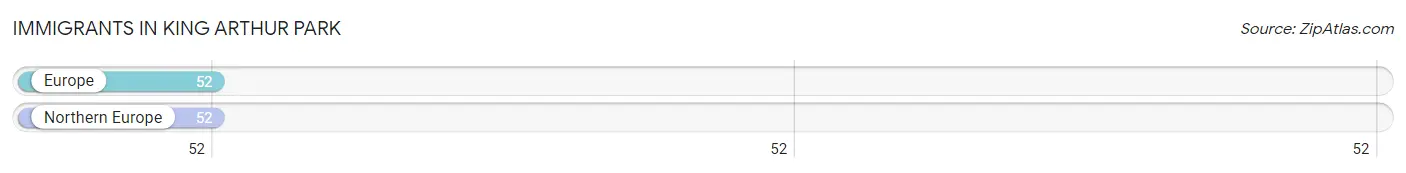
The most numerous immigrant groups reported in King Arthur Park came from Europe (52 | 2.6%), and Northern Europe (52 | 2.6%), together accounting for 5.1% of all King Arthur Park residents.
| Immigration Origin | # Population | % Population |
| Europe | 52 | 2.6% |
| Northern Europe | 52 | 2.6% | View All 2 Rows |
Sex and Age in King Arthur Park
Sex and Age in King Arthur Park
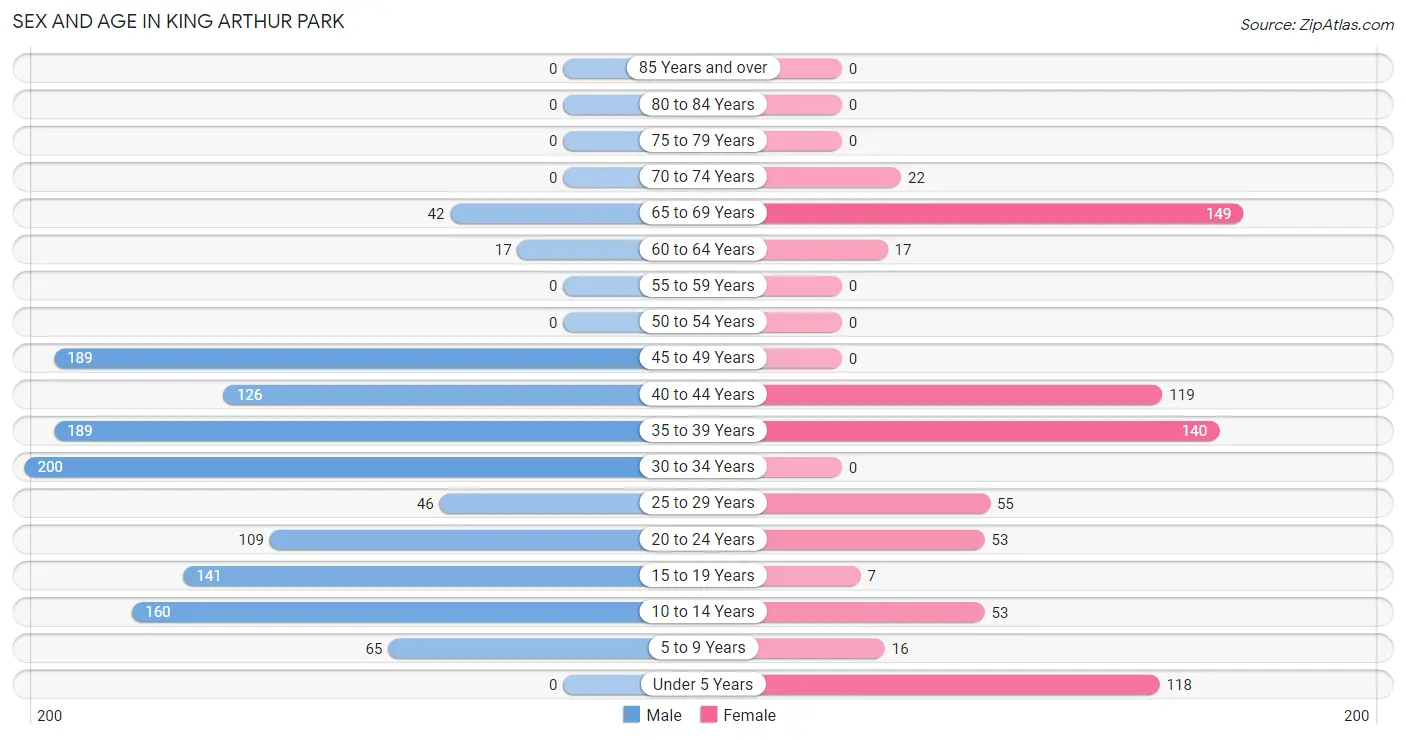
The most populous age groups in King Arthur Park are 30 to 34 Years (200 | 15.6%) for men and 65 to 69 Years (149 | 19.9%) for women.
| Age Bracket | Male | Female |
| Under 5 Years | 0 (0.0%) | 118 (15.8%) |
| 5 to 9 Years | 65 (5.1%) | 16 (2.1%) |
| 10 to 14 Years | 160 (12.5%) | 53 (7.1%) |
| 15 to 19 Years | 141 (11.0%) | 7 (0.9%) |
| 20 to 24 Years | 109 (8.5%) | 53 (7.1%) |
| 25 to 29 Years | 46 (3.6%) | 55 (7.3%) |
| 30 to 34 Years | 200 (15.6%) | 0 (0.0%) |
| 35 to 39 Years | 189 (14.7%) | 140 (18.7%) |
| 40 to 44 Years | 126 (9.8%) | 119 (15.9%) |
| 45 to 49 Years | 189 (14.7%) | 0 (0.0%) |
| 50 to 54 Years | 0 (0.0%) | 0 (0.0%) |
| 55 to 59 Years | 0 (0.0%) | 0 (0.0%) |
| 60 to 64 Years | 17 (1.3%) | 17 (2.3%) |
| 65 to 69 Years | 42 (3.3%) | 149 (19.9%) |
| 70 to 74 Years | 0 (0.0%) | 22 (2.9%) |
| 75 to 79 Years | 0 (0.0%) | 0 (0.0%) |
| 80 to 84 Years | 0 (0.0%) | 0 (0.0%) |
| 85 Years and over | 0 (0.0%) | 0 (0.0%) |
| Total | 1,284 (100.0%) | 749 (100.0%) |
Families and Households in King Arthur Park
Median Family Size in King Arthur Park
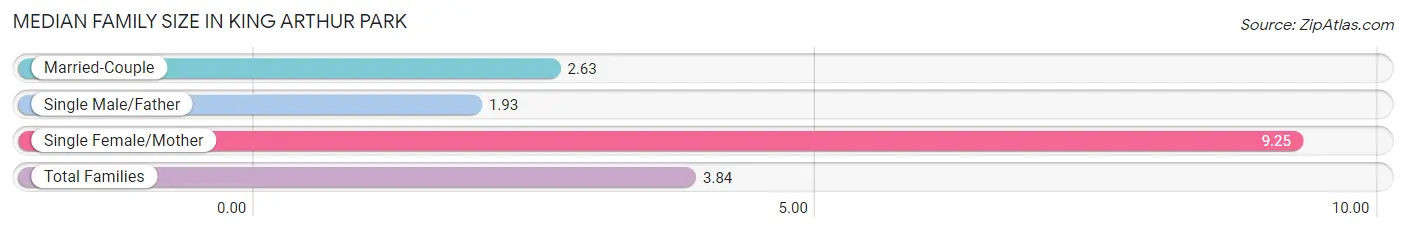
The median family size in King Arthur Park is 3.84 persons per family, with single female/mother families (64 | 19.5%) accounting for the largest median family size of 9.25 persons per family. On the other hand, single male/father families (40 | 12.2%) represent the smallest median family size with 1.93 persons per family.
| Family Type | # Families | Family Size |
| Married-Couple | 224 (68.3%) | 2.63 |
| Single Male/Father | 40 (12.2%) | 1.93 |
| Single Female/Mother | 64 (19.5%) | 9.25 |
| Total Families | 328 (100.0%) | 3.84 |
Median Household Size in King Arthur Park
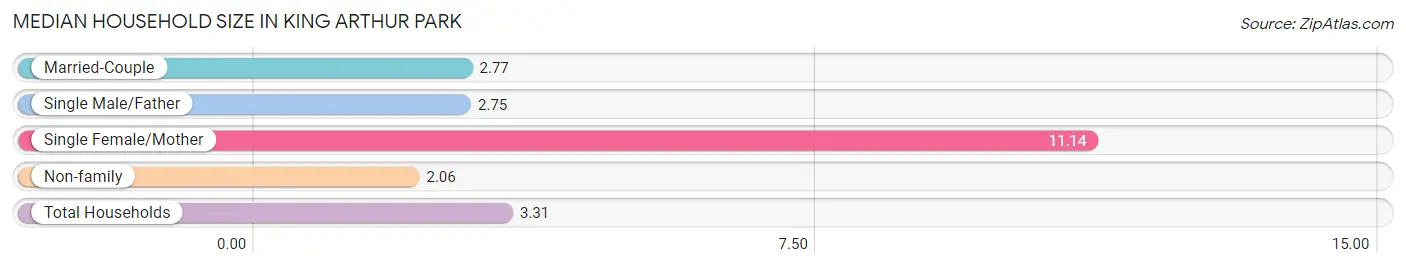
The median household size in King Arthur Park is 3.31 persons per household, with single female/mother households (64 | 10.4%) accounting for the largest median household size of 11.14 persons per household. non-family households (286 | 46.6%) represent the smallest median household size with 2.06 persons per household.
| Household Type | # Households | Household Size |
| Married-Couple | 224 (36.5%) | 2.77 |
| Single Male/Father | 40 (6.5%) | 2.75 |
| Single Female/Mother | 64 (10.4%) | 11.14 |
| Non-family | 286 (46.6%) | 2.06 |
| Total Households | 614 (100.0%) | 3.31 |
Household Size by Marriage Status in King Arthur Park
Out of a total of 614 households in King Arthur Park, 328 (53.4%) are family households, while 286 (46.6%) are nonfamily households. The most numerous type of family households are 2-person households, comprising 116, and the most common type of nonfamily households are 2-person households, comprising 153.
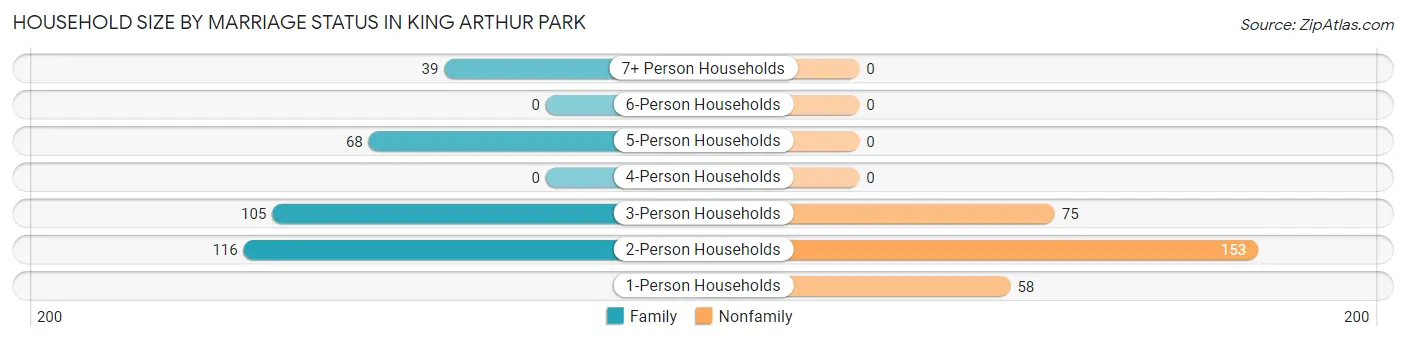
| Household Size | Family Households | Nonfamily Households |
| 1-Person Households | - | 58 (9.5%) |
| 2-Person Households | 116 (18.9%) | 153 (24.9%) |
| 3-Person Households | 105 (17.1%) | 75 (12.2%) |
| 4-Person Households | 0 (0.0%) | 0 (0.0%) |
| 5-Person Households | 68 (11.1%) | 0 (0.0%) |
| 6-Person Households | 0 (0.0%) | 0 (0.0%) |
| 7+ Person Households | 39 (6.4%) | 0 (0.0%) |
| Total | 328 (53.4%) | 286 (46.6%) |
Female Fertility in King Arthur Park
Fertility by Age in King Arthur Park
| Age Bracket | Women with Births | Births / 1,000 Women |
| 15 to 19 years | 0 (0.0%) | 0.0 |
| 20 to 34 years | 0 (0.0%) | 0.0 |
| 35 to 50 years | 0 (0.0%) | 0.0 |
| Total | 0 (0.0%) | 0.0 |
Fertility by Age by Marriage Status in King Arthur Park
| Age Bracket | Married | Unmarried |
| 15 to 19 years | 0 (0.0%) | 0 (0.0%) |
| 20 to 34 years | 0 (0.0%) | 0 (0.0%) |
| 35 to 50 years | 0 (0.0%) | 0 (0.0%) |
| Total | 0 (0.0%) | 0 (0.0%) |
Fertility by Education in King Arthur Park
| Educational Attainment | Women with Births | Births / 1,000 Women |
| Less than High School | 0 (0.0%) | 0.0 |
| High School Diploma | 0 (0.0%) | 0.0 |
| College or Associate's Degree | 0 (0.0%) | 0.0 |
| Bachelor's Degree | 0 (0.0%) | 0.0 |
| Graduate Degree | 0 (0.0%) | 0.0 |
| Total | 0 (0.0%) | 0.0 |
Fertility by Education by Marriage Status in King Arthur Park
| Educational Attainment | Married | Unmarried |
| Less than High School | 0 (0.0%) | 0 (0.0%) |
| High School Diploma | 0 (0.0%) | 0 (0.0%) |
| College or Associate's Degree | 0 (0.0%) | 0 (0.0%) |
| Bachelor's Degree | 0 (0.0%) | 0 (0.0%) |
| Graduate Degree | 0 (0.0%) | 0 (0.0%) |
| Total | 0 (0.0%) | 0 (0.0%) |
Employment Characteristics in King Arthur Park
Employment by Class of Employer in King Arthur Park
Among the 1,397 employed individuals in King Arthur Park, private company employees (842 | 60.3%), local government employees (211 | 15.1%), and self-employed (not incorporated) (193 | 13.8%) make up the most common classes of employment.
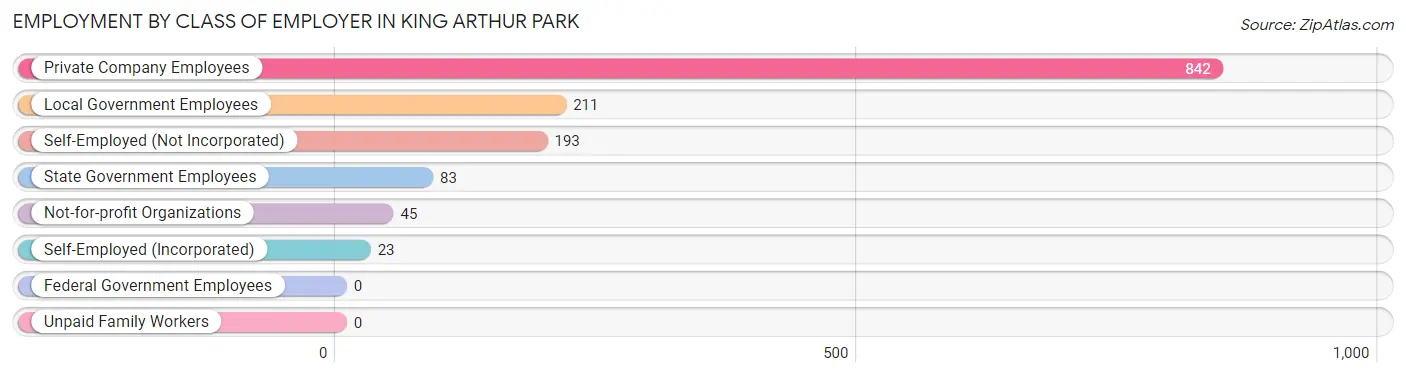
| Employer Class | # Employees | % Employees |
| Private Company Employees | 842 | 60.3% |
| Self-Employed (Incorporated) | 23 | 1.7% |
| Self-Employed (Not Incorporated) | 193 | 13.8% |
| Not-for-profit Organizations | 45 | 3.2% |
| Local Government Employees | 211 | 15.1% |
| State Government Employees | 83 | 5.9% |
| Federal Government Employees | 0 | 0.0% |
| Unpaid Family Workers | 0 | 0.0% |
| Total | 1,397 | 100.0% |
Employment Status by Age in King Arthur Park
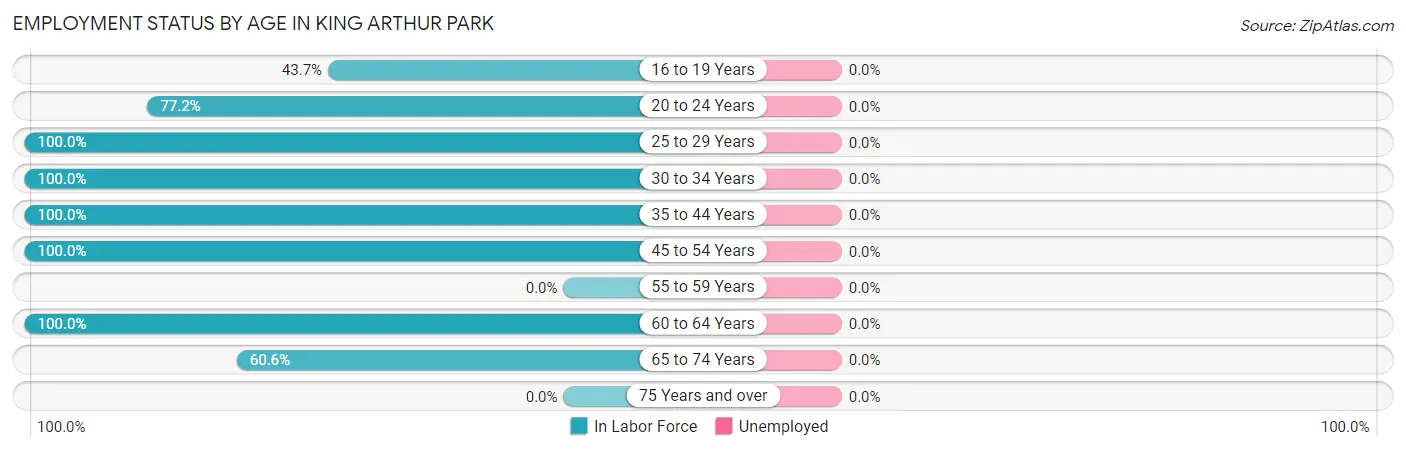
| Age Bracket | In Labor Force | Unemployed |
| 16 to 19 Years | 45 (43.7%) | 0 (0.0%) |
| 20 to 24 Years | 125 (77.2%) | 0 (0.0%) |
| 25 to 29 Years | 101 (100.0%) | 0 (0.0%) |
| 30 to 34 Years | 200 (100.0%) | 0 (0.0%) |
| 35 to 44 Years | 574 (100.0%) | 0 (0.0%) |
| 45 to 54 Years | 189 (100.0%) | 0 (0.0%) |
| 55 to 59 Years | 0 (0.0%) | 0 (0.0%) |
| 60 to 64 Years | 34 (100.0%) | 0 (0.0%) |
| 65 to 74 Years | 129 (60.6%) | 0 (0.0%) |
| 75 Years and over | 0 (0.0%) | 0 (0.0%) |
| Total | 1,396 (88.6%) | 0 (0.0%) |
Employment Status by Educational Attainment in King Arthur Park
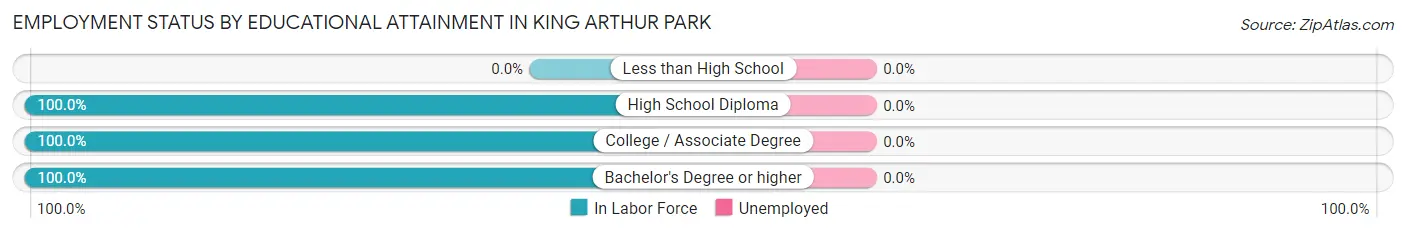
| Educational Attainment | In Labor Force | Unemployed |
| Less than High School | 0 (0.0%) | 0 (0.0%) |
| High School Diploma | 219 (100.0%) | 0 (0.0%) |
| College / Associate Degree | 469 (100.0%) | 0 (0.0%) |
| Bachelor's Degree or higher | 410 (100.0%) | 0 (0.0%) |
| Total | 1,098 (100.0%) | 0 (0.0%) |
Employment Occupations by Sex in King Arthur Park
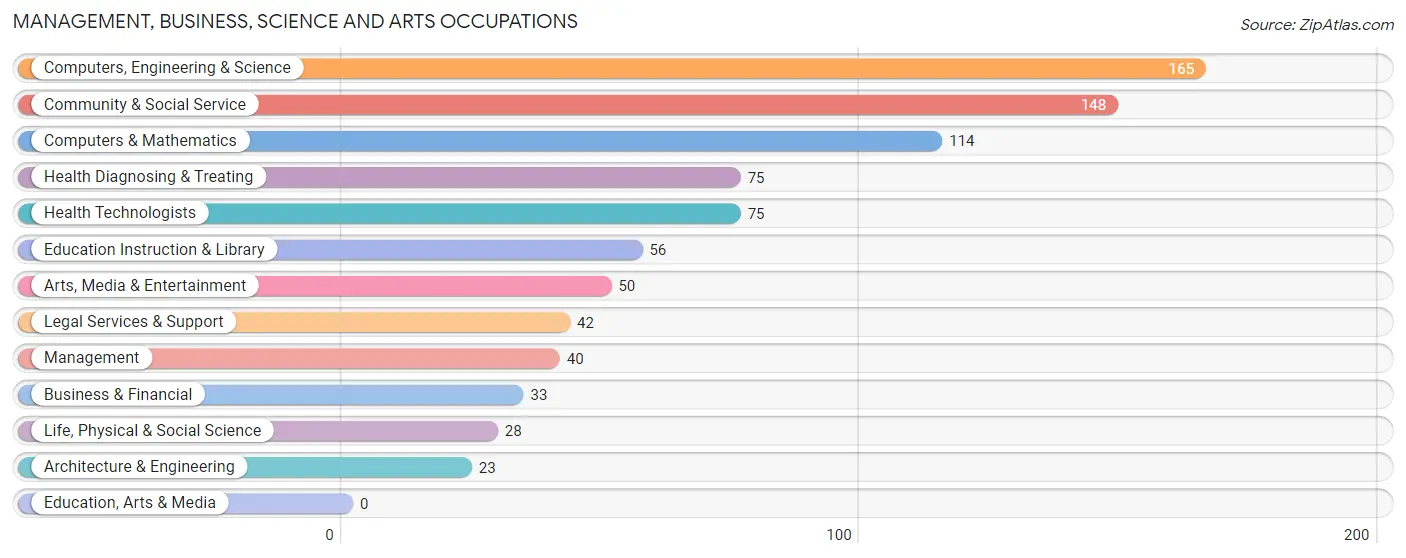
Management, Business, Science and Arts Occupations
The most common Management, Business, Science and Arts occupations in King Arthur Park are Computers, Engineering & Science (165 | 11.8%), Community & Social Service (148 | 10.6%), Computers & Mathematics (114 | 8.2%), Health Diagnosing & Treating (75 | 5.4%), and Health Technologists (75 | 5.4%).
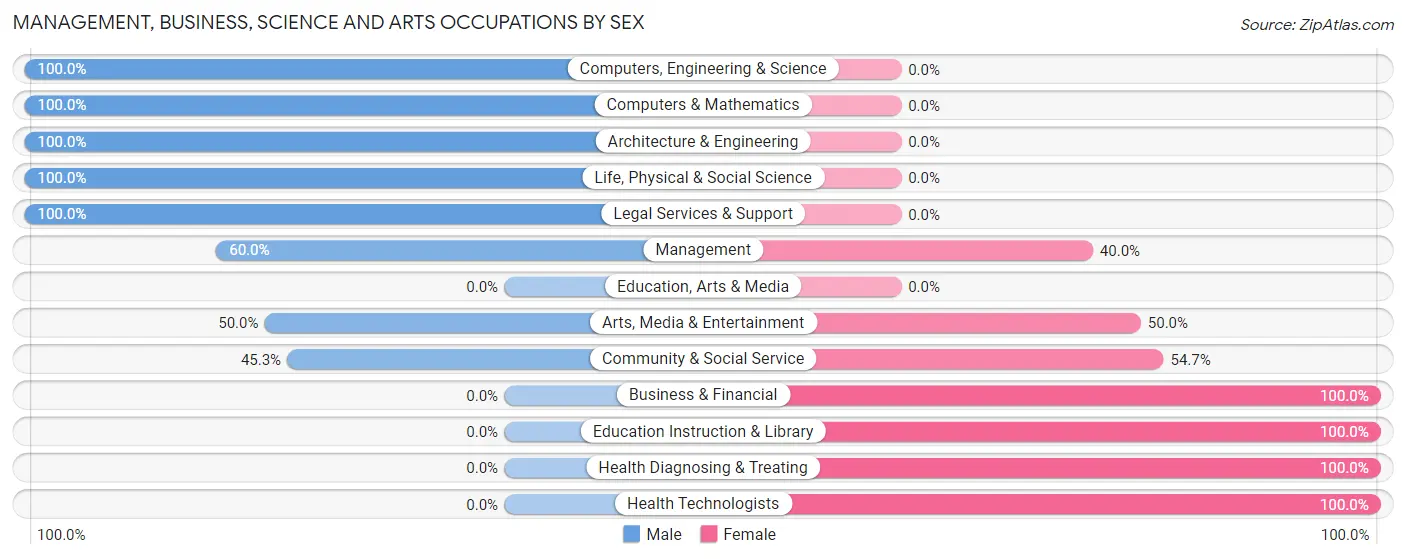
Management, Business, Science and Arts Occupations by Sex
Within the Management, Business, Science and Arts occupations in King Arthur Park, the most male-oriented occupations are Computers, Engineering & Science (100.0%), Computers & Mathematics (100.0%), and Architecture & Engineering (100.0%), while the most female-oriented occupations are Business & Financial (100.0%), Education Instruction & Library (100.0%), and Health Diagnosing & Treating (100.0%).
| Occupation | Male | Female |
| Management | 24 (60.0%) | 16 (40.0%) |
| Business & Financial | 0 (0.0%) | 33 (100.0%) |
| Computers, Engineering & Science | 165 (100.0%) | 0 (0.0%) |
| Computers & Mathematics | 114 (100.0%) | 0 (0.0%) |
| Architecture & Engineering | 23 (100.0%) | 0 (0.0%) |
| Life, Physical & Social Science | 28 (100.0%) | 0 (0.0%) |
| Community & Social Service | 67 (45.3%) | 81 (54.7%) |
| Education, Arts & Media | 0 (0.0%) | 0 (0.0%) |
| Legal Services & Support | 42 (100.0%) | 0 (0.0%) |
| Education Instruction & Library | 0 (0.0%) | 56 (100.0%) |
| Arts, Media & Entertainment | 25 (50.0%) | 25 (50.0%) |
| Health Diagnosing & Treating | 0 (0.0%) | 75 (100.0%) |
| Health Technologists | 0 (0.0%) | 75 (100.0%) |
| Total (Category) | 256 (55.5%) | 205 (44.5%) |
| Total (Overall) | 956 (68.4%) | 441 (31.6%) |
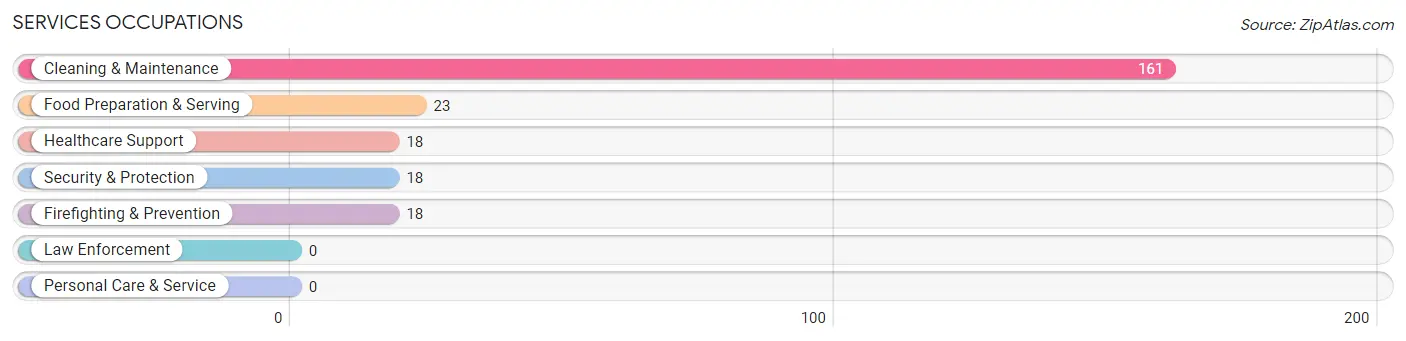
Services Occupations
The most common Services occupations in King Arthur Park are Cleaning & Maintenance (161 | 11.5%), Food Preparation & Serving (23 | 1.7%), Healthcare Support (18 | 1.3%), Security & Protection (18 | 1.3%), and Firefighting & Prevention (18 | 1.3%).
Services Occupations by Sex
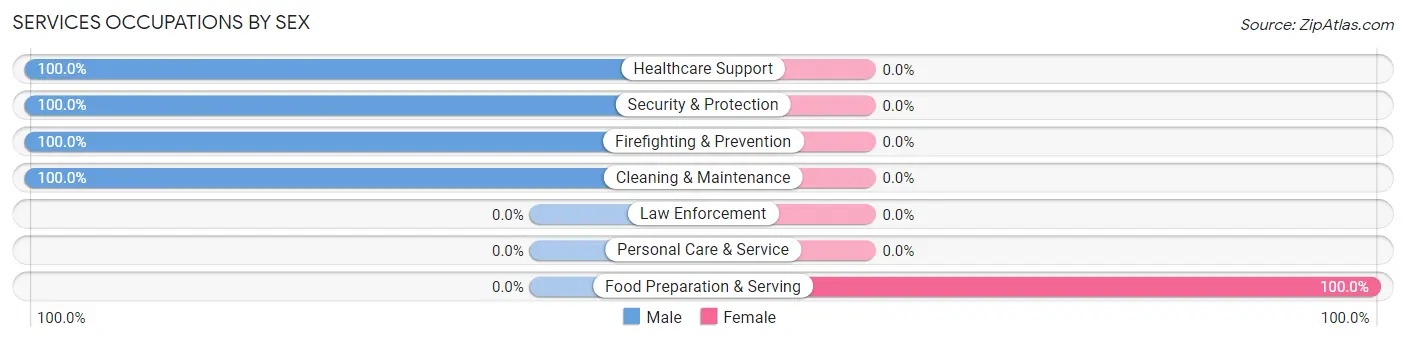
| Occupation | Male | Female |
| Healthcare Support | 18 (100.0%) | 0 (0.0%) |
| Security & Protection | 18 (100.0%) | 0 (0.0%) |
| Firefighting & Prevention | 18 (100.0%) | 0 (0.0%) |
| Law Enforcement | 0 (0.0%) | 0 (0.0%) |
| Food Preparation & Serving | 0 (0.0%) | 23 (100.0%) |
| Cleaning & Maintenance | 161 (100.0%) | 0 (0.0%) |
| Personal Care & Service | 0 (0.0%) | 0 (0.0%) |
| Total (Category) | 197 (89.5%) | 23 (10.4%) |
| Total (Overall) | 956 (68.4%) | 441 (31.6%) |
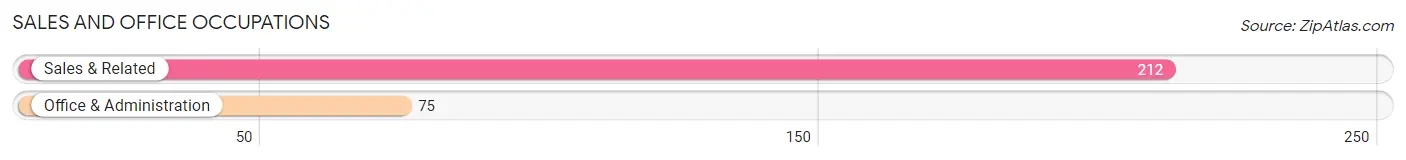
Sales and Office Occupations
The most common Sales and Office occupations in King Arthur Park are Sales & Related (212 | 15.2%), and Office & Administration (75 | 5.4%).
Sales and Office Occupations by Sex
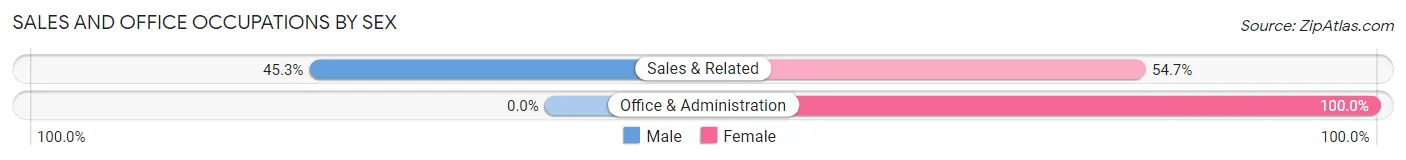
| Occupation | Male | Female |
| Sales & Related | 96 (45.3%) | 116 (54.7%) |
| Office & Administration | 0 (0.0%) | 75 (100.0%) |
| Total (Category) | 96 (33.5%) | 191 (66.5%) |
| Total (Overall) | 956 (68.4%) | 441 (31.6%) |
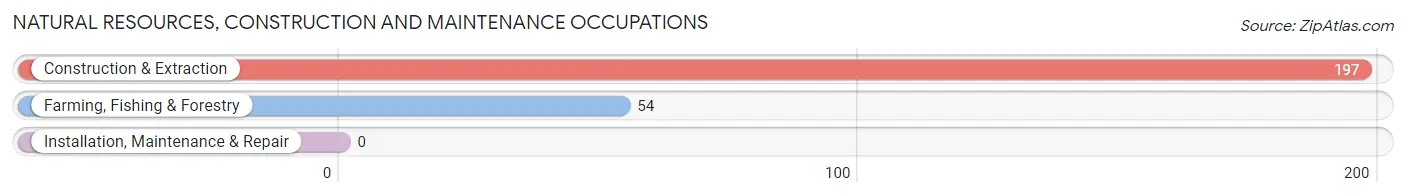
Natural Resources, Construction and Maintenance Occupations
The most common Natural Resources, Construction and Maintenance occupations in King Arthur Park are Construction & Extraction (197 | 14.1%), and Farming, Fishing & Forestry (54 | 3.9%).
Natural Resources, Construction and Maintenance Occupations by Sex
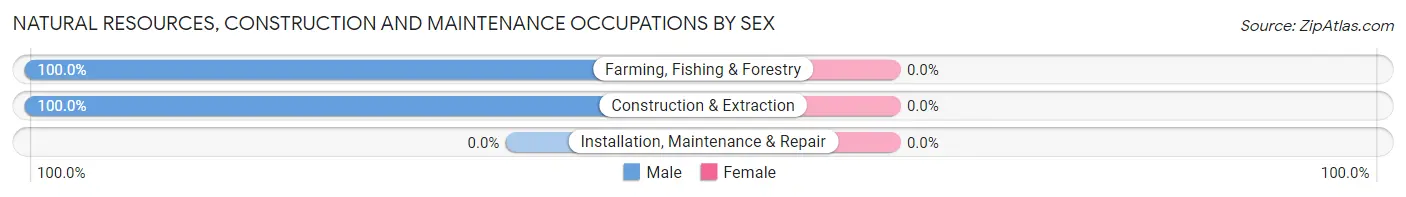
| Occupation | Male | Female |
| Farming, Fishing & Forestry | 54 (100.0%) | 0 (0.0%) |
| Construction & Extraction | 197 (100.0%) | 0 (0.0%) |
| Installation, Maintenance & Repair | 0 (0.0%) | 0 (0.0%) |
| Total (Category) | 251 (100.0%) | 0 (0.0%) |
| Total (Overall) | 956 (68.4%) | 441 (31.6%) |
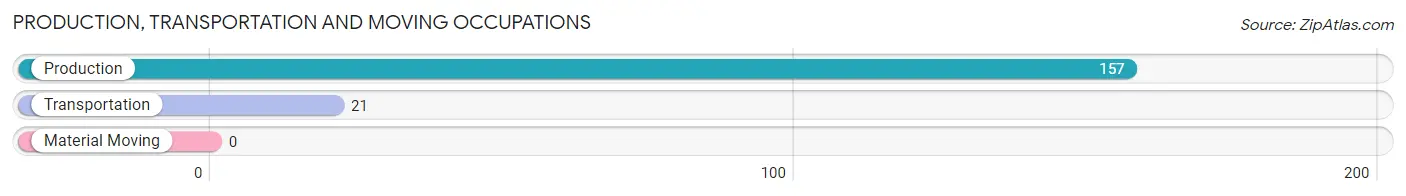
Production, Transportation and Moving Occupations
The most common Production, Transportation and Moving occupations in King Arthur Park are Production (157 | 11.2%), and Transportation (21 | 1.5%).
Production, Transportation and Moving Occupations by Sex
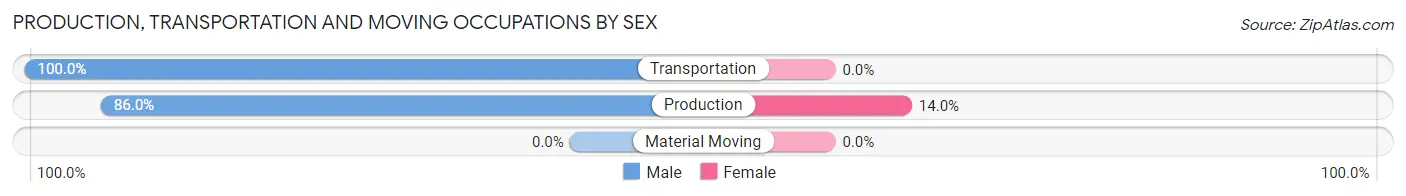
| Occupation | Male | Female |
| Production | 135 (86.0%) | 22 (14.0%) |
| Transportation | 21 (100.0%) | 0 (0.0%) |
| Material Moving | 0 (0.0%) | 0 (0.0%) |
| Total (Category) | 156 (87.6%) | 22 (12.4%) |
| Total (Overall) | 956 (68.4%) | 441 (31.6%) |
Employment Industries by Sex in King Arthur Park
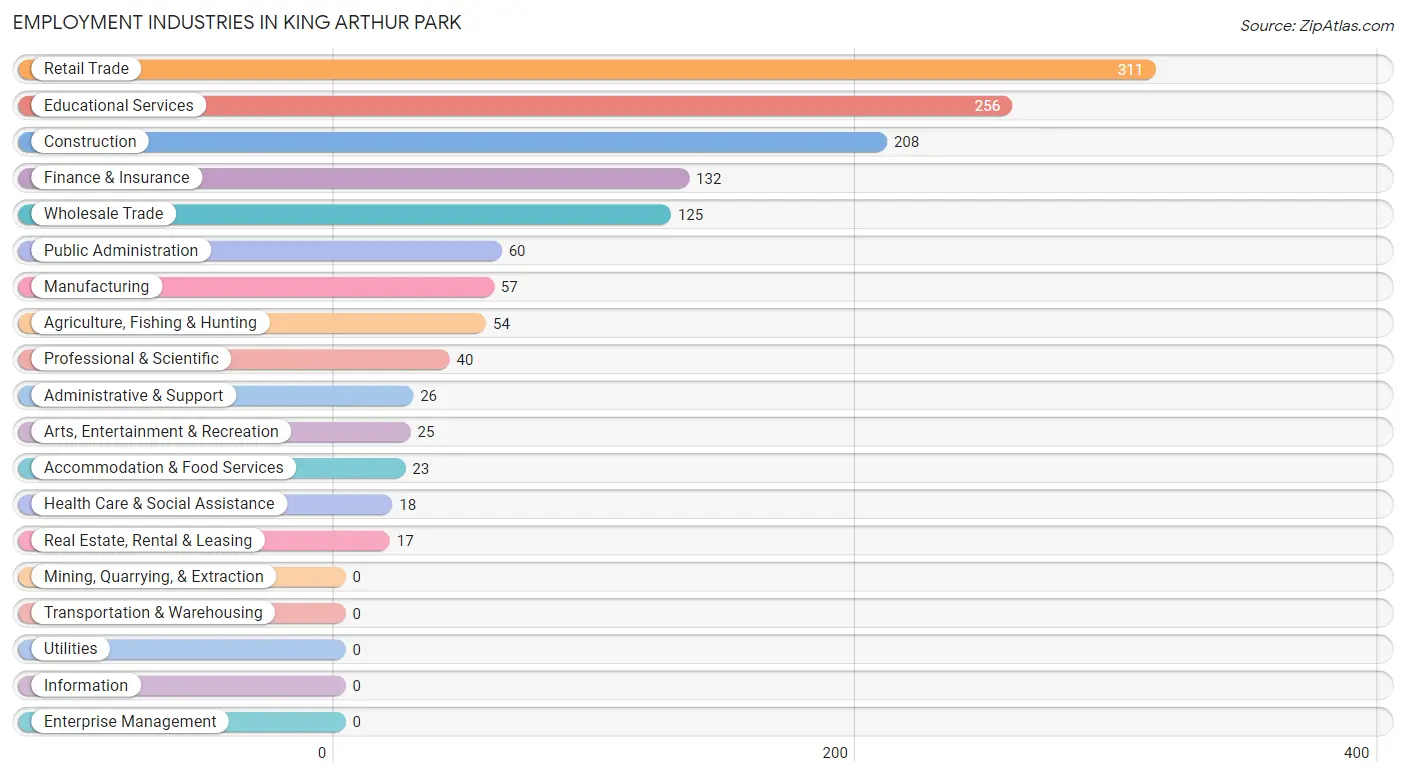
Employment Industries in King Arthur Park
The major employment industries in King Arthur Park include Retail Trade (311 | 22.3%), Educational Services (256 | 18.3%), Construction (208 | 14.9%), Finance & Insurance (132 | 9.5%), and Wholesale Trade (125 | 8.9%).
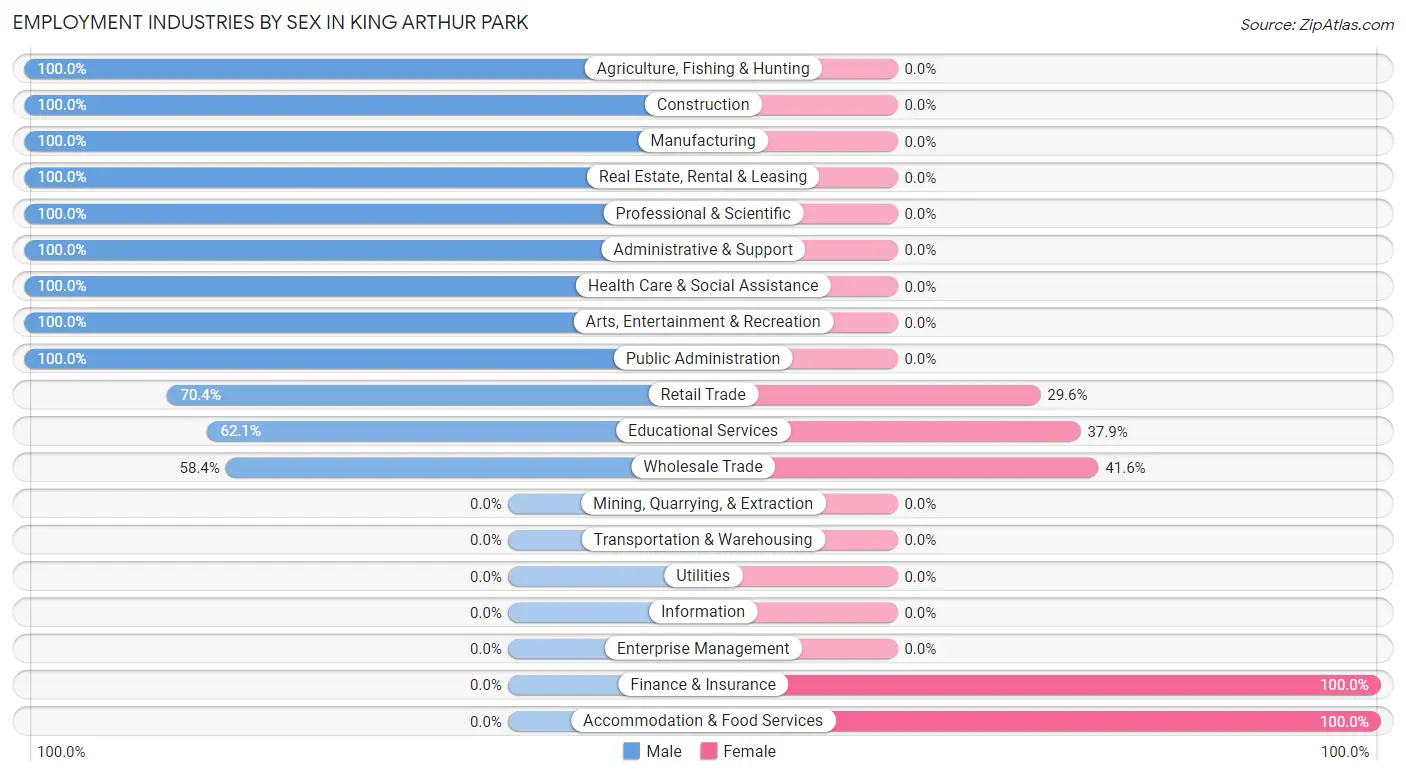
Employment Industries by Sex in King Arthur Park
The King Arthur Park industries that see more men than women are Agriculture, Fishing & Hunting (100.0%), Construction (100.0%), and Manufacturing (100.0%), whereas the industries that tend to have a higher number of women are Finance & Insurance (100.0%), Accommodation & Food Services (100.0%), and Wholesale Trade (41.6%).
| Industry | Male | Female |
| Agriculture, Fishing & Hunting | 54 (100.0%) | 0 (0.0%) |
| Mining, Quarrying, & Extraction | 0 (0.0%) | 0 (0.0%) |
| Construction | 208 (100.0%) | 0 (0.0%) |
| Manufacturing | 57 (100.0%) | 0 (0.0%) |
| Wholesale Trade | 73 (58.4%) | 52 (41.6%) |
| Retail Trade | 219 (70.4%) | 92 (29.6%) |
| Transportation & Warehousing | 0 (0.0%) | 0 (0.0%) |
| Utilities | 0 (0.0%) | 0 (0.0%) |
| Information | 0 (0.0%) | 0 (0.0%) |
| Finance & Insurance | 0 (0.0%) | 132 (100.0%) |
| Real Estate, Rental & Leasing | 17 (100.0%) | 0 (0.0%) |
| Professional & Scientific | 40 (100.0%) | 0 (0.0%) |
| Enterprise Management | 0 (0.0%) | 0 (0.0%) |
| Administrative & Support | 26 (100.0%) | 0 (0.0%) |
| Educational Services | 159 (62.1%) | 97 (37.9%) |
| Health Care & Social Assistance | 18 (100.0%) | 0 (0.0%) |
| Arts, Entertainment & Recreation | 25 (100.0%) | 0 (0.0%) |
| Accommodation & Food Services | 0 (0.0%) | 23 (100.0%) |
| Public Administration | 60 (100.0%) | 0 (0.0%) |
| Total | 956 (68.4%) | 441 (31.6%) |
Education in King Arthur Park
School Enrollment in King Arthur Park
The most common levels of schooling among the 455 students in King Arthur Park are middle school (196 | 43.1%), college / undergraduate (121 | 26.6%), and elementary school (98 | 21.5%).
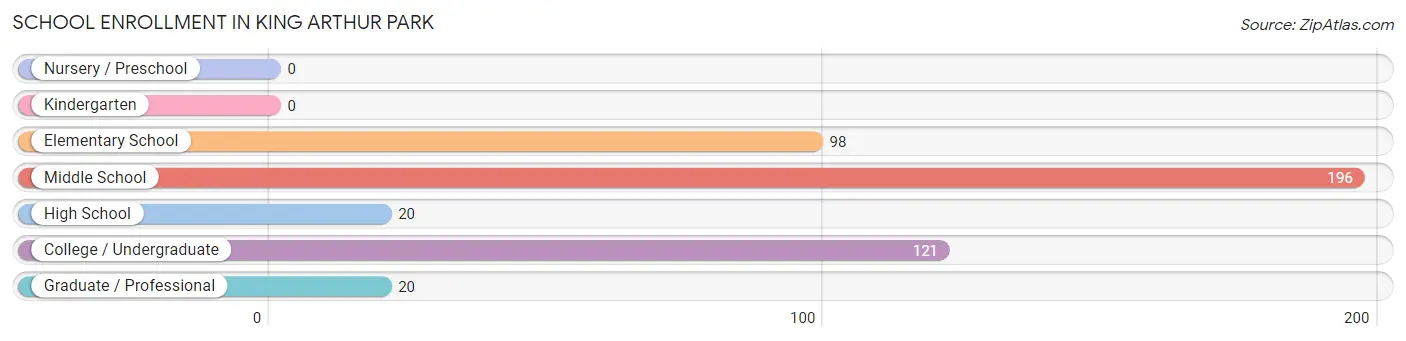
| School Level | # Students | % Students |
| Nursery / Preschool | 0 | 0.0% |
| Kindergarten | 0 | 0.0% |
| Elementary School | 98 | 21.5% |
| Middle School | 196 | 43.1% |
| High School | 20 | 4.4% |
| College / Undergraduate | 121 | 26.6% |
| Graduate / Professional | 20 | 4.4% |
| Total | 455 | 100.0% |
School Enrollment by Age by Funding Source in King Arthur Park
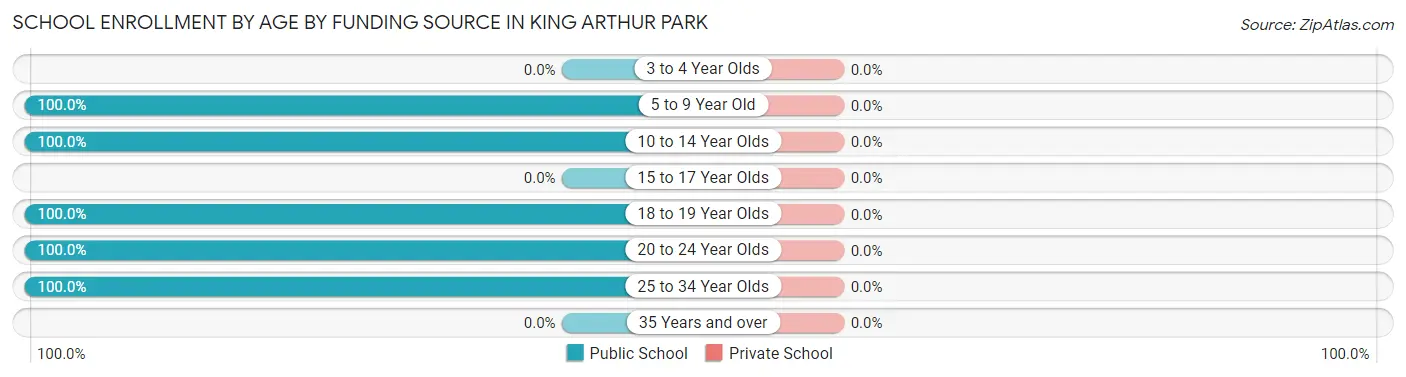
| Age Bracket | Public School | Private School |
| 3 to 4 Year Olds | 0 (0.0%) | 0 (0.0%) |
| 5 to 9 Year Old | 81 (100.0%) | 0 (0.0%) |
| 10 to 14 Year Olds | 213 (100.0%) | 0 (0.0%) |
| 15 to 17 Year Olds | 0 (0.0%) | 0 (0.0%) |
| 18 to 19 Year Olds | 41 (100.0%) | 0 (0.0%) |
| 20 to 24 Year Olds | 98 (100.0%) | 0 (0.0%) |
| 25 to 34 Year Olds | 22 (100.0%) | 0 (0.0%) |
| 35 Years and over | 0 (0.0%) | 0 (0.0%) |
| Total | 455 (100.0%) | 0 (0.0%) |
Educational Attainment by Field of Study in King Arthur Park
Business (122 | 23.8%), science & technology (102 | 19.9%), education (98 | 19.1%), bio, nature & agricultural (48 | 9.4%), and engineering (46 | 9.0%) are the most common fields of study among 513 individuals in King Arthur Park who have obtained a bachelor's degree or higher.
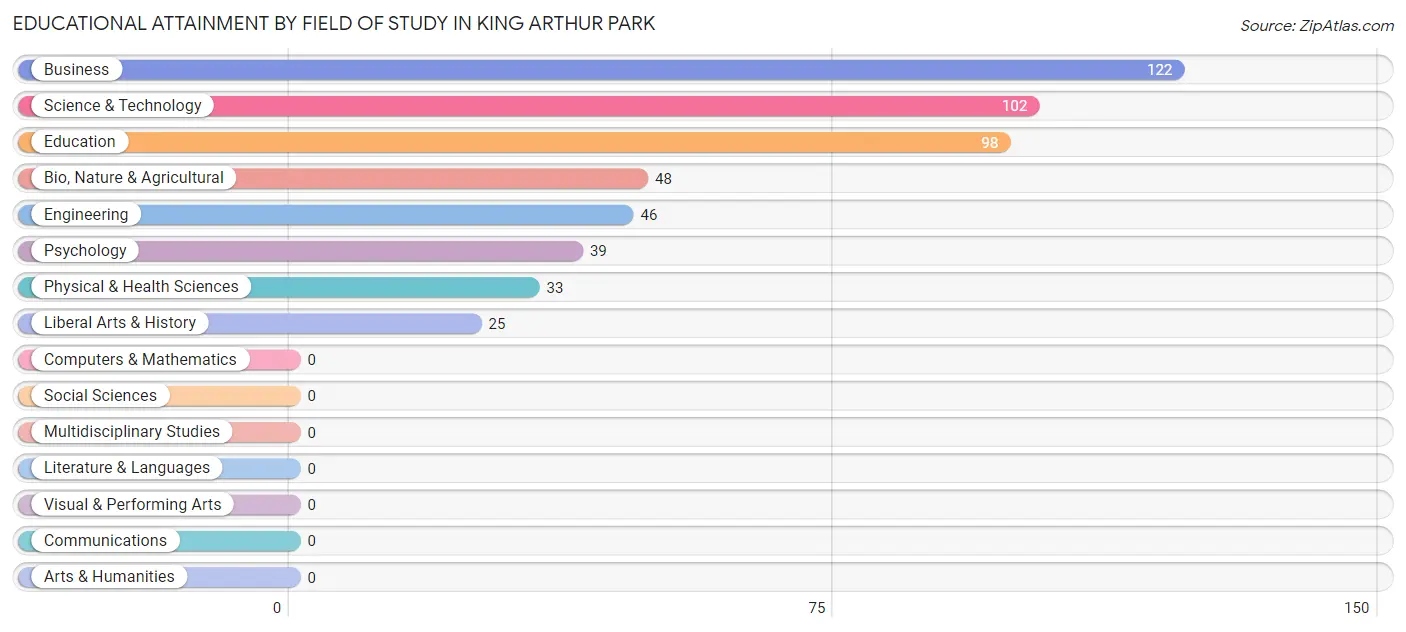
| Field of Study | # Graduates | % Graduates |
| Computers & Mathematics | 0 | 0.0% |
| Bio, Nature & Agricultural | 48 | 9.4% |
| Physical & Health Sciences | 33 | 6.4% |
| Psychology | 39 | 7.6% |
| Social Sciences | 0 | 0.0% |
| Engineering | 46 | 9.0% |
| Multidisciplinary Studies | 0 | 0.0% |
| Science & Technology | 102 | 19.9% |
| Business | 122 | 23.8% |
| Education | 98 | 19.1% |
| Literature & Languages | 0 | 0.0% |
| Liberal Arts & History | 25 | 4.9% |
| Visual & Performing Arts | 0 | 0.0% |
| Communications | 0 | 0.0% |
| Arts & Humanities | 0 | 0.0% |
| Total | 513 | 100.0% |
Transportation & Commute in King Arthur Park
Vehicle Availability by Sex in King Arthur Park
The most prevalent vehicle ownership categories in King Arthur Park are males with 5 or more vehicles (355, accounting for 37.1%) and females with 5 or more vehicles (52, making up 80.5%).
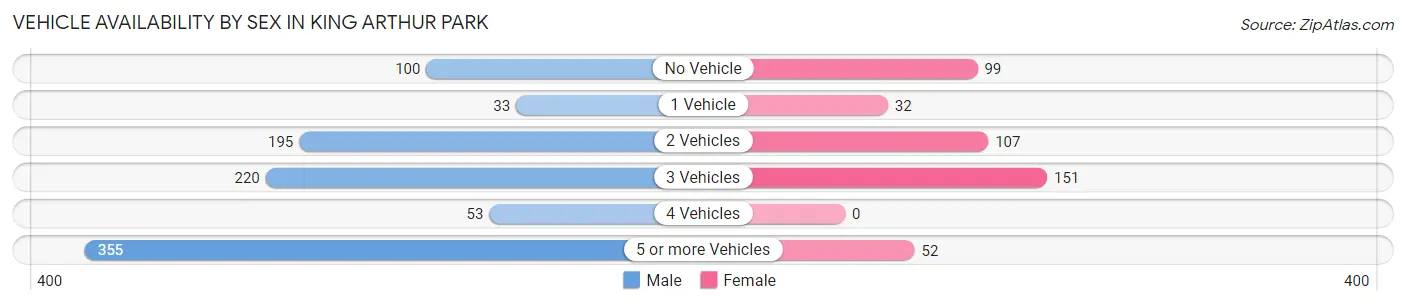
| Vehicles Available | Male | Female |
| No Vehicle | 100 (10.5%) | 99 (22.5%) |
| 1 Vehicle | 33 (3.5%) | 32 (7.3%) |
| 2 Vehicles | 195 (20.4%) | 107 (24.3%) |
| 3 Vehicles | 220 (23.0%) | 151 (34.2%) |
| 4 Vehicles | 53 (5.5%) | 0 (0.0%) |
| 5 or more Vehicles | 355 (37.1%) | 52 (11.8%) |
| Total | 956 (100.0%) | 441 (100.0%) |
Commute Time in King Arthur Park
The most frequently occuring commute durations in King Arthur Park are 15 to 19 minutes (461 commuters, 38.8%), 10 to 14 minutes (281 commuters, 23.6%), and 60 to 89 minutes (109 commuters, 9.2%).
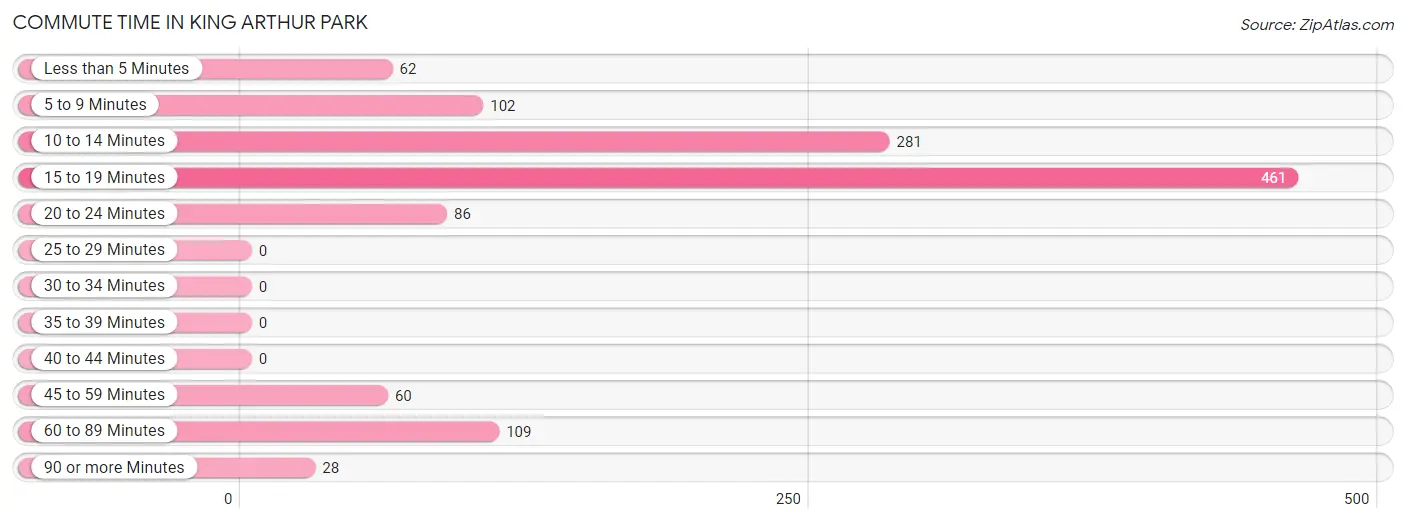
| Commute Time | # Commuters | % Commuters |
| Less than 5 Minutes | 62 | 5.2% |
| 5 to 9 Minutes | 102 | 8.6% |
| 10 to 14 Minutes | 281 | 23.6% |
| 15 to 19 Minutes | 461 | 38.8% |
| 20 to 24 Minutes | 86 | 7.2% |
| 25 to 29 Minutes | 0 | 0.0% |
| 30 to 34 Minutes | 0 | 0.0% |
| 35 to 39 Minutes | 0 | 0.0% |
| 40 to 44 Minutes | 0 | 0.0% |
| 45 to 59 Minutes | 60 | 5.1% |
| 60 to 89 Minutes | 109 | 9.2% |
| 90 or more Minutes | 28 | 2.4% |
Commute Time by Sex in King Arthur Park
The most common commute times in King Arthur Park are 15 to 19 minutes (250 commuters, 29.2%) for males and 15 to 19 minutes (211 commuters, 63.2%) for females.
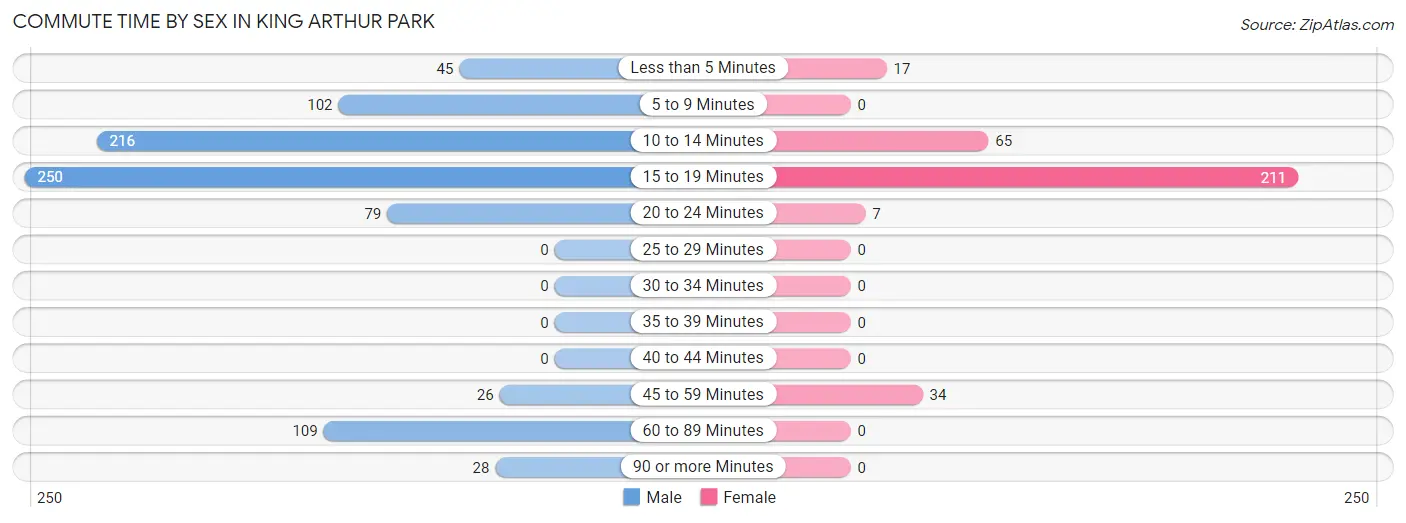
| Commute Time | Male | Female |
| Less than 5 Minutes | 45 (5.3%) | 17 (5.1%) |
| 5 to 9 Minutes | 102 (11.9%) | 0 (0.0%) |
| 10 to 14 Minutes | 216 (25.3%) | 65 (19.5%) |
| 15 to 19 Minutes | 250 (29.2%) | 211 (63.2%) |
| 20 to 24 Minutes | 79 (9.2%) | 7 (2.1%) |
| 25 to 29 Minutes | 0 (0.0%) | 0 (0.0%) |
| 30 to 34 Minutes | 0 (0.0%) | 0 (0.0%) |
| 35 to 39 Minutes | 0 (0.0%) | 0 (0.0%) |
| 40 to 44 Minutes | 0 (0.0%) | 0 (0.0%) |
| 45 to 59 Minutes | 26 (3.0%) | 34 (10.2%) |
| 60 to 89 Minutes | 109 (12.8%) | 0 (0.0%) |
| 90 or more Minutes | 28 (3.3%) | 0 (0.0%) |
Time of Departure to Work by Sex in King Arthur Park
The most frequent times of departure to work in King Arthur Park are 7:30 AM to 7:59 AM (201, 23.5%) for males and 8:00 AM to 8:29 AM (106, 31.7%) for females.
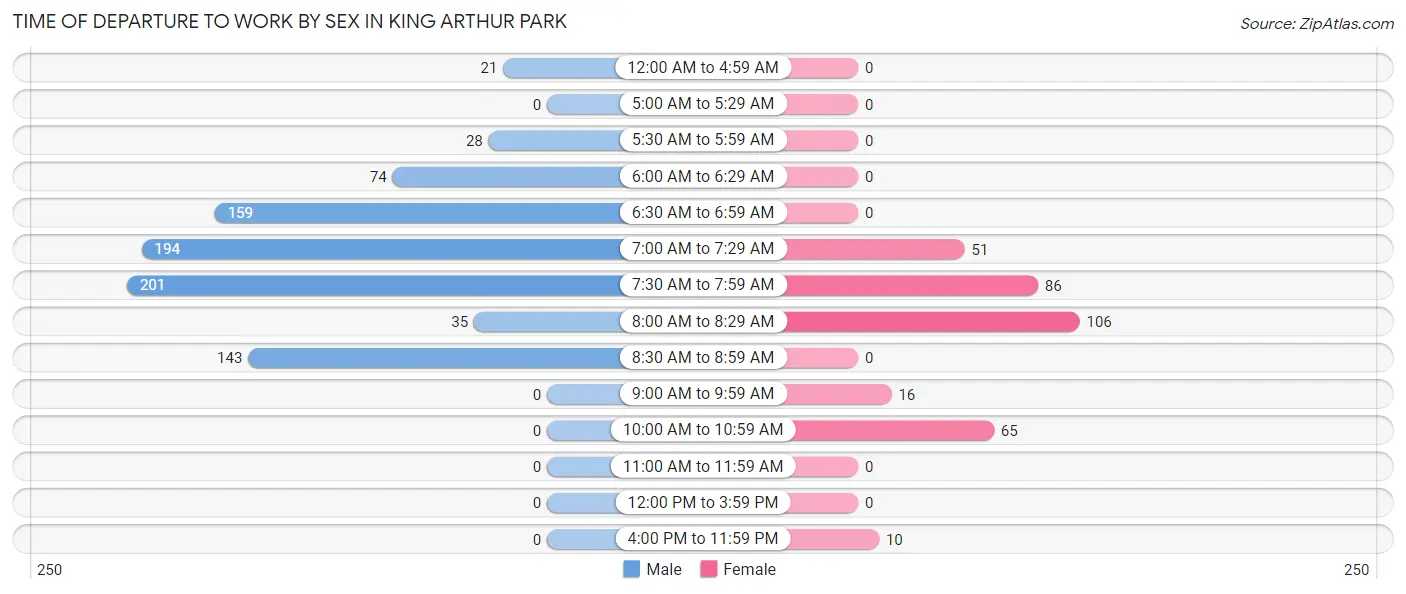
| Time of Departure | Male | Female |
| 12:00 AM to 4:59 AM | 21 (2.5%) | 0 (0.0%) |
| 5:00 AM to 5:29 AM | 0 (0.0%) | 0 (0.0%) |
| 5:30 AM to 5:59 AM | 28 (3.3%) | 0 (0.0%) |
| 6:00 AM to 6:29 AM | 74 (8.6%) | 0 (0.0%) |
| 6:30 AM to 6:59 AM | 159 (18.6%) | 0 (0.0%) |
| 7:00 AM to 7:29 AM | 194 (22.7%) | 51 (15.3%) |
| 7:30 AM to 7:59 AM | 201 (23.5%) | 86 (25.8%) |
| 8:00 AM to 8:29 AM | 35 (4.1%) | 106 (31.7%) |
| 8:30 AM to 8:59 AM | 143 (16.7%) | 0 (0.0%) |
| 9:00 AM to 9:59 AM | 0 (0.0%) | 16 (4.8%) |
| 10:00 AM to 10:59 AM | 0 (0.0%) | 65 (19.5%) |
| 11:00 AM to 11:59 AM | 0 (0.0%) | 0 (0.0%) |
| 12:00 PM to 3:59 PM | 0 (0.0%) | 0 (0.0%) |
| 4:00 PM to 11:59 PM | 0 (0.0%) | 10 (3.0%) |
| Total | 855 (100.0%) | 334 (100.0%) |
Housing Occupancy in King Arthur Park
Occupancy by Ownership in King Arthur Park
Of the total 614 dwellings in King Arthur Park, owner-occupied units account for 515 (83.9%), while renter-occupied units make up 99 (16.1%).
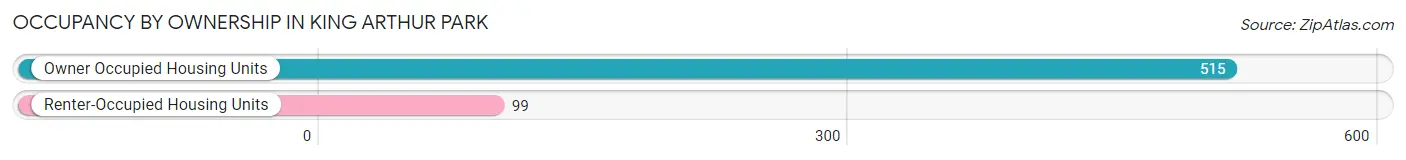
| Occupancy | # Housing Units | % Housing Units |
| Owner Occupied Housing Units | 515 | 83.9% |
| Renter-Occupied Housing Units | 99 | 16.1% |
| Total Occupied Housing Units | 614 | 100.0% |
Occupancy by Household Size in King Arthur Park
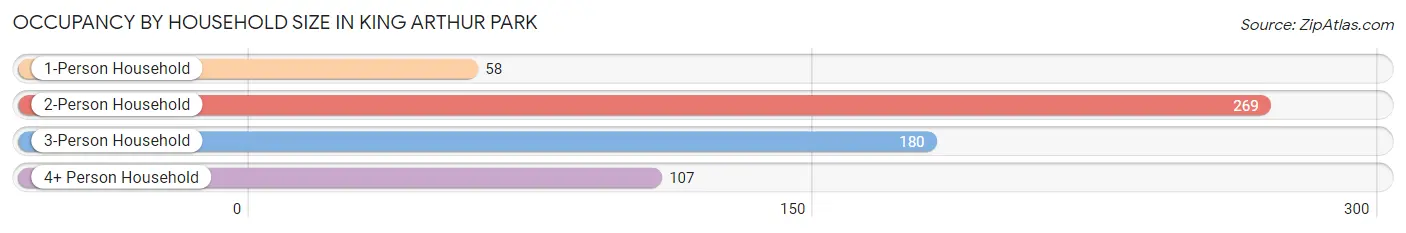
| Household Size | # Housing Units | % Housing Units |
| 1-Person Household | 58 | 9.5% |
| 2-Person Household | 269 | 43.8% |
| 3-Person Household | 180 | 29.3% |
| 4+ Person Household | 107 | 17.4% |
| Total Housing Units | 614 | 100.0% |
Occupancy by Ownership by Household Size in King Arthur Park
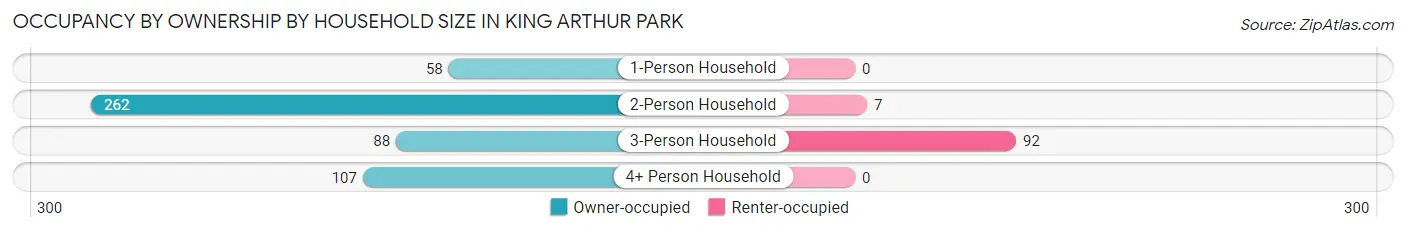
| Household Size | Owner-occupied | Renter-occupied |
| 1-Person Household | 58 (100.0%) | 0 (0.0%) |
| 2-Person Household | 262 (97.4%) | 7 (2.6%) |
| 3-Person Household | 88 (48.9%) | 92 (51.1%) |
| 4+ Person Household | 107 (100.0%) | 0 (0.0%) |
| Total Housing Units | 515 (83.9%) | 99 (16.1%) |
Occupancy by Educational Attainment in King Arthur Park
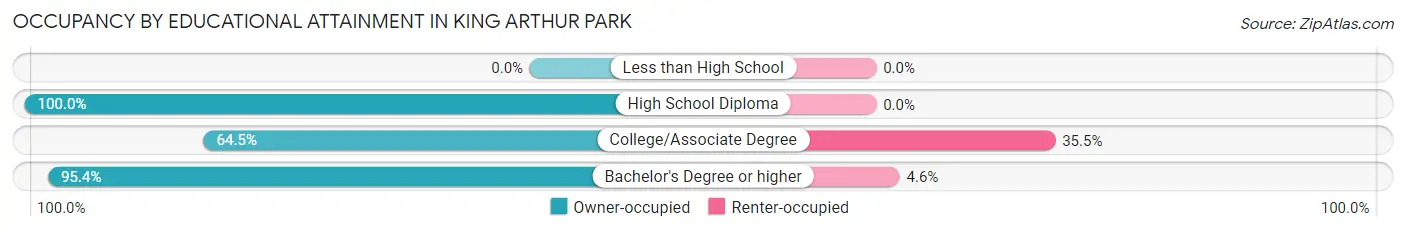
| Household Size | Owner-occupied | Renter-occupied |
| Less than High School | 0 (0.0%) | 0 (0.0%) |
| High School Diploma | 17 (100.0%) | 0 (0.0%) |
| College/Associate Degree | 149 (64.5%) | 82 (35.5%) |
| Bachelor's Degree or higher | 349 (95.4%) | 17 (4.6%) |
Occupancy by Age of Householder in King Arthur Park
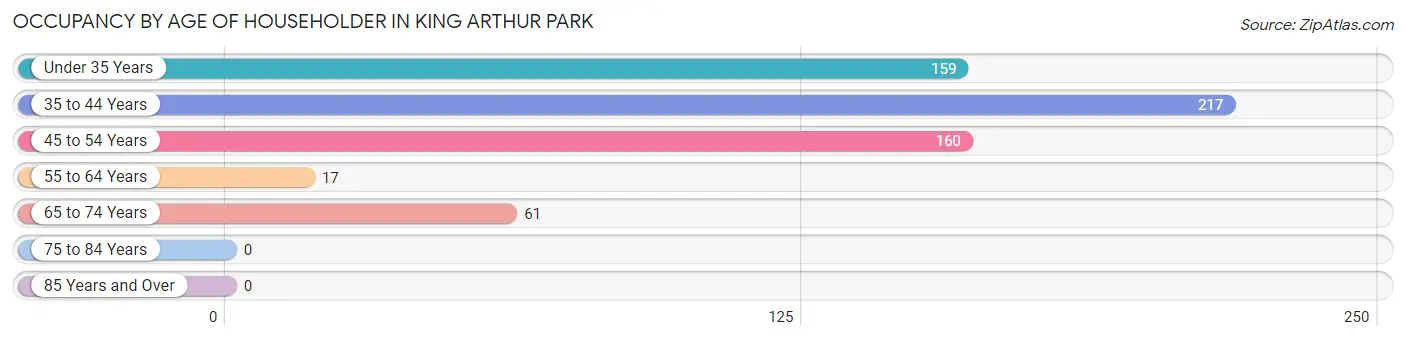
| Age Bracket | # Households | % Households |
| Under 35 Years | 159 | 25.9% |
| 35 to 44 Years | 217 | 35.3% |
| 45 to 54 Years | 160 | 26.1% |
| 55 to 64 Years | 17 | 2.8% |
| 65 to 74 Years | 61 | 9.9% |
| 75 to 84 Years | 0 | 0.0% |
| 85 Years and Over | 0 | 0.0% |
| Total | 614 | 100.0% |
Housing Finances in King Arthur Park
Median Income by Occupancy in King Arthur Park
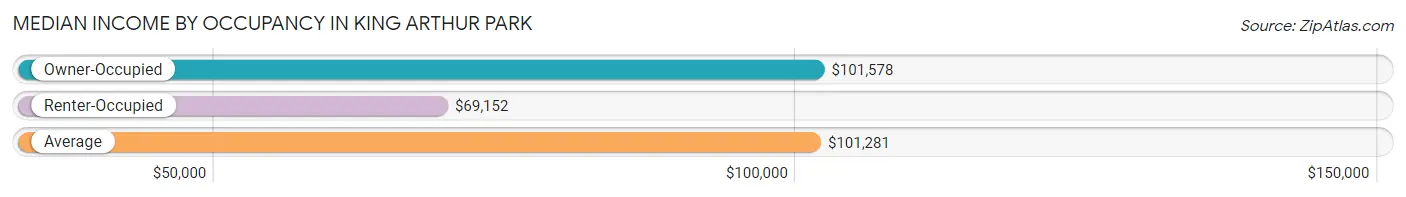
| Occupancy Type | # Households | Median Income |
| Owner-Occupied | 515 (83.9%) | $101,578 |
| Renter-Occupied | 99 (16.1%) | $69,152 |
| Average | 614 (100.0%) | $101,281 |
Occupancy by Householder Income Bracket in King Arthur Park
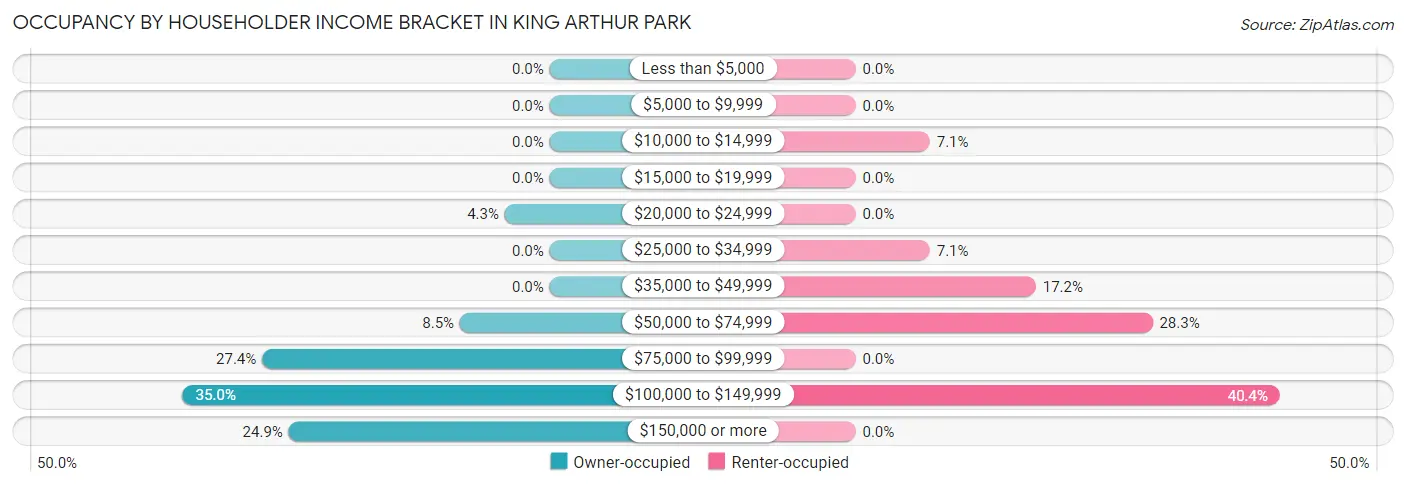
| Income Bracket | Owner-occupied | Renter-occupied |
| Less than $5,000 | 0 (0.0%) | 0 (0.0%) |
| $5,000 to $9,999 | 0 (0.0%) | 0 (0.0%) |
| $10,000 to $14,999 | 0 (0.0%) | 7 (7.1%) |
| $15,000 to $19,999 | 0 (0.0%) | 0 (0.0%) |
| $20,000 to $24,999 | 22 (4.3%) | 0 (0.0%) |
| $25,000 to $34,999 | 0 (0.0%) | 7 (7.1%) |
| $35,000 to $49,999 | 0 (0.0%) | 17 (17.2%) |
| $50,000 to $74,999 | 44 (8.5%) | 28 (28.3%) |
| $75,000 to $99,999 | 141 (27.4%) | 0 (0.0%) |
| $100,000 to $149,999 | 180 (34.9%) | 40 (40.4%) |
| $150,000 or more | 128 (24.8%) | 0 (0.0%) |
| Total | 515 (100.0%) | 99 (100.0%) |
Monthly Housing Cost Tiers in King Arthur Park
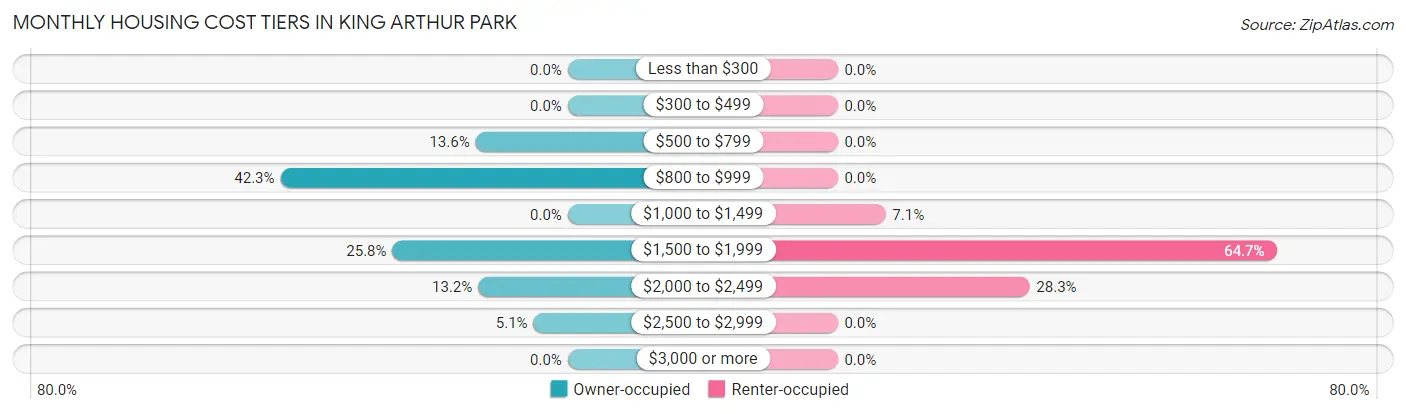
| Monthly Cost | Owner-occupied | Renter-occupied |
| Less than $300 | 0 (0.0%) | 0 (0.0%) |
| $300 to $499 | 0 (0.0%) | 0 (0.0%) |
| $500 to $799 | 70 (13.6%) | 0 (0.0%) |
| $800 to $999 | 218 (42.3%) | 0 (0.0%) |
| $1,000 to $1,499 | 0 (0.0%) | 7 (7.1%) |
| $1,500 to $1,999 | 133 (25.8%) | 64 (64.6%) |
| $2,000 to $2,499 | 68 (13.2%) | 28 (28.3%) |
| $2,500 to $2,999 | 26 (5.1%) | 0 (0.0%) |
| $3,000 or more | 0 (0.0%) | 0 (0.0%) |
| Total | 515 (100.0%) | 99 (100.0%) |
Physical Housing Characteristics in King Arthur Park
Housing Structures in King Arthur Park
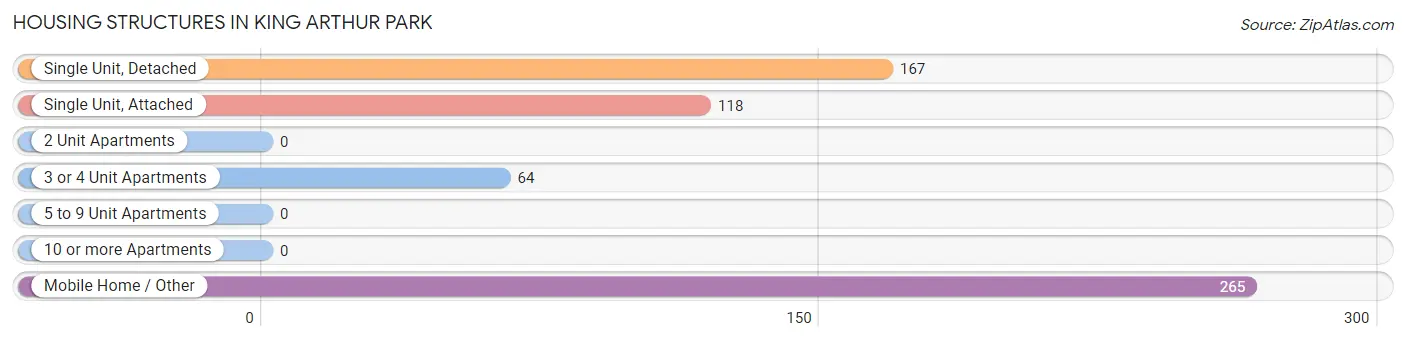
| Structure Type | # Housing Units | % Housing Units |
| Single Unit, Detached | 167 | 27.2% |
| Single Unit, Attached | 118 | 19.2% |
| 2 Unit Apartments | 0 | 0.0% |
| 3 or 4 Unit Apartments | 64 | 10.4% |
| 5 to 9 Unit Apartments | 0 | 0.0% |
| 10 or more Apartments | 0 | 0.0% |
| Mobile Home / Other | 265 | 43.2% |
| Total | 614 | 100.0% |
Housing Structures by Occupancy in King Arthur Park
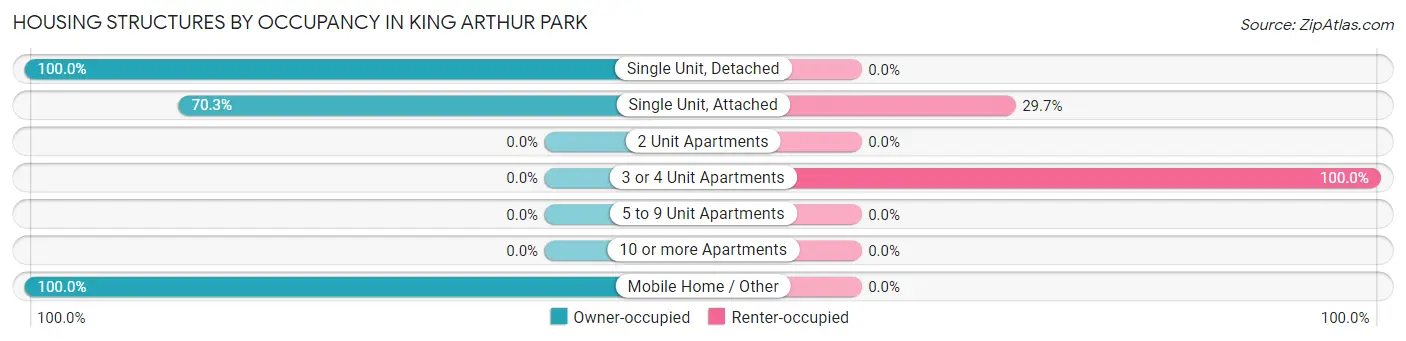
| Structure Type | Owner-occupied | Renter-occupied |
| Single Unit, Detached | 167 (100.0%) | 0 (0.0%) |
| Single Unit, Attached | 83 (70.3%) | 35 (29.7%) |
| 2 Unit Apartments | 0 (0.0%) | 0 (0.0%) |
| 3 or 4 Unit Apartments | 0 (0.0%) | 64 (100.0%) |
| 5 to 9 Unit Apartments | 0 (0.0%) | 0 (0.0%) |
| 10 or more Apartments | 0 (0.0%) | 0 (0.0%) |
| Mobile Home / Other | 265 (100.0%) | 0 (0.0%) |
| Total | 515 (83.9%) | 99 (16.1%) |
Housing Structures by Number of Rooms in King Arthur Park
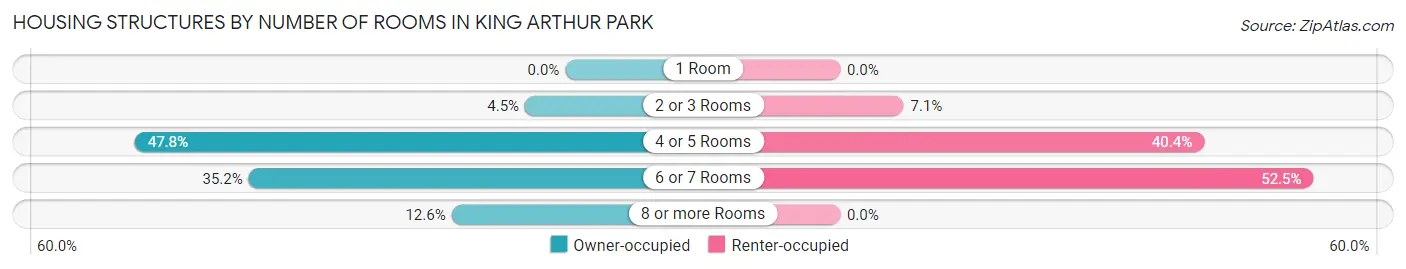
| Number of Rooms | Owner-occupied | Renter-occupied |
| 1 Room | 0 (0.0%) | 0 (0.0%) |
| 2 or 3 Rooms | 23 (4.5%) | 7 (7.1%) |
| 4 or 5 Rooms | 246 (47.8%) | 40 (40.4%) |
| 6 or 7 Rooms | 181 (35.1%) | 52 (52.5%) |
| 8 or more Rooms | 65 (12.6%) | 0 (0.0%) |
| Total | 515 (100.0%) | 99 (100.0%) |
Housing Structure by Heating Type in King Arthur Park
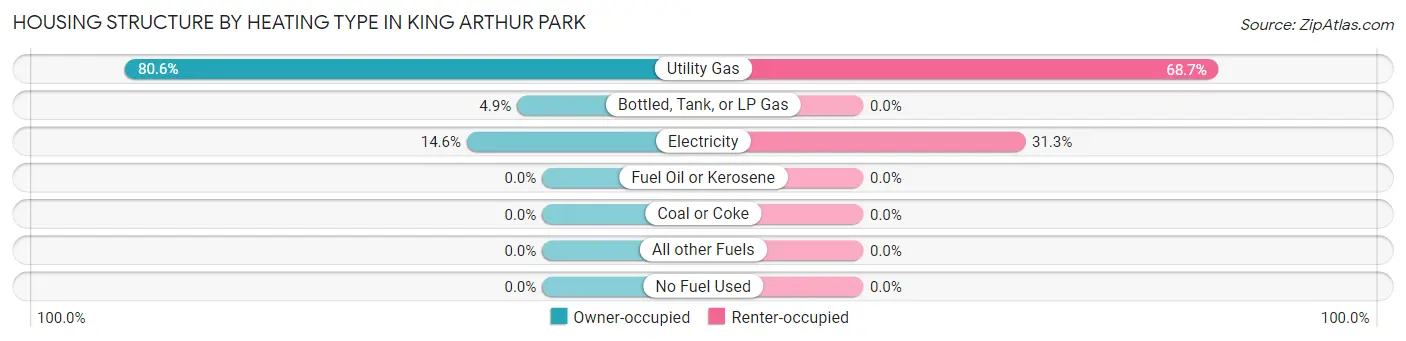
| Heating Type | Owner-occupied | Renter-occupied |
| Utility Gas | 415 (80.6%) | 68 (68.7%) |
| Bottled, Tank, or LP Gas | 25 (4.9%) | 0 (0.0%) |
| Electricity | 75 (14.6%) | 31 (31.3%) |
| Fuel Oil or Kerosene | 0 (0.0%) | 0 (0.0%) |
| Coal or Coke | 0 (0.0%) | 0 (0.0%) |
| All other Fuels | 0 (0.0%) | 0 (0.0%) |
| No Fuel Used | 0 (0.0%) | 0 (0.0%) |
| Total | 515 (100.0%) | 99 (100.0%) |
Household Vehicle Usage in King Arthur Park
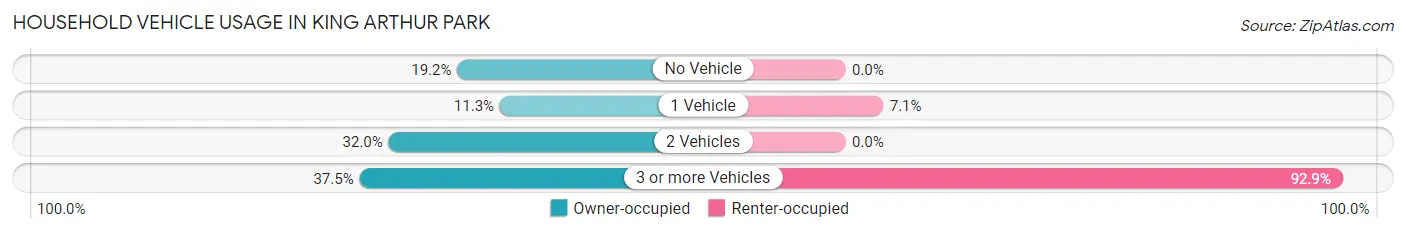
| Vehicles per Household | Owner-occupied | Renter-occupied |
| No Vehicle | 99 (19.2%) | 0 (0.0%) |
| 1 Vehicle | 58 (11.3%) | 7 (7.1%) |
| 2 Vehicles | 165 (32.0%) | 0 (0.0%) |
| 3 or more Vehicles | 193 (37.5%) | 92 (92.9%) |
| Total | 515 (100.0%) | 99 (100.0%) |
Real Estate & Mortgages in King Arthur Park
Real Estate and Mortgage Overview in King Arthur Park
| Characteristic | Without Mortgage | With Mortgage |
| Housing Units | 164 | 351 |
| Median Property Value | $87,500 | $341,900 |
| Median Household Income | $101,875 | $66 |
| Monthly Housing Costs | $846 | $0 |
| Real Estate Taxes | $407 | $0 |
Property Value by Mortgage Status in King Arthur Park
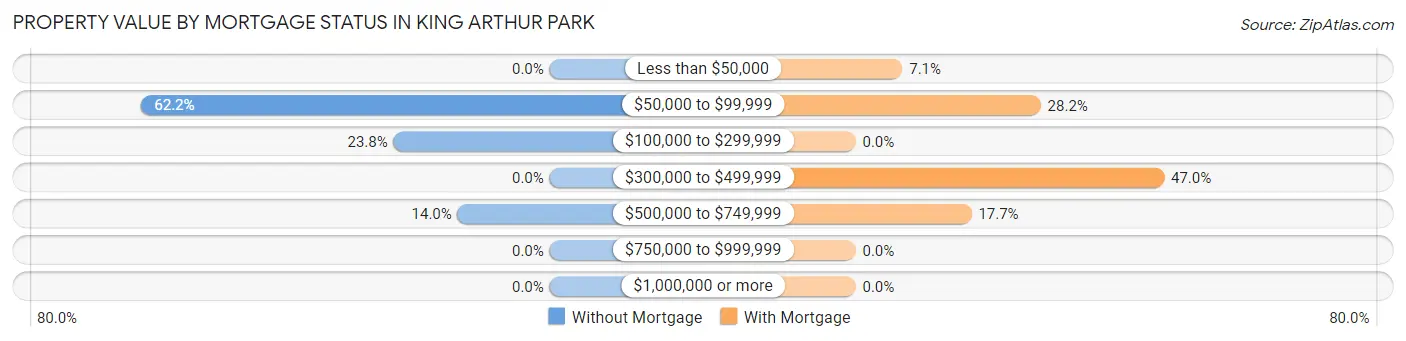
| Property Value | Without Mortgage | With Mortgage |
| Less than $50,000 | 0 (0.0%) | 25 (7.1%) |
| $50,000 to $99,999 | 102 (62.2%) | 99 (28.2%) |
| $100,000 to $299,999 | 39 (23.8%) | 0 (0.0%) |
| $300,000 to $499,999 | 0 (0.0%) | 165 (47.0%) |
| $500,000 to $749,999 | 23 (14.0%) | 62 (17.7%) |
| $750,000 to $999,999 | 0 (0.0%) | 0 (0.0%) |
| $1,000,000 or more | 0 (0.0%) | 0 (0.0%) |
| Total | 164 (100.0%) | 351 (100.0%) |
Household Income by Mortgage Status in King Arthur Park
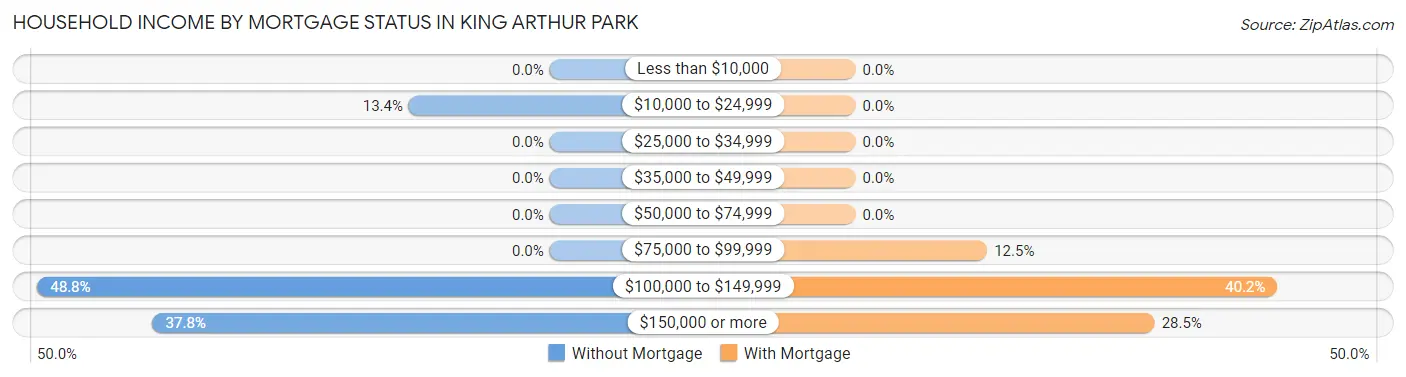
| Household Income | Without Mortgage | With Mortgage |
| Less than $10,000 | 0 (0.0%) | 0 (0.0%) |
| $10,000 to $24,999 | 22 (13.4%) | 0 (0.0%) |
| $25,000 to $34,999 | 0 (0.0%) | 0 (0.0%) |
| $35,000 to $49,999 | 0 (0.0%) | 0 (0.0%) |
| $50,000 to $74,999 | 0 (0.0%) | 0 (0.0%) |
| $75,000 to $99,999 | 0 (0.0%) | 44 (12.5%) |
| $100,000 to $149,999 | 80 (48.8%) | 141 (40.2%) |
| $150,000 or more | 62 (37.8%) | 100 (28.5%) |
| Total | 164 (100.0%) | 351 (100.0%) |
Property Value to Household Income Ratio in King Arthur Park
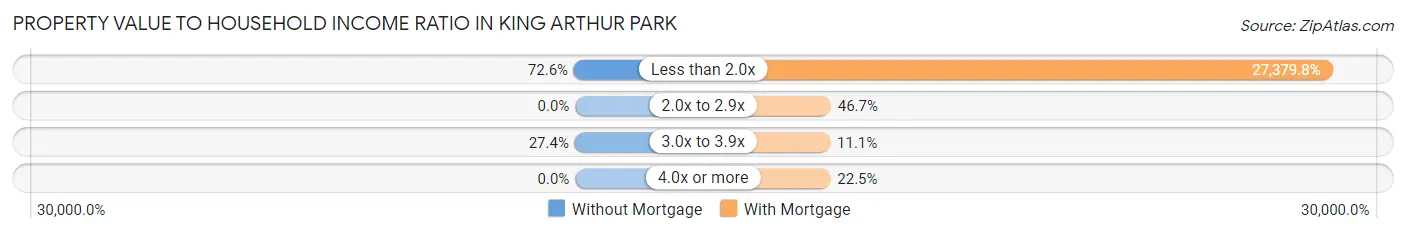
| Value-to-Income Ratio | Without Mortgage | With Mortgage |
| Less than 2.0x | 119 (72.6%) | 96,103 (27,379.8%) |
| 2.0x to 2.9x | 0 (0.0%) | 164 (46.7%) |
| 3.0x to 3.9x | 45 (27.4%) | 39 (11.1%) |
| 4.0x or more | 0 (0.0%) | 79 (22.5%) |
| Total | 164 (100.0%) | 351 (100.0%) |
Real Estate Taxes by Mortgage Status in King Arthur Park
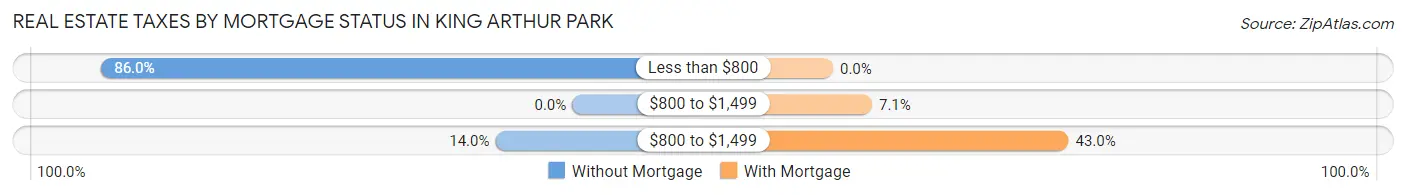
| Property Taxes | Without Mortgage | With Mortgage |
| Less than $800 | 141 (86.0%) | 0 (0.0%) |
| $800 to $1,499 | 0 (0.0%) | 25 (7.1%) |
| $800 to $1,499 | 23 (14.0%) | 151 (43.0%) |
| Total | 164 (100.0%) | 351 (100.0%) |
Health & Disability in King Arthur Park
Health Insurance Coverage by Age in King Arthur Park
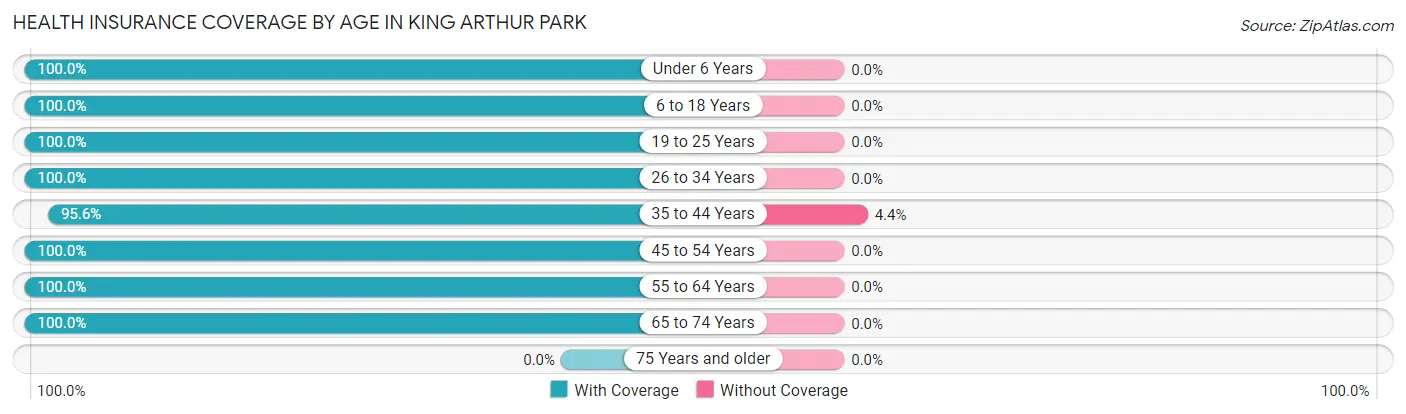
| Age Bracket | With Coverage | Without Coverage |
| Under 6 Years | 118 (100.0%) | 0 (0.0%) |
| 6 to 18 Years | 428 (100.0%) | 0 (0.0%) |
| 19 to 25 Years | 176 (100.0%) | 0 (0.0%) |
| 26 to 34 Years | 301 (100.0%) | 0 (0.0%) |
| 35 to 44 Years | 549 (95.6%) | 25 (4.4%) |
| 45 to 54 Years | 189 (100.0%) | 0 (0.0%) |
| 55 to 64 Years | 34 (100.0%) | 0 (0.0%) |
| 65 to 74 Years | 213 (100.0%) | 0 (0.0%) |
| 75 Years and older | 0 (0.0%) | 0 (0.0%) |
| Total | 2,008 (98.8%) | 25 (1.2%) |
Health Insurance Coverage by Citizenship Status in King Arthur Park
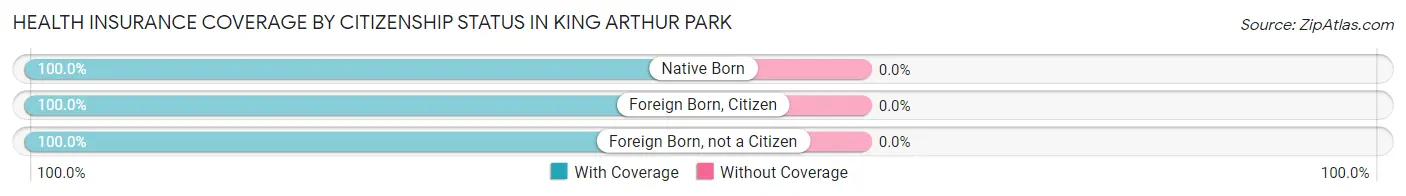
| Citizenship Status | With Coverage | Without Coverage |
| Native Born | 118 (100.0%) | 0 (0.0%) |
| Foreign Born, Citizen | 428 (100.0%) | 0 (0.0%) |
| Foreign Born, not a Citizen | 176 (100.0%) | 0 (0.0%) |
Health Insurance Coverage by Household Income in King Arthur Park
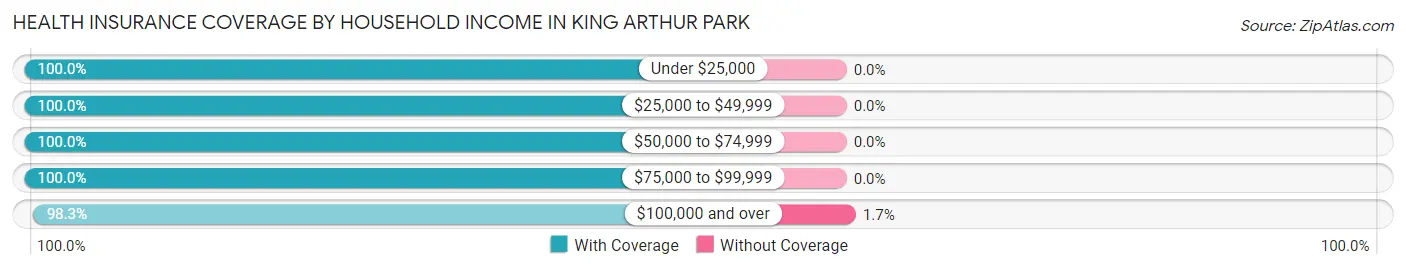
| Household Income | With Coverage | Without Coverage |
| Under $25,000 | 62 (100.0%) | 0 (0.0%) |
| $25,000 to $49,999 | 67 (100.0%) | 0 (0.0%) |
| $50,000 to $74,999 | 142 (100.0%) | 0 (0.0%) |
| $75,000 to $99,999 | 312 (100.0%) | 0 (0.0%) |
| $100,000 and over | 1,425 (98.3%) | 25 (1.7%) |
Public vs Private Health Insurance Coverage by Age in King Arthur Park
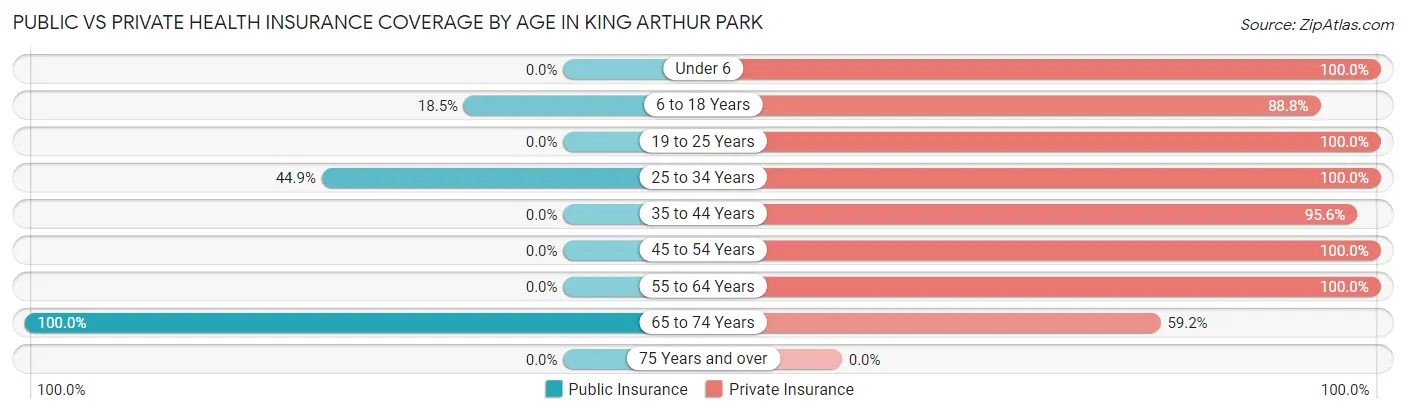
| Age Bracket | Public Insurance | Private Insurance |
| Under 6 | 0 (0.0%) | 118 (100.0%) |
| 6 to 18 Years | 79 (18.5%) | 380 (88.8%) |
| 19 to 25 Years | 0 (0.0%) | 176 (100.0%) |
| 25 to 34 Years | 135 (44.9%) | 301 (100.0%) |
| 35 to 44 Years | 0 (0.0%) | 549 (95.6%) |
| 45 to 54 Years | 0 (0.0%) | 189 (100.0%) |
| 55 to 64 Years | 0 (0.0%) | 34 (100.0%) |
| 65 to 74 Years | 213 (100.0%) | 126 (59.2%) |
| 75 Years and over | 0 (0.0%) | 0 (0.0%) |
| Total | 427 (21.0%) | 1,873 (92.1%) |
Disability Status by Sex by Age in King Arthur Park
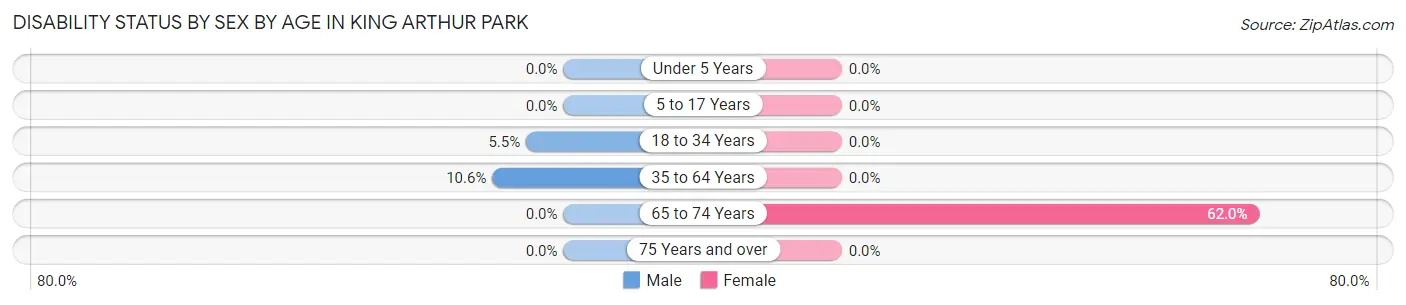
| Age Bracket | Male | Female |
| Under 5 Years | 0 (0.0%) | 0 (0.0%) |
| 5 to 17 Years | 0 (0.0%) | 0 (0.0%) |
| 18 to 34 Years | 25 (5.5%) | 0 (0.0%) |
| 35 to 64 Years | 55 (10.6%) | 0 (0.0%) |
| 65 to 74 Years | 0 (0.0%) | 106 (62.0%) |
| 75 Years and over | 0 (0.0%) | 0 (0.0%) |
Disability Class by Sex by Age in King Arthur Park
Disability Class: Hearing Difficulty
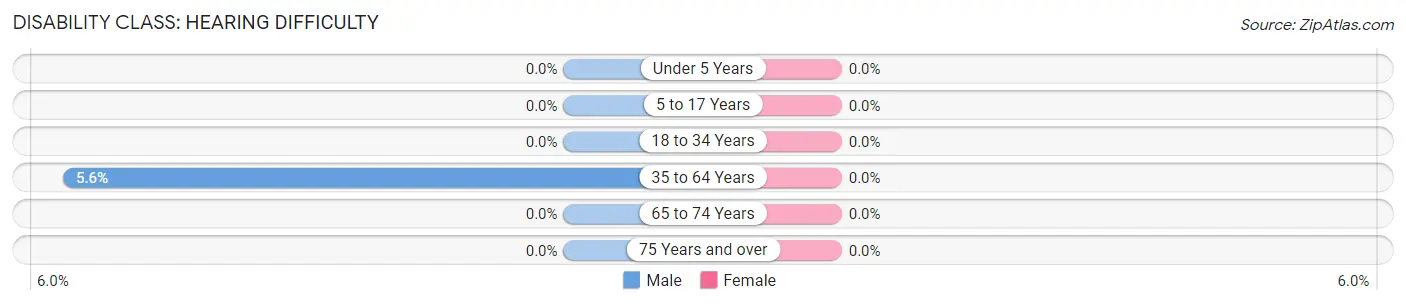
| Age Bracket | Male | Female |
| Under 5 Years | 0 (0.0%) | 0 (0.0%) |
| 5 to 17 Years | 0 (0.0%) | 0 (0.0%) |
| 18 to 34 Years | 0 (0.0%) | 0 (0.0%) |
| 35 to 64 Years | 29 (5.6%) | 0 (0.0%) |
| 65 to 74 Years | 0 (0.0%) | 0 (0.0%) |
| 75 Years and over | 0 (0.0%) | 0 (0.0%) |
Disability Class: Vision Difficulty
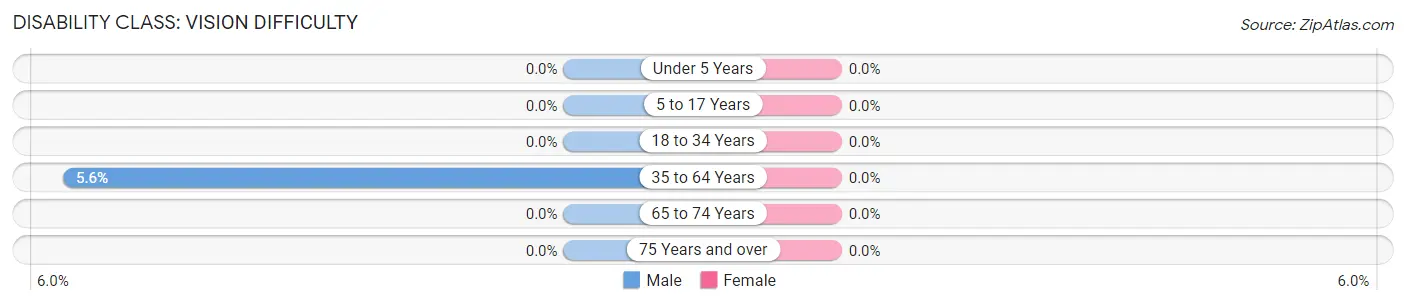
| Age Bracket | Male | Female |
| Under 5 Years | 0 (0.0%) | 0 (0.0%) |
| 5 to 17 Years | 0 (0.0%) | 0 (0.0%) |
| 18 to 34 Years | 0 (0.0%) | 0 (0.0%) |
| 35 to 64 Years | 29 (5.6%) | 0 (0.0%) |
| 65 to 74 Years | 0 (0.0%) | 0 (0.0%) |
| 75 Years and over | 0 (0.0%) | 0 (0.0%) |
Disability Class: Cognitive Difficulty
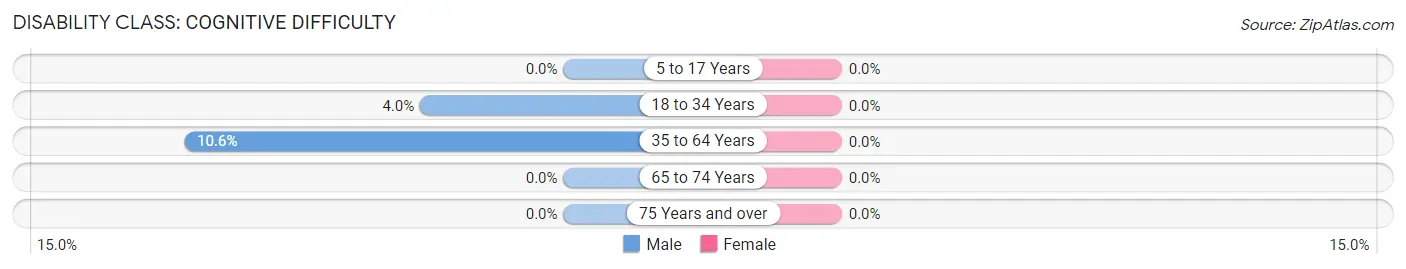
| Age Bracket | Male | Female |
| 5 to 17 Years | 0 (0.0%) | 0 (0.0%) |
| 18 to 34 Years | 18 (4.0%) | 0 (0.0%) |
| 35 to 64 Years | 55 (10.6%) | 0 (0.0%) |
| 65 to 74 Years | 0 (0.0%) | 0 (0.0%) |
| 75 Years and over | 0 (0.0%) | 0 (0.0%) |
Disability Class: Ambulatory Difficulty
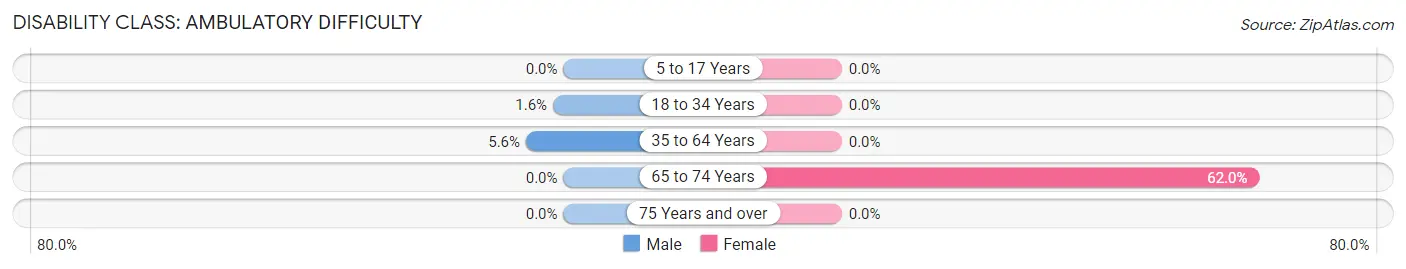
| Age Bracket | Male | Female |
| 5 to 17 Years | 0 (0.0%) | 0 (0.0%) |
| 18 to 34 Years | 7 (1.5%) | 0 (0.0%) |
| 35 to 64 Years | 29 (5.6%) | 0 (0.0%) |
| 65 to 74 Years | 0 (0.0%) | 106 (62.0%) |
| 75 Years and over | 0 (0.0%) | 0 (0.0%) |
Disability Class: Self-Care Difficulty
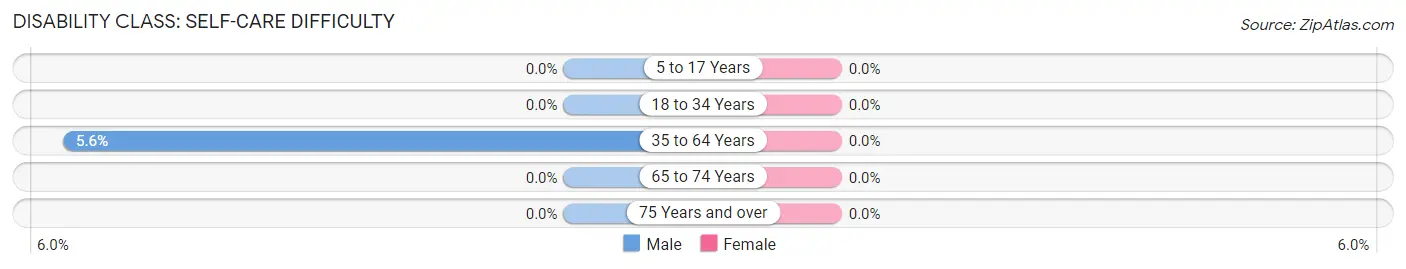
| Age Bracket | Male | Female |
| 5 to 17 Years | 0 (0.0%) | 0 (0.0%) |
| 18 to 34 Years | 0 (0.0%) | 0 (0.0%) |
| 35 to 64 Years | 29 (5.6%) | 0 (0.0%) |
| 65 to 74 Years | 0 (0.0%) | 0 (0.0%) |
| 75 Years and over | 0 (0.0%) | 0 (0.0%) |
Technology Access in King Arthur Park
Computing Device Access in King Arthur Park
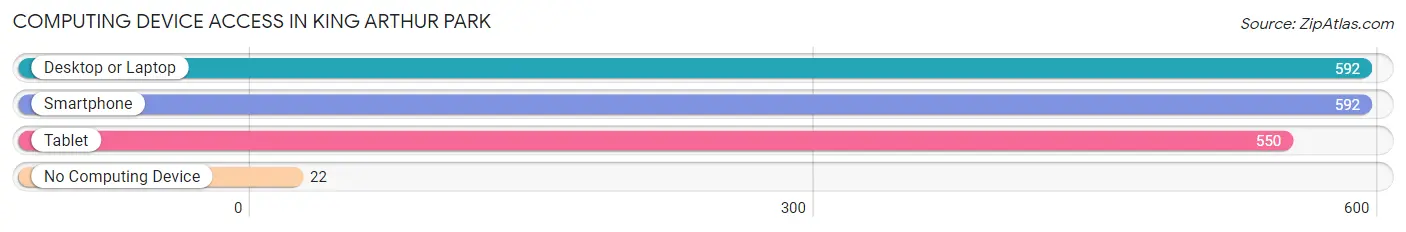
| Device Type | # Households | % Households |
| Desktop or Laptop | 592 | 96.4% |
| Smartphone | 592 | 96.4% |
| Tablet | 550 | 89.6% |
| No Computing Device | 22 | 3.6% |
| Total | 614 | 100.0% |
Internet Access in King Arthur Park
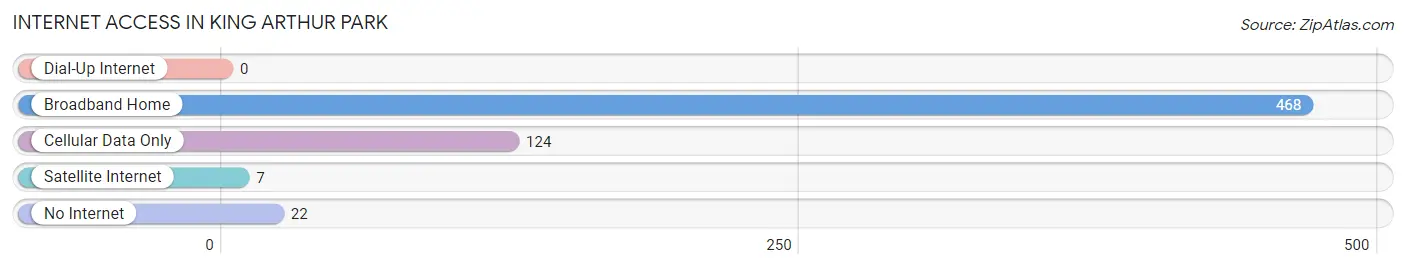
| Internet Type | # Households | % Households |
| Dial-Up Internet | 0 | 0.0% |
| Broadband Home | 468 | 76.2% |
| Cellular Data Only | 124 | 20.2% |
| Satellite Internet | 7 | 1.1% |
| No Internet | 22 | 3.6% |
| Total | 614 | 100.0% |
King Arthur Park Summary
Arthur Park is a small unincorporated community located in the state of Montana, in the United States of America. It is situated in the western part of the state, in the county of Ravalli. The town is located on the banks of the Bitterroot River, and is surrounded by the Bitterroot Mountains. The town is home to a population of approximately 500 people, and is a popular tourist destination due to its proximity to the Bitterroot National Forest.
History
The area that is now known as Arthur Park was first settled in the late 1800s by a group of homesteaders. The town was originally named “Bitterroot” after the river that runs through it. In the early 1900s, the town was renamed “Arthur Park” after a local rancher, Arthur Park. The town was officially incorporated in 1910.
In the early 1900s, the town was a popular destination for tourists, as it was located near the Bitterroot National Forest. The town was also home to a number of businesses, including a hotel, a general store, and a post office.
In the 1950s, the town began to decline in population as people moved away to larger cities. However, in the late 1970s, the town began to experience a resurgence in population as people began to move back to the area.
Geography
Arthur Park is located in the western part of the state of Montana, in the county of Ravalli. The town is situated on the banks of the Bitterroot River, and is surrounded by the Bitterroot Mountains. The town is located approximately 30 miles south of Missoula, and is approximately 40 miles north of Hamilton.
The town has a total area of 0.6 square miles, all of which is land. The town has an elevation of 3,400 feet above sea level.
Economy
The economy of Arthur Park is largely based on tourism. The town is located near the Bitterroot National Forest, and is a popular destination for outdoor enthusiasts. The town is also home to a number of businesses, including a hotel, a general store, and a post office.
Demographics
As of the 2010 census, the population of Arthur Park was 500 people. The town has a population density of 833 people per square mile. The median age of the population is 44.5 years, and the median household income is $37,500. The town is predominantly white, with 95.2% of the population identifying as white. The town also has a small Hispanic population, with 4.8% of the population identifying as Hispanic or Latino.
Conclusion
Arthur Park is a small unincorporated community located in the state of Montana, in the United States of America. It is situated in the western part of the state, in the county of Ravalli. The town is located on the banks of the Bitterroot River, and is surrounded by the Bitterroot Mountains. The town is home to a population of approximately 500 people, and is a popular tourist destination due to its proximity to the Bitterroot National Forest. The economy of Arthur Park is largely based on tourism, and the town is home to a number of businesses, including a hotel, a general store, and a post office. The town is predominantly white, with 95.2% of the population identifying as white. The town also has a small Hispanic population, with 4.8% of the population identifying as Hispanic or Latino.
Common Questions
What is Per Capita Income in King Arthur Park?
Per Capita income in King Arthur Park is $34,646.
What is the Median Family Income in King Arthur Park?
Median Family Income in King Arthur Park is $106,438.
What is the Median Household income in King Arthur Park?
Median Household Income in King Arthur Park is $101,281.
What is Income or Wage Gap in King Arthur Park?
Income or Wage Gap in King Arthur Park is 13.2%.
Women in King Arthur Park earn 86.8 cents for every dollar earned by a man.
What is Inequality or Gini Index in King Arthur Park?
Inequality or Gini Index in King Arthur Park is 0.23.
What is the Total Population of King Arthur Park?
Total Population of King Arthur Park is 2,033.
What is the Total Male Population of King Arthur Park?
Total Male Population of King Arthur Park is 1,284.
What is the Total Female Population of King Arthur Park?
Total Female Population of King Arthur Park is 749.
What is the Ratio of Males per 100 Females in King Arthur Park?
There are 171.43 Males per 100 Females in King Arthur Park.
What is the Ratio of Females per 100 Males in King Arthur Park?
There are 58.33 Females per 100 Males in King Arthur Park.
What is the Median Population Age in King Arthur Park?
Median Population Age in King Arthur Park is 34.9 Years.
What is the Average Family Size in King Arthur Park
Average Family Size in King Arthur Park is 3.8 People.
What is the Average Household Size in King Arthur Park
Average Household Size in King Arthur Park is 3.3 People.
How Large is the Labor Force in King Arthur Park?
There are 1,396 People in the Labor Forcein in King Arthur Park.
What is the Percentage of People in the Labor Force in King Arthur Park?
88.6% of People are in the Labor Force in King Arthur Park.