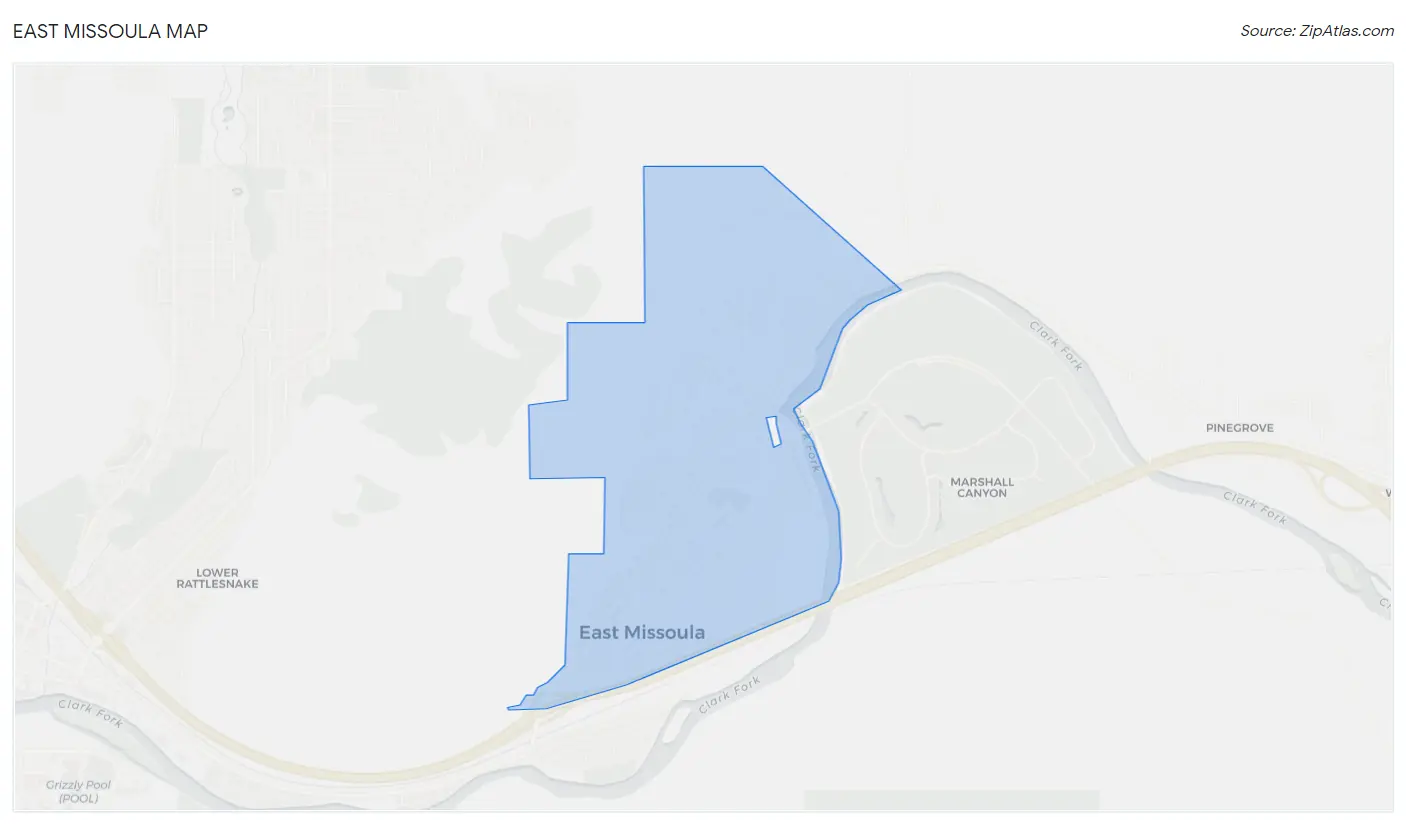
East Missoula, MT Map & Demographics
East Missoula Map
East Missoula Overview
$30,115
PER CAPITA INCOME
$67,461
AVG FAMILY INCOME
$58,991
AVG HOUSEHOLD INCOME
32.5%
WAGE / INCOME GAP [ % ]
67.5¢/ $1
WAGE / INCOME GAP [ $ ]
0.39
INEQUALITY / GINI INDEX
2,105
TOTAL POPULATION
1,193
MALE POPULATION
912
FEMALE POPULATION
130.81
MALES / 100 FEMALES
76.45
FEMALES / 100 MALES
41.7
MEDIAN AGE
2.8
AVG FAMILY SIZE
2.2
AVG HOUSEHOLD SIZE
1,160
LABOR FORCE [ PEOPLE ]
63.3%
PERCENT IN LABOR FORCE
7.0%
UNEMPLOYMENT RATE
Income in East Missoula
Income Overview in East Missoula
Per Capita Income in East Missoula is $30,115, while median incomes of families and households are $67,461 and $58,991 respectively.
| Characteristic | Number | Measure |
| Per Capita Income | 2,105 | $30,115 |
| Median Family Income | 565 | $67,461 |
| Mean Family Income | 565 | $80,985 |
| Median Household Income | 951 | $58,991 |
| Mean Household Income | 951 | $66,457 |
| Income Deficit | 565 | $0 |
| Wage / Income Gap (%) | 2,105 | 32.54% |
| Wage / Income Gap ($) | 2,105 | 67.46¢ per $1 |
| Gini / Inequality Index | 2,105 | 0.39 |
Earnings by Sex in East Missoula
Average Earnings in East Missoula are $32,794, $38,384 for men and $25,893 for women, a difference of 32.5%.
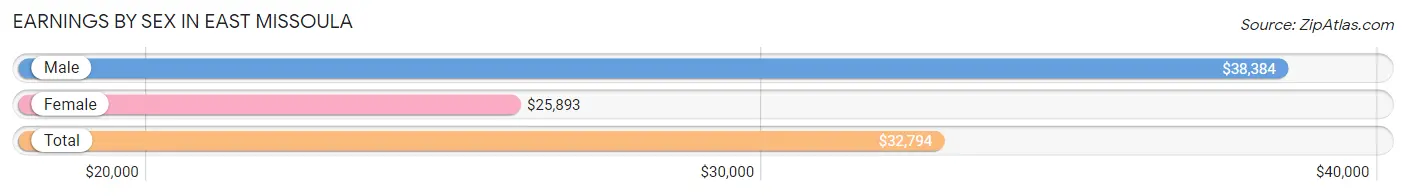
| Sex | Number | Average Earnings |
| Male | 659 (56.7%) | $38,384 |
| Female | 503 (43.3%) | $25,893 |
| Total | 1,162 (100.0%) | $32,794 |
Earnings by Sex by Income Bracket in East Missoula
The most common earnings brackets in East Missoula are $55,000 to $64,999 for men (116 | 17.6%) and $55,000 to $64,999 for women (89 | 17.7%).
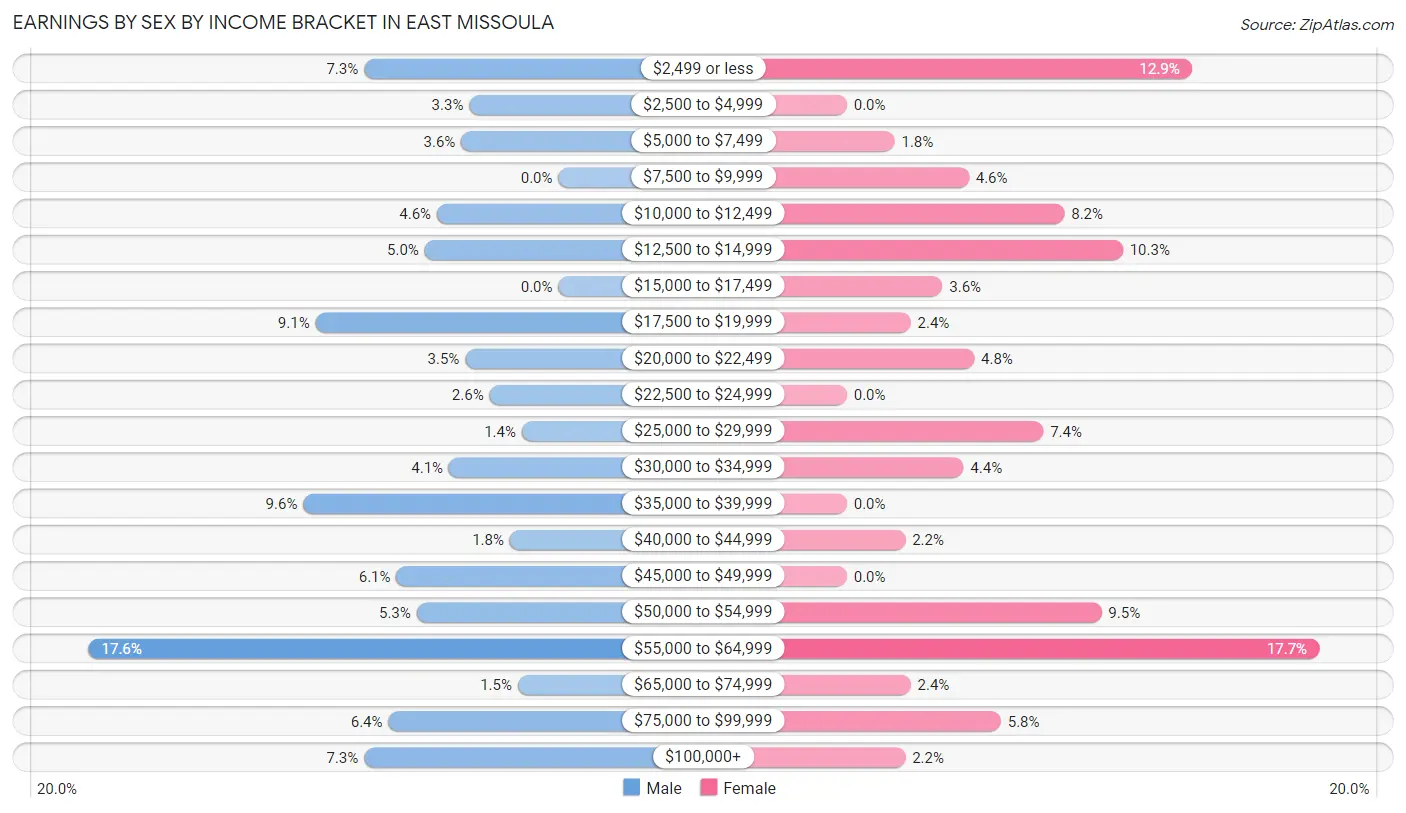
| Income | Male | Female |
| $2,499 or less | 48 (7.3%) | 65 (12.9%) |
| $2,500 to $4,999 | 22 (3.3%) | 0 (0.0%) |
| $5,000 to $7,499 | 24 (3.6%) | 9 (1.8%) |
| $7,500 to $9,999 | 0 (0.0%) | 23 (4.6%) |
| $10,000 to $12,499 | 30 (4.5%) | 41 (8.2%) |
| $12,500 to $14,999 | 33 (5.0%) | 52 (10.3%) |
| $15,000 to $17,499 | 0 (0.0%) | 18 (3.6%) |
| $17,500 to $19,999 | 60 (9.1%) | 12 (2.4%) |
| $20,000 to $22,499 | 23 (3.5%) | 24 (4.8%) |
| $22,500 to $24,999 | 17 (2.6%) | 0 (0.0%) |
| $25,000 to $29,999 | 9 (1.4%) | 37 (7.4%) |
| $30,000 to $34,999 | 27 (4.1%) | 22 (4.4%) |
| $35,000 to $39,999 | 63 (9.6%) | 0 (0.0%) |
| $40,000 to $44,999 | 12 (1.8%) | 11 (2.2%) |
| $45,000 to $49,999 | 40 (6.1%) | 0 (0.0%) |
| $50,000 to $54,999 | 35 (5.3%) | 48 (9.5%) |
| $55,000 to $64,999 | 116 (17.6%) | 89 (17.7%) |
| $65,000 to $74,999 | 10 (1.5%) | 12 (2.4%) |
| $75,000 to $99,999 | 42 (6.4%) | 29 (5.8%) |
| $100,000+ | 48 (7.3%) | 11 (2.2%) |
| Total | 659 (100.0%) | 503 (100.0%) |
Earnings by Sex by Educational Attainment in East Missoula
Average earnings in East Missoula are $45,438 for men and $27,969 for women, a difference of 38.5%. Men with an educational attainment of high school diploma enjoy the highest average annual earnings of $58,167, while those with college or associate's degree education earn the least with $30,952. Women with an educational attainment of graduate degree earn the most with the average annual earnings of $63,321, while those with high school diploma education have the smallest earnings of $13,726.

| Educational Attainment | Male Income | Female Income |
| Less than High School | - | - |
| High School Diploma | $58,167 | $13,726 |
| College or Associate's Degree | $30,952 | $0 |
| Bachelor's Degree | $39,938 | $52,333 |
| Graduate Degree | - | - |
| Total | $45,438 | $27,969 |
Family Income in East Missoula
Family Income Brackets in East Missoula
According to the East Missoula family income data, there are 125 families falling into the $50,000 to $74,999 income range, which is the most common income bracket and makes up 22.1% of all families. Conversely, the $10,000 to $14,999 income bracket is the least frequent group with only 6 families (1.1%) belonging to this category.
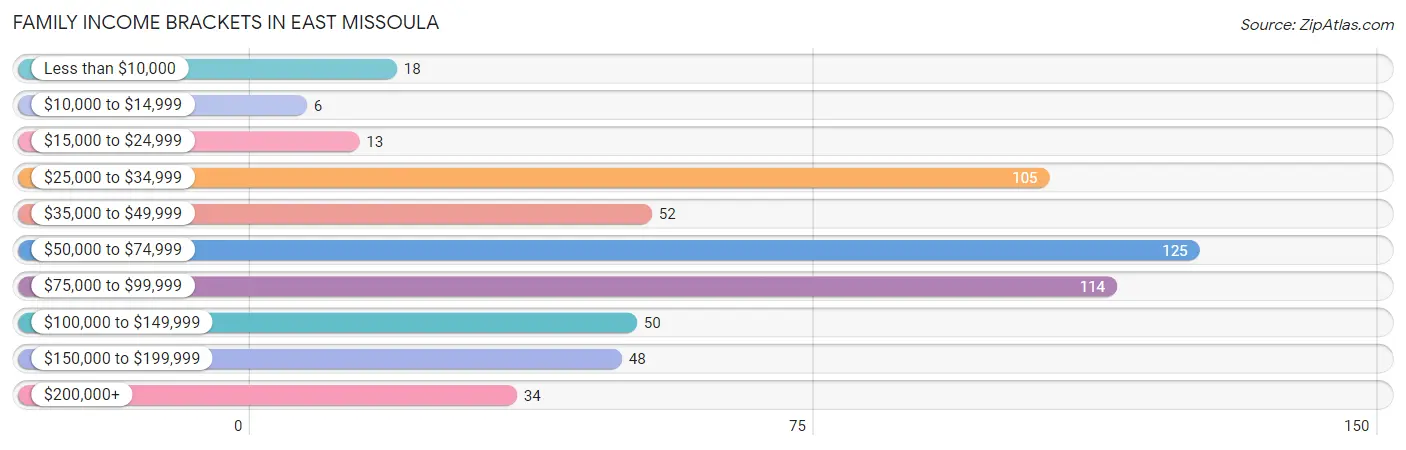
| Income Bracket | # Families | % Families |
| Less than $10,000 | 18 | 3.2% |
| $10,000 to $14,999 | 6 | 1.1% |
| $15,000 to $24,999 | 13 | 2.3% |
| $25,000 to $34,999 | 105 | 18.6% |
| $35,000 to $49,999 | 52 | 9.2% |
| $50,000 to $74,999 | 125 | 22.1% |
| $75,000 to $99,999 | 114 | 20.2% |
| $100,000 to $149,999 | 50 | 8.8% |
| $150,000 to $199,999 | 48 | 8.5% |
| $200,000+ | 34 | 6.0% |
Family Income by Famaliy Size in East Missoula
2-person families (268 | 47.4%) account for the highest median family income in East Missoula with $81,714 per family, while 2-person families (268 | 47.4%) have the highest median income of $40,857 per family member.
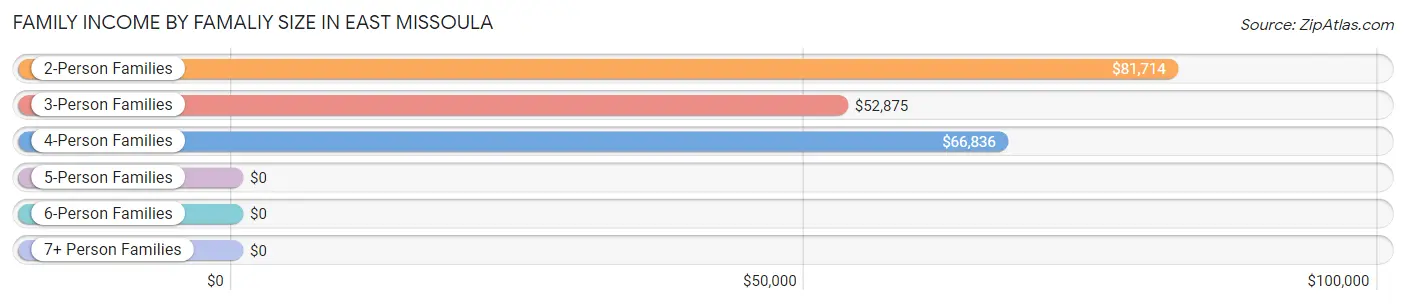
| Income Bracket | # Families | Median Income |
| 2-Person Families | 268 (47.4%) | $81,714 |
| 3-Person Families | 183 (32.4%) | $52,875 |
| 4-Person Families | 109 (19.3%) | $66,836 |
| 5-Person Families | 5 (0.9%) | $0 |
| 6-Person Families | 0 (0.0%) | $0 |
| 7+ Person Families | 0 (0.0%) | $0 |
| Total | 565 (100.0%) | $67,461 |
Family Income by Number of Earners in East Missoula
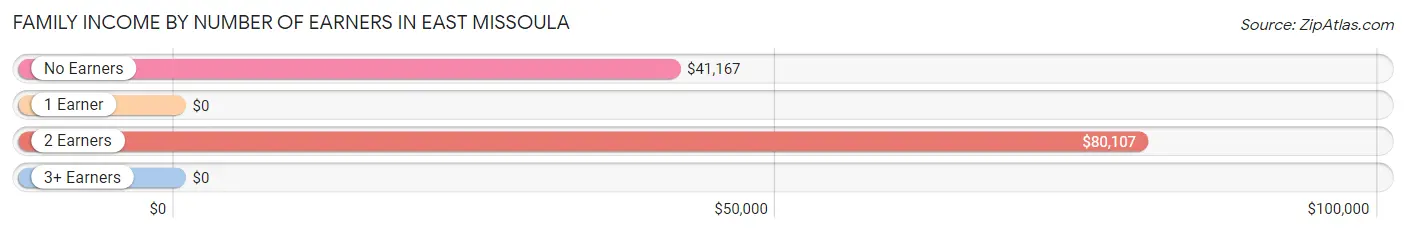
| Number of Earners | # Families | Median Income |
| No Earners | 132 (23.4%) | $41,167 |
| 1 Earner | 104 (18.4%) | $0 |
| 2 Earners | 293 (51.9%) | $80,107 |
| 3+ Earners | 36 (6.4%) | $0 |
| Total | 565 (100.0%) | $67,461 |
Household Income in East Missoula
Household Income Brackets in East Missoula
With 263 households falling in the category, the $50,000 to $74,999 income range is the most frequent in East Missoula, accounting for 27.7% of all households. In contrast, only 6 households (0.6%) fall into the $10,000 to $14,999 income bracket, making it the least populous group.
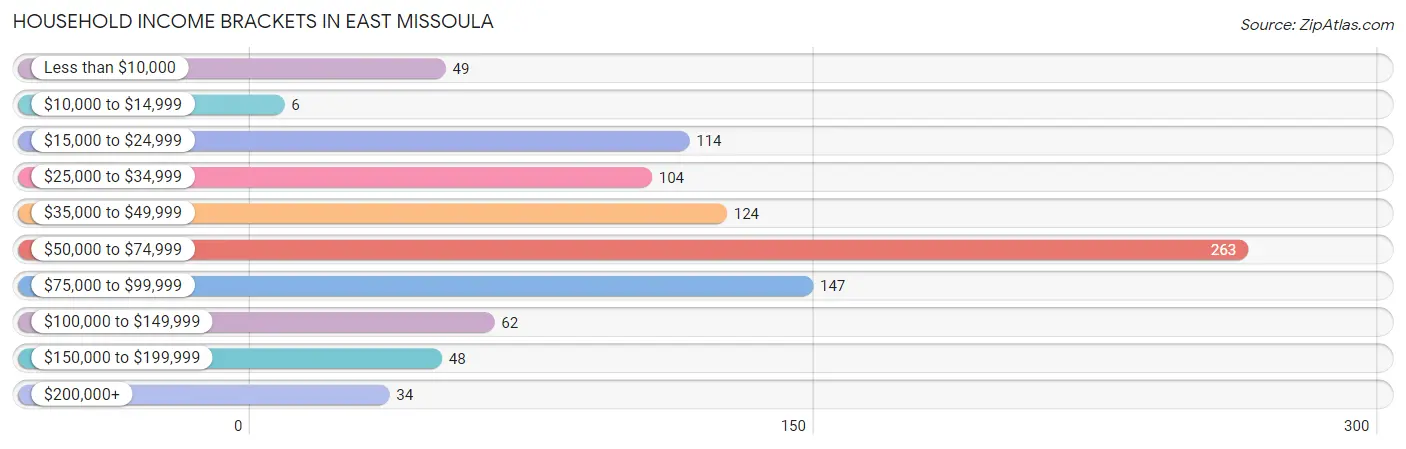
| Income Bracket | # Households | % Households |
| Less than $10,000 | 49 | 5.2% |
| $10,000 to $14,999 | 6 | 0.6% |
| $15,000 to $24,999 | 114 | 12.0% |
| $25,000 to $34,999 | 104 | 10.9% |
| $35,000 to $49,999 | 124 | 13.0% |
| $50,000 to $74,999 | 263 | 27.7% |
| $75,000 to $99,999 | 147 | 15.5% |
| $100,000 to $149,999 | 62 | 6.5% |
| $150,000 to $199,999 | 48 | 5.0% |
| $200,000+ | 34 | 3.6% |
Household Income by Householder Age in East Missoula
The median household income in East Missoula is $58,991, with the highest median household income of $61,667 found in the 25 to 44 years age bracket for the primary householder. A total of 420 households (44.2%) fall into this category.
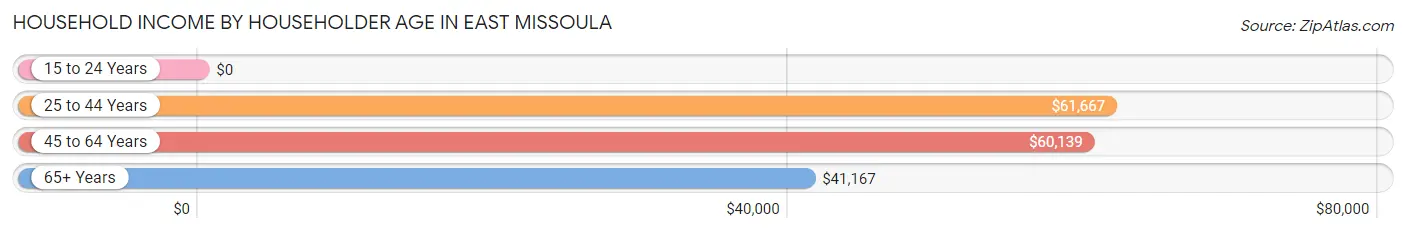
| Income Bracket | # Households | Median Income |
| 15 to 24 Years | 0 (0.0%) | $0 |
| 25 to 44 Years | 420 (44.2%) | $61,667 |
| 45 to 64 Years | 241 (25.3%) | $60,139 |
| 65+ Years | 290 (30.5%) | $41,167 |
| Total | 951 (100.0%) | $58,991 |
Poverty in East Missoula
Income Below Poverty by Sex and Age in East Missoula
With 5.6% poverty level for males and 14.8% for females among the residents of East Missoula, 35 to 44 year old males and 12 to 14 year old females are the most vulnerable to poverty, with 27 males (12.4%) and 22 females (68.8%) in their respective age groups living below the poverty level.
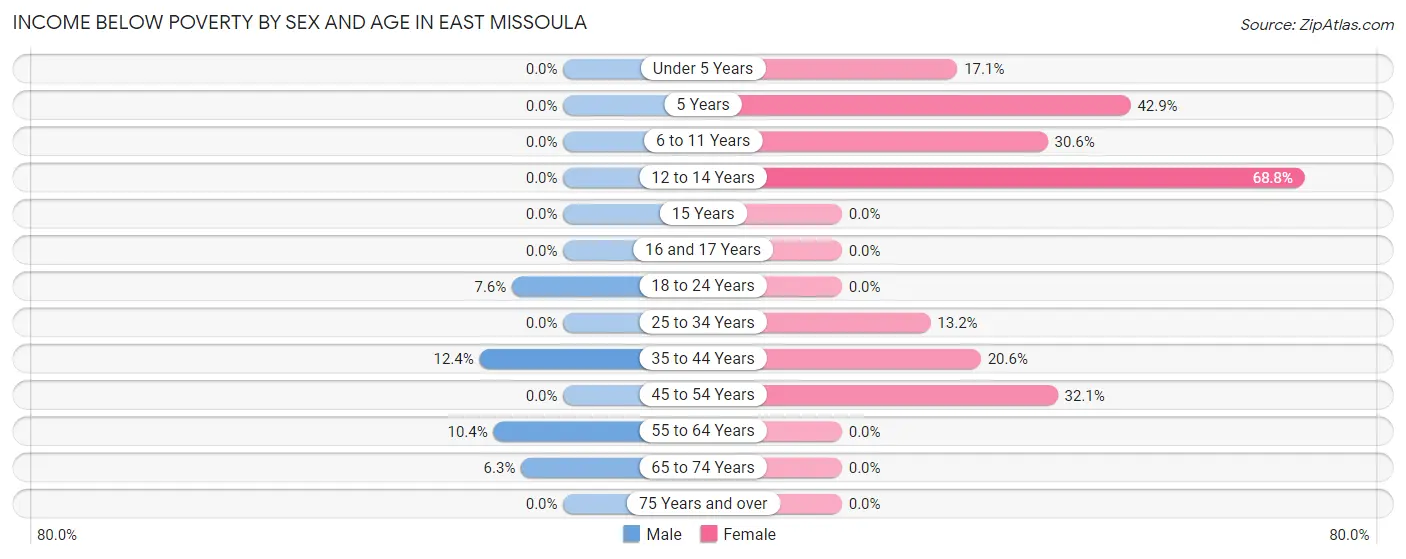
| Age Bracket | Male | Female |
| Under 5 Years | 0 (0.0%) | 6 (17.1%) |
| 5 Years | 0 (0.0%) | 6 (42.9%) |
| 6 to 11 Years | 0 (0.0%) | 22 (30.6%) |
| 12 to 14 Years | 0 (0.0%) | 22 (68.8%) |
| 15 Years | 0 (0.0%) | 0 (0.0%) |
| 16 and 17 Years | 0 (0.0%) | 0 (0.0%) |
| 18 to 24 Years | 14 (7.6%) | 0 (0.0%) |
| 25 to 34 Years | 0 (0.0%) | 15 (13.2%) |
| 35 to 44 Years | 27 (12.4%) | 39 (20.6%) |
| 45 to 54 Years | 0 (0.0%) | 25 (32.1%) |
| 55 to 64 Years | 17 (10.4%) | 0 (0.0%) |
| 65 to 74 Years | 8 (6.2%) | 0 (0.0%) |
| 75 Years and over | 0 (0.0%) | 0 (0.0%) |
| Total | 66 (5.6%) | 135 (14.8%) |
Income Above Poverty by Sex and Age in East Missoula
According to the poverty statistics in East Missoula, males aged under 5 years and females aged 16 and 17 years are the age groups that are most secure financially, with 100.0% of males and 100.0% of females in these age groups living above the poverty line.
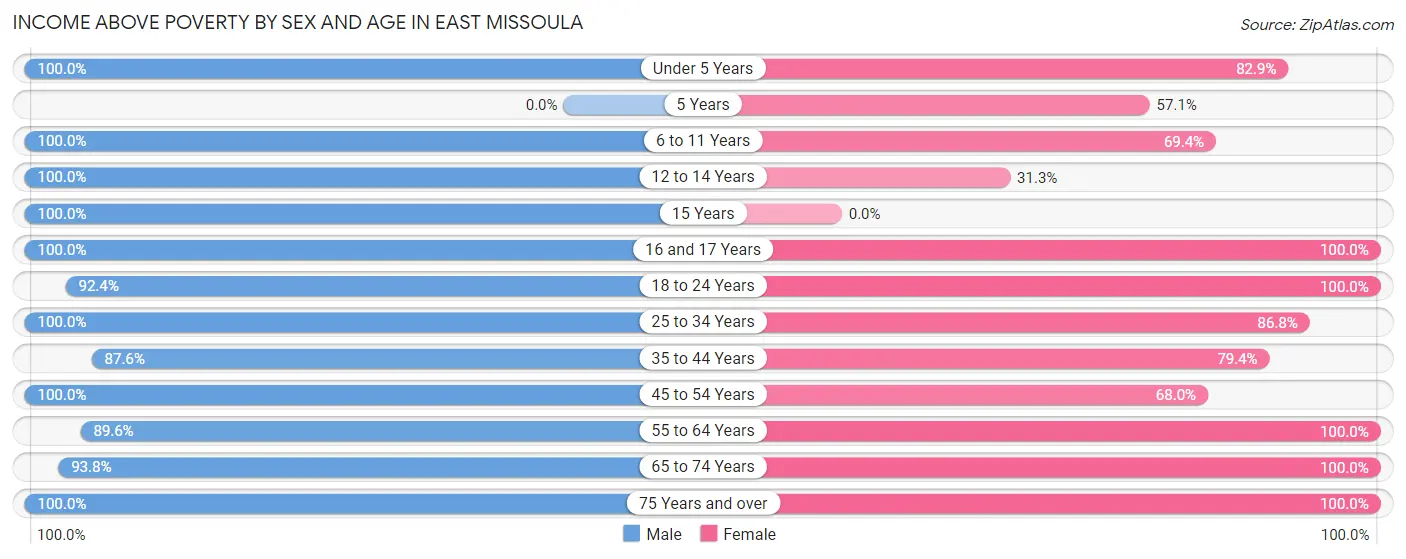
| Age Bracket | Male | Female |
| Under 5 Years | 32 (100.0%) | 29 (82.9%) |
| 5 Years | 0 (0.0%) | 8 (57.1%) |
| 6 to 11 Years | 59 (100.0%) | 50 (69.4%) |
| 12 to 14 Years | 8 (100.0%) | 10 (31.2%) |
| 15 Years | 21 (100.0%) | 0 (0.0%) |
| 16 and 17 Years | 17 (100.0%) | 7 (100.0%) |
| 18 to 24 Years | 170 (92.4%) | 41 (100.0%) |
| 25 to 34 Years | 182 (100.0%) | 99 (86.8%) |
| 35 to 44 Years | 190 (87.6%) | 150 (79.4%) |
| 45 to 54 Years | 68 (100.0%) | 53 (67.9%) |
| 55 to 64 Years | 147 (89.6%) | 154 (100.0%) |
| 65 to 74 Years | 120 (93.8%) | 99 (100.0%) |
| 75 Years and over | 110 (100.0%) | 76 (100.0%) |
| Total | 1,124 (94.5%) | 776 (85.2%) |
Income Below Poverty Among Married-Couple Families in East Missoula
The poverty statistics for married-couple families in East Missoula show that 2.0% or 9 of the total 446 families live below the poverty line. Families with no children have the highest poverty rate of 3.0%, comprising of 9 families. On the other hand, families with 1 or 2 children have the lowest poverty rate of 0.0%, which includes 0 families.
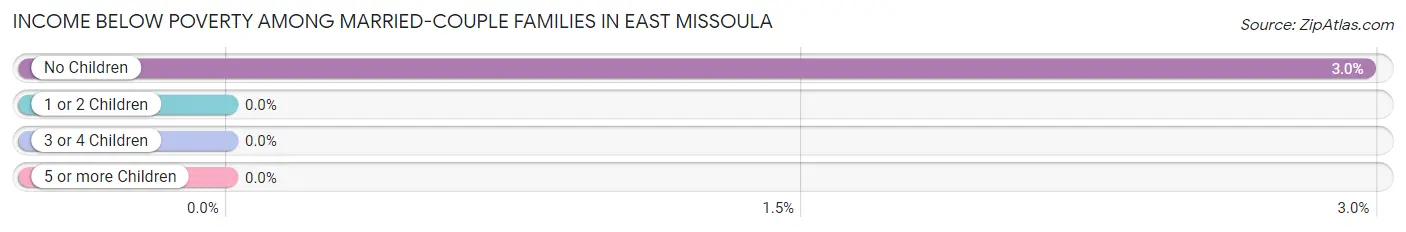
| Children | Above Poverty | Below Poverty |
| No Children | 294 (97.0%) | 9 (3.0%) |
| 1 or 2 Children | 138 (100.0%) | 0 (0.0%) |
| 3 or 4 Children | 5 (100.0%) | 0 (0.0%) |
| 5 or more Children | 0 (0.0%) | 0 (0.0%) |
| Total | 437 (98.0%) | 9 (2.0%) |
Income Below Poverty Among Single-Parent Households in East Missoula
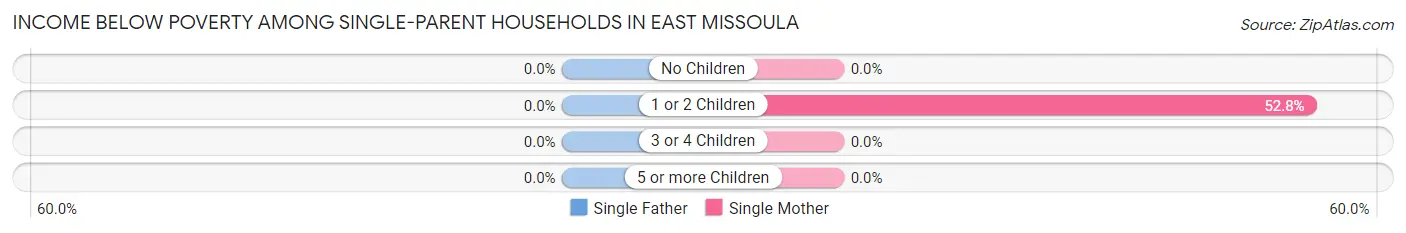
| Children | Single Father | Single Mother |
| No Children | 0 (0.0%) | 0 (0.0%) |
| 1 or 2 Children | 0 (0.0%) | 28 (52.8%) |
| 3 or 4 Children | 0 (0.0%) | 0 (0.0%) |
| 5 or more Children | 0 (0.0%) | 0 (0.0%) |
| Total | 0 (0.0%) | 28 (24.8%) |
Income Below Poverty Among Married-Couple vs Single-Parent Households in East Missoula
The poverty data for East Missoula shows that 9 of the married-couple family households (2.0%) and 28 of the single-parent households (23.5%) are living below the poverty level. Within the married-couple family households, those with no children have the highest poverty rate, with 9 households (3.0%) falling below the poverty line. Among the single-parent households, those with 1 or 2 children have the highest poverty rate, with 28 household (47.5%) living below poverty.
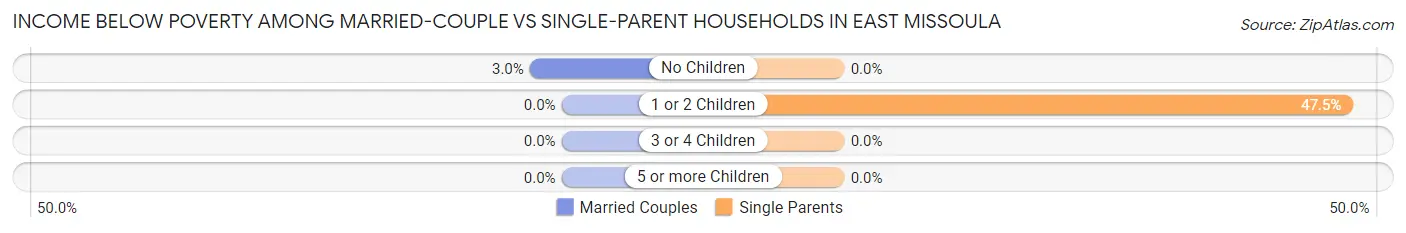
| Children | Married-Couple Families | Single-Parent Households |
| No Children | 9 (3.0%) | 0 (0.0%) |
| 1 or 2 Children | 0 (0.0%) | 28 (47.5%) |
| 3 or 4 Children | 0 (0.0%) | 0 (0.0%) |
| 5 or more Children | 0 (0.0%) | 0 (0.0%) |
| Total | 9 (2.0%) | 28 (23.5%) |
Race in East Missoula
The most populous races in East Missoula are White / Caucasian (1,873 | 89.0%), Two or more Races (184 | 8.7%), and Hispanic or Latino (64 | 3.0%).
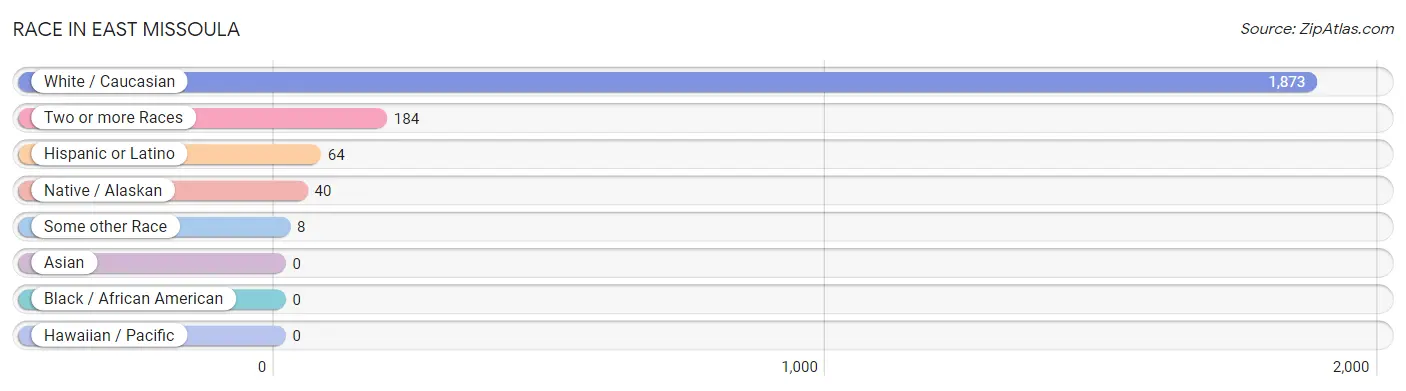
| Race | # Population | % Population |
| Asian | 0 | 0.0% |
| Black / African American | 0 | 0.0% |
| Hawaiian / Pacific | 0 | 0.0% |
| Hispanic or Latino | 64 | 3.0% |
| Native / Alaskan | 40 | 1.9% |
| White / Caucasian | 1,873 | 89.0% |
| Two or more Races | 184 | 8.7% |
| Some other Race | 8 | 0.4% |
| Total | 2,105 | 100.0% |
Ancestry in East Missoula
The most populous ancestries reported in East Missoula are German (384 | 18.2%), American (189 | 9.0%), Irish (177 | 8.4%), English (171 | 8.1%), and Norwegian (171 | 8.1%), together accounting for 51.9% of all East Missoula residents.
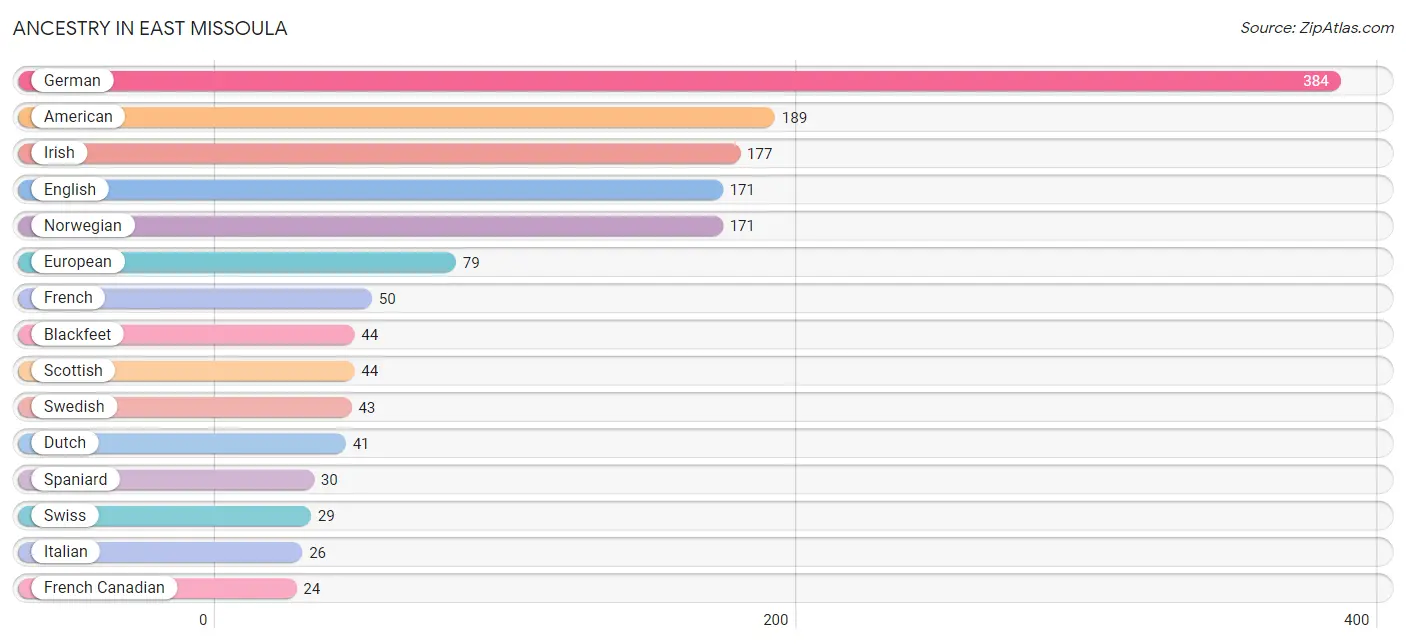
| Ancestry | # Population | % Population |
| American | 189 | 9.0% |
| Basque | 19 | 0.9% |
| Blackfeet | 44 | 2.1% |
| Canadian | 6 | 0.3% |
| Cherokee | 10 | 0.5% |
| Chippewa | 19 | 0.9% |
| Croatian | 16 | 0.8% |
| Czechoslovakian | 12 | 0.6% |
| Danish | 11 | 0.5% |
| Dutch | 41 | 1.9% |
| Eastern European | 12 | 0.6% |
| English | 171 | 8.1% |
| European | 79 | 3.7% |
| Finnish | 17 | 0.8% |
| French | 50 | 2.4% |
| French Canadian | 24 | 1.1% |
| German | 384 | 18.2% |
| Hungarian | 12 | 0.6% |
| Irish | 177 | 8.4% |
| Italian | 26 | 1.2% |
| Mexican | 24 | 1.1% |
| Norwegian | 171 | 8.1% |
| Peruvian | 10 | 0.5% |
| Polish | 12 | 0.6% |
| Russian | 10 | 0.5% |
| Scandinavian | 13 | 0.6% |
| Scotch-Irish | 4 | 0.2% |
| Scottish | 44 | 2.1% |
| Sioux | 6 | 0.3% |
| Slovak | 23 | 1.1% |
| South American | 10 | 0.5% |
| Spaniard | 30 | 1.4% |
| Swedish | 43 | 2.0% |
| Swiss | 29 | 1.4% |
| Welsh | 23 | 1.1% | View All 35 Rows |
Immigrants in East Missoula
The most numerous immigrant groups reported in East Missoula came from Europe (28 | 1.3%), Western Europe (28 | 1.3%), Germany (21 | 1.0%), Netherlands (7 | 0.3%), and Latin America (2 | 0.1%), together accounting for 4.1% of all East Missoula residents.
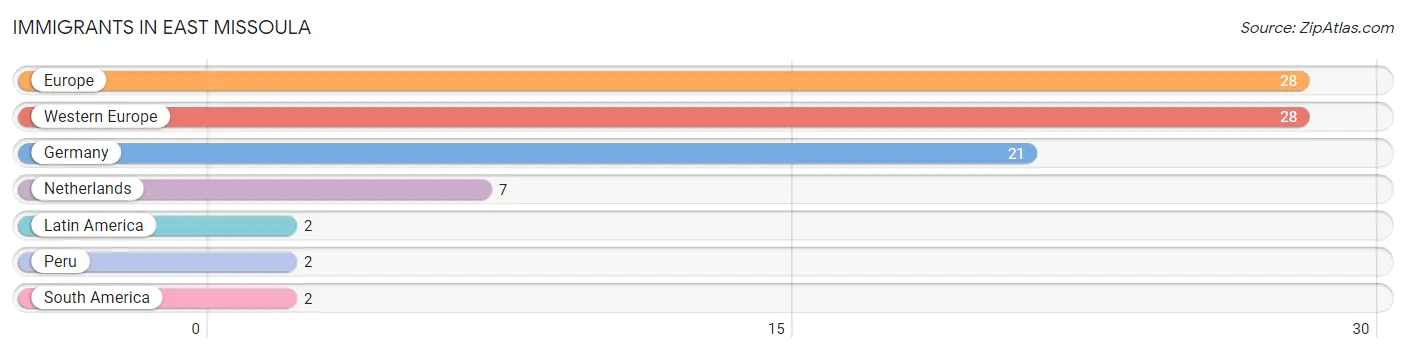
| Immigration Origin | # Population | % Population |
| Europe | 28 | 1.3% |
| Germany | 21 | 1.0% |
| Latin America | 2 | 0.1% |
| Netherlands | 7 | 0.3% |
| Peru | 2 | 0.1% |
| South America | 2 | 0.1% |
| Western Europe | 28 | 1.3% | View All 7 Rows |
Sex and Age in East Missoula
Sex and Age in East Missoula
The most populous age groups in East Missoula are 15 to 19 Years (134 | 11.2%) for men and 40 to 44 Years (132 | 14.5%) for women.
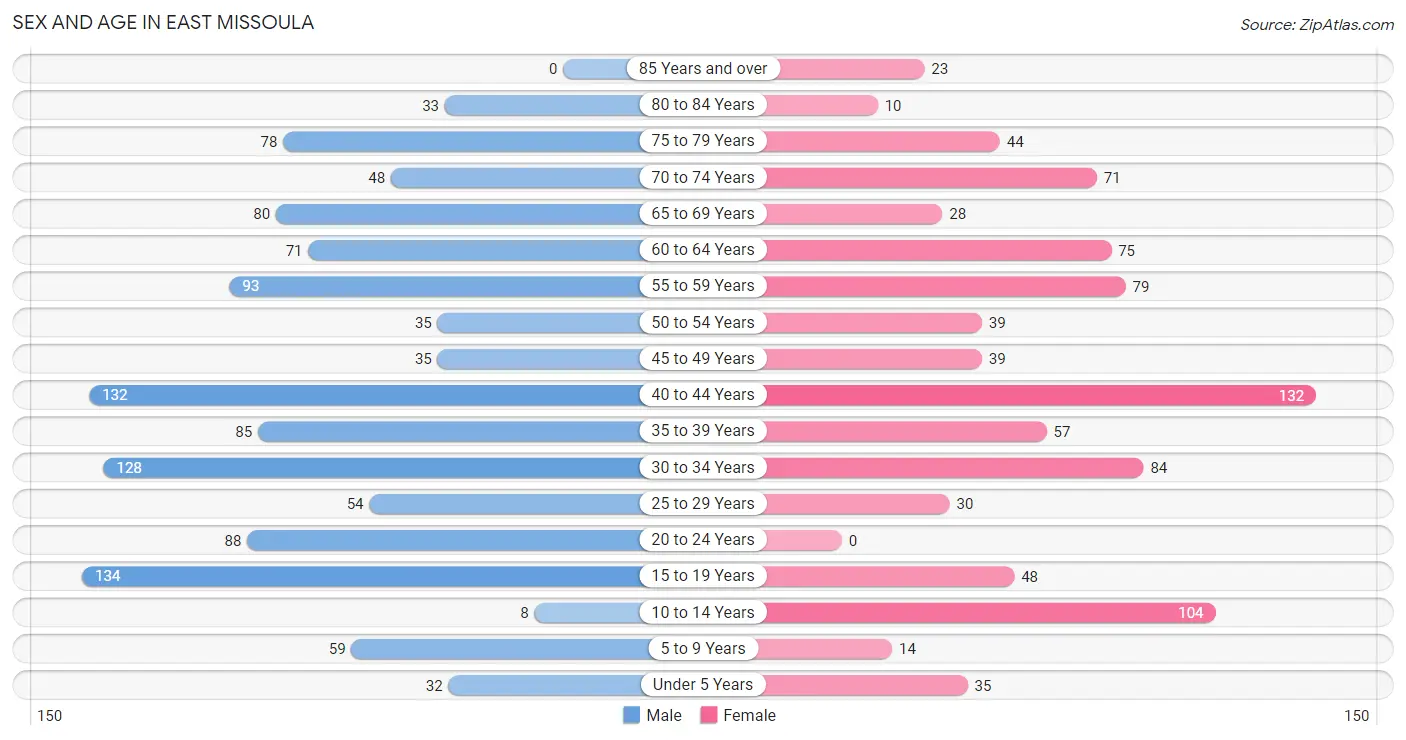
| Age Bracket | Male | Female |
| Under 5 Years | 32 (2.7%) | 35 (3.8%) |
| 5 to 9 Years | 59 (5.0%) | 14 (1.5%) |
| 10 to 14 Years | 8 (0.7%) | 104 (11.4%) |
| 15 to 19 Years | 134 (11.2%) | 48 (5.3%) |
| 20 to 24 Years | 88 (7.4%) | 0 (0.0%) |
| 25 to 29 Years | 54 (4.5%) | 30 (3.3%) |
| 30 to 34 Years | 128 (10.7%) | 84 (9.2%) |
| 35 to 39 Years | 85 (7.1%) | 57 (6.2%) |
| 40 to 44 Years | 132 (11.1%) | 132 (14.5%) |
| 45 to 49 Years | 35 (2.9%) | 39 (4.3%) |
| 50 to 54 Years | 35 (2.9%) | 39 (4.3%) |
| 55 to 59 Years | 93 (7.8%) | 79 (8.7%) |
| 60 to 64 Years | 71 (5.9%) | 75 (8.2%) |
| 65 to 69 Years | 80 (6.7%) | 28 (3.1%) |
| 70 to 74 Years | 48 (4.0%) | 71 (7.8%) |
| 75 to 79 Years | 78 (6.5%) | 44 (4.8%) |
| 80 to 84 Years | 33 (2.8%) | 10 (1.1%) |
| 85 Years and over | 0 (0.0%) | 23 (2.5%) |
| Total | 1,193 (100.0%) | 912 (100.0%) |
Families and Households in East Missoula
Median Family Size in East Missoula
The median family size in East Missoula is 2.84 persons per family, with single male/father families (6 | 1.1%) accounting for the largest median family size of 5.17 persons per family. On the other hand, married-couple families (446 | 78.9%) represent the smallest median family size with 2.72 persons per family.
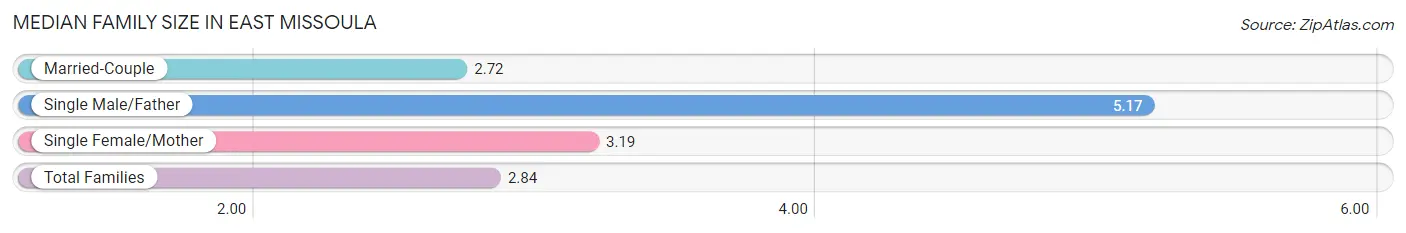
| Family Type | # Families | Family Size |
| Married-Couple | 446 (78.9%) | 2.72 |
| Single Male/Father | 6 (1.1%) | 5.17 |
| Single Female/Mother | 113 (20.0%) | 3.19 |
| Total Families | 565 (100.0%) | 2.84 |
Median Household Size in East Missoula
The median household size in East Missoula is 2.21 persons per household, with single male/father households (6 | 0.6%) accounting for the largest median household size of 5.17 persons per household. non-family households (386 | 40.6%) represent the smallest median household size with 1.23 persons per household.
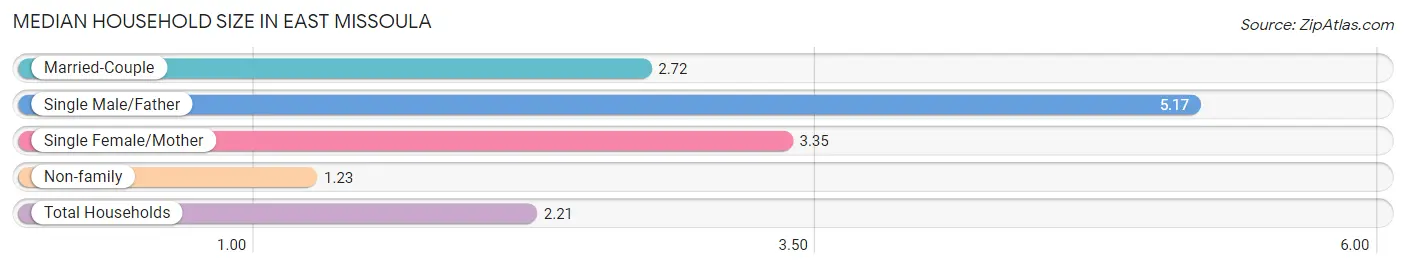
| Household Type | # Households | Household Size |
| Married-Couple | 446 (46.9%) | 2.72 |
| Single Male/Father | 6 (0.6%) | 5.17 |
| Single Female/Mother | 113 (11.9%) | 3.35 |
| Non-family | 386 (40.6%) | 1.23 |
| Total Households | 951 (100.0%) | 2.21 |
Household Size by Marriage Status in East Missoula
Out of a total of 951 households in East Missoula, 565 (59.4%) are family households, while 386 (40.6%) are nonfamily households. The most numerous type of family households are 2-person households, comprising 258, and the most common type of nonfamily households are 1-person households, comprising 288.
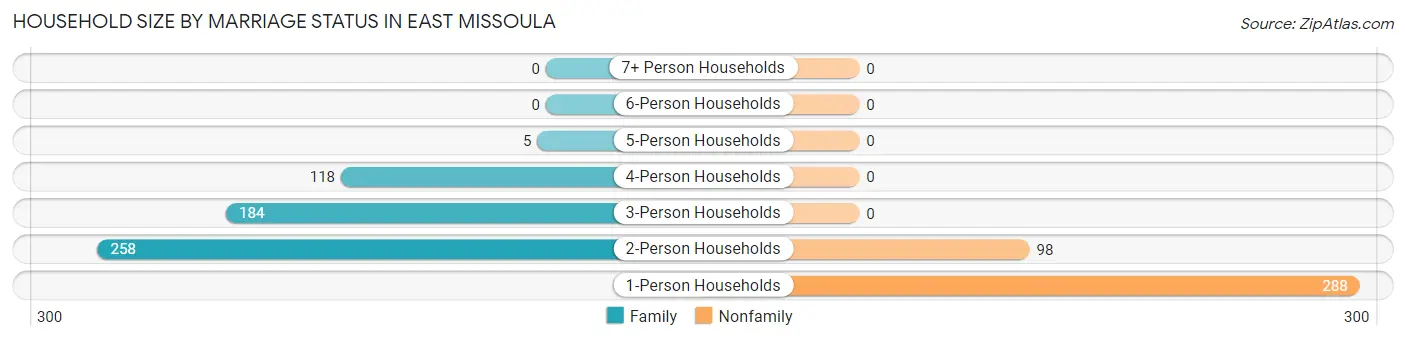
| Household Size | Family Households | Nonfamily Households |
| 1-Person Households | - | 288 (30.3%) |
| 2-Person Households | 258 (27.1%) | 98 (10.3%) |
| 3-Person Households | 184 (19.4%) | 0 (0.0%) |
| 4-Person Households | 118 (12.4%) | 0 (0.0%) |
| 5-Person Households | 5 (0.5%) | 0 (0.0%) |
| 6-Person Households | 0 (0.0%) | 0 (0.0%) |
| 7+ Person Households | 0 (0.0%) | 0 (0.0%) |
| Total | 565 (59.4%) | 386 (40.6%) |
Female Fertility in East Missoula
Fertility by Age in East Missoula
Average fertility rate in East Missoula is 103.0 births per 1,000 women. Women in the age bracket of 15 to 19 years have the highest fertility rate with 313.0 births per 1,000 women. Women in the age bracket of 20 to 34 years acount for 62.5% of all women with births.
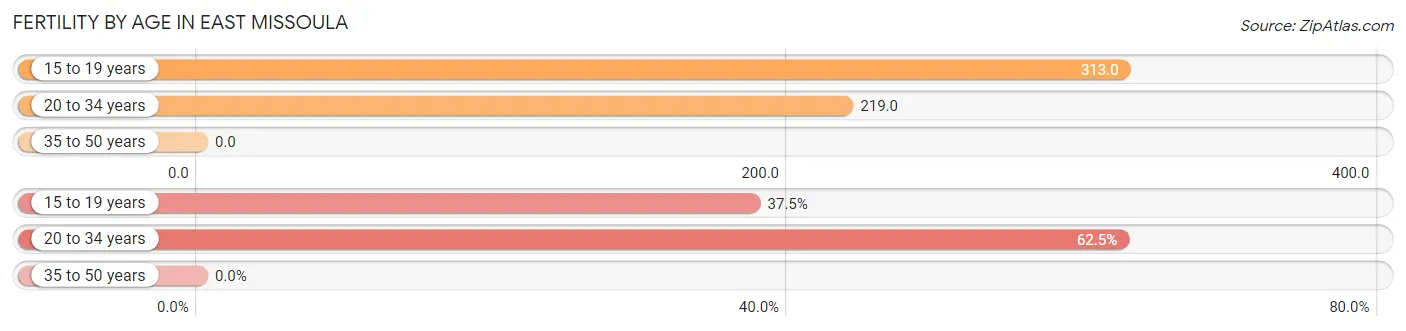
| Age Bracket | Women with Births | Births / 1,000 Women |
| 15 to 19 years | 15 (37.5%) | 313.0 |
| 20 to 34 years | 25 (62.5%) | 219.0 |
| 35 to 50 years | 0 (0.0%) | 0.0 |
| Total | 40 (100.0%) | 103.0 |
Fertility by Age by Marriage Status in East Missoula
62.5% of women with births (40) in East Missoula are married. The highest percentage of unmarried women with births falls into 15 to 19 years age bracket with 100.0% of them unmarried at the time of birth, while the lowest percentage of unmarried women with births belong to 20 to 34 years age bracket with 0.0% of them unmarried.
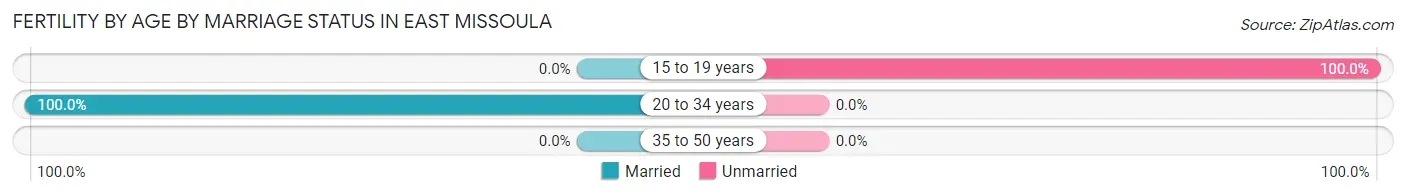
| Age Bracket | Married | Unmarried |
| 15 to 19 years | 0 (0.0%) | 15 (100.0%) |
| 20 to 34 years | 25 (100.0%) | 0 (0.0%) |
| 35 to 50 years | 0 (0.0%) | 0 (0.0%) |
| Total | 25 (62.5%) | 15 (37.5%) |
Fertility by Education in East Missoula
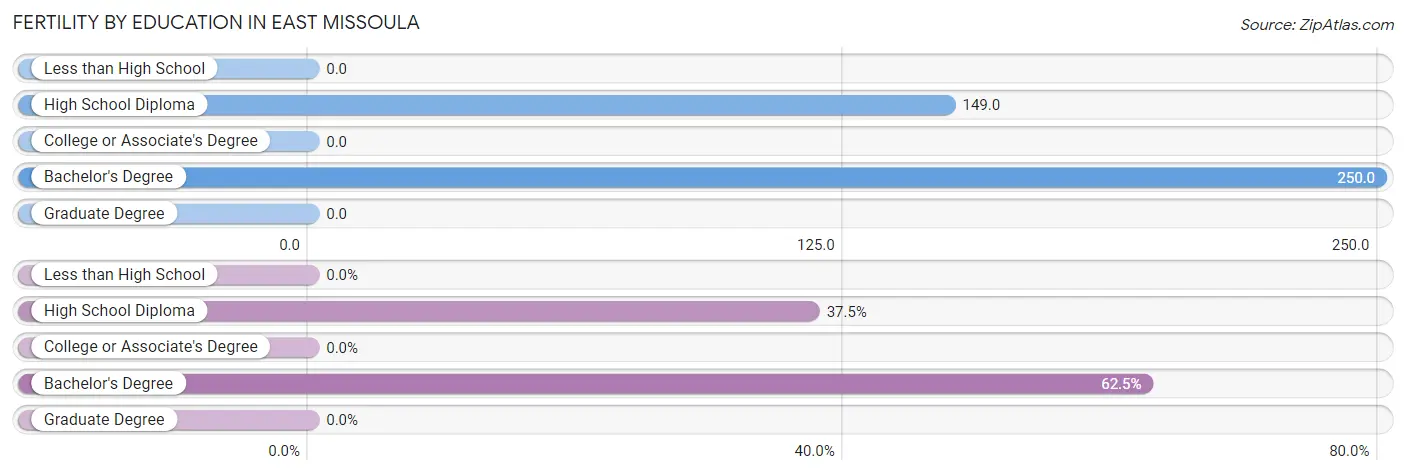
| Educational Attainment | Women with Births | Births / 1,000 Women |
| Less than High School | 0 (0.0%) | 0.0 |
| High School Diploma | 15 (37.5%) | 149.0 |
| College or Associate's Degree | 0 (0.0%) | 0.0 |
| Bachelor's Degree | 25 (62.5%) | 250.0 |
| Graduate Degree | 0 (0.0%) | 0.0 |
| Total | 40 (100.0%) | 103.0 |
Fertility by Education by Marriage Status in East Missoula
37.5% of women with births in East Missoula are unmarried. Women with the educational attainment of bachelor's degree are most likely to be married with 100.0% of them married at childbirth, while women with the educational attainment of high school diploma are least likely to be married with 100.0% of them unmarried at childbirth.
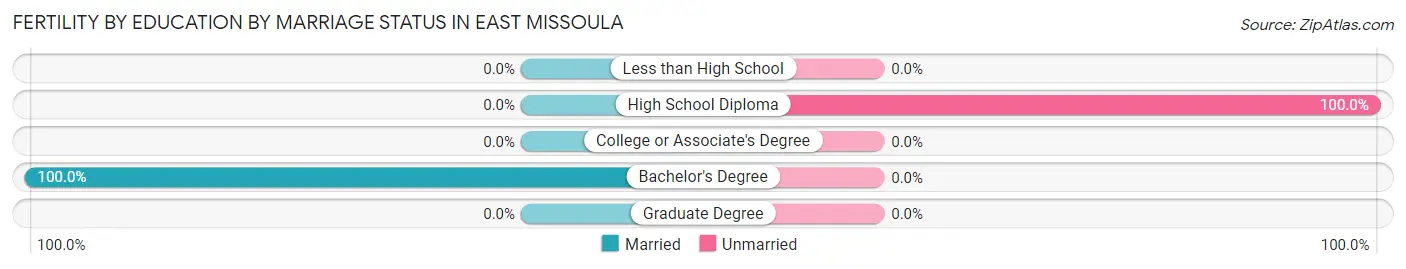
| Educational Attainment | Married | Unmarried |
| Less than High School | 0 (0.0%) | 0 (0.0%) |
| High School Diploma | 0 (0.0%) | 15 (100.0%) |
| College or Associate's Degree | 0 (0.0%) | 0 (0.0%) |
| Bachelor's Degree | 25 (100.0%) | 0 (0.0%) |
| Graduate Degree | 0 (0.0%) | 0 (0.0%) |
| Total | 25 (62.5%) | 15 (37.5%) |
Employment Characteristics in East Missoula
Employment by Class of Employer in East Missoula
Among the 1,050 employed individuals in East Missoula, private company employees (650 | 61.9%), not-for-profit organizations (123 | 11.7%), and self-employed (not incorporated) (114 | 10.9%) make up the most common classes of employment.
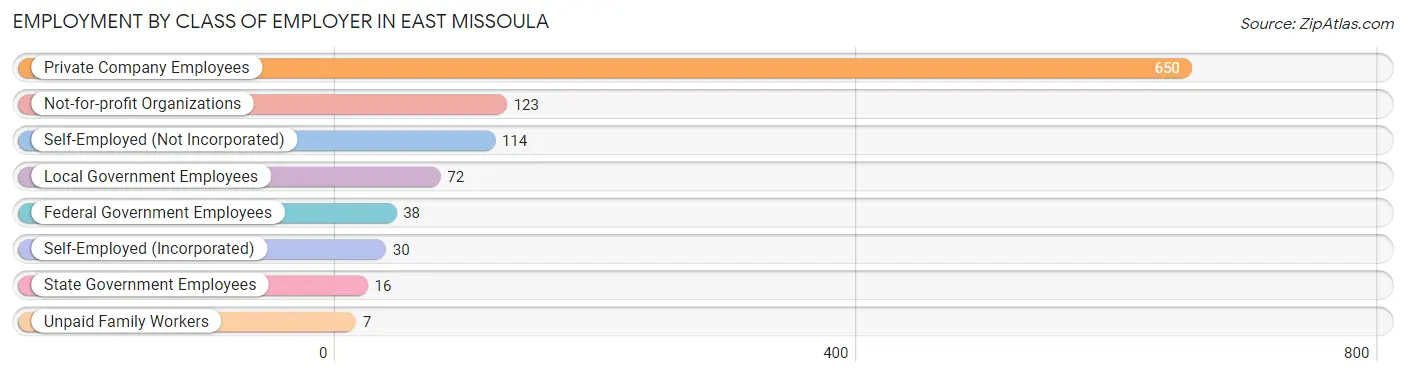
| Employer Class | # Employees | % Employees |
| Private Company Employees | 650 | 61.9% |
| Self-Employed (Incorporated) | 30 | 2.9% |
| Self-Employed (Not Incorporated) | 114 | 10.9% |
| Not-for-profit Organizations | 123 | 11.7% |
| Local Government Employees | 72 | 6.9% |
| State Government Employees | 16 | 1.5% |
| Federal Government Employees | 38 | 3.6% |
| Unpaid Family Workers | 7 | 0.7% |
| Total | 1,050 | 100.0% |
Employment Status by Age in East Missoula
According to the labor force statistics for East Missoula, out of the total population over 16 years of age (1,832), 63.3% or 1,160 individuals are in the labor force, with 7.0% or 81 of them unemployed. The age group with the highest labor force participation rate is 30 to 34 years, with 100.0% or 212 individuals in the labor force. Within the labor force, the 16 to 19 years age range has the highest percentage of unemployed individuals, with 68.0% or 68 of them being unemployed.
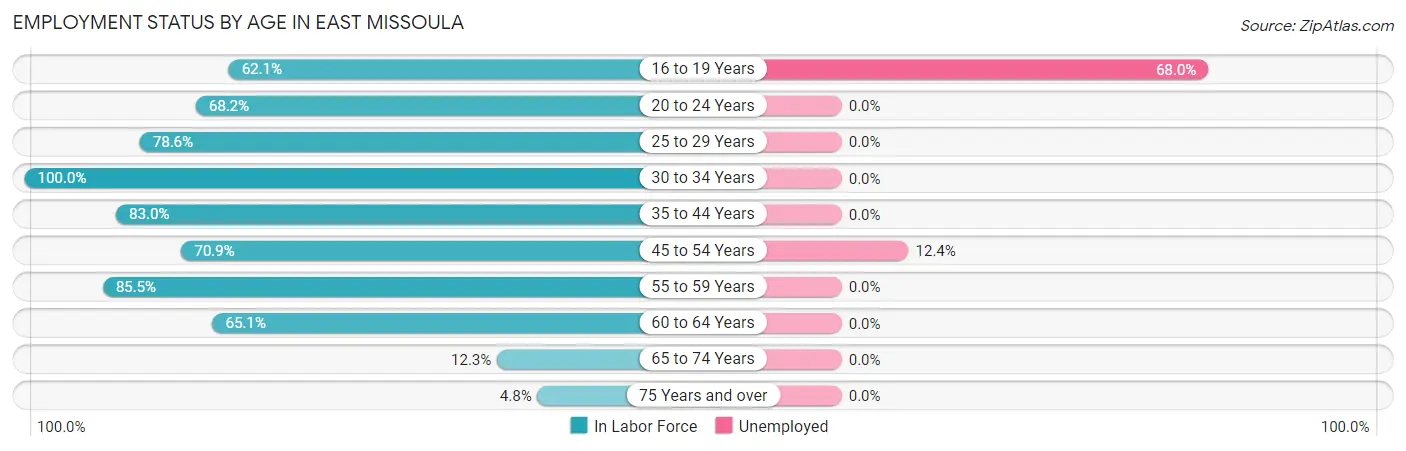
| Age Bracket | In Labor Force | Unemployed |
| 16 to 19 Years | 100 (62.1%) | 68 (68.0%) |
| 20 to 24 Years | 60 (68.2%) | 0 (0.0%) |
| 25 to 29 Years | 66 (78.6%) | 0 (0.0%) |
| 30 to 34 Years | 212 (100.0%) | 0 (0.0%) |
| 35 to 44 Years | 337 (83.0%) | 0 (0.0%) |
| 45 to 54 Years | 105 (70.9%) | 13 (12.4%) |
| 55 to 59 Years | 147 (85.5%) | 0 (0.0%) |
| 60 to 64 Years | 95 (65.1%) | 0 (0.0%) |
| 65 to 74 Years | 28 (12.3%) | 0 (0.0%) |
| 75 Years and over | 9 (4.8%) | 0 (0.0%) |
| Total | 1,160 (63.3%) | 81 (7.0%) |
Employment Status by Educational Attainment in East Missoula
According to labor force statistics for East Missoula, 82.4% of individuals (962) out of the total population between 25 and 64 years of age (1,168) are in the labor force, with 1.4% or 13 of them being unemployed. The group with the highest labor force participation rate are those with the educational attainment of bachelor's degree or higher, with 89.3% or 310 individuals in the labor force. Within the labor force, individuals with high school diploma education have the highest percentage of unemployment, with 5.5% or 13 of them being unemployed.
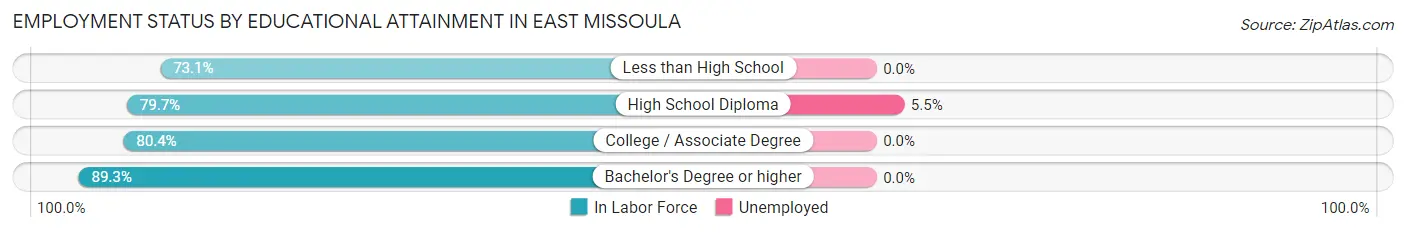
| Educational Attainment | In Labor Force | Unemployed |
| Less than High School | 57 (73.1%) | 0 (0.0%) |
| High School Diploma | 235 (79.7%) | 16 (5.5%) |
| College / Associate Degree | 360 (80.4%) | 0 (0.0%) |
| Bachelor's Degree or higher | 310 (89.3%) | 0 (0.0%) |
| Total | 962 (82.4%) | 16 (1.4%) |
Employment Occupations by Sex in East Missoula
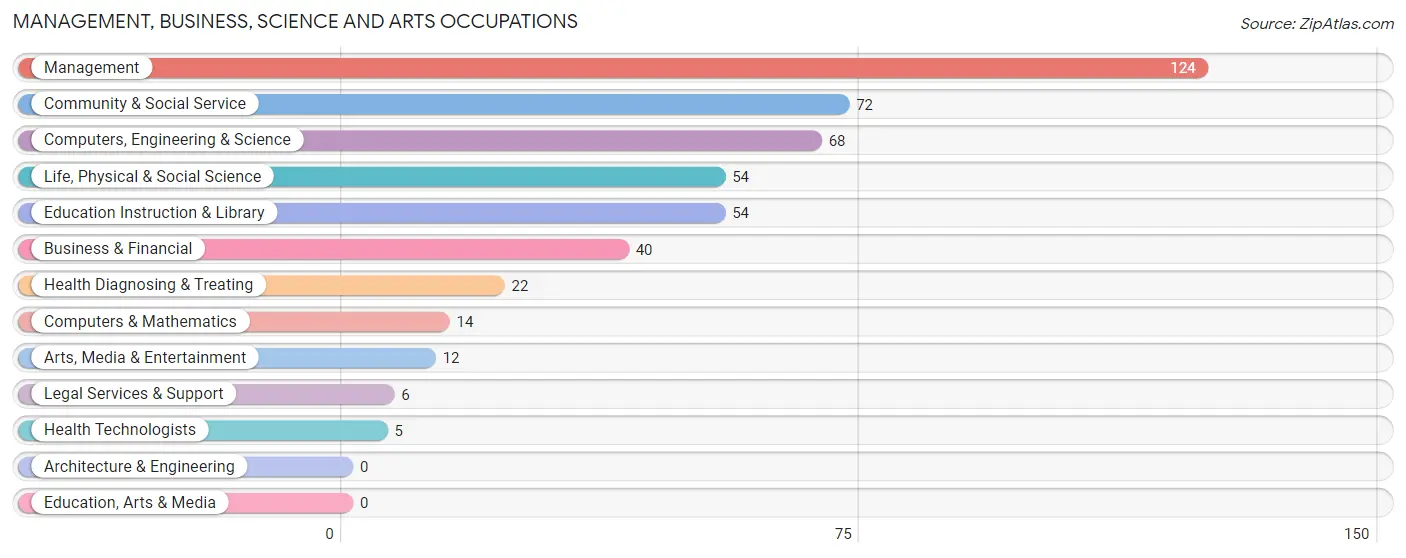
Management, Business, Science and Arts Occupations
The most common Management, Business, Science and Arts occupations in East Missoula are Management (124 | 11.5%), Community & Social Service (72 | 6.7%), Computers, Engineering & Science (68 | 6.3%), Life, Physical & Social Science (54 | 5.0%), and Education Instruction & Library (54 | 5.0%).
Management, Business, Science and Arts Occupations by Sex
Within the Management, Business, Science and Arts occupations in East Missoula, the most male-oriented occupations are Computers & Mathematics (100.0%), Arts, Media & Entertainment (100.0%), and Computers, Engineering & Science (83.8%), while the most female-oriented occupations are Business & Financial (100.0%), Legal Services & Support (100.0%), and Education Instruction & Library (100.0%).
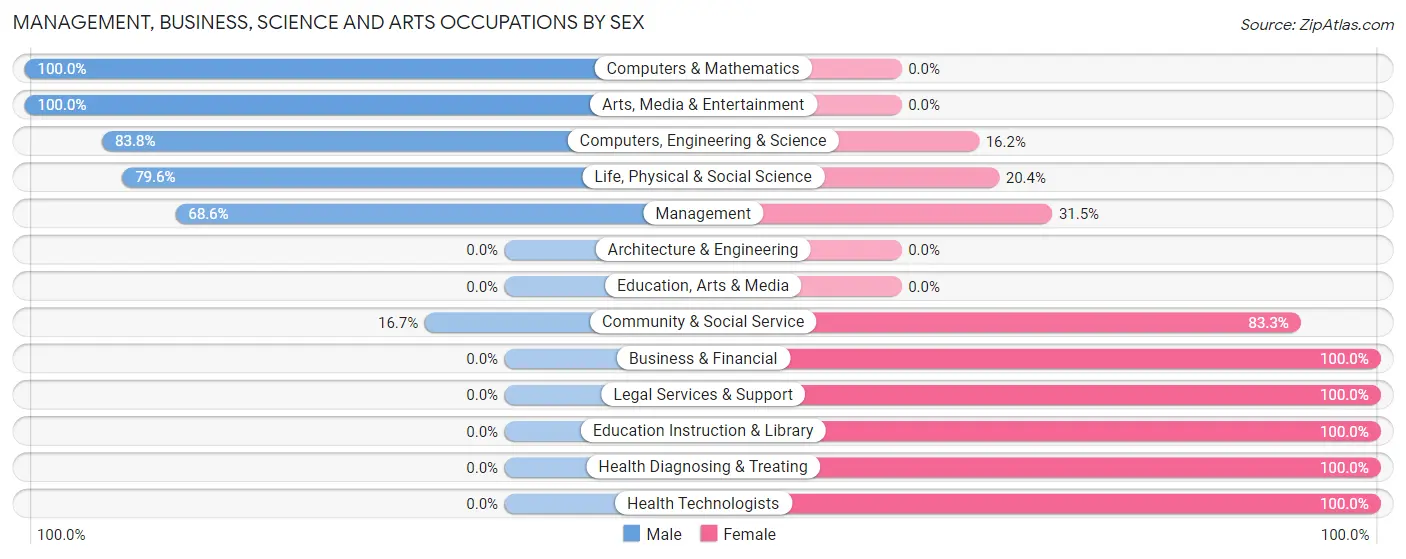
| Occupation | Male | Female |
| Management | 85 (68.5%) | 39 (31.5%) |
| Business & Financial | 0 (0.0%) | 40 (100.0%) |
| Computers, Engineering & Science | 57 (83.8%) | 11 (16.2%) |
| Computers & Mathematics | 14 (100.0%) | 0 (0.0%) |
| Architecture & Engineering | 0 (0.0%) | 0 (0.0%) |
| Life, Physical & Social Science | 43 (79.6%) | 11 (20.4%) |
| Community & Social Service | 12 (16.7%) | 60 (83.3%) |
| Education, Arts & Media | 0 (0.0%) | 0 (0.0%) |
| Legal Services & Support | 0 (0.0%) | 6 (100.0%) |
| Education Instruction & Library | 0 (0.0%) | 54 (100.0%) |
| Arts, Media & Entertainment | 12 (100.0%) | 0 (0.0%) |
| Health Diagnosing & Treating | 0 (0.0%) | 22 (100.0%) |
| Health Technologists | 0 (0.0%) | 5 (100.0%) |
| Total (Category) | 154 (47.2%) | 172 (52.8%) |
| Total (Overall) | 611 (56.7%) | 467 (43.3%) |
Services Occupations
The most common Services occupations in East Missoula are Food Preparation & Serving (120 | 11.1%), Cleaning & Maintenance (47 | 4.4%), Security & Protection (42 | 3.9%), Firefighting & Prevention (42 | 3.9%), and Healthcare Support (40 | 3.7%).
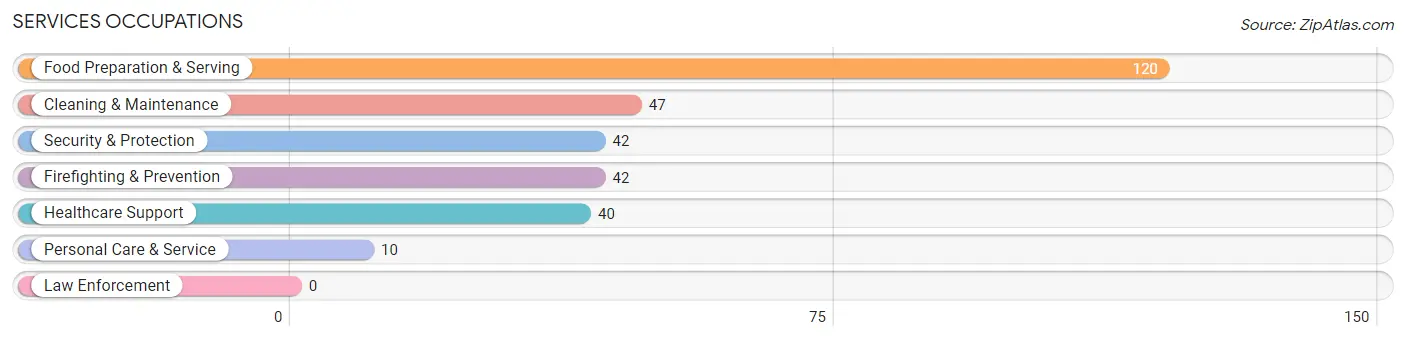
Services Occupations by Sex
Within the Services occupations in East Missoula, the most male-oriented occupations are Cleaning & Maintenance (80.8%), Food Preparation & Serving (50.0%), and Healthcare Support (25.0%), while the most female-oriented occupations are Security & Protection (100.0%), Firefighting & Prevention (100.0%), and Personal Care & Service (100.0%).
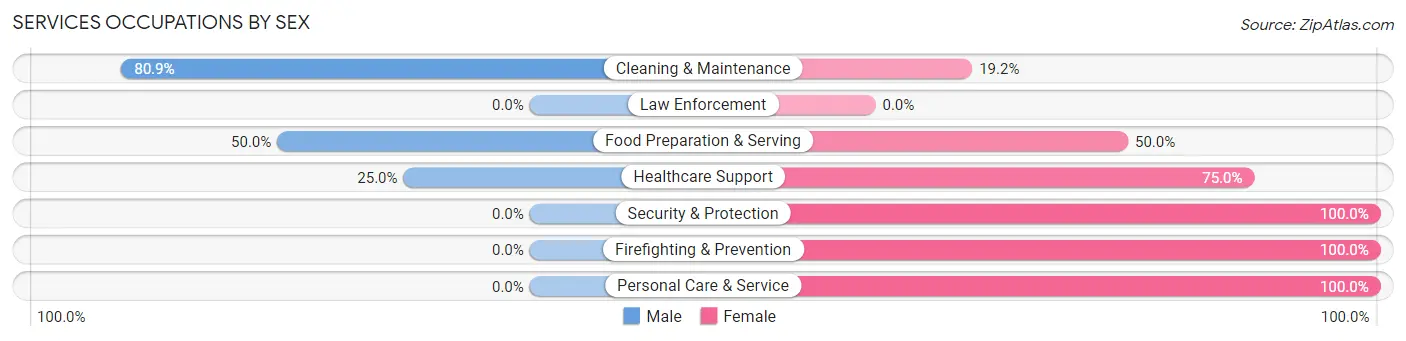
| Occupation | Male | Female |
| Healthcare Support | 10 (25.0%) | 30 (75.0%) |
| Security & Protection | 0 (0.0%) | 42 (100.0%) |
| Firefighting & Prevention | 0 (0.0%) | 42 (100.0%) |
| Law Enforcement | 0 (0.0%) | 0 (0.0%) |
| Food Preparation & Serving | 60 (50.0%) | 60 (50.0%) |
| Cleaning & Maintenance | 38 (80.8%) | 9 (19.2%) |
| Personal Care & Service | 0 (0.0%) | 10 (100.0%) |
| Total (Category) | 108 (41.7%) | 151 (58.3%) |
| Total (Overall) | 611 (56.7%) | 467 (43.3%) |
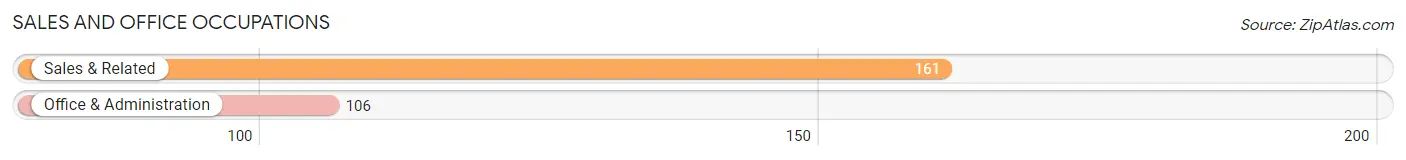
Sales and Office Occupations
The most common Sales and Office occupations in East Missoula are Sales & Related (161 | 14.9%), and Office & Administration (106 | 9.8%).
Sales and Office Occupations by Sex
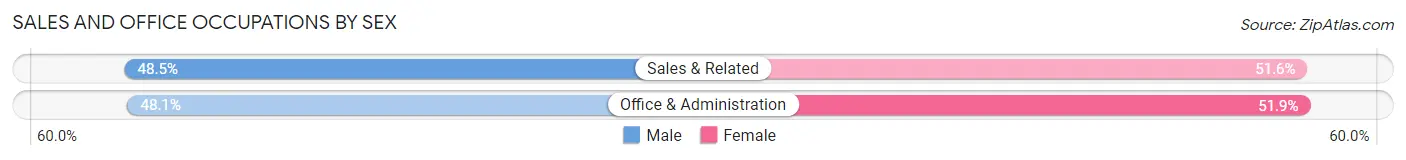
| Occupation | Male | Female |
| Sales & Related | 78 (48.4%) | 83 (51.5%) |
| Office & Administration | 51 (48.1%) | 55 (51.9%) |
| Total (Category) | 129 (48.3%) | 138 (51.7%) |
| Total (Overall) | 611 (56.7%) | 467 (43.3%) |
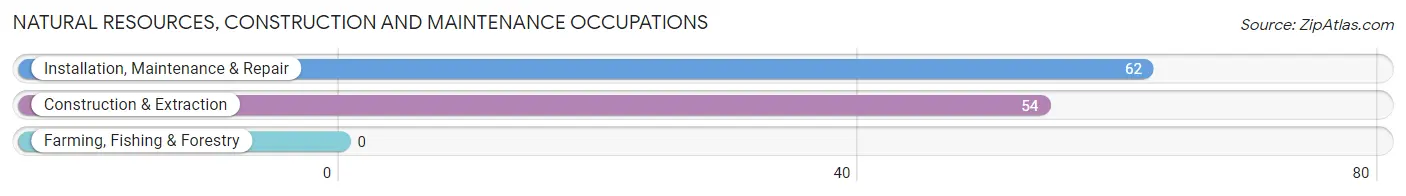
Natural Resources, Construction and Maintenance Occupations
The most common Natural Resources, Construction and Maintenance occupations in East Missoula are Installation, Maintenance & Repair (62 | 5.8%), and Construction & Extraction (54 | 5.0%).
Natural Resources, Construction and Maintenance Occupations by Sex
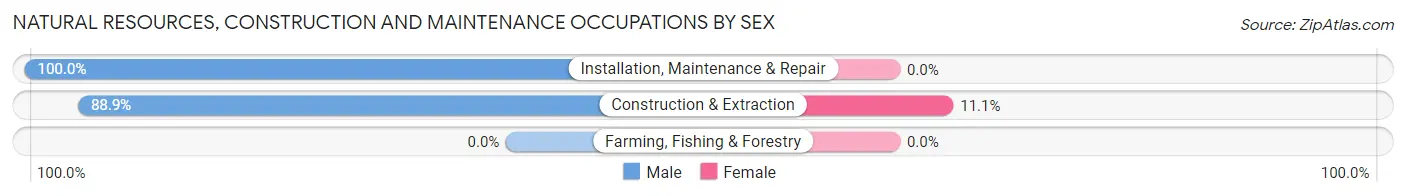
| Occupation | Male | Female |
| Farming, Fishing & Forestry | 0 (0.0%) | 0 (0.0%) |
| Construction & Extraction | 48 (88.9%) | 6 (11.1%) |
| Installation, Maintenance & Repair | 62 (100.0%) | 0 (0.0%) |
| Total (Category) | 110 (94.8%) | 6 (5.2%) |
| Total (Overall) | 611 (56.7%) | 467 (43.3%) |
Production, Transportation and Moving Occupations
The most common Production, Transportation and Moving occupations in East Missoula are Production (56 | 5.2%), Transportation (48 | 4.4%), and Material Moving (6 | 0.6%).
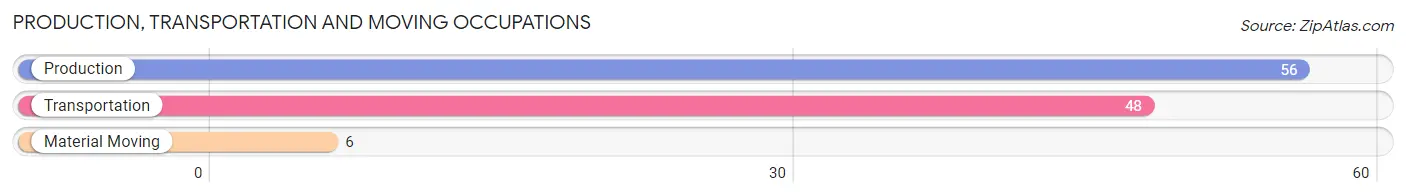
Production, Transportation and Moving Occupations by Sex
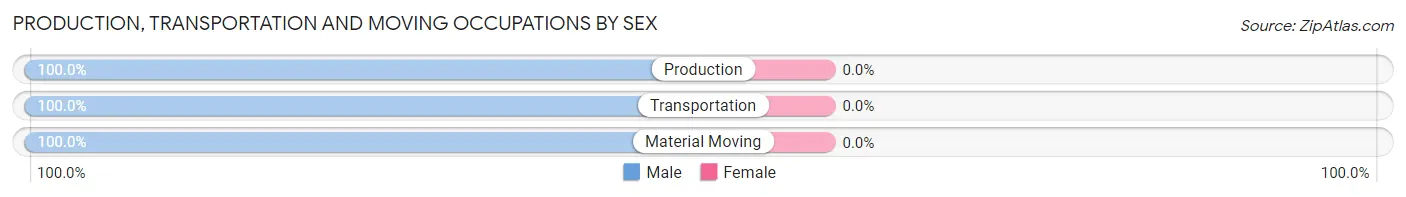
| Occupation | Male | Female |
| Production | 56 (100.0%) | 0 (0.0%) |
| Transportation | 48 (100.0%) | 0 (0.0%) |
| Material Moving | 6 (100.0%) | 0 (0.0%) |
| Total (Category) | 110 (100.0%) | 0 (0.0%) |
| Total (Overall) | 611 (56.7%) | 467 (43.3%) |
Employment Industries by Sex in East Missoula
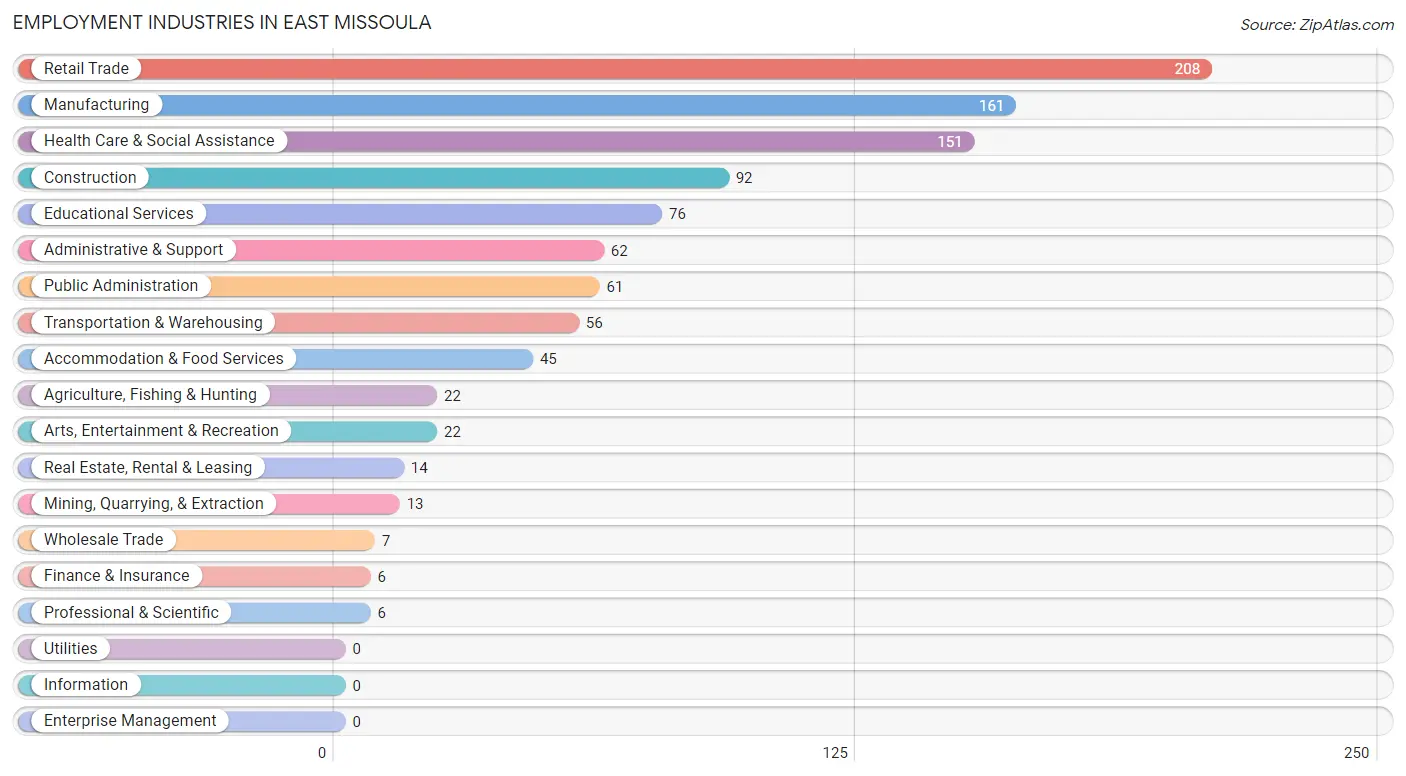
Employment Industries in East Missoula
The major employment industries in East Missoula include Retail Trade (208 | 19.3%), Manufacturing (161 | 14.9%), Health Care & Social Assistance (151 | 14.0%), Construction (92 | 8.5%), and Educational Services (76 | 7.0%).
Employment Industries by Sex in East Missoula
The East Missoula industries that see more men than women are Mining, Quarrying, & Extraction (100.0%), Wholesale Trade (100.0%), and Administrative & Support (100.0%), whereas the industries that tend to have a higher number of women are Finance & Insurance (100.0%), Real Estate, Rental & Leasing (100.0%), and Professional & Scientific (100.0%).
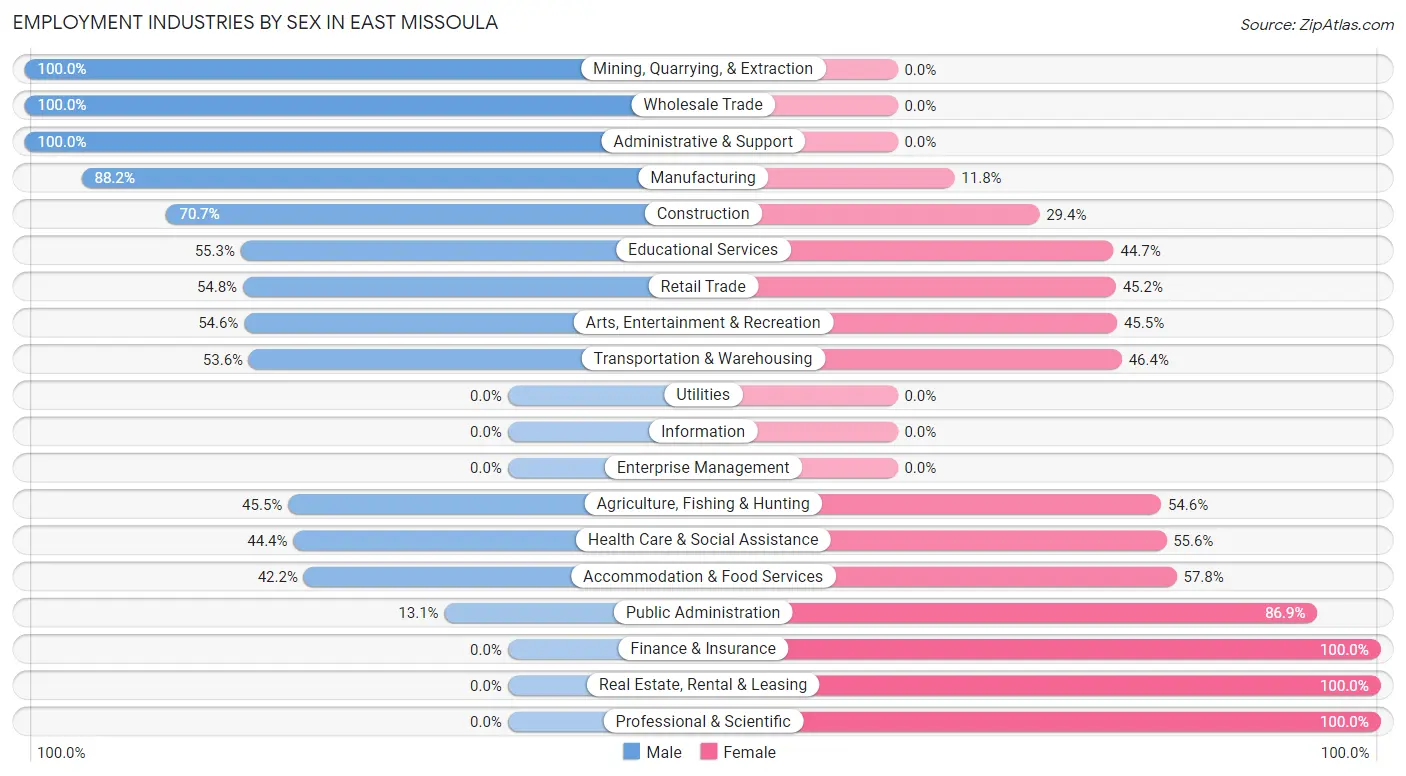
| Industry | Male | Female |
| Agriculture, Fishing & Hunting | 10 (45.5%) | 12 (54.5%) |
| Mining, Quarrying, & Extraction | 13 (100.0%) | 0 (0.0%) |
| Construction | 65 (70.7%) | 27 (29.3%) |
| Manufacturing | 142 (88.2%) | 19 (11.8%) |
| Wholesale Trade | 7 (100.0%) | 0 (0.0%) |
| Retail Trade | 114 (54.8%) | 94 (45.2%) |
| Transportation & Warehousing | 30 (53.6%) | 26 (46.4%) |
| Utilities | 0 (0.0%) | 0 (0.0%) |
| Information | 0 (0.0%) | 0 (0.0%) |
| Finance & Insurance | 0 (0.0%) | 6 (100.0%) |
| Real Estate, Rental & Leasing | 0 (0.0%) | 14 (100.0%) |
| Professional & Scientific | 0 (0.0%) | 6 (100.0%) |
| Enterprise Management | 0 (0.0%) | 0 (0.0%) |
| Administrative & Support | 62 (100.0%) | 0 (0.0%) |
| Educational Services | 42 (55.3%) | 34 (44.7%) |
| Health Care & Social Assistance | 67 (44.4%) | 84 (55.6%) |
| Arts, Entertainment & Recreation | 12 (54.5%) | 10 (45.5%) |
| Accommodation & Food Services | 19 (42.2%) | 26 (57.8%) |
| Public Administration | 8 (13.1%) | 53 (86.9%) |
| Total | 611 (56.7%) | 467 (43.3%) |
Education in East Missoula
School Enrollment in East Missoula
The most common levels of schooling among the 336 students in East Missoula are middle school (82 | 24.4%), elementary school (81 | 24.1%), and high school (68 | 20.2%).
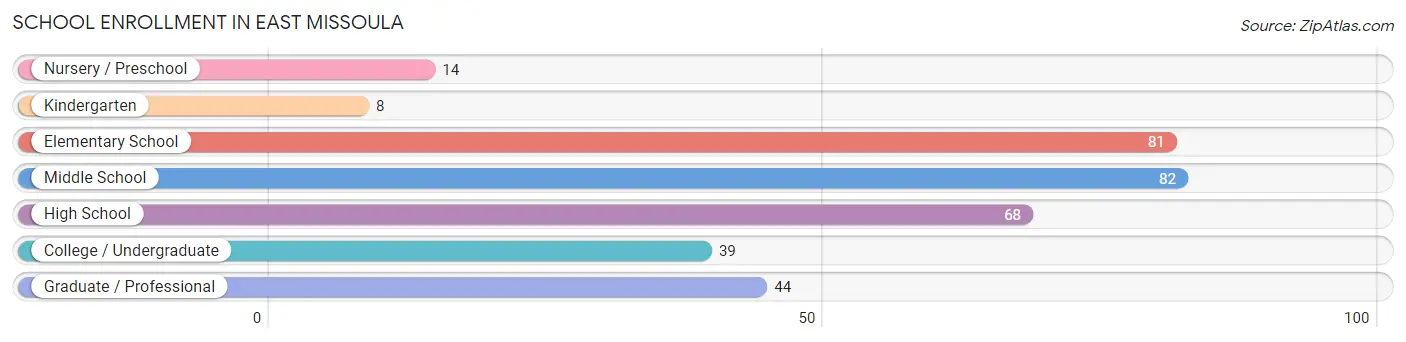
| School Level | # Students | % Students |
| Nursery / Preschool | 14 | 4.2% |
| Kindergarten | 8 | 2.4% |
| Elementary School | 81 | 24.1% |
| Middle School | 82 | 24.4% |
| High School | 68 | 20.2% |
| College / Undergraduate | 39 | 11.6% |
| Graduate / Professional | 44 | 13.1% |
| Total | 336 | 100.0% |
School Enrollment by Age by Funding Source in East Missoula
Out of a total of 336 students who are enrolled in schools in East Missoula, 11 (3.3%) attend a private institution, while the remaining 325 (96.7%) are enrolled in public schools. The age group of 35 years and over has the highest likelihood of being enrolled in private schools, with 11 (28.9% in the age bracket) enrolled. Conversely, the age group of 3 to 4 year olds has the lowest likelihood of being enrolled in a private school, with 14 (100.0% in the age bracket) attending a public institution.
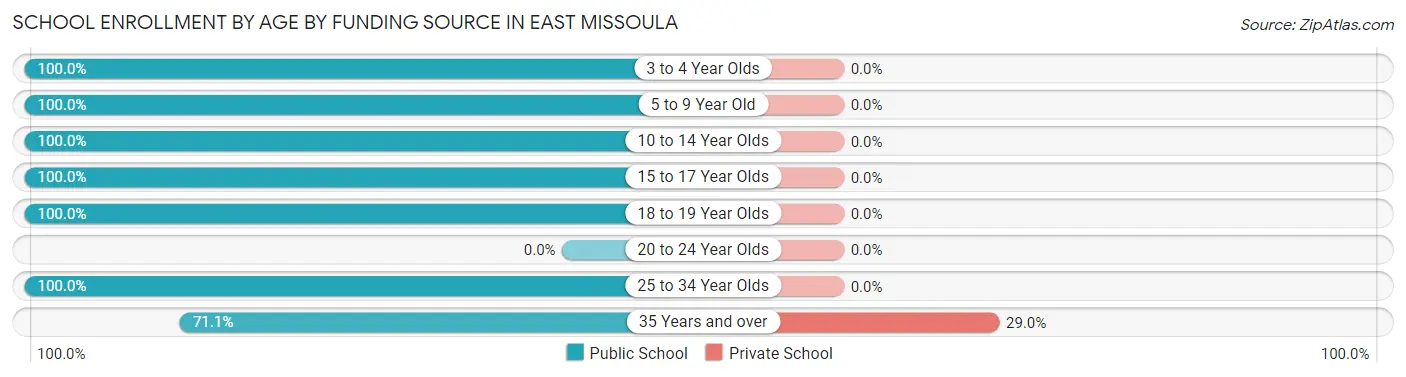
| Age Bracket | Public School | Private School |
| 3 to 4 Year Olds | 14 (100.0%) | 0 (0.0%) |
| 5 to 9 Year Old | 67 (100.0%) | 0 (0.0%) |
| 10 to 14 Year Olds | 112 (100.0%) | 0 (0.0%) |
| 15 to 17 Year Olds | 32 (100.0%) | 0 (0.0%) |
| 18 to 19 Year Olds | 28 (100.0%) | 0 (0.0%) |
| 20 to 24 Year Olds | 0 (0.0%) | 0 (0.0%) |
| 25 to 34 Year Olds | 45 (100.0%) | 0 (0.0%) |
| 35 Years and over | 27 (71.1%) | 11 (28.9%) |
| Total | 325 (96.7%) | 11 (3.3%) |
Educational Attainment by Field of Study in East Missoula
Business (118 | 24.8%), education (87 | 18.3%), bio, nature & agricultural (73 | 15.4%), social sciences (39 | 8.2%), and physical & health sciences (24 | 5.1%) are the most common fields of study among 475 individuals in East Missoula who have obtained a bachelor's degree or higher.
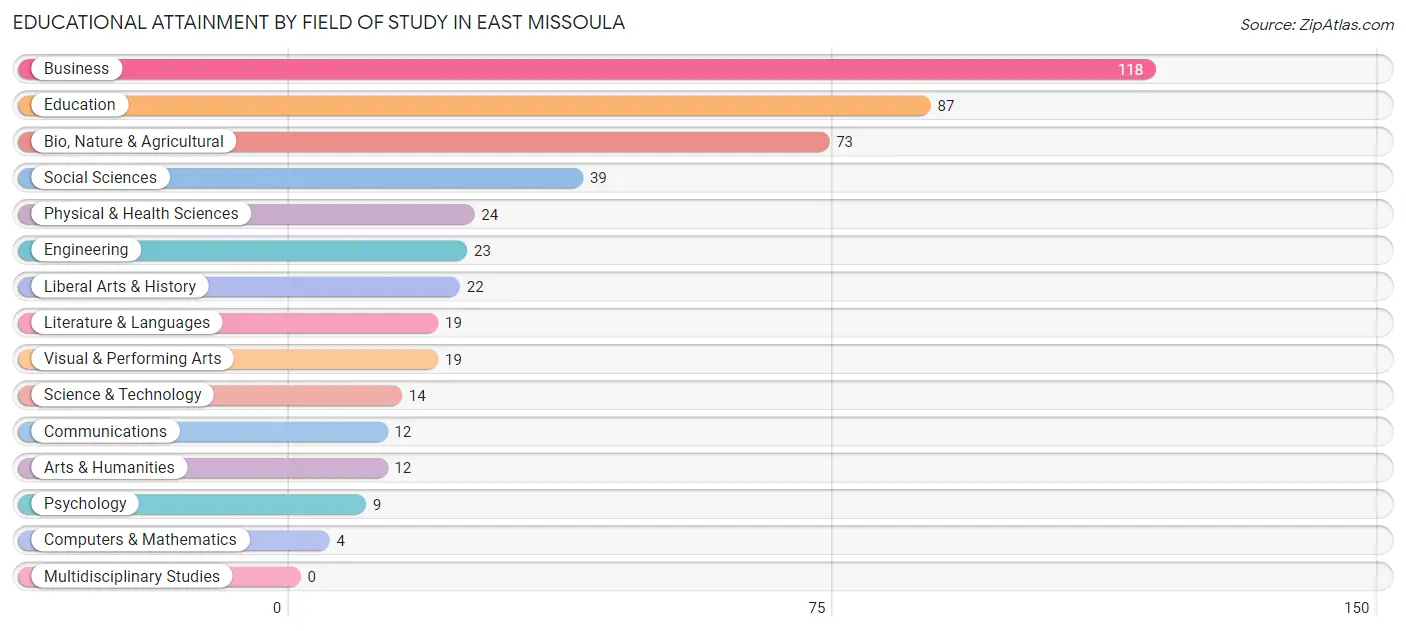
| Field of Study | # Graduates | % Graduates |
| Computers & Mathematics | 4 | 0.8% |
| Bio, Nature & Agricultural | 73 | 15.4% |
| Physical & Health Sciences | 24 | 5.1% |
| Psychology | 9 | 1.9% |
| Social Sciences | 39 | 8.2% |
| Engineering | 23 | 4.8% |
| Multidisciplinary Studies | 0 | 0.0% |
| Science & Technology | 14 | 2.9% |
| Business | 118 | 24.8% |
| Education | 87 | 18.3% |
| Literature & Languages | 19 | 4.0% |
| Liberal Arts & History | 22 | 4.6% |
| Visual & Performing Arts | 19 | 4.0% |
| Communications | 12 | 2.5% |
| Arts & Humanities | 12 | 2.5% |
| Total | 475 | 100.0% |
Transportation & Commute in East Missoula
Vehicle Availability by Sex in East Missoula
The most prevalent vehicle ownership categories in East Missoula are males with 2 vehicles (326, accounting for 55.1%) and females with 2 vehicles (282, making up 71.2%).
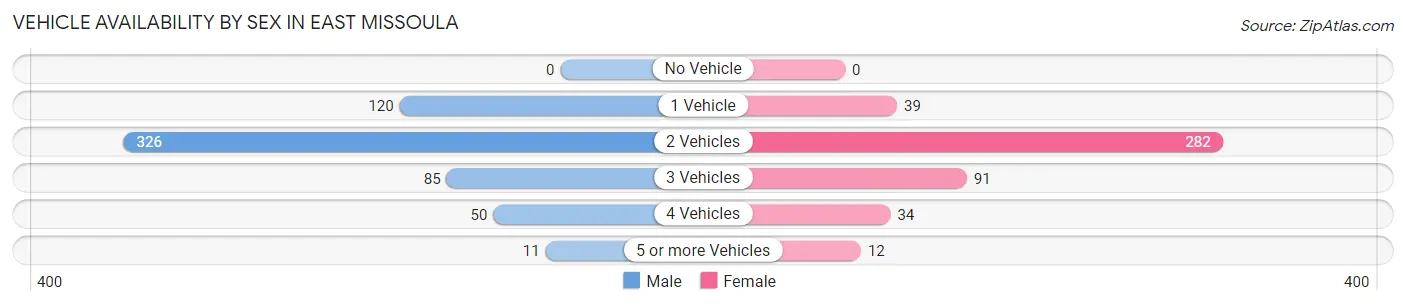
| Vehicles Available | Male | Female |
| No Vehicle | 0 (0.0%) | 0 (0.0%) |
| 1 Vehicle | 120 (20.3%) | 39 (8.5%) |
| 2 Vehicles | 326 (55.1%) | 282 (61.6%) |
| 3 Vehicles | 85 (14.4%) | 91 (19.9%) |
| 4 Vehicles | 50 (8.5%) | 34 (7.4%) |
| 5 or more Vehicles | 11 (1.9%) | 12 (2.6%) |
| Total | 592 (100.0%) | 458 (100.0%) |
Commute Time in East Missoula
The most frequently occuring commute durations in East Missoula are 10 to 14 minutes (300 commuters, 31.6%), 15 to 19 minutes (281 commuters, 29.6%), and 20 to 24 minutes (110 commuters, 11.6%).
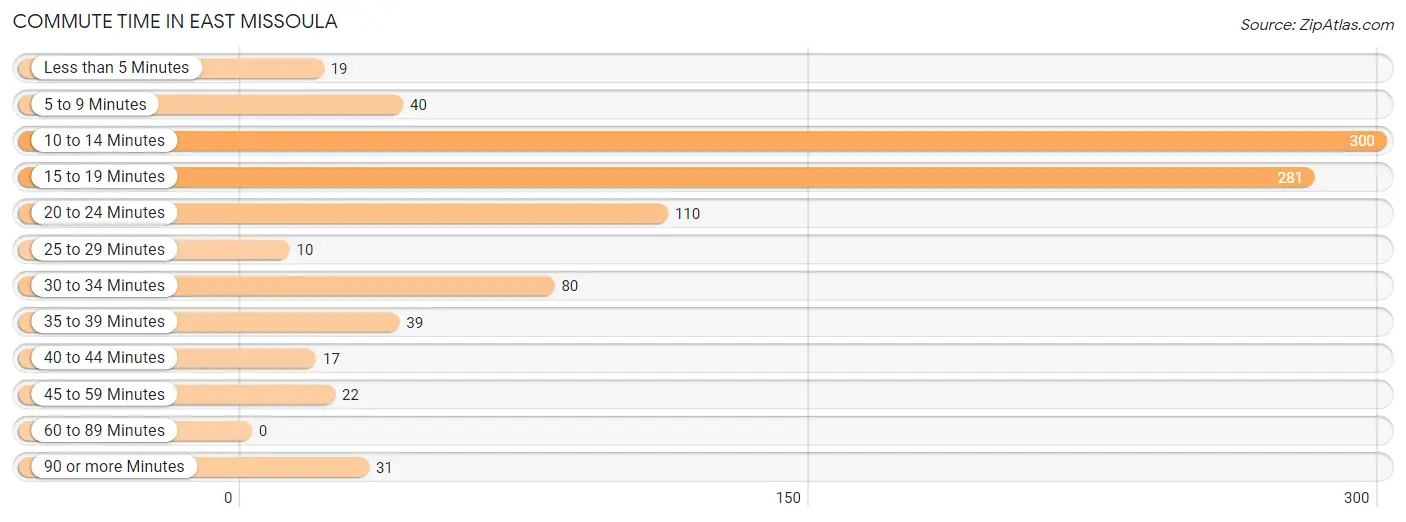
| Commute Time | # Commuters | % Commuters |
| Less than 5 Minutes | 19 | 2.0% |
| 5 to 9 Minutes | 40 | 4.2% |
| 10 to 14 Minutes | 300 | 31.6% |
| 15 to 19 Minutes | 281 | 29.6% |
| 20 to 24 Minutes | 110 | 11.6% |
| 25 to 29 Minutes | 10 | 1.1% |
| 30 to 34 Minutes | 80 | 8.4% |
| 35 to 39 Minutes | 39 | 4.1% |
| 40 to 44 Minutes | 17 | 1.8% |
| 45 to 59 Minutes | 22 | 2.3% |
| 60 to 89 Minutes | 0 | 0.0% |
| 90 or more Minutes | 31 | 3.3% |
Commute Time by Sex in East Missoula
The most common commute times in East Missoula are 10 to 14 minutes (181 commuters, 33.5%) for males and 15 to 19 minutes (183 commuters, 44.7%) for females.
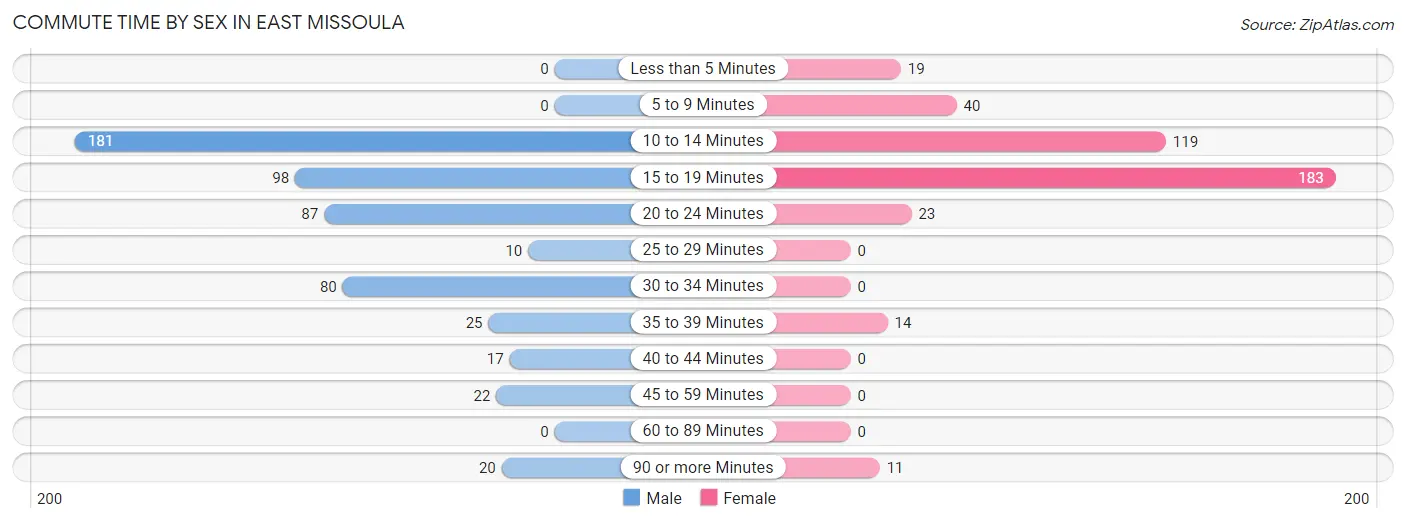
| Commute Time | Male | Female |
| Less than 5 Minutes | 0 (0.0%) | 19 (4.6%) |
| 5 to 9 Minutes | 0 (0.0%) | 40 (9.8%) |
| 10 to 14 Minutes | 181 (33.5%) | 119 (29.1%) |
| 15 to 19 Minutes | 98 (18.1%) | 183 (44.7%) |
| 20 to 24 Minutes | 87 (16.1%) | 23 (5.6%) |
| 25 to 29 Minutes | 10 (1.8%) | 0 (0.0%) |
| 30 to 34 Minutes | 80 (14.8%) | 0 (0.0%) |
| 35 to 39 Minutes | 25 (4.6%) | 14 (3.4%) |
| 40 to 44 Minutes | 17 (3.2%) | 0 (0.0%) |
| 45 to 59 Minutes | 22 (4.1%) | 0 (0.0%) |
| 60 to 89 Minutes | 0 (0.0%) | 0 (0.0%) |
| 90 or more Minutes | 20 (3.7%) | 11 (2.7%) |
Time of Departure to Work by Sex in East Missoula
The most frequent times of departure to work in East Missoula are 7:30 AM to 7:59 AM (103, 19.1%) for males and 6:30 AM to 6:59 AM (83, 20.3%) for females.
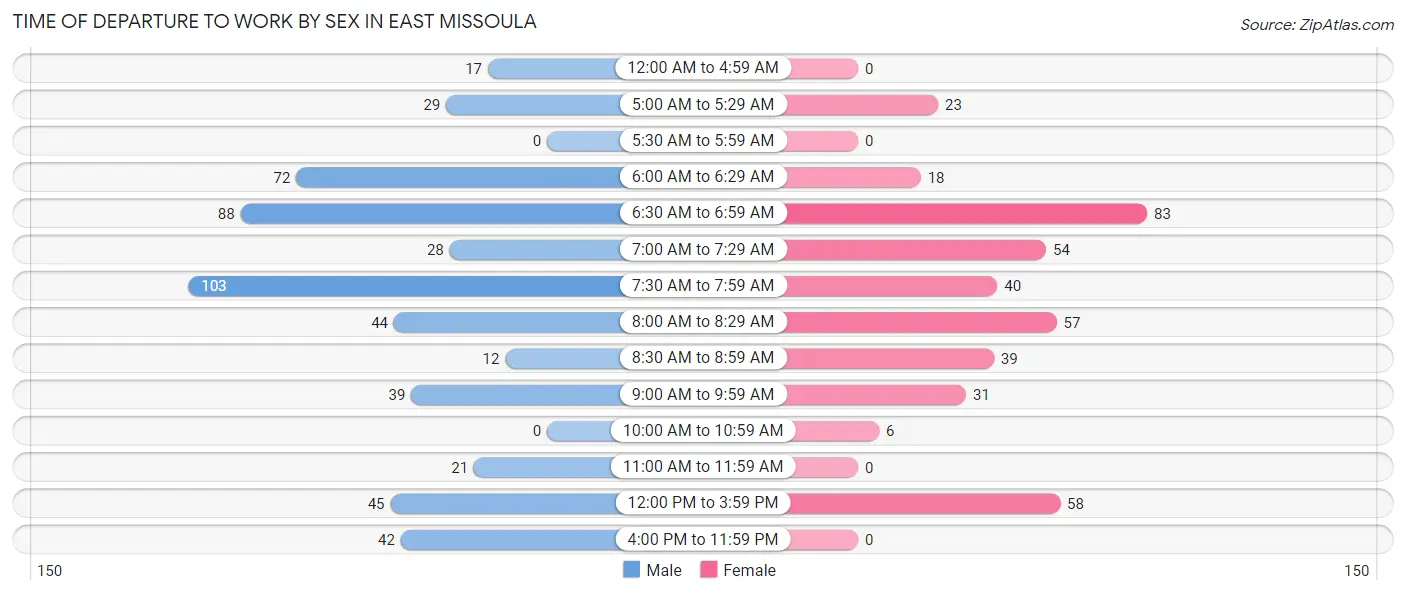
| Time of Departure | Male | Female |
| 12:00 AM to 4:59 AM | 17 (3.2%) | 0 (0.0%) |
| 5:00 AM to 5:29 AM | 29 (5.4%) | 23 (5.6%) |
| 5:30 AM to 5:59 AM | 0 (0.0%) | 0 (0.0%) |
| 6:00 AM to 6:29 AM | 72 (13.3%) | 18 (4.4%) |
| 6:30 AM to 6:59 AM | 88 (16.3%) | 83 (20.3%) |
| 7:00 AM to 7:29 AM | 28 (5.2%) | 54 (13.2%) |
| 7:30 AM to 7:59 AM | 103 (19.1%) | 40 (9.8%) |
| 8:00 AM to 8:29 AM | 44 (8.2%) | 57 (13.9%) |
| 8:30 AM to 8:59 AM | 12 (2.2%) | 39 (9.5%) |
| 9:00 AM to 9:59 AM | 39 (7.2%) | 31 (7.6%) |
| 10:00 AM to 10:59 AM | 0 (0.0%) | 6 (1.5%) |
| 11:00 AM to 11:59 AM | 21 (3.9%) | 0 (0.0%) |
| 12:00 PM to 3:59 PM | 45 (8.3%) | 58 (14.2%) |
| 4:00 PM to 11:59 PM | 42 (7.8%) | 0 (0.0%) |
| Total | 540 (100.0%) | 409 (100.0%) |
Housing Occupancy in East Missoula
Occupancy by Ownership in East Missoula
Of the total 951 dwellings in East Missoula, owner-occupied units account for 668 (70.2%), while renter-occupied units make up 283 (29.8%).
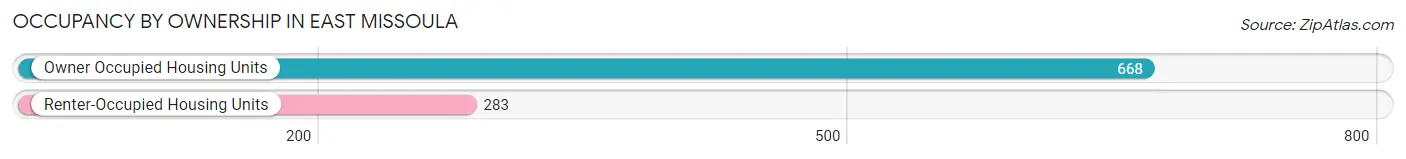
| Occupancy | # Housing Units | % Housing Units |
| Owner Occupied Housing Units | 668 | 70.2% |
| Renter-Occupied Housing Units | 283 | 29.8% |
| Total Occupied Housing Units | 951 | 100.0% |
Occupancy by Household Size in East Missoula
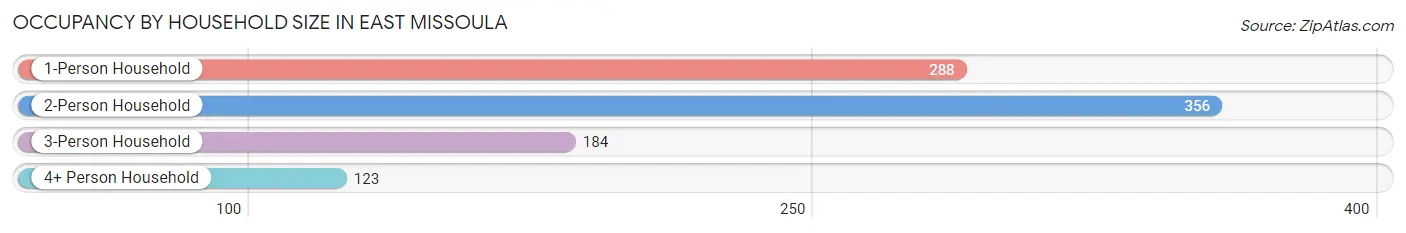
| Household Size | # Housing Units | % Housing Units |
| 1-Person Household | 288 | 30.3% |
| 2-Person Household | 356 | 37.4% |
| 3-Person Household | 184 | 19.4% |
| 4+ Person Household | 123 | 12.9% |
| Total Housing Units | 951 | 100.0% |
Occupancy by Ownership by Household Size in East Missoula
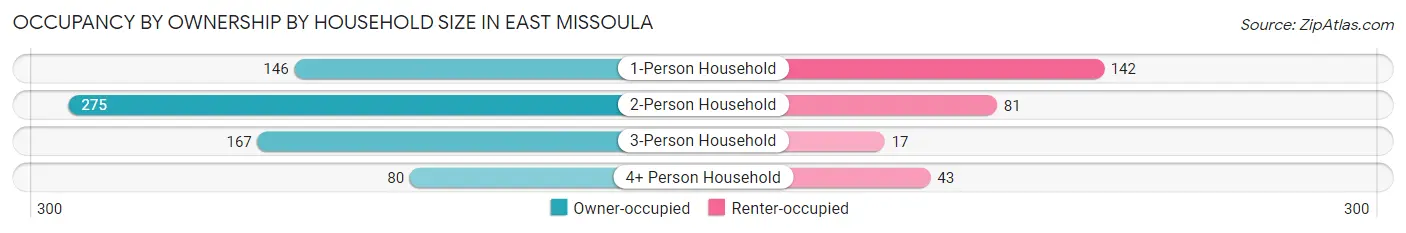
| Household Size | Owner-occupied | Renter-occupied |
| 1-Person Household | 146 (50.7%) | 142 (49.3%) |
| 2-Person Household | 275 (77.2%) | 81 (22.8%) |
| 3-Person Household | 167 (90.8%) | 17 (9.2%) |
| 4+ Person Household | 80 (65.0%) | 43 (35.0%) |
| Total Housing Units | 668 (70.2%) | 283 (29.8%) |
Occupancy by Educational Attainment in East Missoula
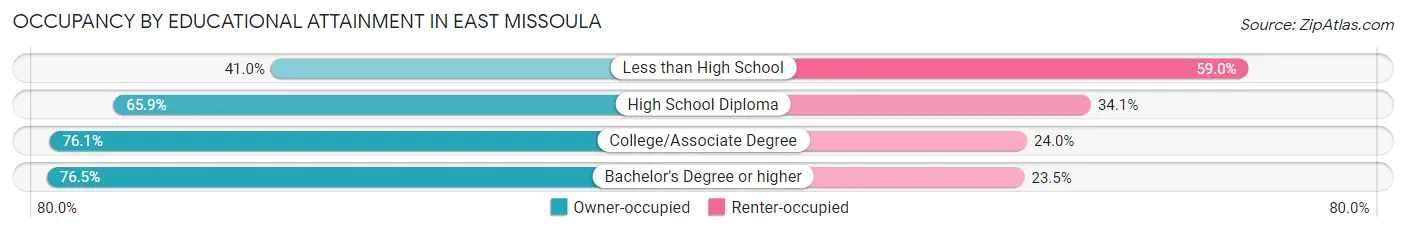
| Household Size | Owner-occupied | Renter-occupied |
| Less than High School | 34 (41.0%) | 49 (59.0%) |
| High School Diploma | 178 (65.9%) | 92 (34.1%) |
| College/Associate Degree | 235 (76.0%) | 74 (23.9%) |
| Bachelor's Degree or higher | 221 (76.5%) | 68 (23.5%) |
Occupancy by Age of Householder in East Missoula
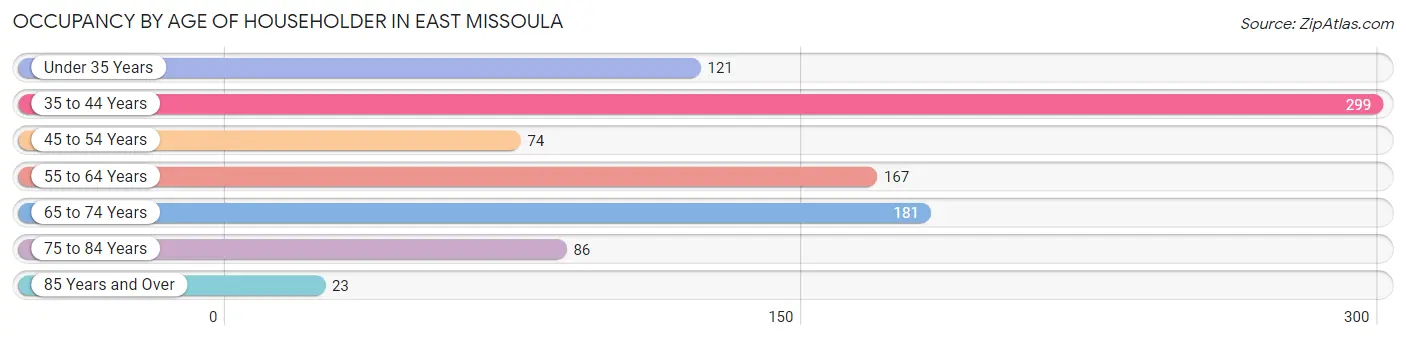
| Age Bracket | # Households | % Households |
| Under 35 Years | 121 | 12.7% |
| 35 to 44 Years | 299 | 31.4% |
| 45 to 54 Years | 74 | 7.8% |
| 55 to 64 Years | 167 | 17.6% |
| 65 to 74 Years | 181 | 19.0% |
| 75 to 84 Years | 86 | 9.0% |
| 85 Years and Over | 23 | 2.4% |
| Total | 951 | 100.0% |
Housing Finances in East Missoula
Median Income by Occupancy in East Missoula
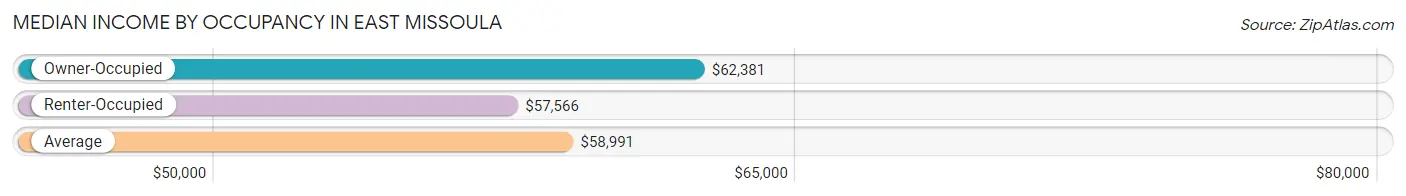
| Occupancy Type | # Households | Median Income |
| Owner-Occupied | 668 (70.2%) | $62,381 |
| Renter-Occupied | 283 (29.8%) | $57,566 |
| Average | 951 (100.0%) | $58,991 |
Occupancy by Householder Income Bracket in East Missoula
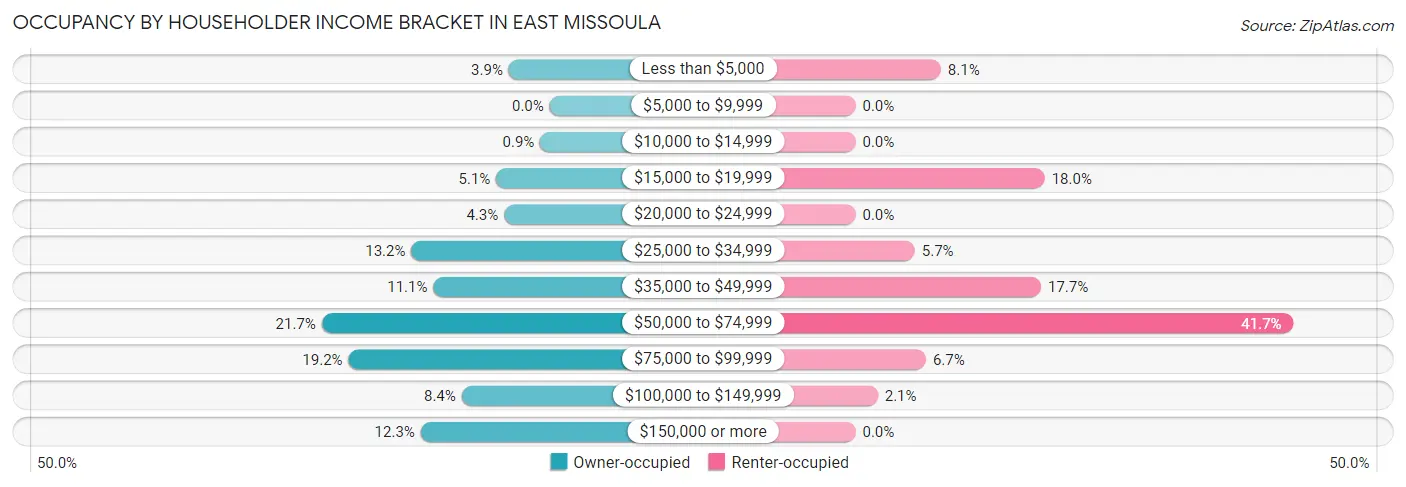
| Income Bracket | Owner-occupied | Renter-occupied |
| Less than $5,000 | 26 (3.9%) | 23 (8.1%) |
| $5,000 to $9,999 | 0 (0.0%) | 0 (0.0%) |
| $10,000 to $14,999 | 6 (0.9%) | 0 (0.0%) |
| $15,000 to $19,999 | 34 (5.1%) | 51 (18.0%) |
| $20,000 to $24,999 | 29 (4.3%) | 0 (0.0%) |
| $25,000 to $34,999 | 88 (13.2%) | 16 (5.7%) |
| $35,000 to $49,999 | 74 (11.1%) | 50 (17.7%) |
| $50,000 to $74,999 | 145 (21.7%) | 118 (41.7%) |
| $75,000 to $99,999 | 128 (19.2%) | 19 (6.7%) |
| $100,000 to $149,999 | 56 (8.4%) | 6 (2.1%) |
| $150,000 or more | 82 (12.3%) | 0 (0.0%) |
| Total | 668 (100.0%) | 283 (100.0%) |
Monthly Housing Cost Tiers in East Missoula
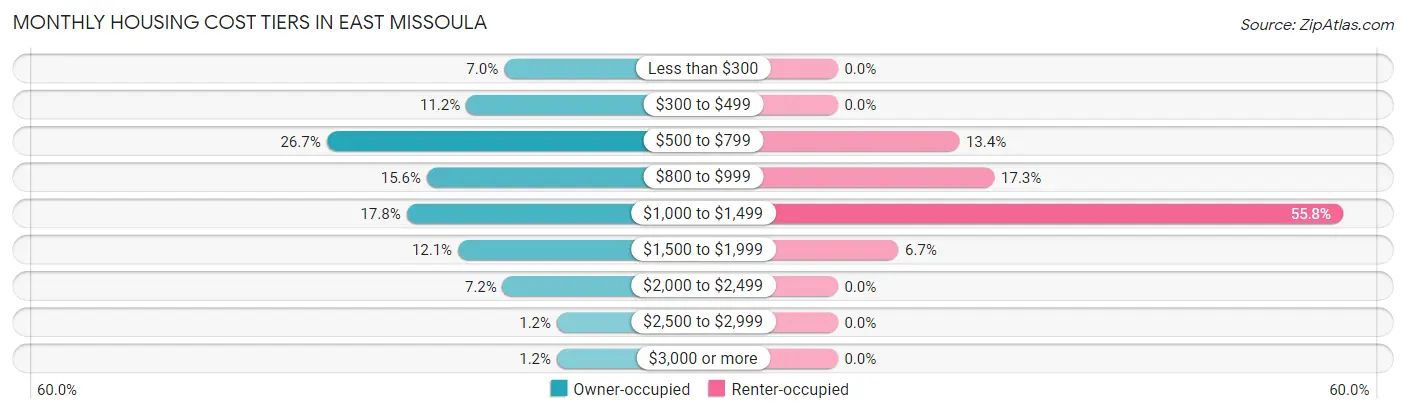
| Monthly Cost | Owner-occupied | Renter-occupied |
| Less than $300 | 47 (7.0%) | 0 (0.0%) |
| $300 to $499 | 75 (11.2%) | 0 (0.0%) |
| $500 to $799 | 178 (26.7%) | 38 (13.4%) |
| $800 to $999 | 104 (15.6%) | 49 (17.3%) |
| $1,000 to $1,499 | 119 (17.8%) | 158 (55.8%) |
| $1,500 to $1,999 | 81 (12.1%) | 19 (6.7%) |
| $2,000 to $2,499 | 48 (7.2%) | 0 (0.0%) |
| $2,500 to $2,999 | 8 (1.2%) | 0 (0.0%) |
| $3,000 or more | 8 (1.2%) | 0 (0.0%) |
| Total | 668 (100.0%) | 283 (100.0%) |
Physical Housing Characteristics in East Missoula
Housing Structures in East Missoula
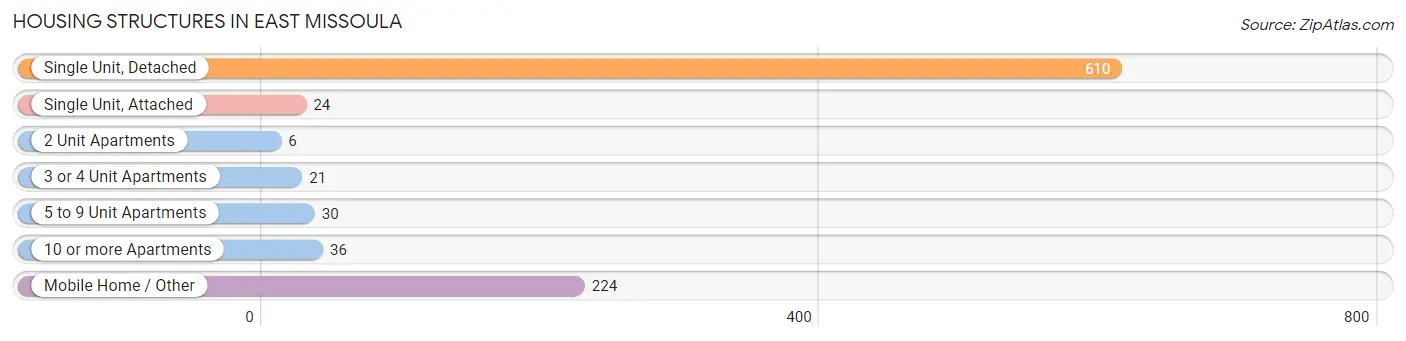
| Structure Type | # Housing Units | % Housing Units |
| Single Unit, Detached | 610 | 64.1% |
| Single Unit, Attached | 24 | 2.5% |
| 2 Unit Apartments | 6 | 0.6% |
| 3 or 4 Unit Apartments | 21 | 2.2% |
| 5 to 9 Unit Apartments | 30 | 3.2% |
| 10 or more Apartments | 36 | 3.8% |
| Mobile Home / Other | 224 | 23.5% |
| Total | 951 | 100.0% |
Housing Structures by Occupancy in East Missoula
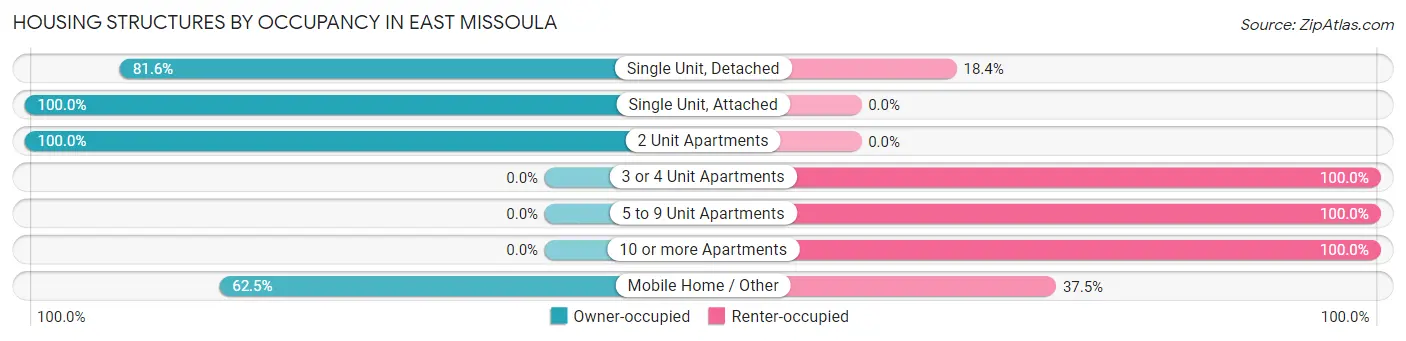
| Structure Type | Owner-occupied | Renter-occupied |
| Single Unit, Detached | 498 (81.6%) | 112 (18.4%) |
| Single Unit, Attached | 24 (100.0%) | 0 (0.0%) |
| 2 Unit Apartments | 6 (100.0%) | 0 (0.0%) |
| 3 or 4 Unit Apartments | 0 (0.0%) | 21 (100.0%) |
| 5 to 9 Unit Apartments | 0 (0.0%) | 30 (100.0%) |
| 10 or more Apartments | 0 (0.0%) | 36 (100.0%) |
| Mobile Home / Other | 140 (62.5%) | 84 (37.5%) |
| Total | 668 (70.2%) | 283 (29.8%) |
Housing Structures by Number of Rooms in East Missoula
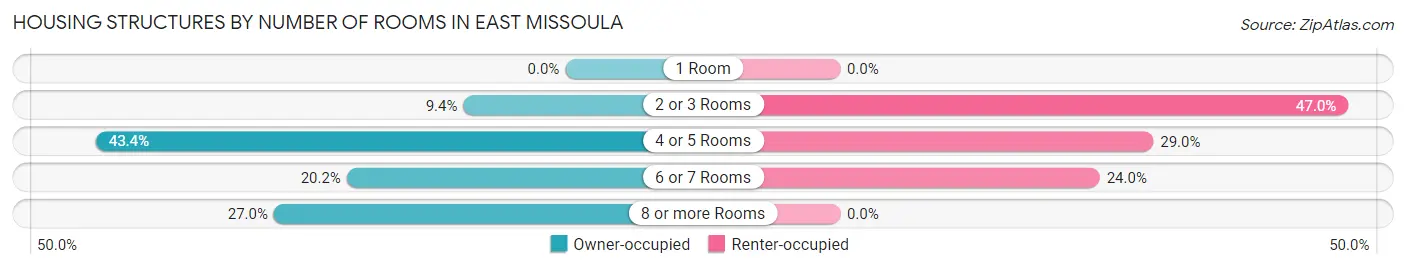
| Number of Rooms | Owner-occupied | Renter-occupied |
| 1 Room | 0 (0.0%) | 0 (0.0%) |
| 2 or 3 Rooms | 63 (9.4%) | 133 (47.0%) |
| 4 or 5 Rooms | 290 (43.4%) | 82 (29.0%) |
| 6 or 7 Rooms | 135 (20.2%) | 68 (24.0%) |
| 8 or more Rooms | 180 (27.0%) | 0 (0.0%) |
| Total | 668 (100.0%) | 283 (100.0%) |
Housing Structure by Heating Type in East Missoula
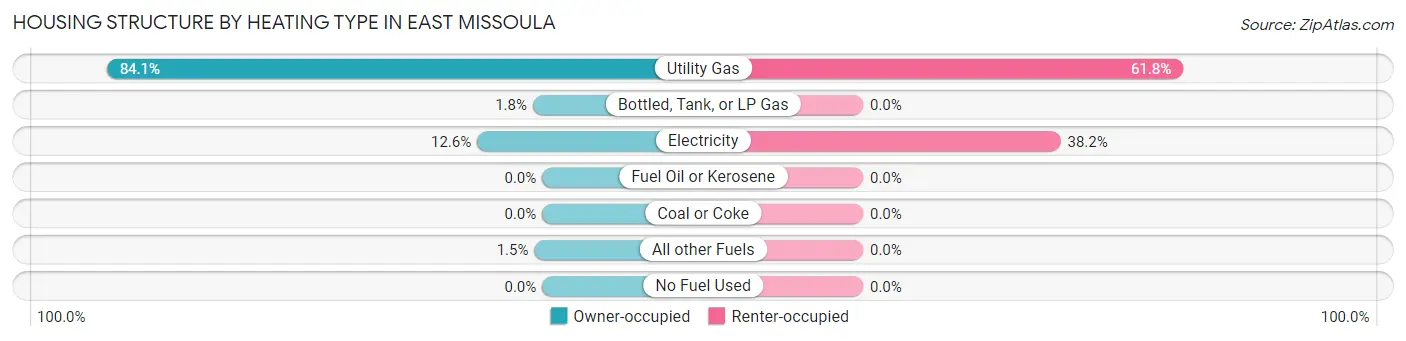
| Heating Type | Owner-occupied | Renter-occupied |
| Utility Gas | 562 (84.1%) | 175 (61.8%) |
| Bottled, Tank, or LP Gas | 12 (1.8%) | 0 (0.0%) |
| Electricity | 84 (12.6%) | 108 (38.2%) |
| Fuel Oil or Kerosene | 0 (0.0%) | 0 (0.0%) |
| Coal or Coke | 0 (0.0%) | 0 (0.0%) |
| All other Fuels | 10 (1.5%) | 0 (0.0%) |
| No Fuel Used | 0 (0.0%) | 0 (0.0%) |
| Total | 668 (100.0%) | 283 (100.0%) |
Household Vehicle Usage in East Missoula
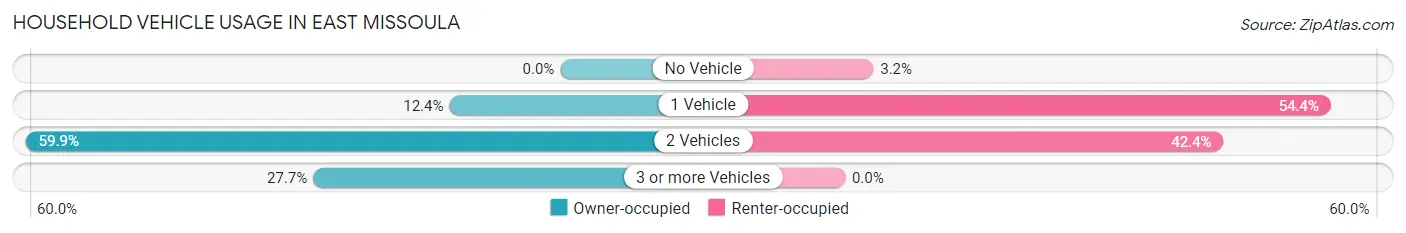
| Vehicles per Household | Owner-occupied | Renter-occupied |
| No Vehicle | 0 (0.0%) | 9 (3.2%) |
| 1 Vehicle | 83 (12.4%) | 154 (54.4%) |
| 2 Vehicles | 400 (59.9%) | 120 (42.4%) |
| 3 or more Vehicles | 185 (27.7%) | 0 (0.0%) |
| Total | 668 (100.0%) | 283 (100.0%) |
Real Estate & Mortgages in East Missoula
Real Estate and Mortgage Overview in East Missoula
| Characteristic | Without Mortgage | With Mortgage |
| Housing Units | 327 | 341 |
| Median Property Value | $281,100 | $274,500 |
| Median Household Income | $68,355 | $59 |
| Monthly Housing Costs | $607 | $8 |
| Real Estate Taxes | $2,397 | $12 |
Property Value by Mortgage Status in East Missoula
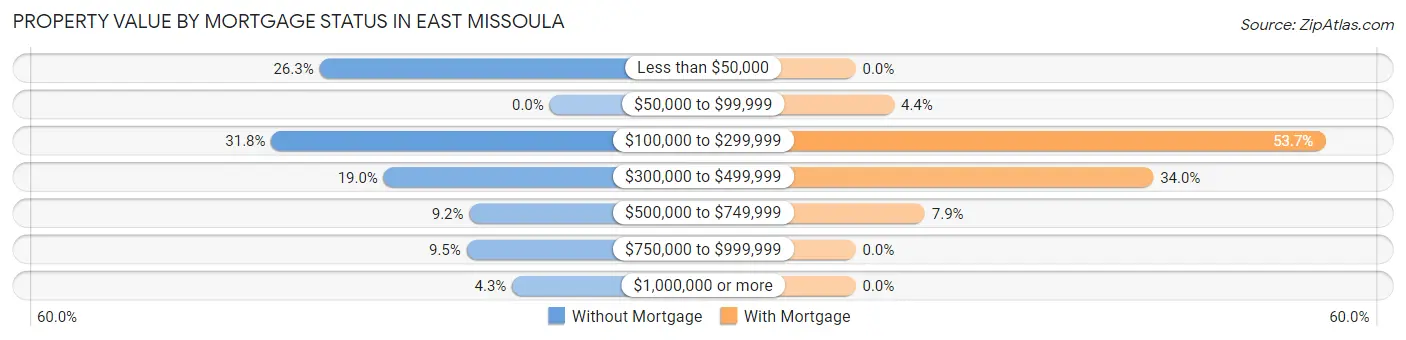
| Property Value | Without Mortgage | With Mortgage |
| Less than $50,000 | 86 (26.3%) | 0 (0.0%) |
| $50,000 to $99,999 | 0 (0.0%) | 15 (4.4%) |
| $100,000 to $299,999 | 104 (31.8%) | 183 (53.7%) |
| $300,000 to $499,999 | 62 (19.0%) | 116 (34.0%) |
| $500,000 to $749,999 | 30 (9.2%) | 27 (7.9%) |
| $750,000 to $999,999 | 31 (9.5%) | 0 (0.0%) |
| $1,000,000 or more | 14 (4.3%) | 0 (0.0%) |
| Total | 327 (100.0%) | 341 (100.0%) |
Household Income by Mortgage Status in East Missoula
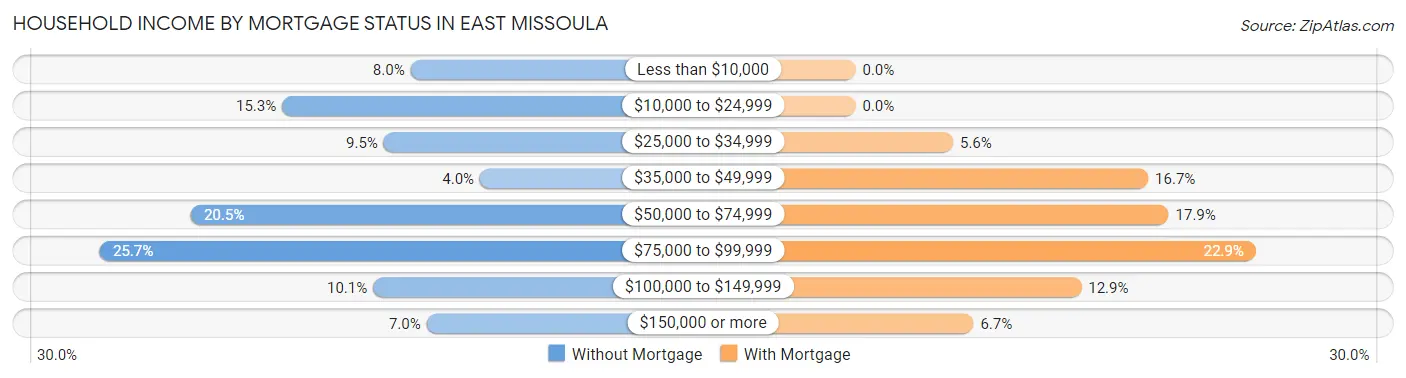
| Household Income | Without Mortgage | With Mortgage |
| Less than $10,000 | 26 (8.0%) | 0 (0.0%) |
| $10,000 to $24,999 | 50 (15.3%) | 0 (0.0%) |
| $25,000 to $34,999 | 31 (9.5%) | 19 (5.6%) |
| $35,000 to $49,999 | 13 (4.0%) | 57 (16.7%) |
| $50,000 to $74,999 | 67 (20.5%) | 61 (17.9%) |
| $75,000 to $99,999 | 84 (25.7%) | 78 (22.9%) |
| $100,000 to $149,999 | 33 (10.1%) | 44 (12.9%) |
| $150,000 or more | 23 (7.0%) | 23 (6.7%) |
| Total | 327 (100.0%) | 341 (100.0%) |
Property Value to Household Income Ratio in East Missoula
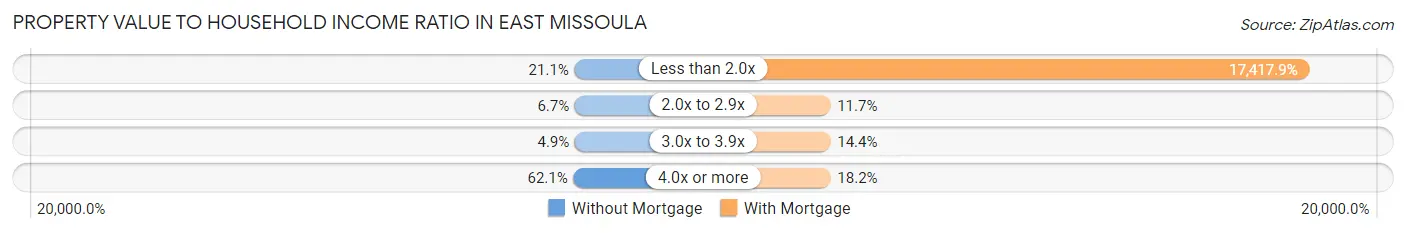
| Value-to-Income Ratio | Without Mortgage | With Mortgage |
| Less than 2.0x | 69 (21.1%) | 59,395 (17,417.9%) |
| 2.0x to 2.9x | 22 (6.7%) | 40 (11.7%) |
| 3.0x to 3.9x | 16 (4.9%) | 49 (14.4%) |
| 4.0x or more | 203 (62.1%) | 62 (18.2%) |
| Total | 327 (100.0%) | 341 (100.0%) |
Real Estate Taxes by Mortgage Status in East Missoula
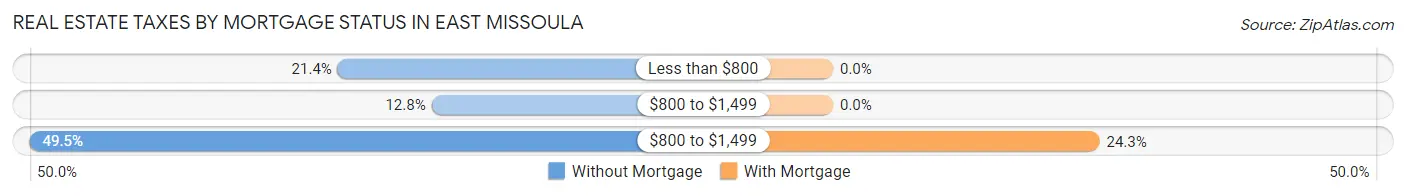
| Property Taxes | Without Mortgage | With Mortgage |
| Less than $800 | 70 (21.4%) | 0 (0.0%) |
| $800 to $1,499 | 42 (12.8%) | 0 (0.0%) |
| $800 to $1,499 | 162 (49.5%) | 83 (24.3%) |
| Total | 327 (100.0%) | 341 (100.0%) |
Health & Disability in East Missoula
Health Insurance Coverage by Age in East Missoula
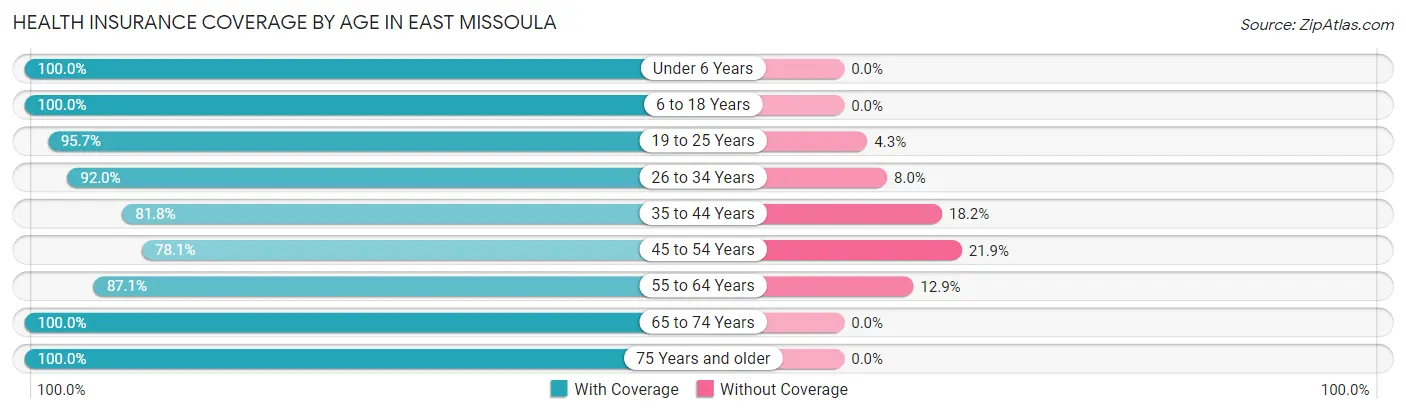
| Age Bracket | With Coverage | Without Coverage |
| Under 6 Years | 81 (100.0%) | 0 (0.0%) |
| 6 to 18 Years | 242 (100.0%) | 0 (0.0%) |
| 19 to 25 Years | 222 (95.7%) | 10 (4.3%) |
| 26 to 34 Years | 242 (92.0%) | 21 (8.0%) |
| 35 to 44 Years | 332 (81.8%) | 74 (18.2%) |
| 45 to 54 Years | 114 (78.1%) | 32 (21.9%) |
| 55 to 64 Years | 277 (87.1%) | 41 (12.9%) |
| 65 to 74 Years | 227 (100.0%) | 0 (0.0%) |
| 75 Years and older | 186 (100.0%) | 0 (0.0%) |
| Total | 1,923 (91.5%) | 178 (8.5%) |
Health Insurance Coverage by Citizenship Status in East Missoula
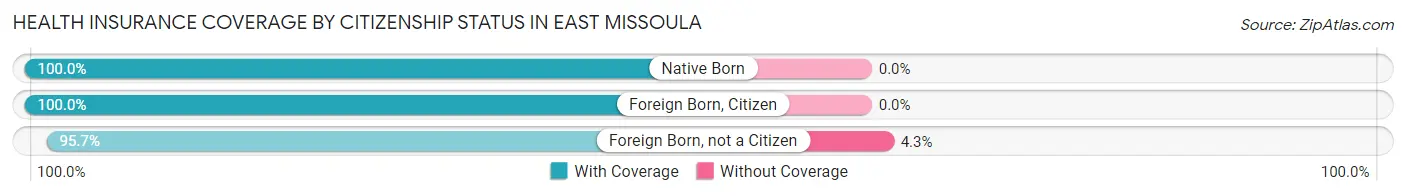
| Citizenship Status | With Coverage | Without Coverage |
| Native Born | 81 (100.0%) | 0 (0.0%) |
| Foreign Born, Citizen | 242 (100.0%) | 0 (0.0%) |
| Foreign Born, not a Citizen | 222 (95.7%) | 10 (4.3%) |
Health Insurance Coverage by Household Income in East Missoula
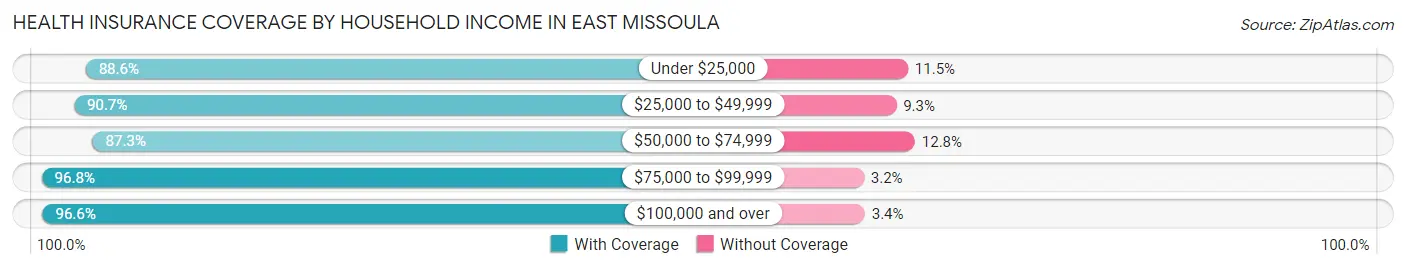
| Household Income | With Coverage | Without Coverage |
| Under $25,000 | 232 (88.5%) | 30 (11.5%) |
| $25,000 to $49,999 | 451 (90.7%) | 46 (9.3%) |
| $50,000 to $74,999 | 534 (87.3%) | 78 (12.8%) |
| $75,000 to $99,999 | 333 (96.8%) | 11 (3.2%) |
| $100,000 and over | 373 (96.6%) | 13 (3.4%) |
Public vs Private Health Insurance Coverage by Age in East Missoula
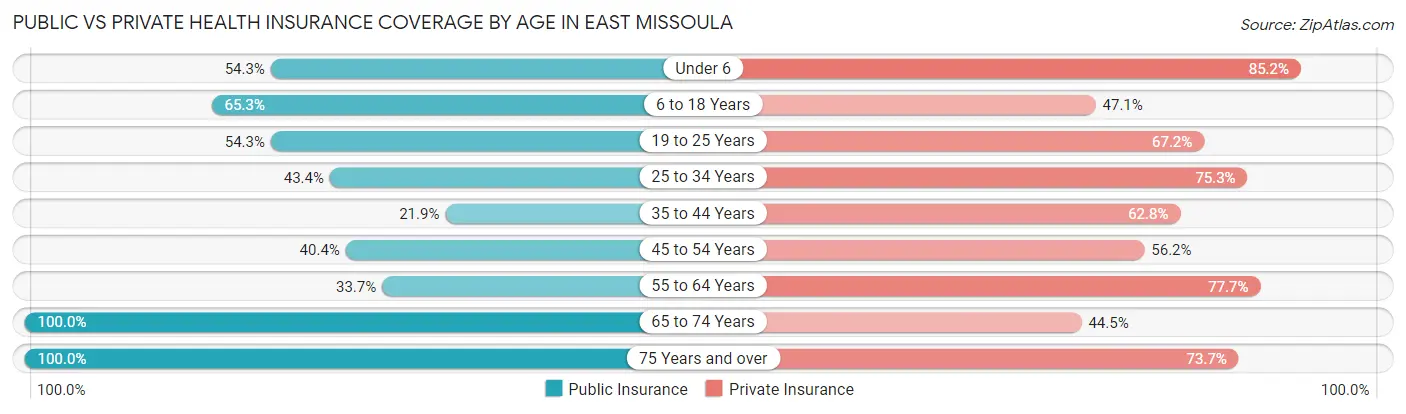
| Age Bracket | Public Insurance | Private Insurance |
| Under 6 | 44 (54.3%) | 69 (85.2%) |
| 6 to 18 Years | 158 (65.3%) | 114 (47.1%) |
| 19 to 25 Years | 126 (54.3%) | 156 (67.2%) |
| 25 to 34 Years | 114 (43.3%) | 198 (75.3%) |
| 35 to 44 Years | 89 (21.9%) | 255 (62.8%) |
| 45 to 54 Years | 59 (40.4%) | 82 (56.2%) |
| 55 to 64 Years | 107 (33.7%) | 247 (77.7%) |
| 65 to 74 Years | 227 (100.0%) | 101 (44.5%) |
| 75 Years and over | 186 (100.0%) | 137 (73.7%) |
| Total | 1,110 (52.8%) | 1,359 (64.7%) |
Disability Status by Sex by Age in East Missoula
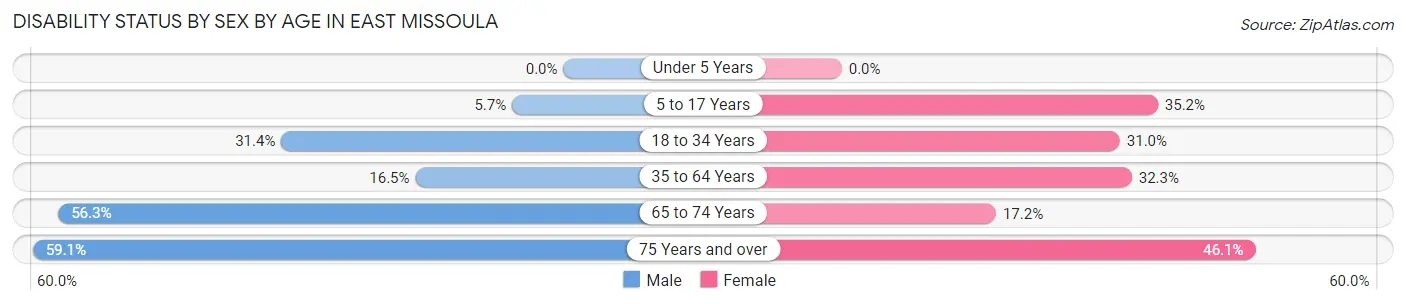
| Age Bracket | Male | Female |
| Under 5 Years | 0 (0.0%) | 0 (0.0%) |
| 5 to 17 Years | 6 (5.7%) | 44 (35.2%) |
| 18 to 34 Years | 115 (31.4%) | 48 (31.0%) |
| 35 to 64 Years | 74 (16.5%) | 136 (32.3%) |
| 65 to 74 Years | 72 (56.2%) | 17 (17.2%) |
| 75 Years and over | 65 (59.1%) | 35 (46.1%) |
Disability Class by Sex by Age in East Missoula
Disability Class: Hearing Difficulty
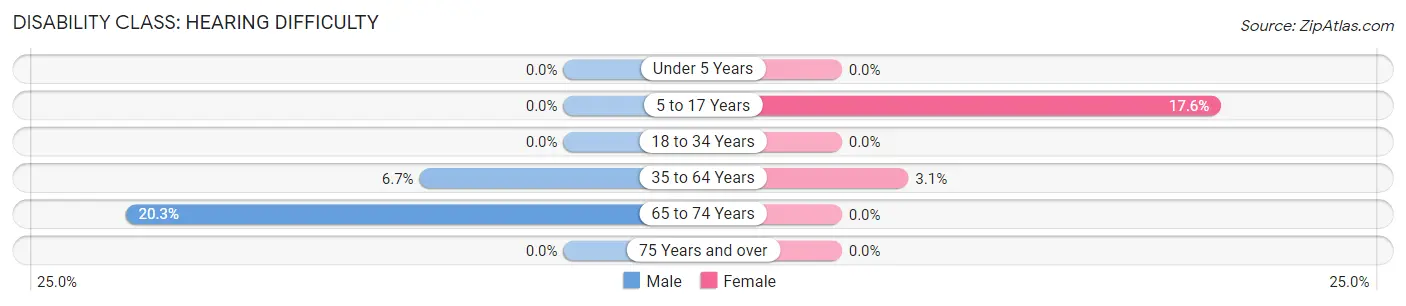
| Age Bracket | Male | Female |
| Under 5 Years | 0 (0.0%) | 0 (0.0%) |
| 5 to 17 Years | 0 (0.0%) | 22 (17.6%) |
| 18 to 34 Years | 0 (0.0%) | 0 (0.0%) |
| 35 to 64 Years | 30 (6.7%) | 13 (3.1%) |
| 65 to 74 Years | 26 (20.3%) | 0 (0.0%) |
| 75 Years and over | 0 (0.0%) | 0 (0.0%) |
Disability Class: Vision Difficulty
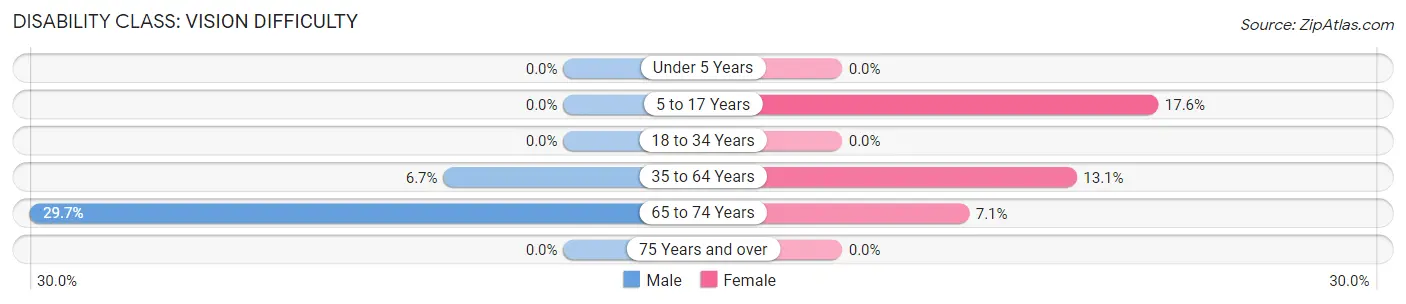
| Age Bracket | Male | Female |
| Under 5 Years | 0 (0.0%) | 0 (0.0%) |
| 5 to 17 Years | 0 (0.0%) | 22 (17.6%) |
| 18 to 34 Years | 0 (0.0%) | 0 (0.0%) |
| 35 to 64 Years | 30 (6.7%) | 55 (13.1%) |
| 65 to 74 Years | 38 (29.7%) | 7 (7.1%) |
| 75 Years and over | 0 (0.0%) | 0 (0.0%) |
Disability Class: Cognitive Difficulty
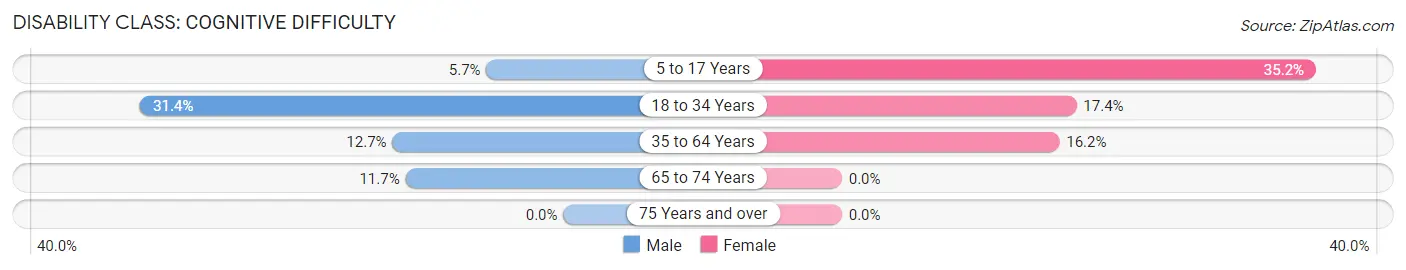
| Age Bracket | Male | Female |
| 5 to 17 Years | 6 (5.7%) | 44 (35.2%) |
| 18 to 34 Years | 115 (31.4%) | 27 (17.4%) |
| 35 to 64 Years | 57 (12.7%) | 68 (16.2%) |
| 65 to 74 Years | 15 (11.7%) | 0 (0.0%) |
| 75 Years and over | 0 (0.0%) | 0 (0.0%) |
Disability Class: Ambulatory Difficulty
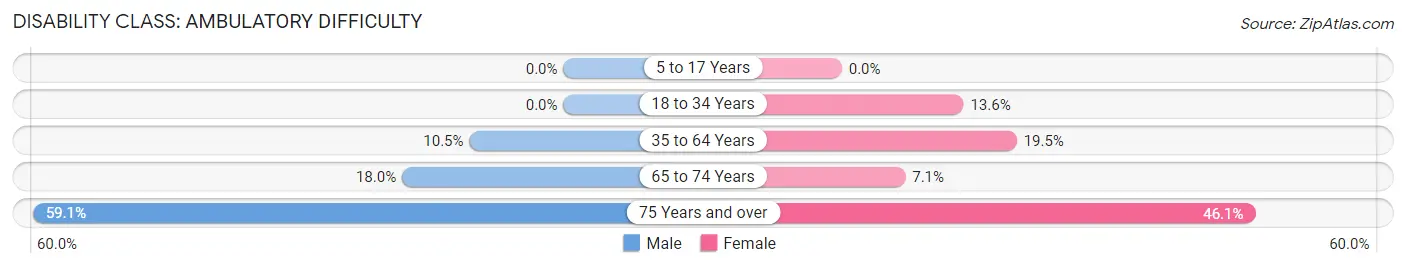
| Age Bracket | Male | Female |
| 5 to 17 Years | 0 (0.0%) | 0 (0.0%) |
| 18 to 34 Years | 0 (0.0%) | 21 (13.6%) |
| 35 to 64 Years | 47 (10.5%) | 82 (19.5%) |
| 65 to 74 Years | 23 (18.0%) | 7 (7.1%) |
| 75 Years and over | 65 (59.1%) | 35 (46.1%) |
Disability Class: Self-Care Difficulty
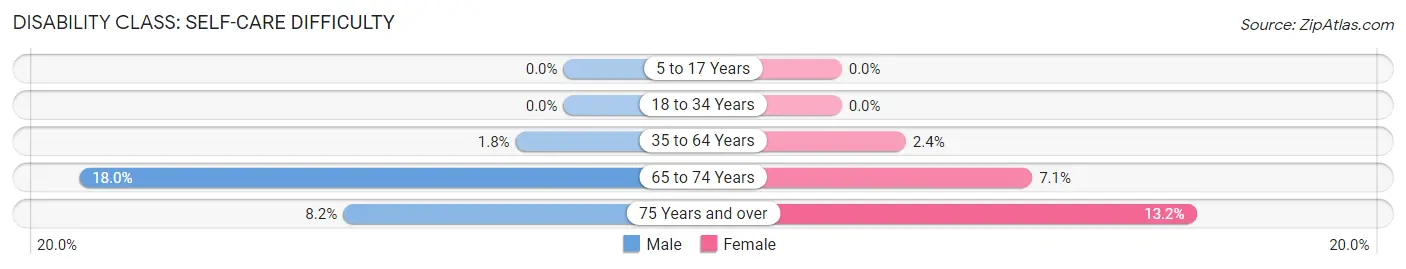
| Age Bracket | Male | Female |
| 5 to 17 Years | 0 (0.0%) | 0 (0.0%) |
| 18 to 34 Years | 0 (0.0%) | 0 (0.0%) |
| 35 to 64 Years | 8 (1.8%) | 10 (2.4%) |
| 65 to 74 Years | 23 (18.0%) | 7 (7.1%) |
| 75 Years and over | 9 (8.2%) | 10 (13.2%) |
Technology Access in East Missoula
Computing Device Access in East Missoula
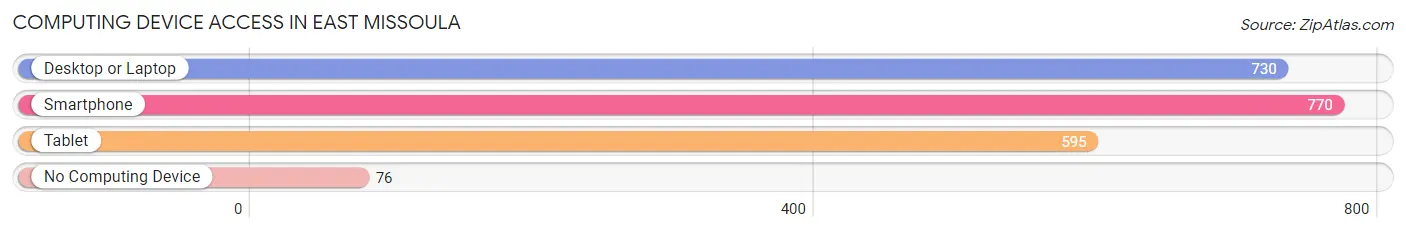
| Device Type | # Households | % Households |
| Desktop or Laptop | 730 | 76.8% |
| Smartphone | 770 | 81.0% |
| Tablet | 595 | 62.6% |
| No Computing Device | 76 | 8.0% |
| Total | 951 | 100.0% |
Internet Access in East Missoula
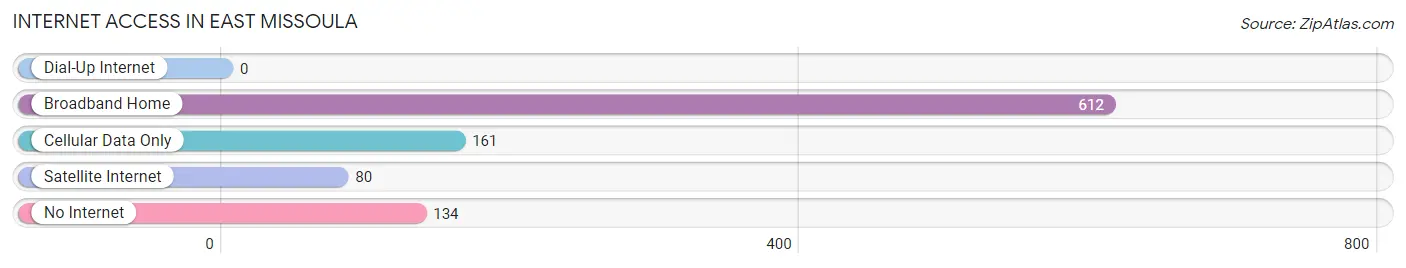
| Internet Type | # Households | % Households |
| Dial-Up Internet | 0 | 0.0% |
| Broadband Home | 612 | 64.3% |
| Cellular Data Only | 161 | 16.9% |
| Satellite Internet | 80 | 8.4% |
| No Internet | 134 | 14.1% |
| Total | 951 | 100.0% |
East Missoula Summary
Missoula, Montana is a city located in the western part of the state, in the heart of the Rocky Mountains. It is the county seat of Missoula County and the second largest city in Montana. The city is situated along the Clark Fork River, near its confluence with the Bitterroot River. Missoula is home to the University of Montana, a public research university, and is the cultural and economic center of western Montana.
History
Missoula was founded in 1860 by Father Pierre-Jean De Smet, a Jesuit missionary. The city was named after the Salish word for the Clark Fork River, which was “Nmesulet”. The city was originally a trading post and was later incorporated in 1866. In the late 19th century, Missoula became a major railroad hub and was the largest city in Montana.
In the early 20th century, Missoula was a major lumbering center and was home to several large sawmills. The city was also a major center for the mining industry, with several copper and silver mines in the area.
Geography
Missoula is located in western Montana, in the Rocky Mountains. The city is situated along the Clark Fork River, near its confluence with the Bitterroot River. The city is surrounded by mountains, including the Bitterroot Mountains to the east, the Sapphire Mountains to the south, and the Rattlesnake Mountains to the west. The city is located at an elevation of 3,208 feet (978 meters).
Economy
Missoula’s economy is largely based on the service sector, with healthcare, education, and government being the largest employers. The University of Montana is the largest employer in the city, with over 5,000 employees. Other major employers include St. Patrick Hospital, Missoula County Public Schools, and the Missoula County government.
The city is also home to several large companies, including the Missoula-based software company RightNow Technologies, the outdoor clothing company Simms Fishing Products, and the outdoor equipment company Black Diamond Equipment.
Demographics
As of the 2010 census, Missoula had a population of 66,788. The city is predominantly white, with non-Hispanic whites making up 87.3% of the population. The city is also home to a large Native American population, with Native Americans making up 8.2% of the population. Other racial groups include African Americans (2.2%), Asians (1.2%), and Hispanics (1.1%).
Missoula is home to a large student population, with over 15,000 students enrolled at the University of Montana. The city also has a large LGBT population, with an estimated 8.3% of the population identifying as LGBT.
Missoula is a diverse and vibrant city, with a rich history and culture. The city is home to a variety of businesses, educational institutions, and recreational activities. Missoula is a great place to live, work, and play.
Common Questions
What is Per Capita Income in East Missoula?
Per Capita income in East Missoula is $30,115.
What is the Median Family Income in East Missoula?
Median Family Income in East Missoula is $67,461.
What is the Median Household income in East Missoula?
Median Household Income in East Missoula is $58,991.
What is Income or Wage Gap in East Missoula?
Income or Wage Gap in East Missoula is 32.5%.
Women in East Missoula earn 67.5 cents for every dollar earned by a man.
What is Inequality or Gini Index in East Missoula?
Inequality or Gini Index in East Missoula is 0.39.
What is the Total Population of East Missoula?
Total Population of East Missoula is 2,105.
What is the Total Male Population of East Missoula?
Total Male Population of East Missoula is 1,193.
What is the Total Female Population of East Missoula?
Total Female Population of East Missoula is 912.
What is the Ratio of Males per 100 Females in East Missoula?
There are 130.81 Males per 100 Females in East Missoula.
What is the Ratio of Females per 100 Males in East Missoula?
There are 76.45 Females per 100 Males in East Missoula.
What is the Median Population Age in East Missoula?
Median Population Age in East Missoula is 41.7 Years.
What is the Average Family Size in East Missoula
Average Family Size in East Missoula is 2.8 People.
What is the Average Household Size in East Missoula
Average Household Size in East Missoula is 2.2 People.
How Large is the Labor Force in East Missoula?
There are 1,160 People in the Labor Forcein in East Missoula.
What is the Percentage of People in the Labor Force in East Missoula?
63.3% of People are in the Labor Force in East Missoula.
What is the Unemployment Rate in East Missoula?
Unemployment Rate in East Missoula is 7.0%.