Virginia City, MT Map & Demographics
Virginia City Map
Virginia City Overview
$61,161
PER CAPITA INCOME
$76,250
AVG FAMILY INCOME
$75,625
AVG HOUSEHOLD INCOME
0.39
INEQUALITY / GINI INDEX
127
TOTAL POPULATION
60
MALE POPULATION
67
FEMALE POPULATION
89.55
MALES / 100 FEMALES
111.67
FEMALES / 100 MALES
67.5
MEDIAN AGE
2.5
AVG FAMILY SIZE
2.0
AVG HOUSEHOLD SIZE
61
LABOR FORCE [ PEOPLE ]
49.6%
PERCENT IN LABOR FORCE
Virginia City Zip Codes
Virginia City Area Codes
Income in Virginia City
Income Overview in Virginia City
Per Capita Income in Virginia City is $61,161, while median incomes of families and households are $76,250 and $75,625 respectively.
| Characteristic | Number | Measure |
| Per Capita Income | 127 | $61,161 |
| Median Family Income | 36 | $76,250 |
| Mean Family Income | 36 | $75,758 |
| Median Household Income | 56 | $75,625 |
| Mean Household Income | 56 | $82,636 |
| Income Deficit | 36 | $0 |
| Wage / Income Gap (%) | 127 | 0.00% |
| Wage / Income Gap ($) | 127 | 100.00¢ per $1 |
| Gini / Inequality Index | 127 | 0.39 |
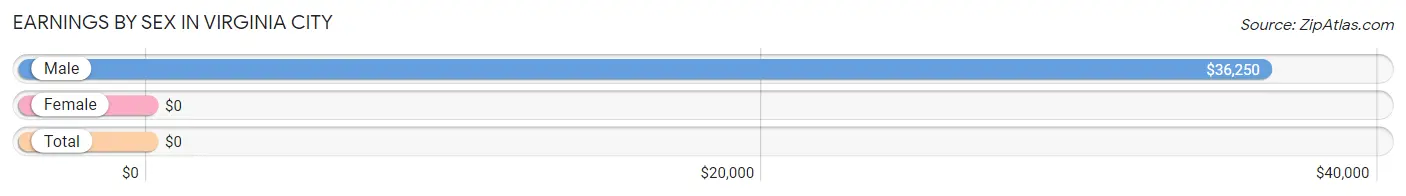
Earnings by Sex in Virginia City
| Sex | Number | Average Earnings |
| Male | 32 (43.8%) | $36,250 |
| Female | 41 (56.2%) | $0 |
| Total | 73 (100.0%) | $0 |
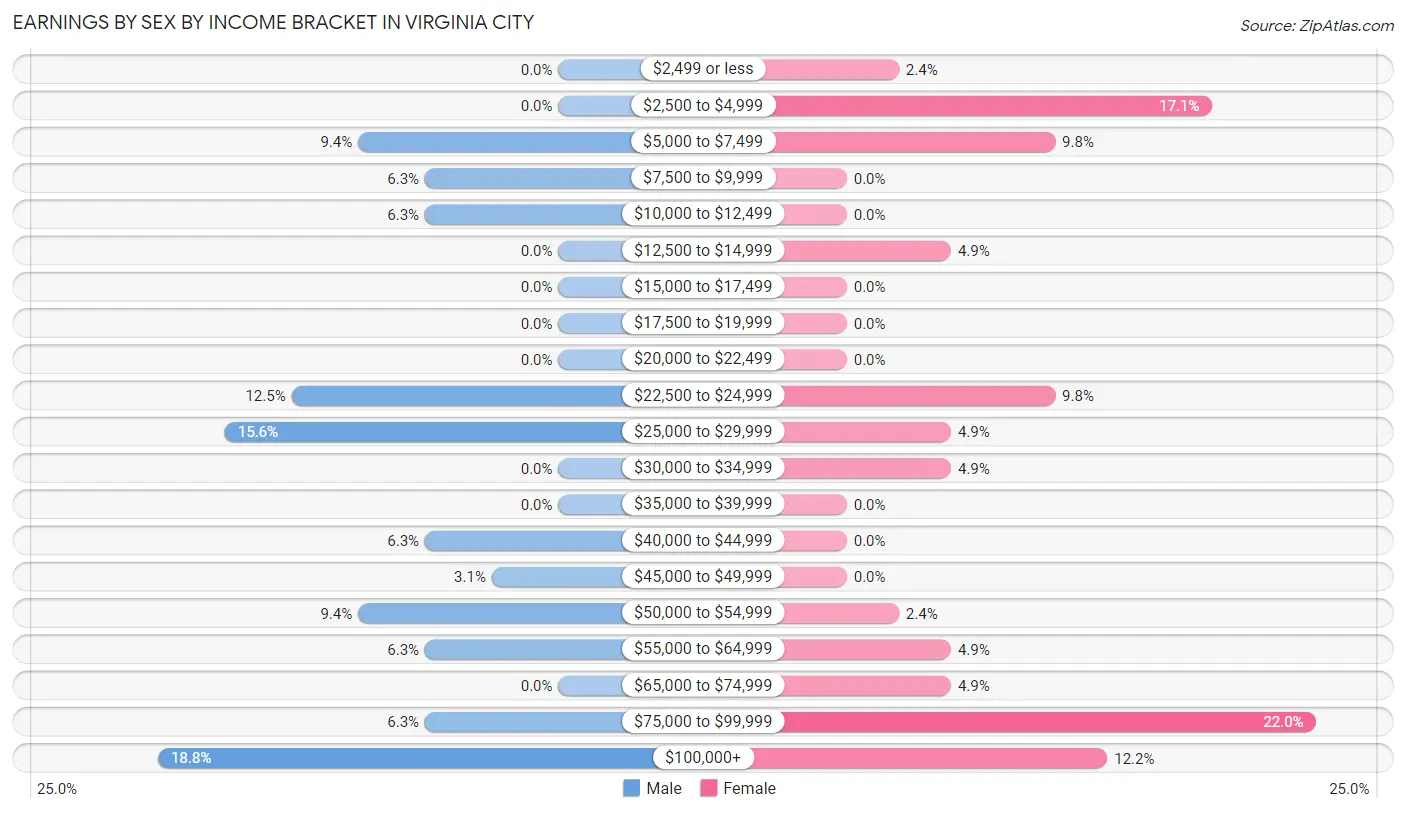
Earnings by Sex by Income Bracket in Virginia City
The most common earnings brackets in Virginia City are $100,000+ for men (6 | 18.8%) and $75,000 to $99,999 for women (9 | 22.0%).
| Income | Male | Female |
| $2,499 or less | 0 (0.0%) | 1 (2.4%) |
| $2,500 to $4,999 | 0 (0.0%) | 7 (17.1%) |
| $5,000 to $7,499 | 3 (9.4%) | 4 (9.8%) |
| $7,500 to $9,999 | 2 (6.2%) | 0 (0.0%) |
| $10,000 to $12,499 | 2 (6.2%) | 0 (0.0%) |
| $12,500 to $14,999 | 0 (0.0%) | 2 (4.9%) |
| $15,000 to $17,499 | 0 (0.0%) | 0 (0.0%) |
| $17,500 to $19,999 | 0 (0.0%) | 0 (0.0%) |
| $20,000 to $22,499 | 0 (0.0%) | 0 (0.0%) |
| $22,500 to $24,999 | 4 (12.5%) | 4 (9.8%) |
| $25,000 to $29,999 | 5 (15.6%) | 2 (4.9%) |
| $30,000 to $34,999 | 0 (0.0%) | 2 (4.9%) |
| $35,000 to $39,999 | 0 (0.0%) | 0 (0.0%) |
| $40,000 to $44,999 | 2 (6.2%) | 0 (0.0%) |
| $45,000 to $49,999 | 1 (3.1%) | 0 (0.0%) |
| $50,000 to $54,999 | 3 (9.4%) | 1 (2.4%) |
| $55,000 to $64,999 | 2 (6.2%) | 2 (4.9%) |
| $65,000 to $74,999 | 0 (0.0%) | 2 (4.9%) |
| $75,000 to $99,999 | 2 (6.2%) | 9 (22.0%) |
| $100,000+ | 6 (18.8%) | 5 (12.2%) |
| Total | 32 (100.0%) | 41 (100.0%) |
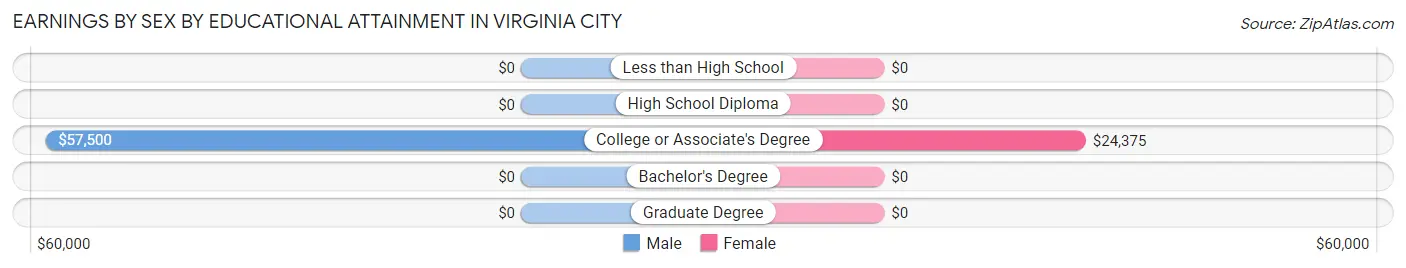
Earnings by Sex by Educational Attainment in Virginia City
| Educational Attainment | Male Income | Female Income |
| Less than High School | - | - |
| High School Diploma | - | - |
| College or Associate's Degree | $57,500 | $24,375 |
| Bachelor's Degree | - | - |
| Graduate Degree | - | - |
| Total | $44,375 | $0 |
Family Income in Virginia City
Family Income Brackets in Virginia City
According to the Virginia City family income data, there are 13 families falling into the $100,000 to $149,999 income range, which is the most common income bracket and makes up 36.1% of all families.
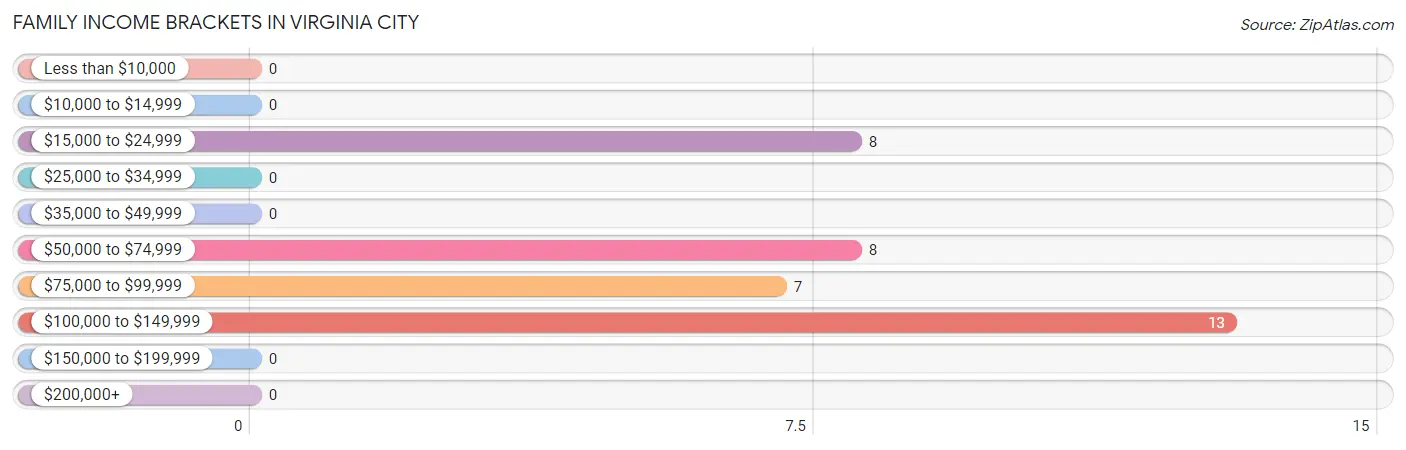
| Income Bracket | # Families | % Families |
| Less than $10,000 | 0 | 0.0% |
| $10,000 to $14,999 | 0 | 0.0% |
| $15,000 to $24,999 | 8 | 22.2% |
| $25,000 to $34,999 | 0 | 0.0% |
| $35,000 to $49,999 | 0 | 0.0% |
| $50,000 to $74,999 | 8 | 22.2% |
| $75,000 to $99,999 | 7 | 19.4% |
| $100,000 to $149,999 | 13 | 36.1% |
| $150,000 to $199,999 | 0 | 0.0% |
| $200,000+ | 0 | 0.0% |
Family Income by Famaliy Size in Virginia City
2-person families (34 | 94.4%) account for the highest median family income in Virginia City with $75,625 per family, while 2-person families (34 | 94.4%) have the highest median income of $37,812 per family member.
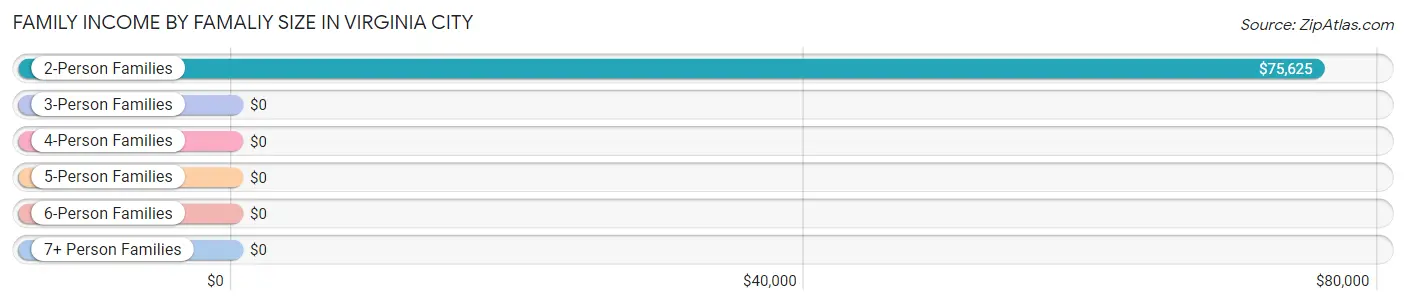
| Income Bracket | # Families | Median Income |
| 2-Person Families | 34 (94.4%) | $75,625 |
| 3-Person Families | 0 (0.0%) | $0 |
| 4-Person Families | 2 (5.6%) | $0 |
| 5-Person Families | 0 (0.0%) | $0 |
| 6-Person Families | 0 (0.0%) | $0 |
| 7+ Person Families | 0 (0.0%) | $0 |
| Total | 36 (100.0%) | $76,250 |
Family Income by Number of Earners in Virginia City
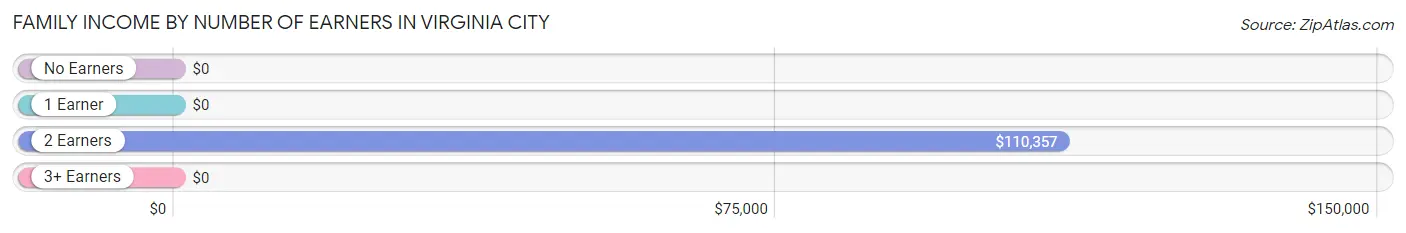
| Number of Earners | # Families | Median Income |
| No Earners | 8 (22.2%) | $0 |
| 1 Earner | 10 (27.8%) | $0 |
| 2 Earners | 18 (50.0%) | $110,357 |
| 3+ Earners | 0 (0.0%) | $0 |
| Total | 36 (100.0%) | $76,250 |
Household Income in Virginia City
Household Income Brackets in Virginia City
With 18 households falling in the category, the $100,000 to $149,999 income range is the most frequent in Virginia City, accounting for 32.1% of all households.
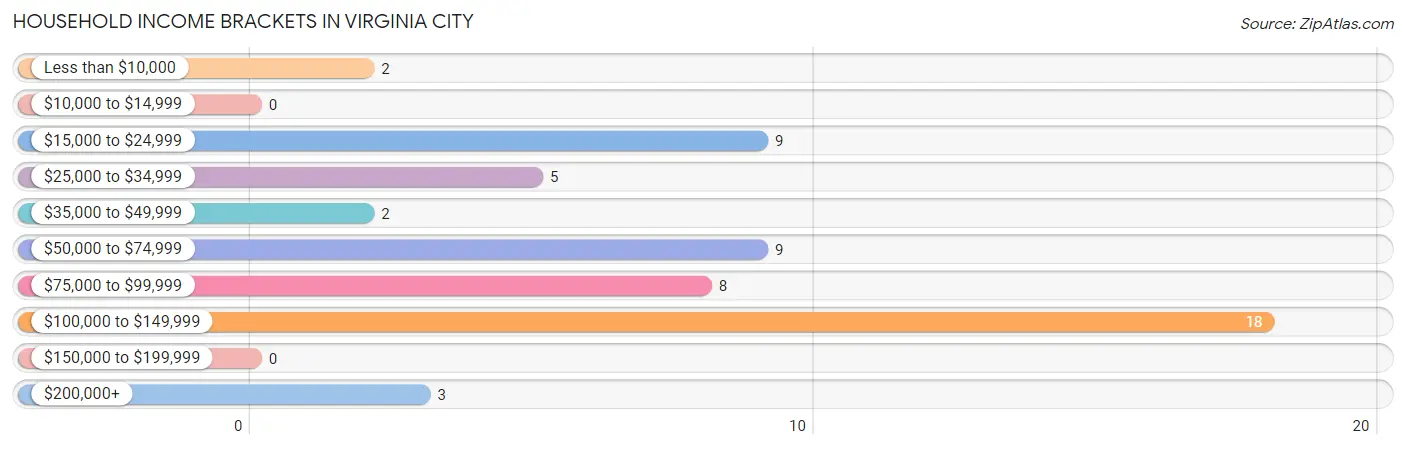
| Income Bracket | # Households | % Households |
| Less than $10,000 | 2 | 3.6% |
| $10,000 to $14,999 | 0 | 0.0% |
| $15,000 to $24,999 | 9 | 16.1% |
| $25,000 to $34,999 | 5 | 8.9% |
| $35,000 to $49,999 | 2 | 3.6% |
| $50,000 to $74,999 | 9 | 16.1% |
| $75,000 to $99,999 | 8 | 14.3% |
| $100,000 to $149,999 | 18 | 32.1% |
| $150,000 to $199,999 | 0 | 0.0% |
| $200,000+ | 3 | 5.4% |
Household Income by Householder Age in Virginia City
The median household income in Virginia City is $75,625, with the highest median household income of $110,357 found in the 45 to 64 years age bracket for the primary householder. A total of 26 households (46.4%) fall into this category.
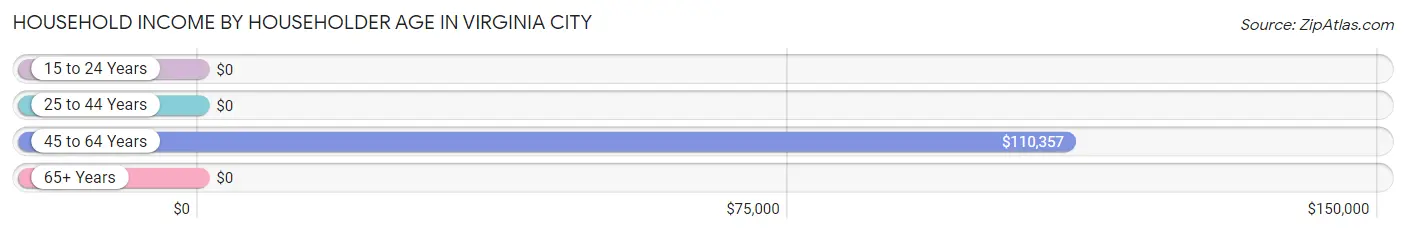
| Income Bracket | # Households | Median Income |
| 15 to 24 Years | 0 (0.0%) | $0 |
| 25 to 44 Years | 0 (0.0%) | $0 |
| 45 to 64 Years | 26 (46.4%) | $110,357 |
| 65+ Years | 30 (53.6%) | $0 |
| Total | 56 (100.0%) | $75,625 |
Poverty in Virginia City
Income Below Poverty by Sex and Age in Virginia City
With 15.0% poverty level for males and 3.0% for females among the residents of Virginia City, 18 to 24 year old males and 55 to 64 year old females are the most vulnerable to poverty, with 4 males (80.0%) and 2 females (13.3%) in their respective age groups living below the poverty level.
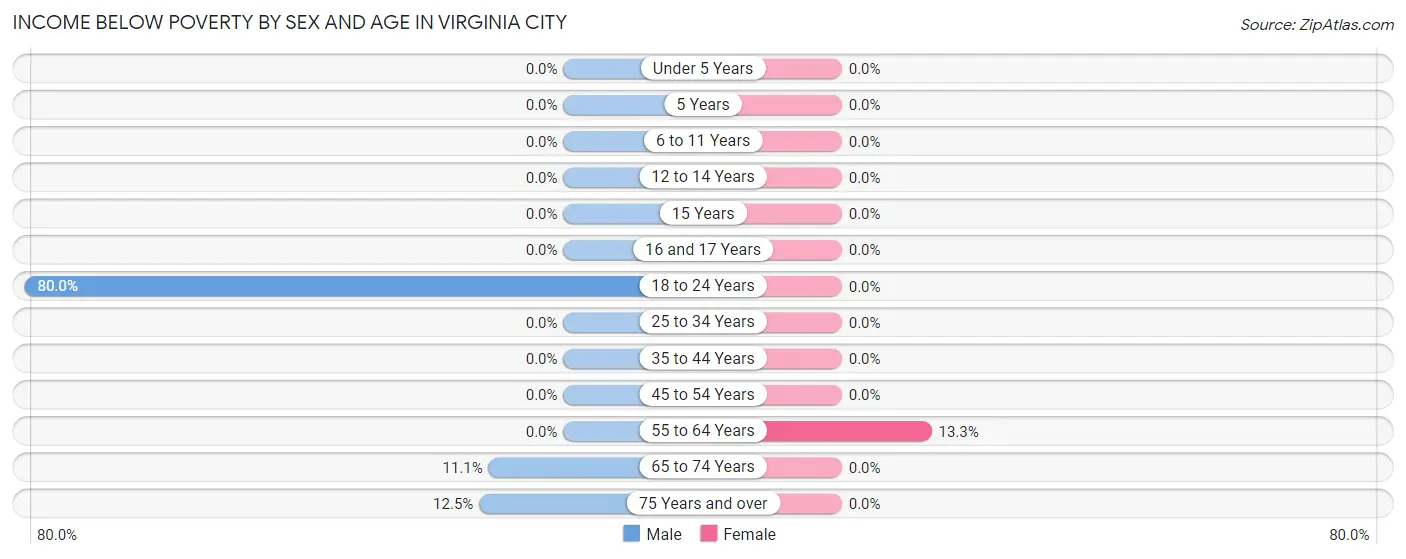
| Age Bracket | Male | Female |
| Under 5 Years | 0 (0.0%) | 0 (0.0%) |
| 5 Years | 0 (0.0%) | 0 (0.0%) |
| 6 to 11 Years | 0 (0.0%) | 0 (0.0%) |
| 12 to 14 Years | 0 (0.0%) | 0 (0.0%) |
| 15 Years | 0 (0.0%) | 0 (0.0%) |
| 16 and 17 Years | 0 (0.0%) | 0 (0.0%) |
| 18 to 24 Years | 4 (80.0%) | 0 (0.0%) |
| 25 to 34 Years | 0 (0.0%) | 0 (0.0%) |
| 35 to 44 Years | 0 (0.0%) | 0 (0.0%) |
| 45 to 54 Years | 0 (0.0%) | 0 (0.0%) |
| 55 to 64 Years | 0 (0.0%) | 2 (13.3%) |
| 65 to 74 Years | 3 (11.1%) | 0 (0.0%) |
| 75 Years and over | 2 (12.5%) | 0 (0.0%) |
| Total | 9 (15.0%) | 2 (3.0%) |
Income Above Poverty by Sex and Age in Virginia City
According to the poverty statistics in Virginia City, males aged 6 to 11 years and females aged under 5 years are the age groups that are most secure financially, with 100.0% of males and 100.0% of females in these age groups living above the poverty line.
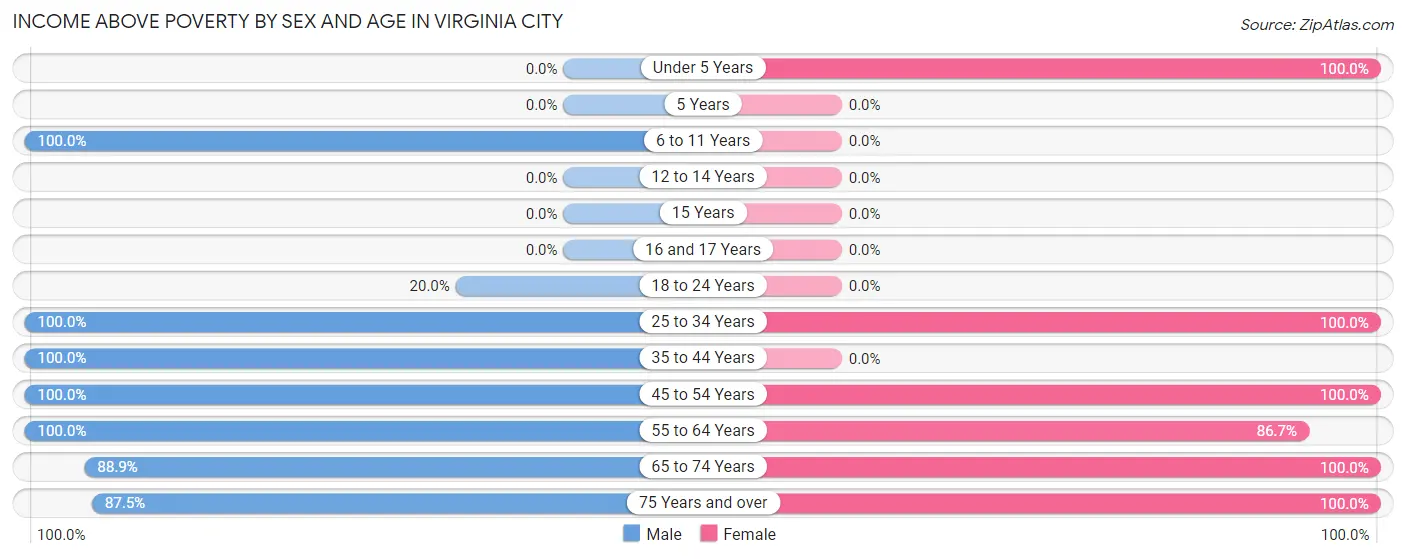
| Age Bracket | Male | Female |
| Under 5 Years | 0 (0.0%) | 2 (100.0%) |
| 5 Years | 0 (0.0%) | 0 (0.0%) |
| 6 to 11 Years | 2 (100.0%) | 0 (0.0%) |
| 12 to 14 Years | 0 (0.0%) | 0 (0.0%) |
| 15 Years | 0 (0.0%) | 0 (0.0%) |
| 16 and 17 Years | 0 (0.0%) | 0 (0.0%) |
| 18 to 24 Years | 1 (20.0%) | 0 (0.0%) |
| 25 to 34 Years | 2 (100.0%) | 2 (100.0%) |
| 35 to 44 Years | 1 (100.0%) | 0 (0.0%) |
| 45 to 54 Years | 3 (100.0%) | 17 (100.0%) |
| 55 to 64 Years | 4 (100.0%) | 13 (86.7%) |
| 65 to 74 Years | 24 (88.9%) | 13 (100.0%) |
| 75 Years and over | 14 (87.5%) | 18 (100.0%) |
| Total | 51 (85.0%) | 65 (97.0%) |
Income Below Poverty Among Married-Couple Families in Virginia City
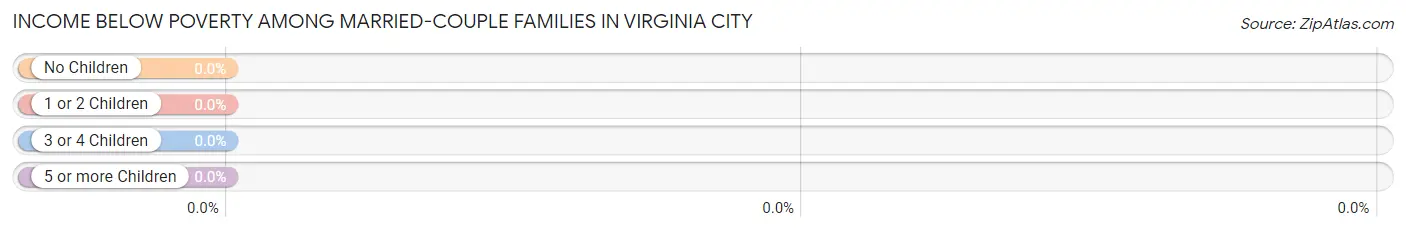
| Children | Above Poverty | Below Poverty |
| No Children | 29 (100.0%) | 0 (0.0%) |
| 1 or 2 Children | 0 (0.0%) | 0 (0.0%) |
| 3 or 4 Children | 0 (0.0%) | 0 (0.0%) |
| 5 or more Children | 0 (0.0%) | 0 (0.0%) |
| Total | 29 (100.0%) | 0 (0.0%) |
Income Below Poverty Among Single-Parent Households in Virginia City
| Children | Single Father | Single Mother |
| No Children | 0 (0.0%) | 0 (0.0%) |
| 1 or 2 Children | 0 (0.0%) | 0 (0.0%) |
| 3 or 4 Children | 0 (0.0%) | 0 (0.0%) |
| 5 or more Children | 0 (0.0%) | 0 (0.0%) |
| Total | 0 (0.0%) | 0 (0.0%) |
Income Below Poverty Among Married-Couple vs Single-Parent Households in Virginia City
| Children | Married-Couple Families | Single-Parent Households |
| No Children | 0 (0.0%) | 0 (0.0%) |
| 1 or 2 Children | 0 (0.0%) | 0 (0.0%) |
| 3 or 4 Children | 0 (0.0%) | 0 (0.0%) |
| 5 or more Children | 0 (0.0%) | 0 (0.0%) |
| Total | 0 (0.0%) | 0 (0.0%) |
Race in Virginia City
The most populous races in Virginia City are White / Caucasian (124 | 97.6%), Two or more Races (2 | 1.6%), and Native / Alaskan (1 | 0.8%).
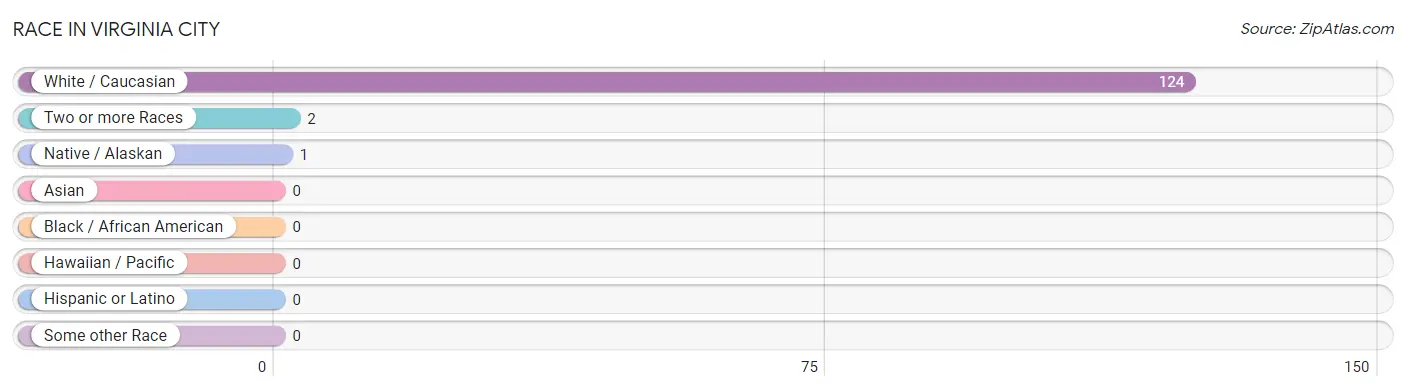
| Race | # Population | % Population |
| Asian | 0 | 0.0% |
| Black / African American | 0 | 0.0% |
| Hawaiian / Pacific | 0 | 0.0% |
| Hispanic or Latino | 0 | 0.0% |
| Native / Alaskan | 1 | 0.8% |
| White / Caucasian | 124 | 97.6% |
| Two or more Races | 2 | 1.6% |
| Some other Race | 0 | 0.0% |
| Total | 127 | 100.0% |
Ancestry in Virginia City
The most populous ancestries reported in Virginia City are German (31 | 24.4%), English (22 | 17.3%), Dutch (17 | 13.4%), British (16 | 12.6%), and American (15 | 11.8%), together accounting for 79.5% of all Virginia City residents.
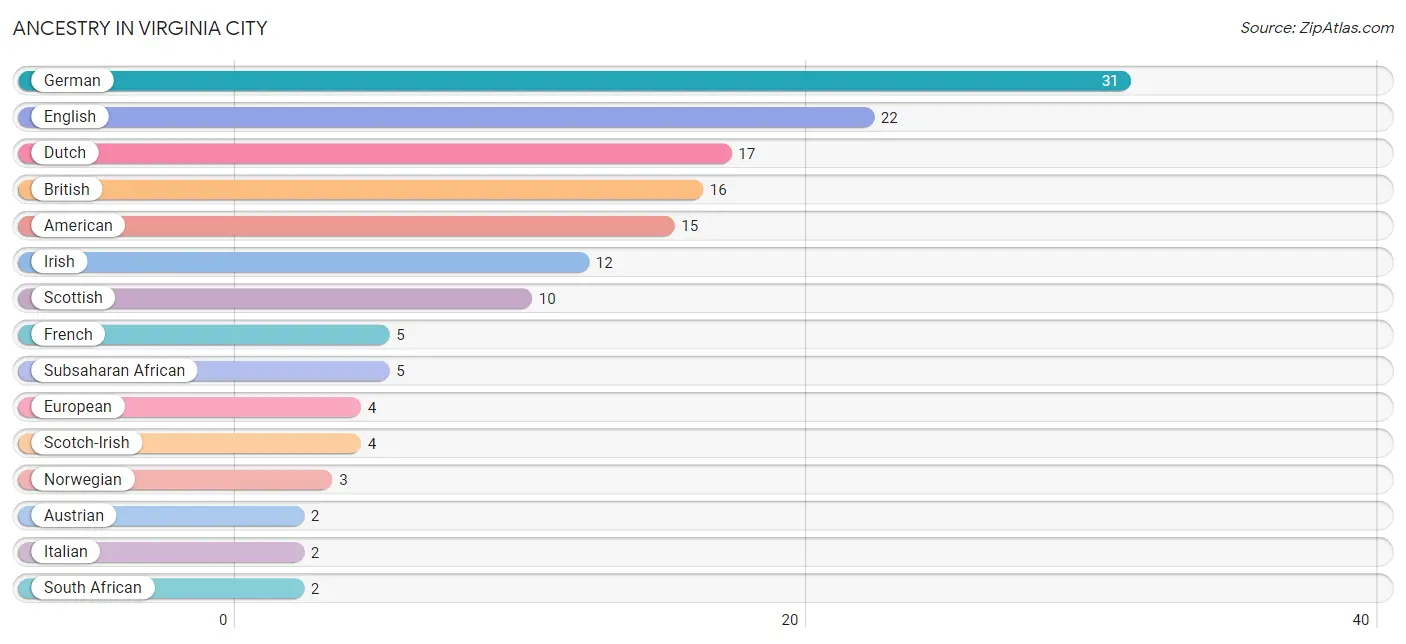
| Ancestry | # Population | % Population |
| American | 15 | 11.8% |
| Austrian | 2 | 1.6% |
| British | 16 | 12.6% |
| Cherokee | 1 | 0.8% |
| Dutch | 17 | 13.4% |
| English | 22 | 17.3% |
| European | 4 | 3.2% |
| French | 5 | 3.9% |
| French Canadian | 1 | 0.8% |
| German | 31 | 24.4% |
| Irish | 12 | 9.5% |
| Italian | 2 | 1.6% |
| Norwegian | 3 | 2.4% |
| Scotch-Irish | 4 | 3.2% |
| Scottish | 10 | 7.9% |
| South African | 2 | 1.6% |
| Subsaharan African | 5 | 3.9% | View All 17 Rows |
Immigrants in Virginia City
The most numerous immigrant groups reported in Virginia City came from Africa (5 | 3.9%), Eastern Africa (3 | 2.4%), Austria (2 | 1.6%), Europe (2 | 1.6%), and South Africa (2 | 1.6%), together accounting for 11.0% of all Virginia City residents.
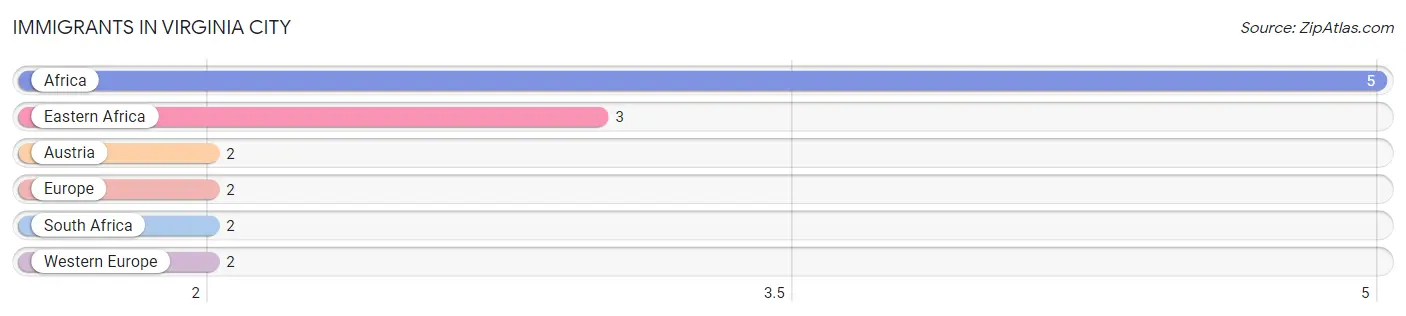
| Immigration Origin | # Population | % Population |
| Africa | 5 | 3.9% |
| Austria | 2 | 1.6% |
| Eastern Africa | 3 | 2.4% |
| Europe | 2 | 1.6% |
| South Africa | 2 | 1.6% |
| Western Europe | 2 | 1.6% | View All 6 Rows |
Sex and Age in Virginia City
Sex and Age in Virginia City
The most populous age groups in Virginia City are 65 to 69 Years (16 | 26.7%) for men and 75 to 79 Years (18 | 26.9%) for women.
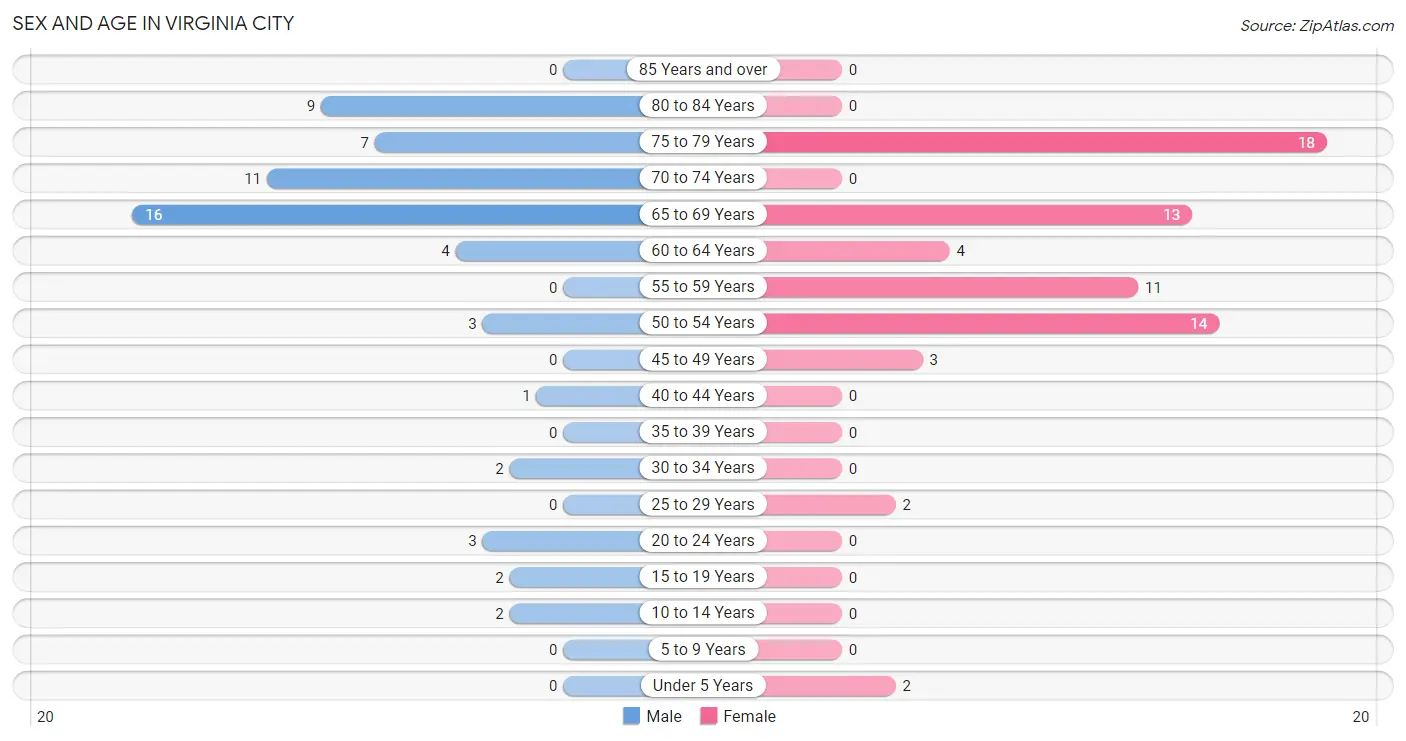
| Age Bracket | Male | Female |
| Under 5 Years | 0 (0.0%) | 2 (3.0%) |
| 5 to 9 Years | 0 (0.0%) | 0 (0.0%) |
| 10 to 14 Years | 2 (3.3%) | 0 (0.0%) |
| 15 to 19 Years | 2 (3.3%) | 0 (0.0%) |
| 20 to 24 Years | 3 (5.0%) | 0 (0.0%) |
| 25 to 29 Years | 0 (0.0%) | 2 (3.0%) |
| 30 to 34 Years | 2 (3.3%) | 0 (0.0%) |
| 35 to 39 Years | 0 (0.0%) | 0 (0.0%) |
| 40 to 44 Years | 1 (1.7%) | 0 (0.0%) |
| 45 to 49 Years | 0 (0.0%) | 3 (4.5%) |
| 50 to 54 Years | 3 (5.0%) | 14 (20.9%) |
| 55 to 59 Years | 0 (0.0%) | 11 (16.4%) |
| 60 to 64 Years | 4 (6.7%) | 4 (6.0%) |
| 65 to 69 Years | 16 (26.7%) | 13 (19.4%) |
| 70 to 74 Years | 11 (18.3%) | 0 (0.0%) |
| 75 to 79 Years | 7 (11.7%) | 18 (26.9%) |
| 80 to 84 Years | 9 (15.0%) | 0 (0.0%) |
| 85 Years and over | 0 (0.0%) | 0 (0.0%) |
| Total | 60 (100.0%) | 67 (100.0%) |
Families and Households in Virginia City
Median Family Size in Virginia City
The median family size in Virginia City is 2.53 persons per family, with single female/mother families (4 | 11.1%) accounting for the largest median family size of 5.25 persons per family. On the other hand, married-couple families (29 | 80.6%) represent the smallest median family size with 1.97 persons per family.
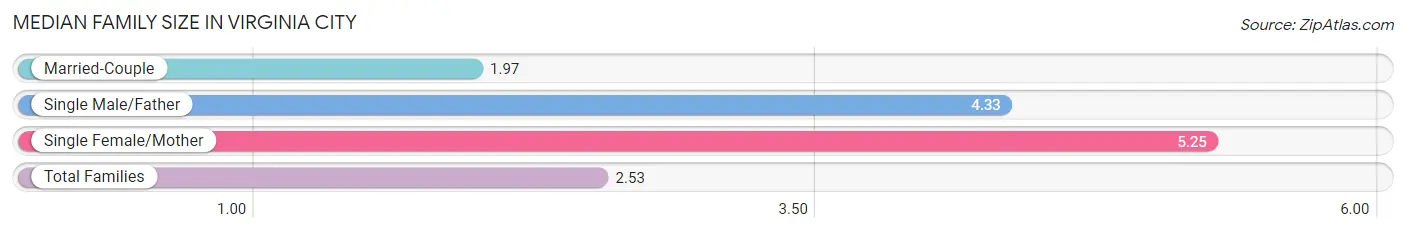
| Family Type | # Families | Family Size |
| Married-Couple | 29 (80.6%) | 1.97 |
| Single Male/Father | 3 (8.3%) | 4.33 |
| Single Female/Mother | 4 (11.1%) | 5.25 |
| Total Families | 36 (100.0%) | 2.53 |
Median Household Size in Virginia City
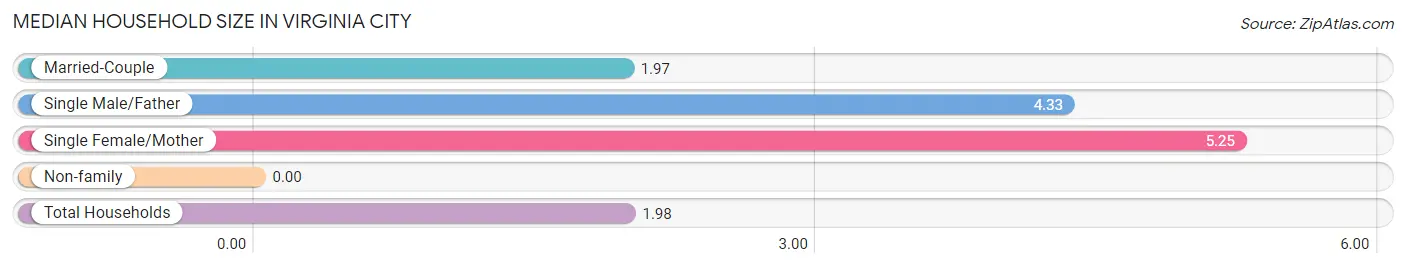
| Household Type | # Households | Household Size |
| Married-Couple | 29 (51.8%) | 1.97 |
| Single Male/Father | 3 (5.4%) | 4.33 |
| Single Female/Mother | 4 (7.1%) | 5.25 |
| Non-family | 20 (35.7%) | - |
| Total Households | 56 (100.0%) | 1.98 |
Household Size by Marriage Status in Virginia City
Out of a total of 56 households in Virginia City, 36 (64.3%) are family households, while 20 (35.7%) are nonfamily households. The most numerous type of family households are 2-person households, comprising 34, and the most common type of nonfamily households are 1-person households, comprising 20.
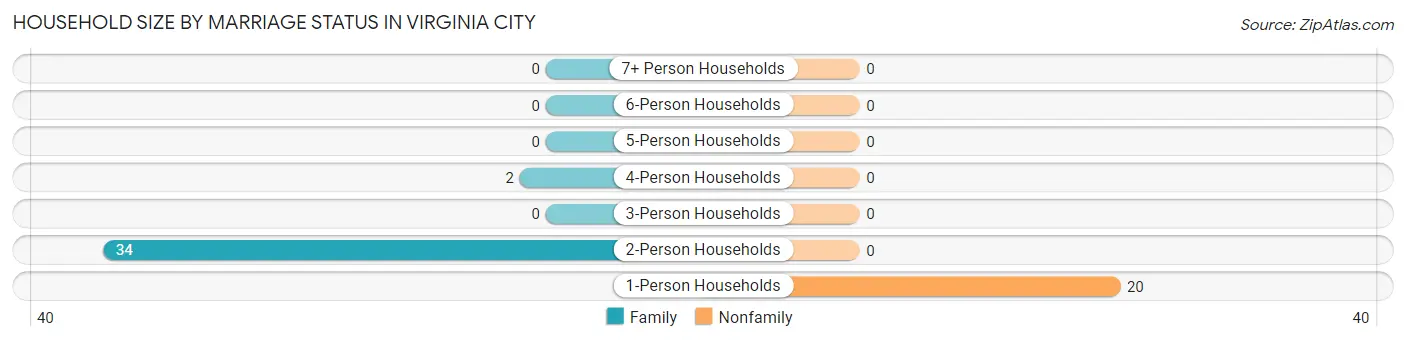
| Household Size | Family Households | Nonfamily Households |
| 1-Person Households | - | 20 (35.7%) |
| 2-Person Households | 34 (60.7%) | 0 (0.0%) |
| 3-Person Households | 0 (0.0%) | 0 (0.0%) |
| 4-Person Households | 2 (3.6%) | 0 (0.0%) |
| 5-Person Households | 0 (0.0%) | 0 (0.0%) |
| 6-Person Households | 0 (0.0%) | 0 (0.0%) |
| 7+ Person Households | 0 (0.0%) | 0 (0.0%) |
| Total | 36 (64.3%) | 20 (35.7%) |
Female Fertility in Virginia City
Fertility by Age in Virginia City
| Age Bracket | Women with Births | Births / 1,000 Women |
| 15 to 19 years | 0 (0.0%) | 0.0 |
| 20 to 34 years | 0 (0.0%) | 0.0 |
| 35 to 50 years | 0 (0.0%) | 0.0 |
| Total | 0 (0.0%) | 0.0 |
Fertility by Age by Marriage Status in Virginia City
| Age Bracket | Married | Unmarried |
| 15 to 19 years | 0 (0.0%) | 0 (0.0%) |
| 20 to 34 years | 0 (0.0%) | 0 (0.0%) |
| 35 to 50 years | 0 (0.0%) | 0 (0.0%) |
| Total | 0 (0.0%) | 0 (0.0%) |
Fertility by Education in Virginia City
| Educational Attainment | Women with Births | Births / 1,000 Women |
| Less than High School | 0 (0.0%) | 0.0 |
| High School Diploma | 0 (0.0%) | 0.0 |
| College or Associate's Degree | 0 (0.0%) | 0.0 |
| Bachelor's Degree | 0 (0.0%) | 0.0 |
| Graduate Degree | 0 (0.0%) | 0.0 |
| Total | 0 (0.0%) | 0.0 |
Fertility by Education by Marriage Status in Virginia City
| Educational Attainment | Married | Unmarried |
| Less than High School | 0 (0.0%) | 0 (0.0%) |
| High School Diploma | 0 (0.0%) | 0 (0.0%) |
| College or Associate's Degree | 0 (0.0%) | 0 (0.0%) |
| Bachelor's Degree | 0 (0.0%) | 0 (0.0%) |
| Graduate Degree | 0 (0.0%) | 0 (0.0%) |
| Total | 0 (0.0%) | 0 (0.0%) |
Employment Characteristics in Virginia City
Employment by Class of Employer in Virginia City
Among the 53 employed individuals in Virginia City, private company employees (26 | 49.1%), self-employed (incorporated) (11 | 20.7%), and self-employed (not incorporated) (7 | 13.2%) make up the most common classes of employment.
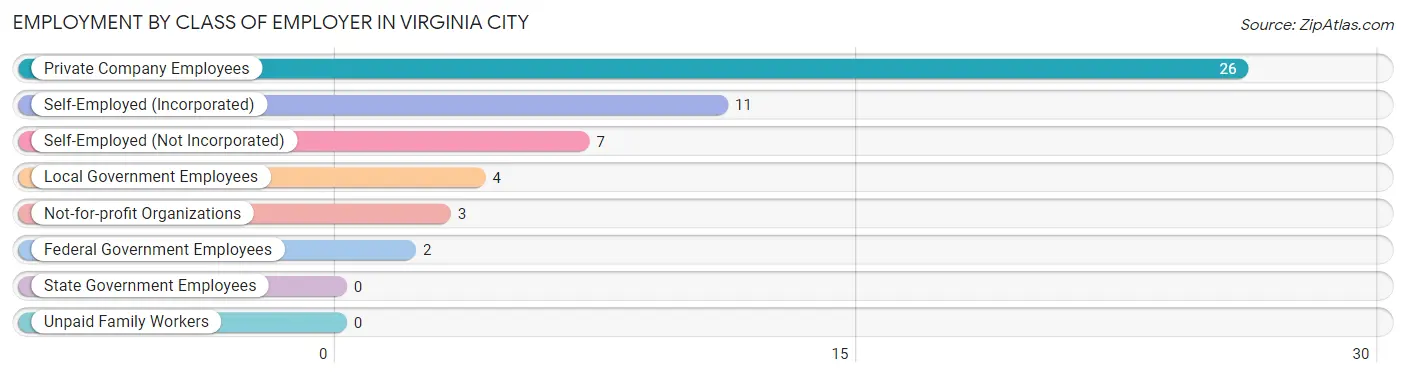
| Employer Class | # Employees | % Employees |
| Private Company Employees | 26 | 49.1% |
| Self-Employed (Incorporated) | 11 | 20.7% |
| Self-Employed (Not Incorporated) | 7 | 13.2% |
| Not-for-profit Organizations | 3 | 5.7% |
| Local Government Employees | 4 | 7.5% |
| State Government Employees | 0 | 0.0% |
| Federal Government Employees | 2 | 3.8% |
| Unpaid Family Workers | 0 | 0.0% |
| Total | 53 | 100.0% |
Employment Status by Age in Virginia City
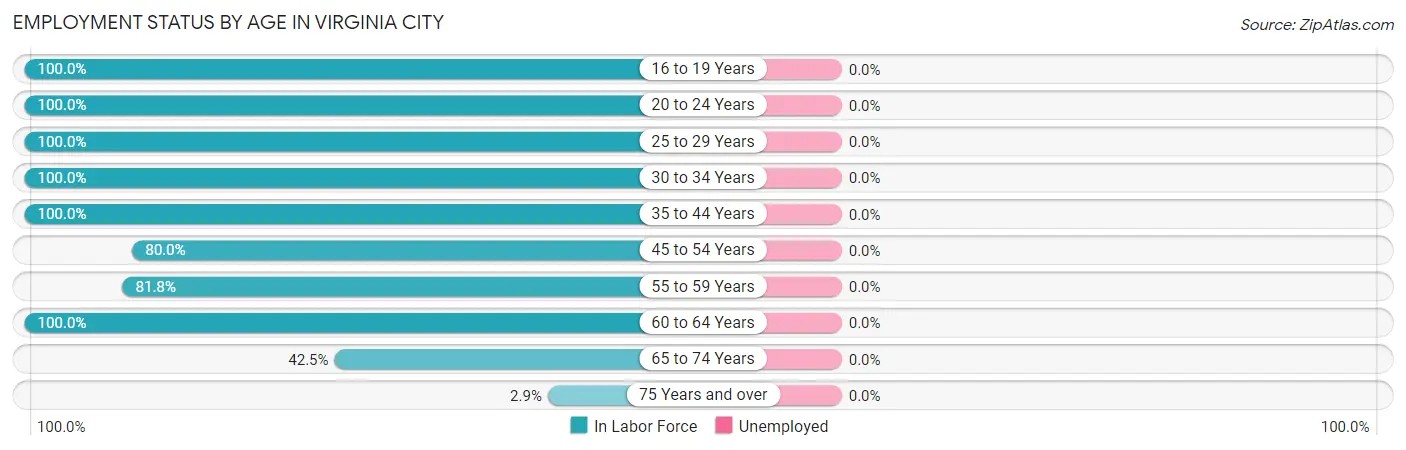
| Age Bracket | In Labor Force | Unemployed |
| 16 to 19 Years | 2 (100.0%) | 0 (0.0%) |
| 20 to 24 Years | 3 (100.0%) | 0 (0.0%) |
| 25 to 29 Years | 2 (100.0%) | 0 (0.0%) |
| 30 to 34 Years | 2 (100.0%) | 0 (0.0%) |
| 35 to 44 Years | 1 (100.0%) | 0 (0.0%) |
| 45 to 54 Years | 16 (80.0%) | 0 (0.0%) |
| 55 to 59 Years | 9 (81.8%) | 0 (0.0%) |
| 60 to 64 Years | 8 (100.0%) | 0 (0.0%) |
| 65 to 74 Years | 17 (42.5%) | 0 (0.0%) |
| 75 Years and over | 1 (2.9%) | 0 (0.0%) |
| Total | 61 (49.6%) | 0 (0.0%) |
Employment Status by Educational Attainment in Virginia City
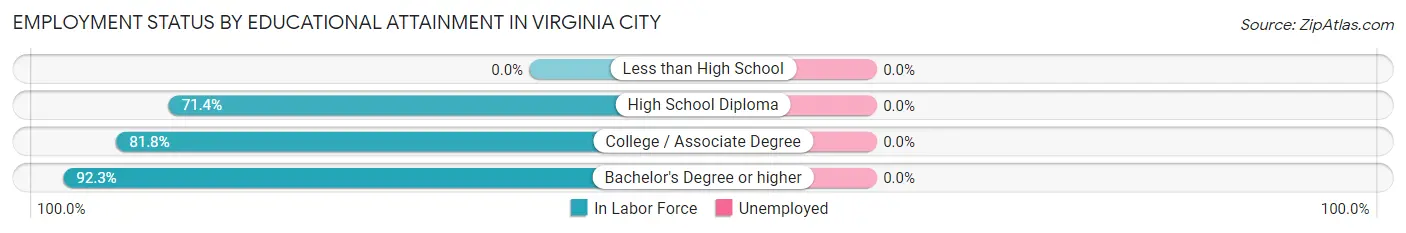
| Educational Attainment | In Labor Force | Unemployed |
| Less than High School | 0 (0.0%) | 0 (0.0%) |
| High School Diploma | 5 (71.4%) | 0 (0.0%) |
| College / Associate Degree | 9 (81.8%) | 0 (0.0%) |
| Bachelor's Degree or higher | 24 (92.3%) | 0 (0.0%) |
| Total | 38 (86.4%) | 0 (0.0%) |
Employment Occupations by Sex in Virginia City
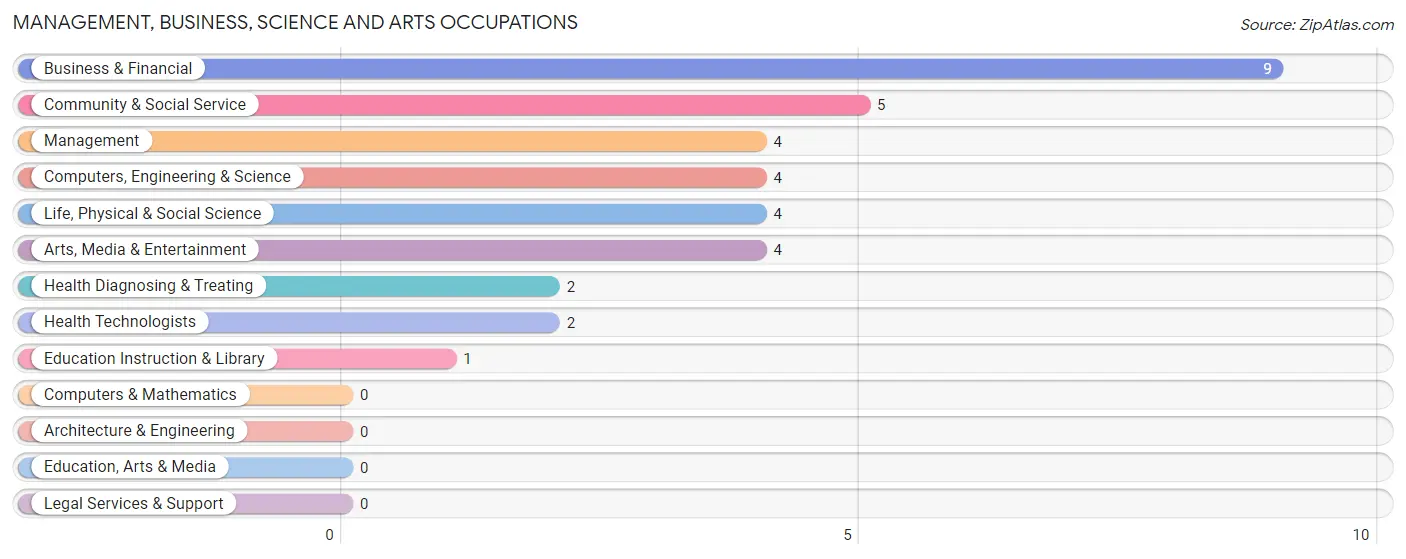
Management, Business, Science and Arts Occupations
The most common Management, Business, Science and Arts occupations in Virginia City are Business & Financial (9 | 14.7%), Community & Social Service (5 | 8.2%), Management (4 | 6.6%), Computers, Engineering & Science (4 | 6.6%), and Life, Physical & Social Science (4 | 6.6%).
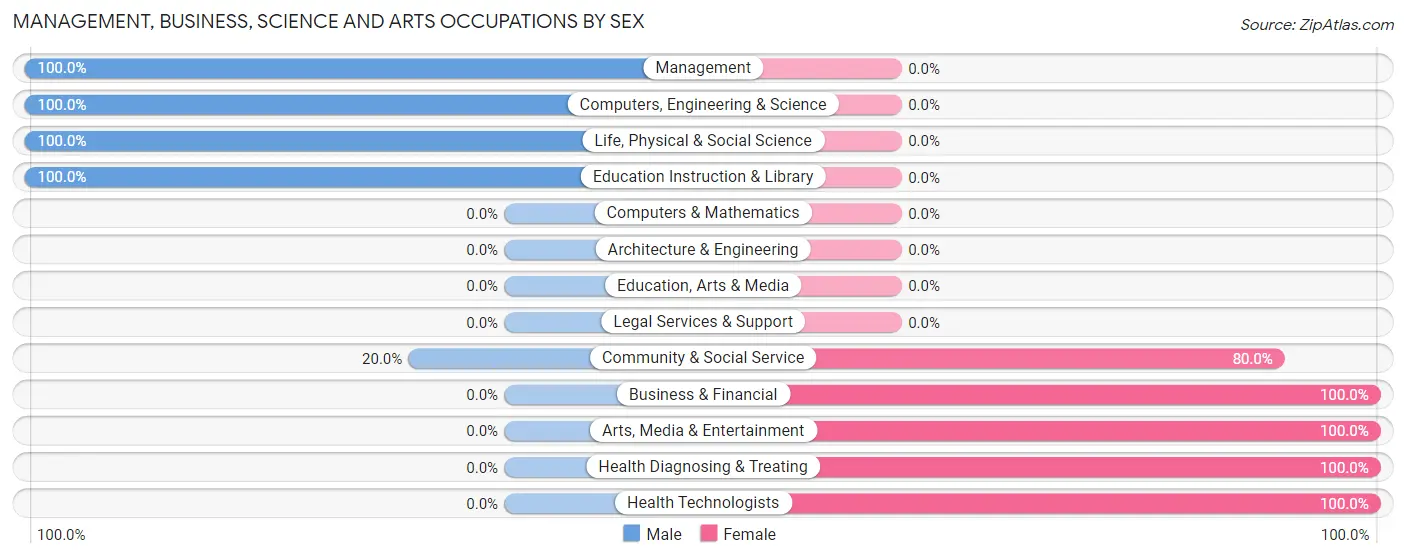
Management, Business, Science and Arts Occupations by Sex
Within the Management, Business, Science and Arts occupations in Virginia City, the most male-oriented occupations are Management (100.0%), Computers, Engineering & Science (100.0%), and Life, Physical & Social Science (100.0%), while the most female-oriented occupations are Business & Financial (100.0%), Arts, Media & Entertainment (100.0%), and Health Diagnosing & Treating (100.0%).
| Occupation | Male | Female |
| Management | 4 (100.0%) | 0 (0.0%) |
| Business & Financial | 0 (0.0%) | 9 (100.0%) |
| Computers, Engineering & Science | 4 (100.0%) | 0 (0.0%) |
| Computers & Mathematics | 0 (0.0%) | 0 (0.0%) |
| Architecture & Engineering | 0 (0.0%) | 0 (0.0%) |
| Life, Physical & Social Science | 4 (100.0%) | 0 (0.0%) |
| Community & Social Service | 1 (20.0%) | 4 (80.0%) |
| Education, Arts & Media | 0 (0.0%) | 0 (0.0%) |
| Legal Services & Support | 0 (0.0%) | 0 (0.0%) |
| Education Instruction & Library | 1 (100.0%) | 0 (0.0%) |
| Arts, Media & Entertainment | 0 (0.0%) | 4 (100.0%) |
| Health Diagnosing & Treating | 0 (0.0%) | 2 (100.0%) |
| Health Technologists | 0 (0.0%) | 2 (100.0%) |
| Total (Category) | 9 (37.5%) | 15 (62.5%) |
| Total (Overall) | 29 (47.5%) | 32 (52.5%) |
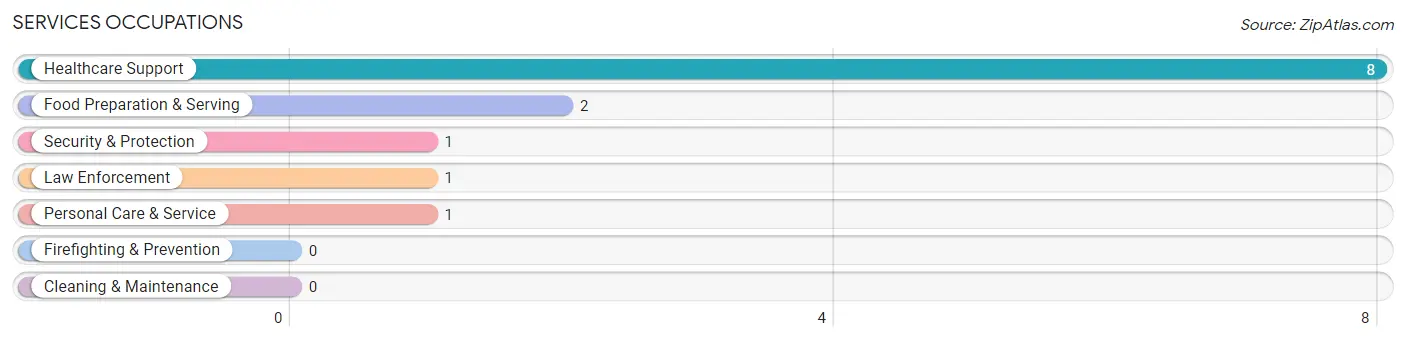
Services Occupations
The most common Services occupations in Virginia City are Healthcare Support (8 | 13.1%), Food Preparation & Serving (2 | 3.3%), Security & Protection (1 | 1.6%), Law Enforcement (1 | 1.6%), and Personal Care & Service (1 | 1.6%).
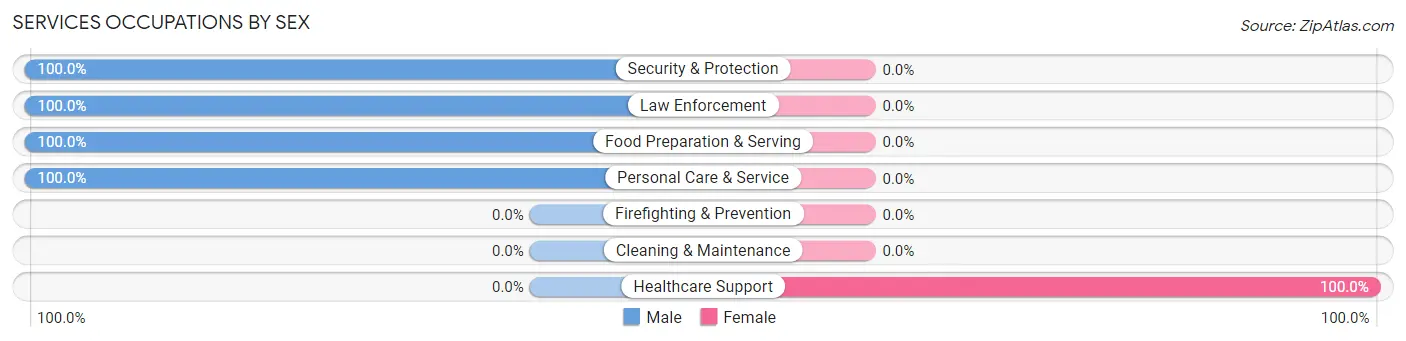
Services Occupations by Sex
| Occupation | Male | Female |
| Healthcare Support | 0 (0.0%) | 8 (100.0%) |
| Security & Protection | 1 (100.0%) | 0 (0.0%) |
| Firefighting & Prevention | 0 (0.0%) | 0 (0.0%) |
| Law Enforcement | 1 (100.0%) | 0 (0.0%) |
| Food Preparation & Serving | 2 (100.0%) | 0 (0.0%) |
| Cleaning & Maintenance | 0 (0.0%) | 0 (0.0%) |
| Personal Care & Service | 1 (100.0%) | 0 (0.0%) |
| Total (Category) | 4 (33.3%) | 8 (66.7%) |
| Total (Overall) | 29 (47.5%) | 32 (52.5%) |
Sales and Office Occupations
The most common Sales and Office occupations in Virginia City are Sales & Related (7 | 11.5%), and Office & Administration (6 | 9.8%).
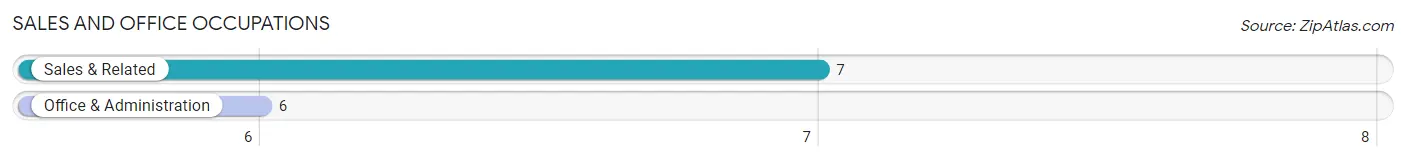
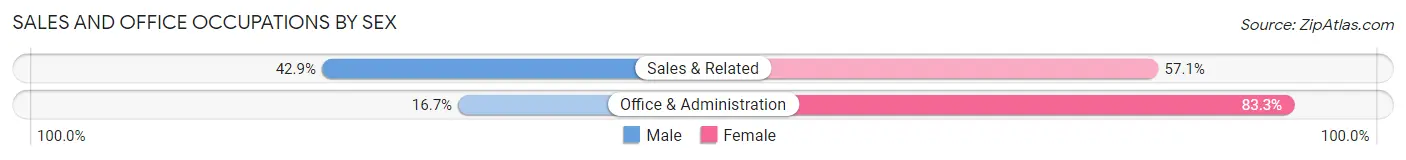
Sales and Office Occupations by Sex
| Occupation | Male | Female |
| Sales & Related | 3 (42.9%) | 4 (57.1%) |
| Office & Administration | 1 (16.7%) | 5 (83.3%) |
| Total (Category) | 4 (30.8%) | 9 (69.2%) |
| Total (Overall) | 29 (47.5%) | 32 (52.5%) |
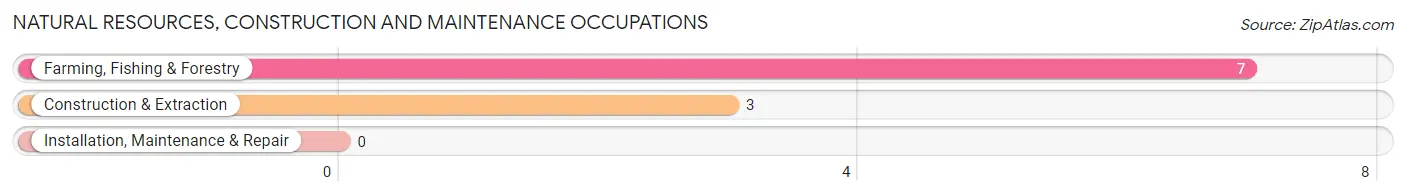
Natural Resources, Construction and Maintenance Occupations
The most common Natural Resources, Construction and Maintenance occupations in Virginia City are Farming, Fishing & Forestry (7 | 11.5%), and Construction & Extraction (3 | 4.9%).
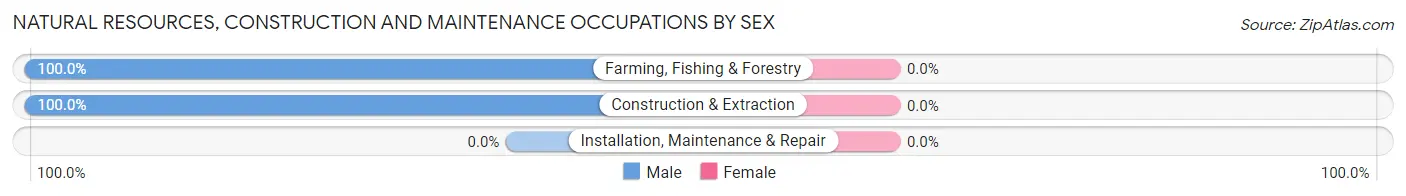
Natural Resources, Construction and Maintenance Occupations by Sex
| Occupation | Male | Female |
| Farming, Fishing & Forestry | 7 (100.0%) | 0 (0.0%) |
| Construction & Extraction | 3 (100.0%) | 0 (0.0%) |
| Installation, Maintenance & Repair | 0 (0.0%) | 0 (0.0%) |
| Total (Category) | 10 (100.0%) | 0 (0.0%) |
| Total (Overall) | 29 (47.5%) | 32 (52.5%) |
Production, Transportation and Moving Occupations
The most common Production, Transportation and Moving occupations in Virginia City are , and Material Moving (2 | 3.3%).
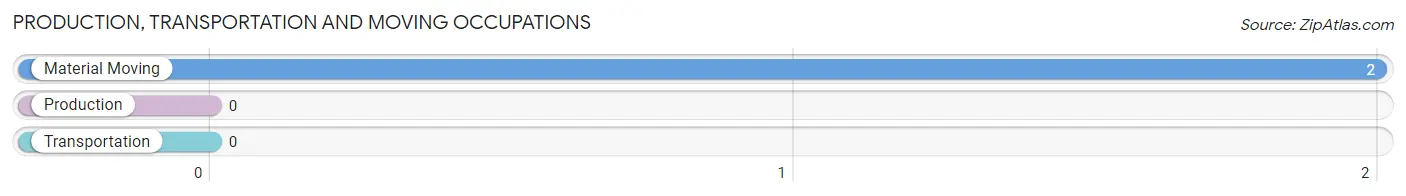
Production, Transportation and Moving Occupations by Sex
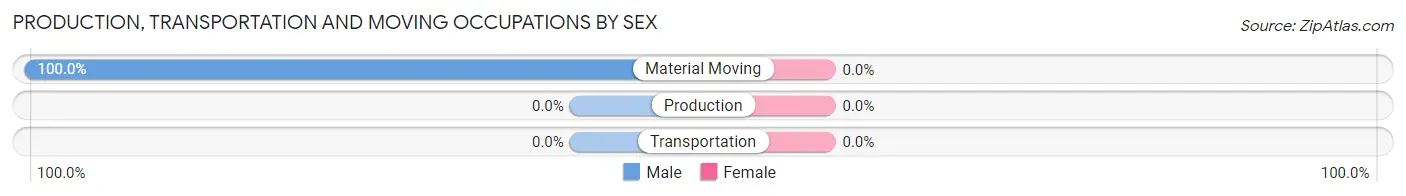
| Occupation | Male | Female |
| Production | 0 (0.0%) | 0 (0.0%) |
| Transportation | 0 (0.0%) | 0 (0.0%) |
| Material Moving | 2 (100.0%) | 0 (0.0%) |
| Total (Category) | 2 (100.0%) | 0 (0.0%) |
| Total (Overall) | 29 (47.5%) | 32 (52.5%) |
Employment Industries by Sex in Virginia City
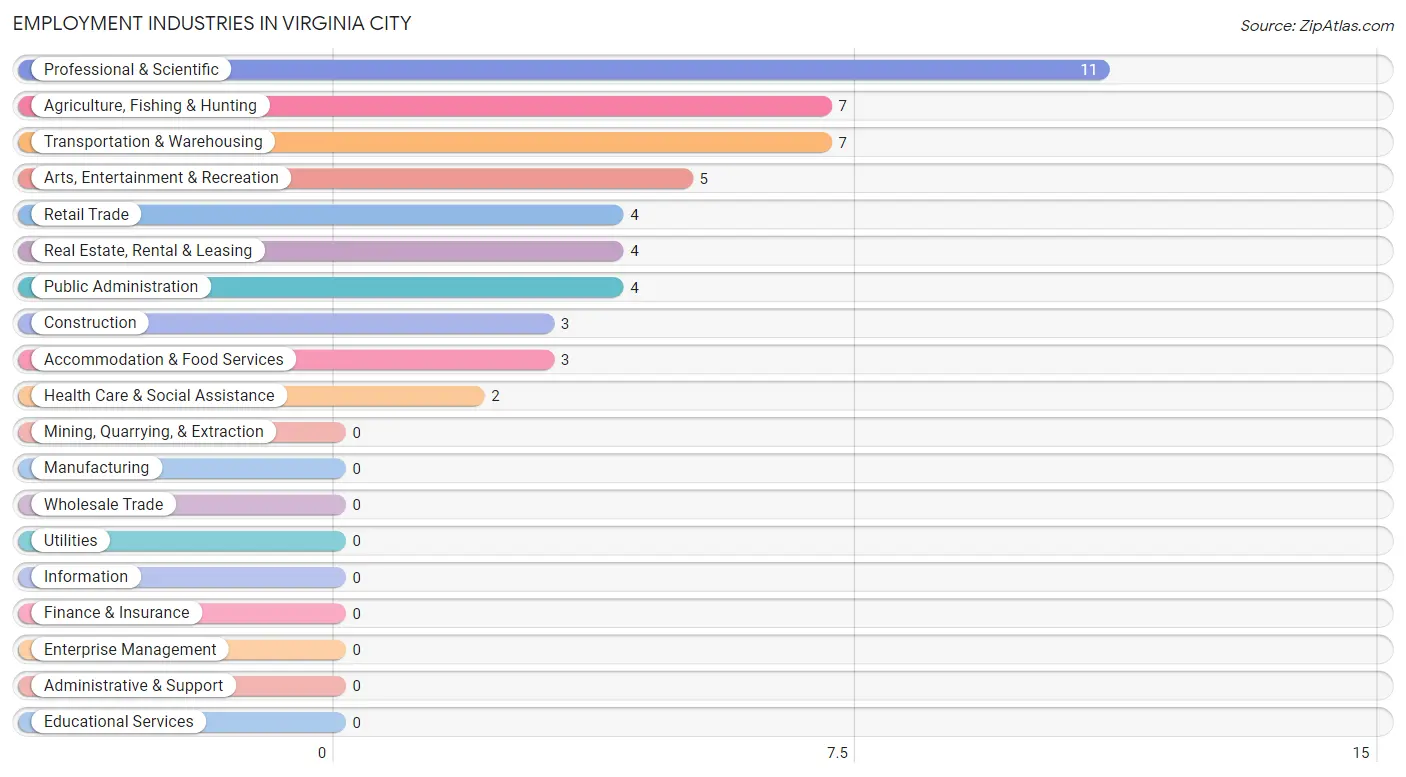
Employment Industries in Virginia City
The major employment industries in Virginia City include Professional & Scientific (11 | 18.0%), Agriculture, Fishing & Hunting (7 | 11.5%), Transportation & Warehousing (7 | 11.5%), Arts, Entertainment & Recreation (5 | 8.2%), and Retail Trade (4 | 6.6%).
Employment Industries by Sex in Virginia City
The Virginia City industries that see more men than women are Agriculture, Fishing & Hunting (100.0%), Construction (100.0%), and Real Estate, Rental & Leasing (100.0%), whereas the industries that tend to have a higher number of women are Retail Trade (100.0%), Health Care & Social Assistance (100.0%), and Transportation & Warehousing (85.7%).
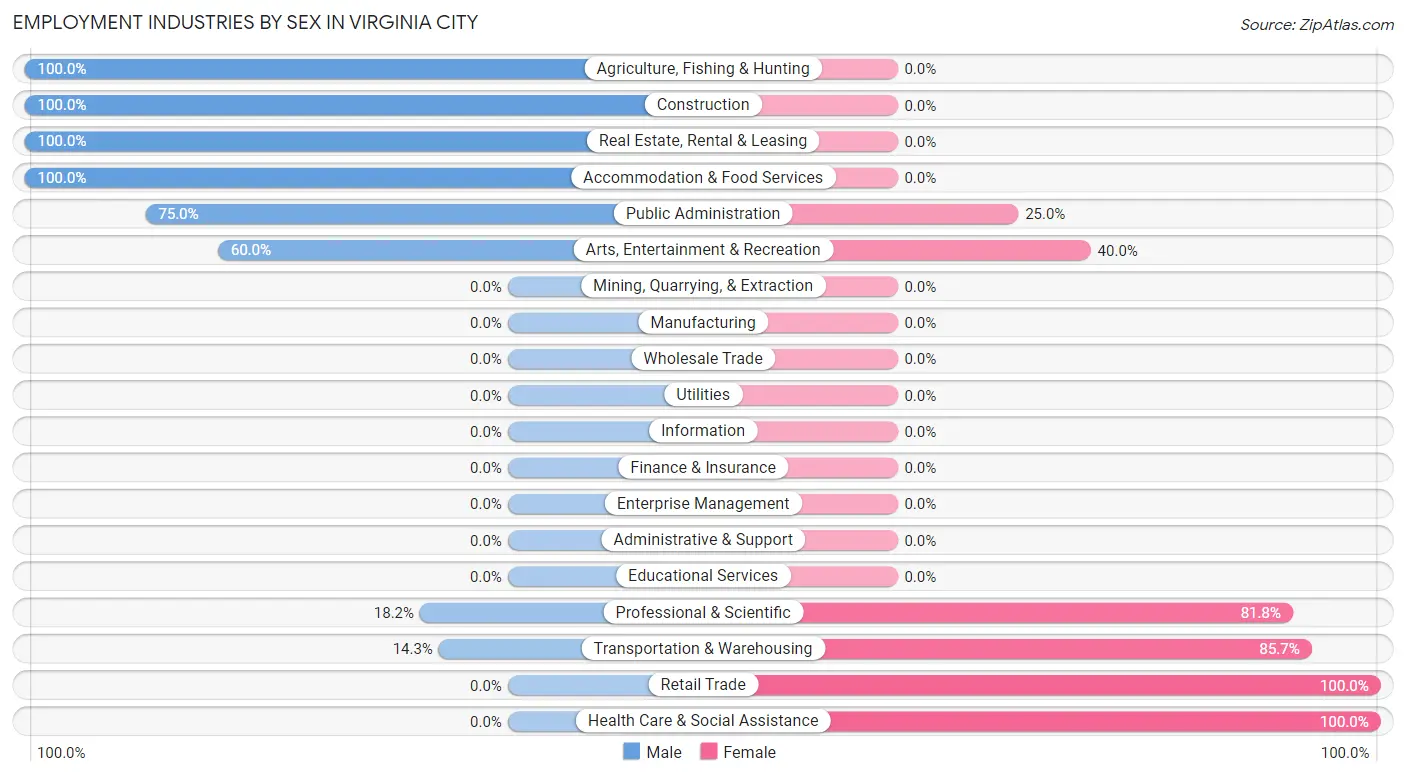
| Industry | Male | Female |
| Agriculture, Fishing & Hunting | 7 (100.0%) | 0 (0.0%) |
| Mining, Quarrying, & Extraction | 0 (0.0%) | 0 (0.0%) |
| Construction | 3 (100.0%) | 0 (0.0%) |
| Manufacturing | 0 (0.0%) | 0 (0.0%) |
| Wholesale Trade | 0 (0.0%) | 0 (0.0%) |
| Retail Trade | 0 (0.0%) | 4 (100.0%) |
| Transportation & Warehousing | 1 (14.3%) | 6 (85.7%) |
| Utilities | 0 (0.0%) | 0 (0.0%) |
| Information | 0 (0.0%) | 0 (0.0%) |
| Finance & Insurance | 0 (0.0%) | 0 (0.0%) |
| Real Estate, Rental & Leasing | 4 (100.0%) | 0 (0.0%) |
| Professional & Scientific | 2 (18.2%) | 9 (81.8%) |
| Enterprise Management | 0 (0.0%) | 0 (0.0%) |
| Administrative & Support | 0 (0.0%) | 0 (0.0%) |
| Educational Services | 0 (0.0%) | 0 (0.0%) |
| Health Care & Social Assistance | 0 (0.0%) | 2 (100.0%) |
| Arts, Entertainment & Recreation | 3 (60.0%) | 2 (40.0%) |
| Accommodation & Food Services | 3 (100.0%) | 0 (0.0%) |
| Public Administration | 3 (75.0%) | 1 (25.0%) |
| Total | 29 (47.5%) | 32 (52.5%) |
Education in Virginia City
School Enrollment in Virginia City
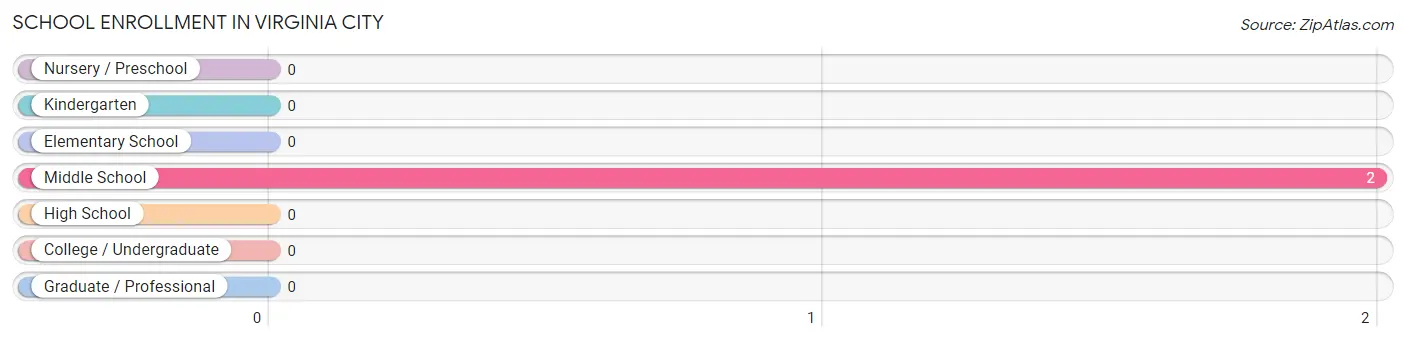
| School Level | # Students | % Students |
| Nursery / Preschool | 0 | 0.0% |
| Kindergarten | 0 | 0.0% |
| Elementary School | 0 | 0.0% |
| Middle School | 2 | 100.0% |
| High School | 0 | 0.0% |
| College / Undergraduate | 0 | 0.0% |
| Graduate / Professional | 0 | 0.0% |
| Total | 2 | 100.0% |
School Enrollment by Age by Funding Source in Virginia City
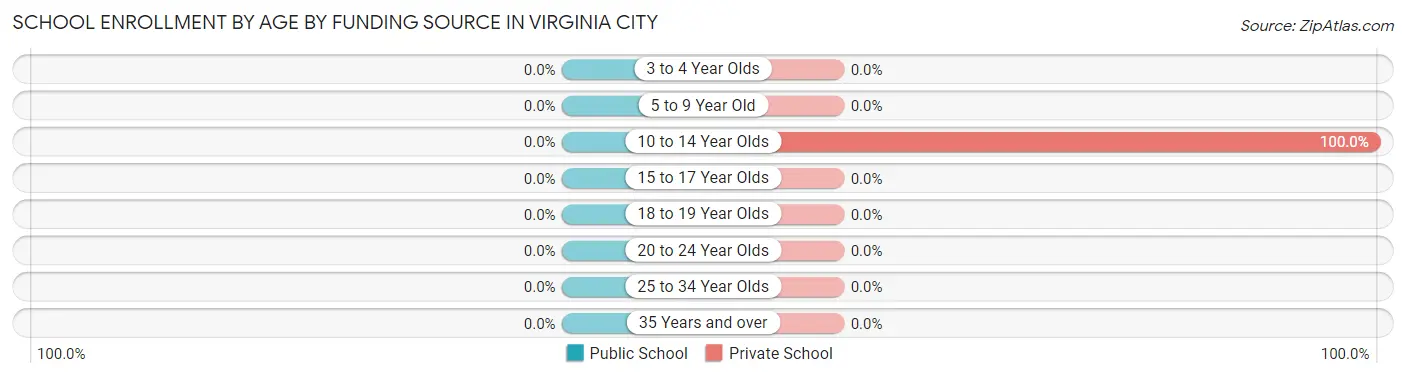
| Age Bracket | Public School | Private School |
| 3 to 4 Year Olds | 0 (0.0%) | 0 (0.0%) |
| 5 to 9 Year Old | 0 (0.0%) | 0 (0.0%) |
| 10 to 14 Year Olds | 0 (0.0%) | 2 (100.0%) |
| 15 to 17 Year Olds | 0 (0.0%) | 0 (0.0%) |
| 18 to 19 Year Olds | 0 (0.0%) | 0 (0.0%) |
| 20 to 24 Year Olds | 0 (0.0%) | 0 (0.0%) |
| 25 to 34 Year Olds | 0 (0.0%) | 0 (0.0%) |
| 35 Years and over | 0 (0.0%) | 0 (0.0%) |
| Total | 0 (0.0%) | 2 (100.0%) |
Educational Attainment by Field of Study in Virginia City
Business (12 | 35.3%), bio, nature & agricultural (11 | 32.4%), science & technology (4 | 11.8%), psychology (2 | 5.9%), and social sciences (2 | 5.9%) are the most common fields of study among 34 individuals in Virginia City who have obtained a bachelor's degree or higher.
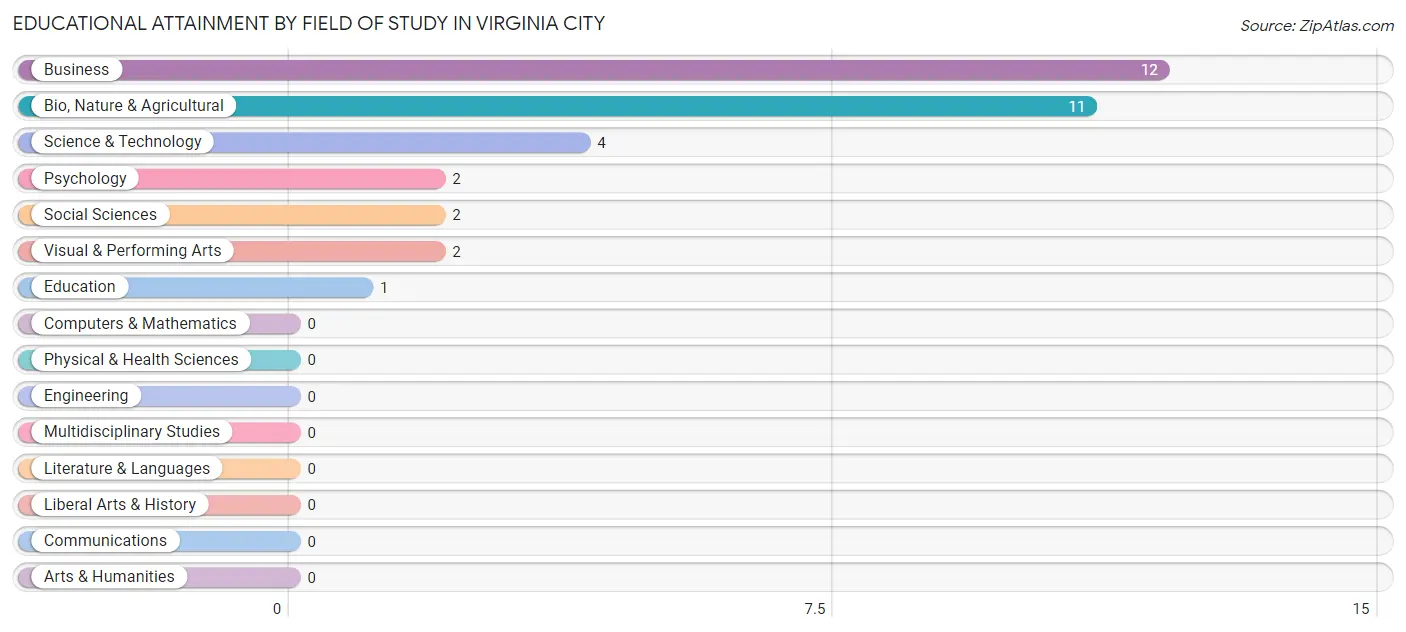
| Field of Study | # Graduates | % Graduates |
| Computers & Mathematics | 0 | 0.0% |
| Bio, Nature & Agricultural | 11 | 32.4% |
| Physical & Health Sciences | 0 | 0.0% |
| Psychology | 2 | 5.9% |
| Social Sciences | 2 | 5.9% |
| Engineering | 0 | 0.0% |
| Multidisciplinary Studies | 0 | 0.0% |
| Science & Technology | 4 | 11.8% |
| Business | 12 | 35.3% |
| Education | 1 | 2.9% |
| Literature & Languages | 0 | 0.0% |
| Liberal Arts & History | 0 | 0.0% |
| Visual & Performing Arts | 2 | 5.9% |
| Communications | 0 | 0.0% |
| Arts & Humanities | 0 | 0.0% |
| Total | 34 | 100.0% |
Transportation & Commute in Virginia City
Vehicle Availability by Sex in Virginia City
The most prevalent vehicle ownership categories in Virginia City are males with 2 vehicles (6, accounting for 37.5%) and females with 2 vehicles (16, making up 26.1%).
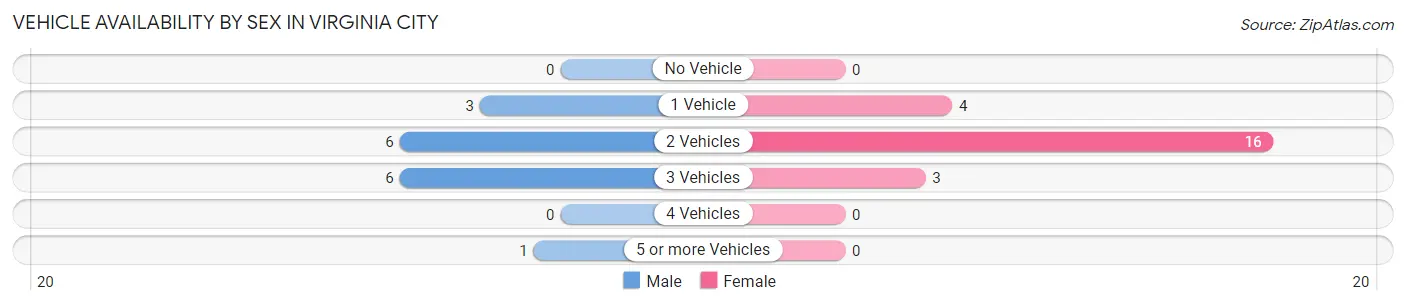
| Vehicles Available | Male | Female |
| No Vehicle | 0 (0.0%) | 0 (0.0%) |
| 1 Vehicle | 3 (18.8%) | 4 (17.4%) |
| 2 Vehicles | 6 (37.5%) | 16 (69.6%) |
| 3 Vehicles | 6 (37.5%) | 3 (13.0%) |
| 4 Vehicles | 0 (0.0%) | 0 (0.0%) |
| 5 or more Vehicles | 1 (6.2%) | 0 (0.0%) |
| Total | 16 (100.0%) | 23 (100.0%) |
Commute Time in Virginia City
The most frequently occuring commute durations in Virginia City are less than 5 minutes (13 commuters, 39.4%), 15 to 19 minutes (6 commuters, 18.2%), and 5 to 9 minutes (5 commuters, 15.1%).
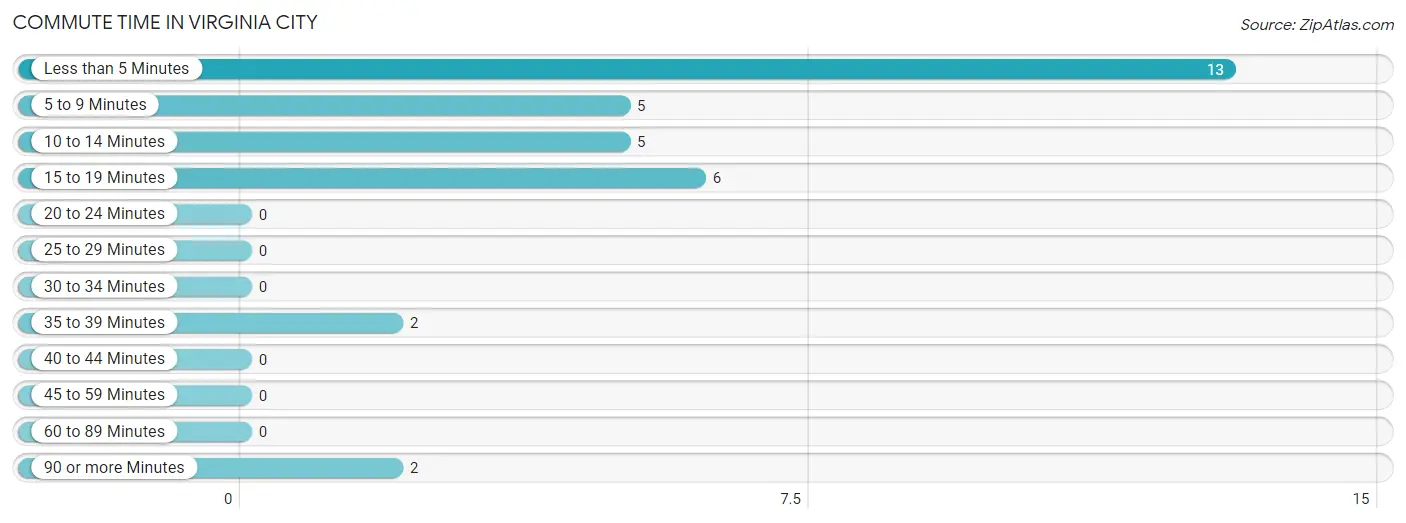
| Commute Time | # Commuters | % Commuters |
| Less than 5 Minutes | 13 | 39.4% |
| 5 to 9 Minutes | 5 | 15.1% |
| 10 to 14 Minutes | 5 | 15.1% |
| 15 to 19 Minutes | 6 | 18.2% |
| 20 to 24 Minutes | 0 | 0.0% |
| 25 to 29 Minutes | 0 | 0.0% |
| 30 to 34 Minutes | 0 | 0.0% |
| 35 to 39 Minutes | 2 | 6.1% |
| 40 to 44 Minutes | 0 | 0.0% |
| 45 to 59 Minutes | 0 | 0.0% |
| 60 to 89 Minutes | 0 | 0.0% |
| 90 or more Minutes | 2 | 6.1% |
Commute Time by Sex in Virginia City
The most common commute times in Virginia City are less than 5 minutes (11 commuters, 52.4%) for males and 5 to 9 minutes (5 commuters, 41.7%) for females.
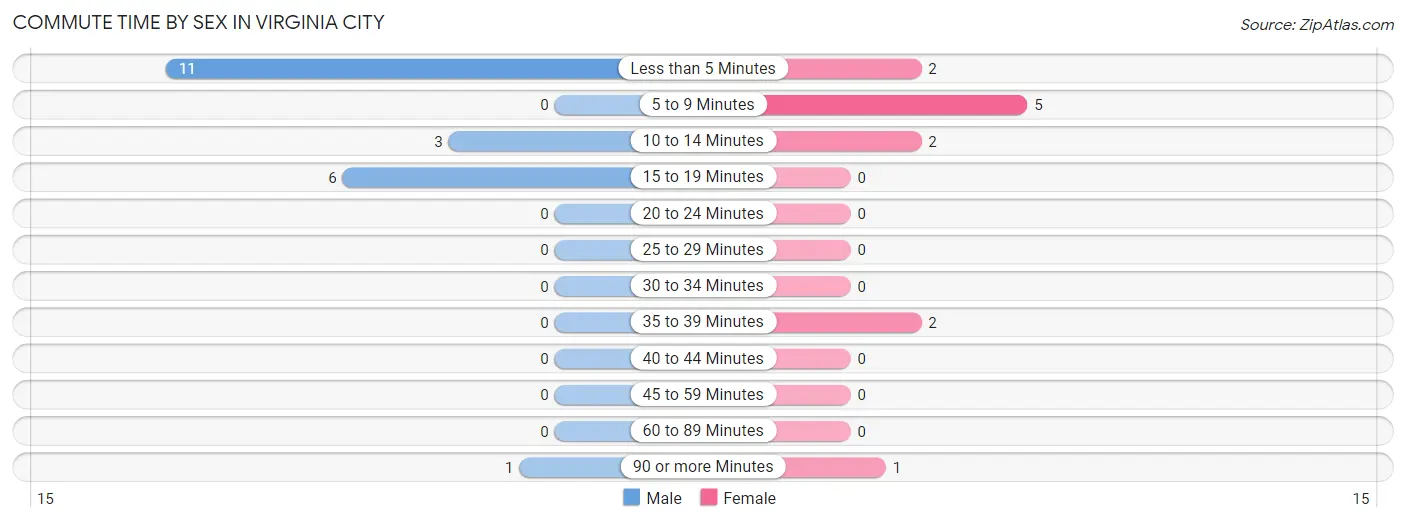
| Commute Time | Male | Female |
| Less than 5 Minutes | 11 (52.4%) | 2 (16.7%) |
| 5 to 9 Minutes | 0 (0.0%) | 5 (41.7%) |
| 10 to 14 Minutes | 3 (14.3%) | 2 (16.7%) |
| 15 to 19 Minutes | 6 (28.6%) | 0 (0.0%) |
| 20 to 24 Minutes | 0 (0.0%) | 0 (0.0%) |
| 25 to 29 Minutes | 0 (0.0%) | 0 (0.0%) |
| 30 to 34 Minutes | 0 (0.0%) | 0 (0.0%) |
| 35 to 39 Minutes | 0 (0.0%) | 2 (16.7%) |
| 40 to 44 Minutes | 0 (0.0%) | 0 (0.0%) |
| 45 to 59 Minutes | 0 (0.0%) | 0 (0.0%) |
| 60 to 89 Minutes | 0 (0.0%) | 0 (0.0%) |
| 90 or more Minutes | 1 (4.8%) | 1 (8.3%) |
Time of Departure to Work by Sex in Virginia City
The most frequent times of departure to work in Virginia City are 6:00 AM to 6:29 AM (5, 23.8%) for males and 7:00 AM to 7:29 AM (2, 16.7%) for females.
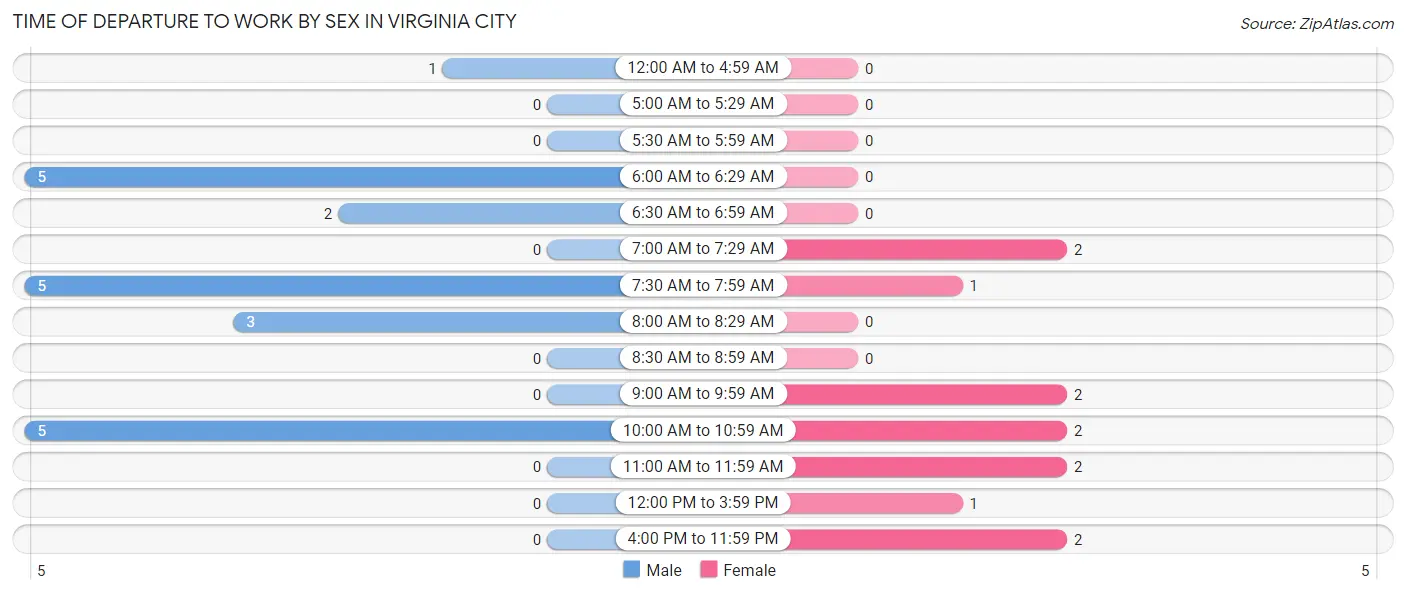
| Time of Departure | Male | Female |
| 12:00 AM to 4:59 AM | 1 (4.8%) | 0 (0.0%) |
| 5:00 AM to 5:29 AM | 0 (0.0%) | 0 (0.0%) |
| 5:30 AM to 5:59 AM | 0 (0.0%) | 0 (0.0%) |
| 6:00 AM to 6:29 AM | 5 (23.8%) | 0 (0.0%) |
| 6:30 AM to 6:59 AM | 2 (9.5%) | 0 (0.0%) |
| 7:00 AM to 7:29 AM | 0 (0.0%) | 2 (16.7%) |
| 7:30 AM to 7:59 AM | 5 (23.8%) | 1 (8.3%) |
| 8:00 AM to 8:29 AM | 3 (14.3%) | 0 (0.0%) |
| 8:30 AM to 8:59 AM | 0 (0.0%) | 0 (0.0%) |
| 9:00 AM to 9:59 AM | 0 (0.0%) | 2 (16.7%) |
| 10:00 AM to 10:59 AM | 5 (23.8%) | 2 (16.7%) |
| 11:00 AM to 11:59 AM | 0 (0.0%) | 2 (16.7%) |
| 12:00 PM to 3:59 PM | 0 (0.0%) | 1 (8.3%) |
| 4:00 PM to 11:59 PM | 0 (0.0%) | 2 (16.7%) |
| Total | 21 (100.0%) | 12 (100.0%) |
Housing Occupancy in Virginia City
Occupancy by Ownership in Virginia City
Of the total 56 dwellings in Virginia City, owner-occupied units account for 52 (92.9%), while renter-occupied units make up 4 (7.1%).
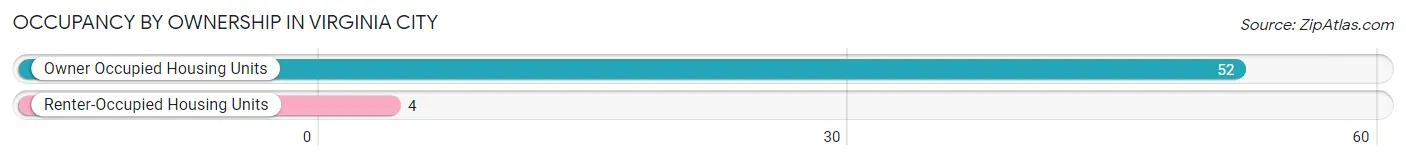
| Occupancy | # Housing Units | % Housing Units |
| Owner Occupied Housing Units | 52 | 92.9% |
| Renter-Occupied Housing Units | 4 | 7.1% |
| Total Occupied Housing Units | 56 | 100.0% |
Occupancy by Household Size in Virginia City
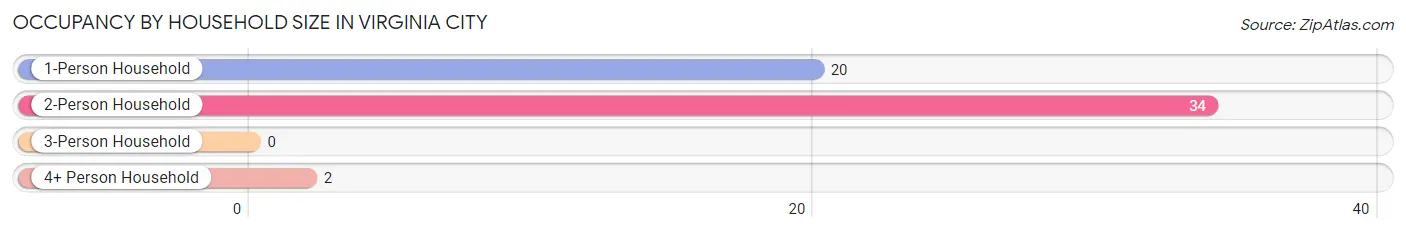
| Household Size | # Housing Units | % Housing Units |
| 1-Person Household | 20 | 35.7% |
| 2-Person Household | 34 | 60.7% |
| 3-Person Household | 0 | 0.0% |
| 4+ Person Household | 2 | 3.6% |
| Total Housing Units | 56 | 100.0% |
Occupancy by Ownership by Household Size in Virginia City
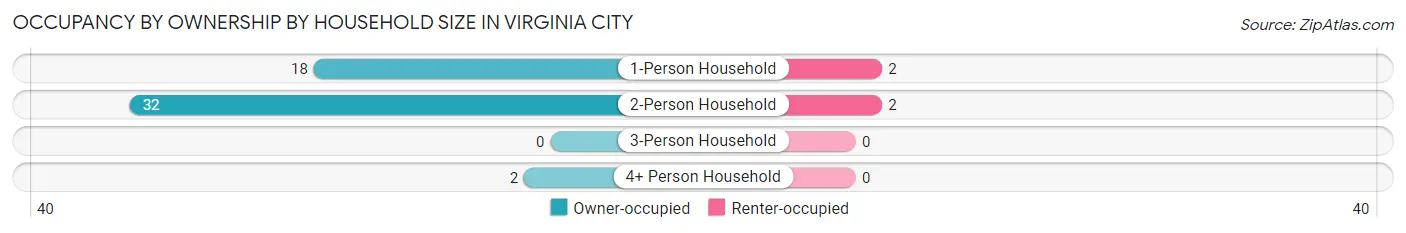
| Household Size | Owner-occupied | Renter-occupied |
| 1-Person Household | 18 (90.0%) | 2 (10.0%) |
| 2-Person Household | 32 (94.1%) | 2 (5.9%) |
| 3-Person Household | 0 (0.0%) | 0 (0.0%) |
| 4+ Person Household | 2 (100.0%) | 0 (0.0%) |
| Total Housing Units | 52 (92.9%) | 4 (7.1%) |
Occupancy by Educational Attainment in Virginia City
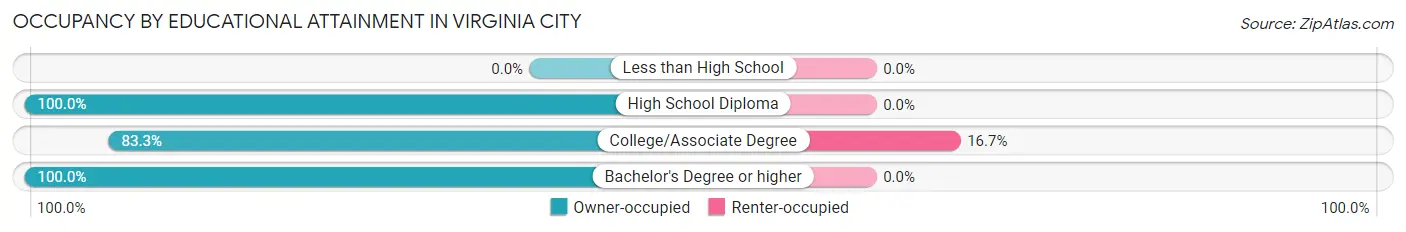
| Household Size | Owner-occupied | Renter-occupied |
| Less than High School | 0 (0.0%) | 0 (0.0%) |
| High School Diploma | 12 (100.0%) | 0 (0.0%) |
| College/Associate Degree | 20 (83.3%) | 4 (16.7%) |
| Bachelor's Degree or higher | 20 (100.0%) | 0 (0.0%) |
Occupancy by Age of Householder in Virginia City
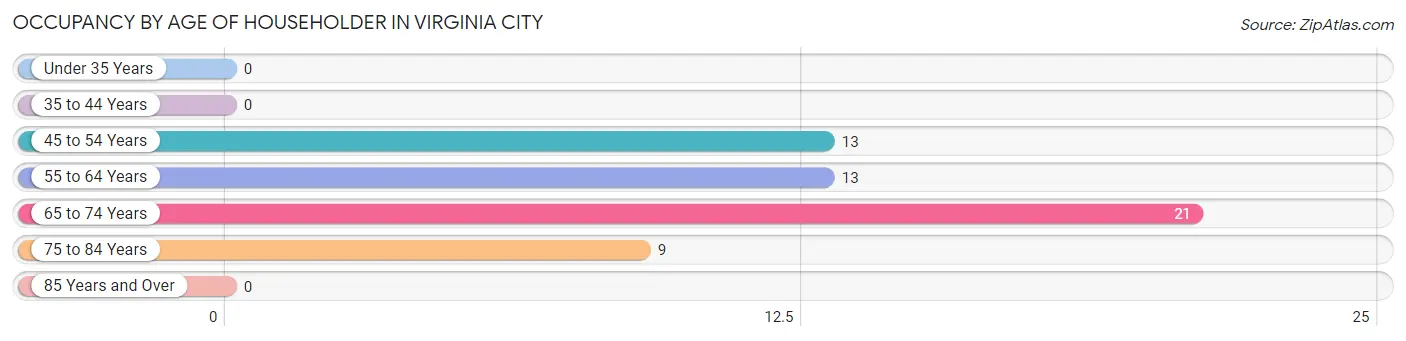
| Age Bracket | # Households | % Households |
| Under 35 Years | 0 | 0.0% |
| 35 to 44 Years | 0 | 0.0% |
| 45 to 54 Years | 13 | 23.2% |
| 55 to 64 Years | 13 | 23.2% |
| 65 to 74 Years | 21 | 37.5% |
| 75 to 84 Years | 9 | 16.1% |
| 85 Years and Over | 0 | 0.0% |
| Total | 56 | 100.0% |
Housing Finances in Virginia City
Median Income by Occupancy in Virginia City
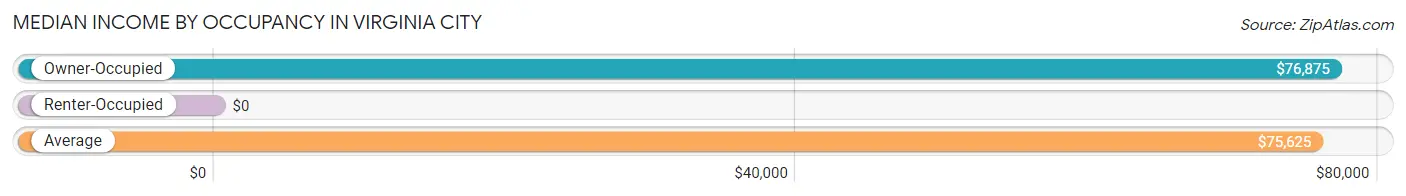
| Occupancy Type | # Households | Median Income |
| Owner-Occupied | 52 (92.9%) | $76,875 |
| Renter-Occupied | 4 (7.1%) | $0 |
| Average | 56 (100.0%) | $75,625 |
Occupancy by Householder Income Bracket in Virginia City
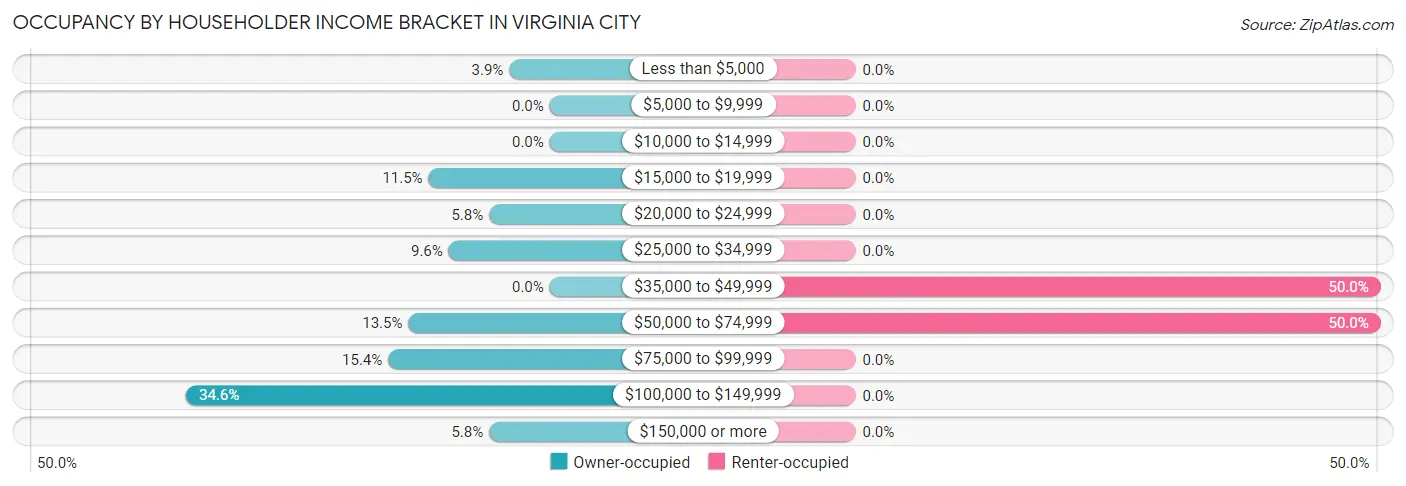
| Income Bracket | Owner-occupied | Renter-occupied |
| Less than $5,000 | 2 (3.8%) | 0 (0.0%) |
| $5,000 to $9,999 | 0 (0.0%) | 0 (0.0%) |
| $10,000 to $14,999 | 0 (0.0%) | 0 (0.0%) |
| $15,000 to $19,999 | 6 (11.5%) | 0 (0.0%) |
| $20,000 to $24,999 | 3 (5.8%) | 0 (0.0%) |
| $25,000 to $34,999 | 5 (9.6%) | 0 (0.0%) |
| $35,000 to $49,999 | 0 (0.0%) | 2 (50.0%) |
| $50,000 to $74,999 | 7 (13.5%) | 2 (50.0%) |
| $75,000 to $99,999 | 8 (15.4%) | 0 (0.0%) |
| $100,000 to $149,999 | 18 (34.6%) | 0 (0.0%) |
| $150,000 or more | 3 (5.8%) | 0 (0.0%) |
| Total | 52 (100.0%) | 4 (100.0%) |
Monthly Housing Cost Tiers in Virginia City
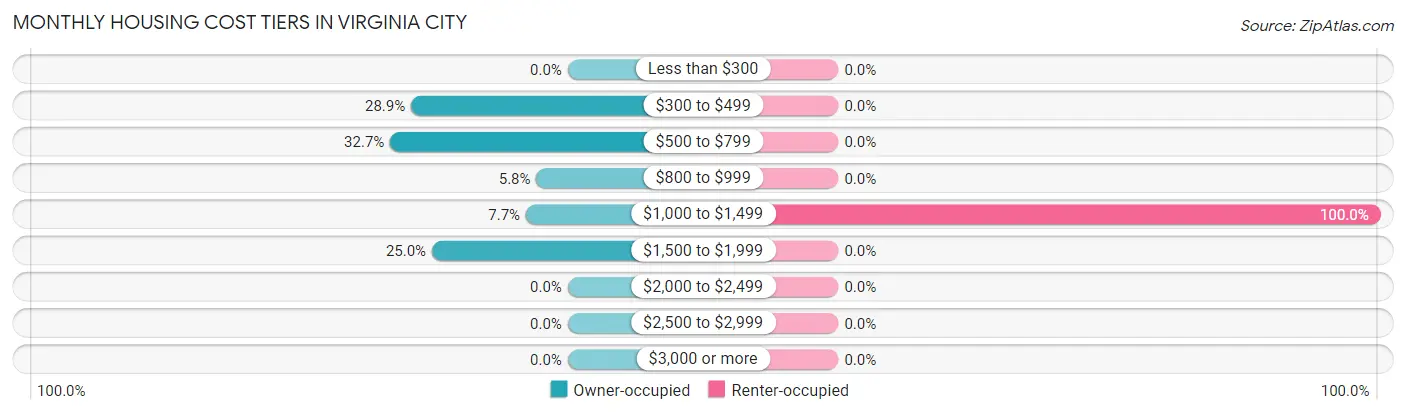
| Monthly Cost | Owner-occupied | Renter-occupied |
| Less than $300 | 0 (0.0%) | 0 (0.0%) |
| $300 to $499 | 15 (28.8%) | 0 (0.0%) |
| $500 to $799 | 17 (32.7%) | 0 (0.0%) |
| $800 to $999 | 3 (5.8%) | 0 (0.0%) |
| $1,000 to $1,499 | 4 (7.7%) | 4 (100.0%) |
| $1,500 to $1,999 | 13 (25.0%) | 0 (0.0%) |
| $2,000 to $2,499 | 0 (0.0%) | 0 (0.0%) |
| $2,500 to $2,999 | 0 (0.0%) | 0 (0.0%) |
| $3,000 or more | 0 (0.0%) | 0 (0.0%) |
| Total | 52 (100.0%) | 4 (100.0%) |
Physical Housing Characteristics in Virginia City
Housing Structures in Virginia City
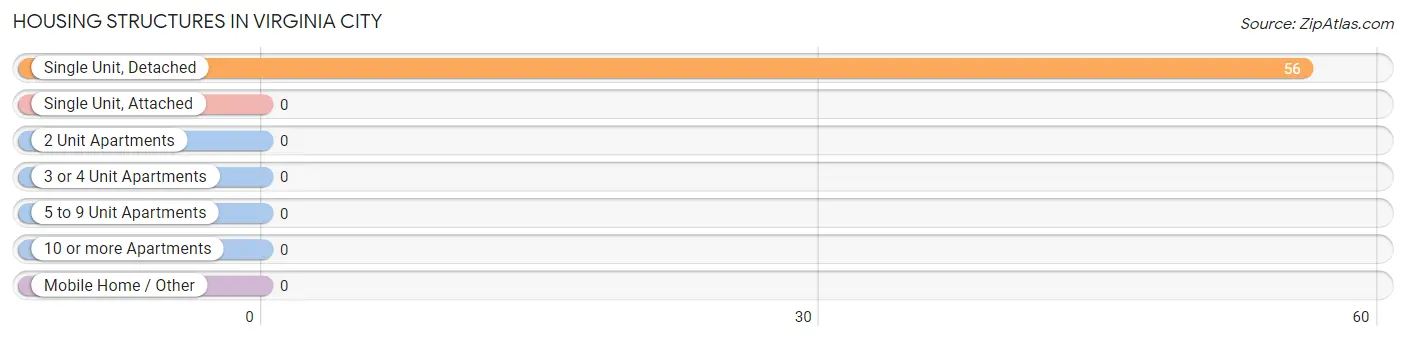
| Structure Type | # Housing Units | % Housing Units |
| Single Unit, Detached | 56 | 100.0% |
| Single Unit, Attached | 0 | 0.0% |
| 2 Unit Apartments | 0 | 0.0% |
| 3 or 4 Unit Apartments | 0 | 0.0% |
| 5 to 9 Unit Apartments | 0 | 0.0% |
| 10 or more Apartments | 0 | 0.0% |
| Mobile Home / Other | 0 | 0.0% |
| Total | 56 | 100.0% |
Housing Structures by Occupancy in Virginia City
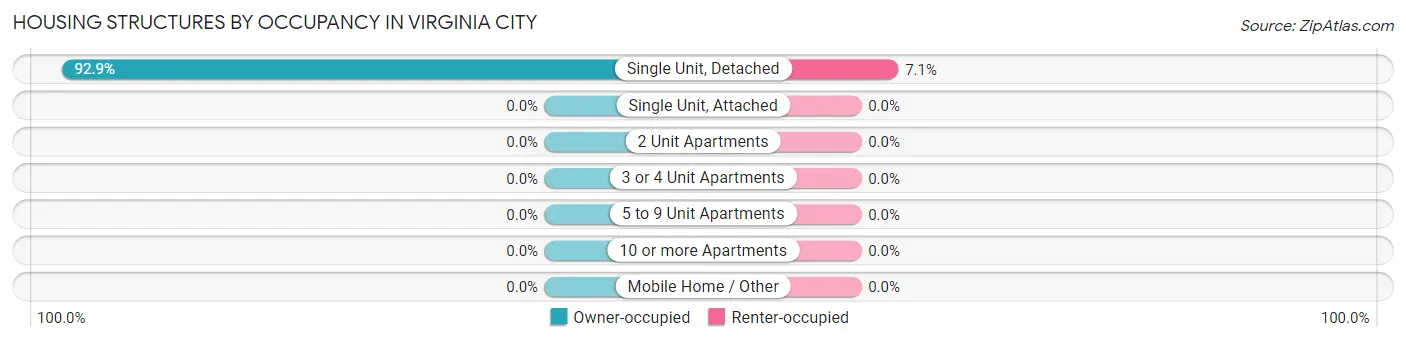
| Structure Type | Owner-occupied | Renter-occupied |
| Single Unit, Detached | 52 (92.9%) | 4 (7.1%) |
| Single Unit, Attached | 0 (0.0%) | 0 (0.0%) |
| 2 Unit Apartments | 0 (0.0%) | 0 (0.0%) |
| 3 or 4 Unit Apartments | 0 (0.0%) | 0 (0.0%) |
| 5 to 9 Unit Apartments | 0 (0.0%) | 0 (0.0%) |
| 10 or more Apartments | 0 (0.0%) | 0 (0.0%) |
| Mobile Home / Other | 0 (0.0%) | 0 (0.0%) |
| Total | 52 (92.9%) | 4 (7.1%) |
Housing Structures by Number of Rooms in Virginia City
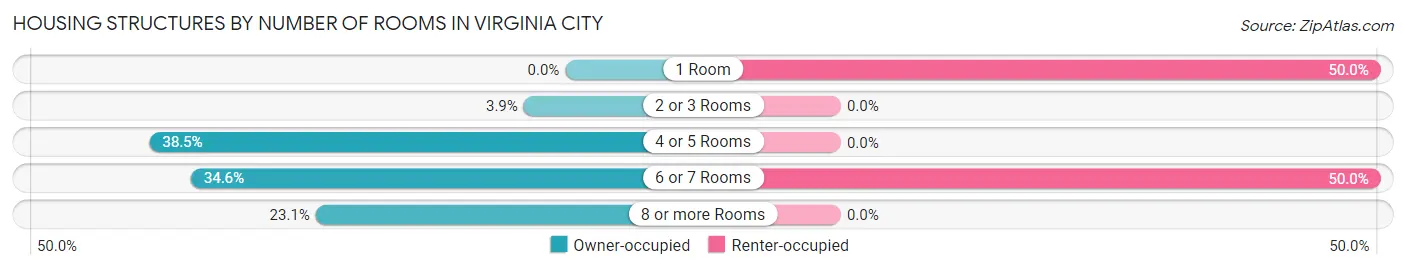
| Number of Rooms | Owner-occupied | Renter-occupied |
| 1 Room | 0 (0.0%) | 2 (50.0%) |
| 2 or 3 Rooms | 2 (3.8%) | 0 (0.0%) |
| 4 or 5 Rooms | 20 (38.5%) | 0 (0.0%) |
| 6 or 7 Rooms | 18 (34.6%) | 2 (50.0%) |
| 8 or more Rooms | 12 (23.1%) | 0 (0.0%) |
| Total | 52 (100.0%) | 4 (100.0%) |
Housing Structure by Heating Type in Virginia City
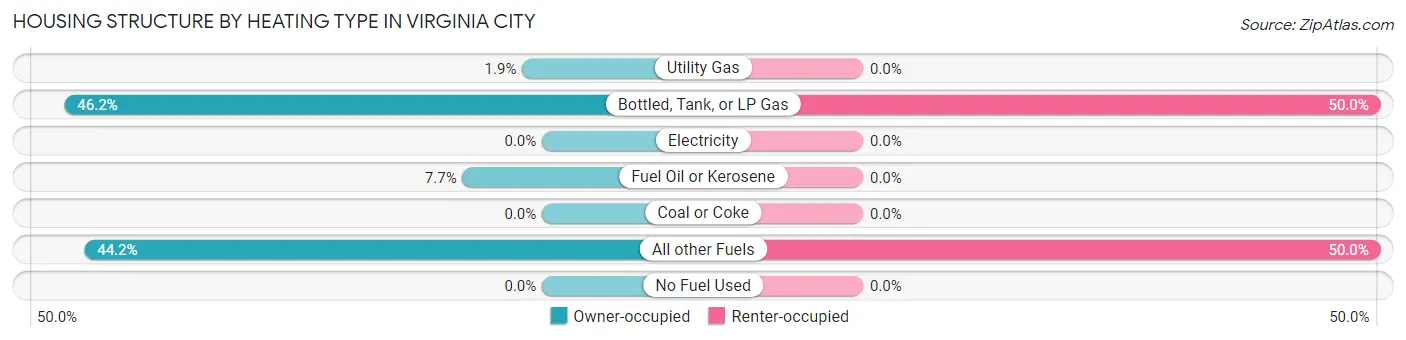
| Heating Type | Owner-occupied | Renter-occupied |
| Utility Gas | 1 (1.9%) | 0 (0.0%) |
| Bottled, Tank, or LP Gas | 24 (46.2%) | 2 (50.0%) |
| Electricity | 0 (0.0%) | 0 (0.0%) |
| Fuel Oil or Kerosene | 4 (7.7%) | 0 (0.0%) |
| Coal or Coke | 0 (0.0%) | 0 (0.0%) |
| All other Fuels | 23 (44.2%) | 2 (50.0%) |
| No Fuel Used | 0 (0.0%) | 0 (0.0%) |
| Total | 52 (100.0%) | 4 (100.0%) |
Household Vehicle Usage in Virginia City
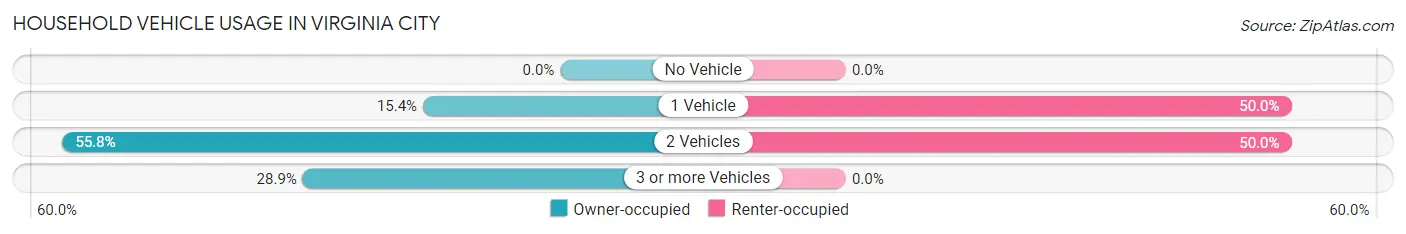
| Vehicles per Household | Owner-occupied | Renter-occupied |
| No Vehicle | 0 (0.0%) | 0 (0.0%) |
| 1 Vehicle | 8 (15.4%) | 2 (50.0%) |
| 2 Vehicles | 29 (55.8%) | 2 (50.0%) |
| 3 or more Vehicles | 15 (28.8%) | 0 (0.0%) |
| Total | 52 (100.0%) | 4 (100.0%) |
Real Estate & Mortgages in Virginia City
Real Estate and Mortgage Overview in Virginia City
| Characteristic | Without Mortgage | With Mortgage |
| Housing Units | 32 | 20 |
| Median Property Value | $277,800 | $283,300 |
| Median Household Income | $53,750 | $0 |
| Monthly Housing Costs | $517 | $0 |
| Real Estate Taxes | $1,200 | $0 |
Property Value by Mortgage Status in Virginia City
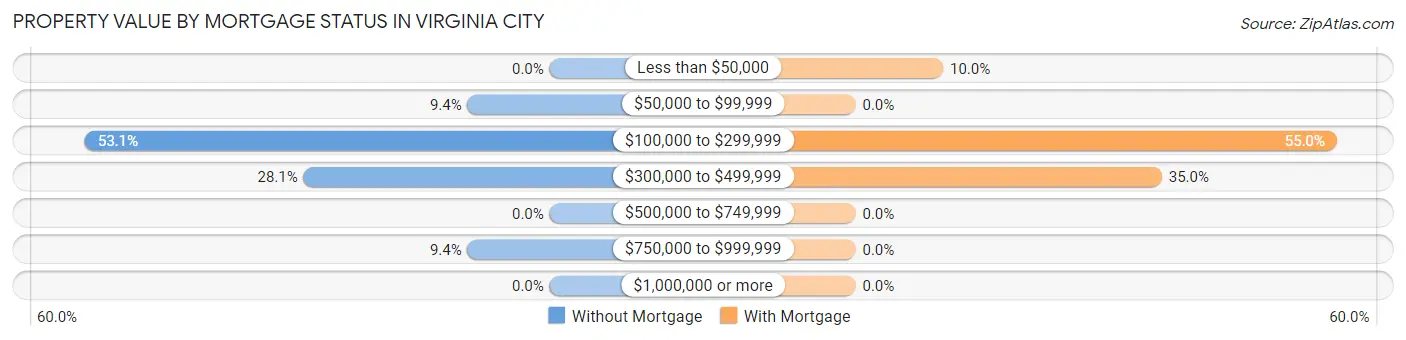
| Property Value | Without Mortgage | With Mortgage |
| Less than $50,000 | 0 (0.0%) | 2 (10.0%) |
| $50,000 to $99,999 | 3 (9.4%) | 0 (0.0%) |
| $100,000 to $299,999 | 17 (53.1%) | 11 (55.0%) |
| $300,000 to $499,999 | 9 (28.1%) | 7 (35.0%) |
| $500,000 to $749,999 | 0 (0.0%) | 0 (0.0%) |
| $750,000 to $999,999 | 3 (9.4%) | 0 (0.0%) |
| $1,000,000 or more | 0 (0.0%) | 0 (0.0%) |
| Total | 32 (100.0%) | 20 (100.0%) |
Household Income by Mortgage Status in Virginia City
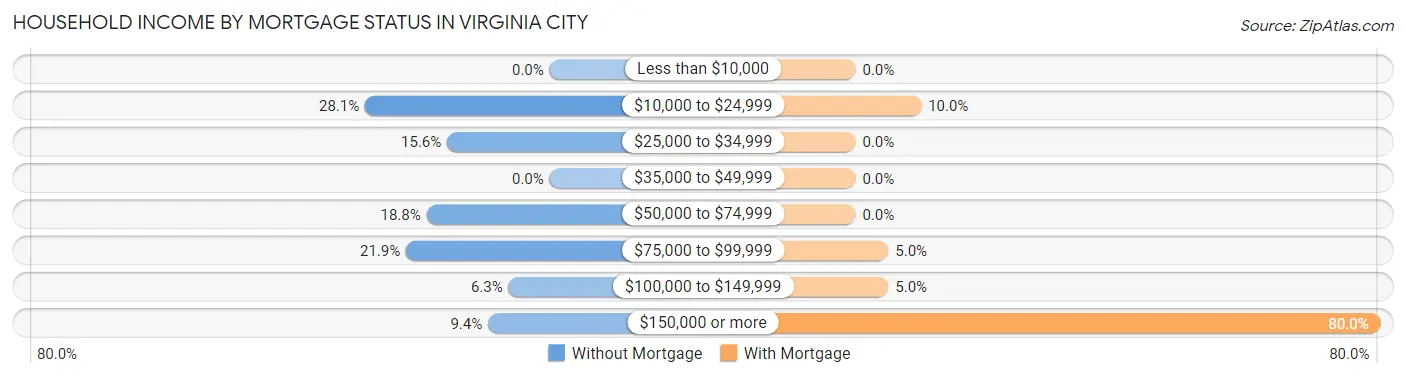
| Household Income | Without Mortgage | With Mortgage |
| Less than $10,000 | 0 (0.0%) | 0 (0.0%) |
| $10,000 to $24,999 | 9 (28.1%) | 2 (10.0%) |
| $25,000 to $34,999 | 5 (15.6%) | 0 (0.0%) |
| $35,000 to $49,999 | 0 (0.0%) | 0 (0.0%) |
| $50,000 to $74,999 | 6 (18.8%) | 0 (0.0%) |
| $75,000 to $99,999 | 7 (21.9%) | 1 (5.0%) |
| $100,000 to $149,999 | 2 (6.2%) | 1 (5.0%) |
| $150,000 or more | 3 (9.4%) | 16 (80.0%) |
| Total | 32 (100.0%) | 20 (100.0%) |
Property Value to Household Income Ratio in Virginia City
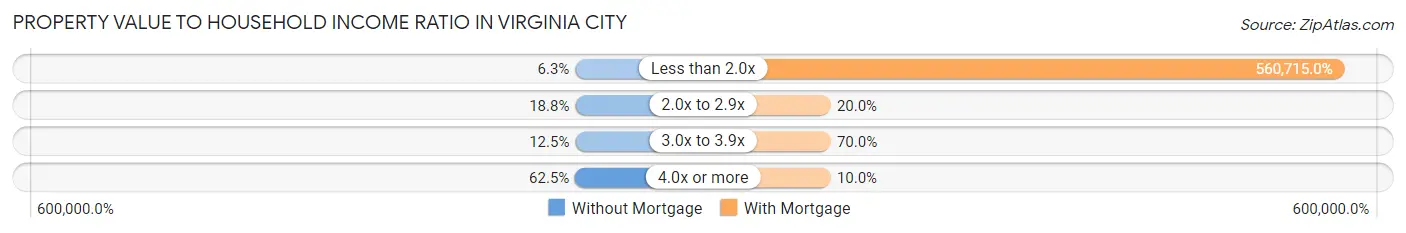
| Value-to-Income Ratio | Without Mortgage | With Mortgage |
| Less than 2.0x | 2 (6.2%) | 112,143 (560,715.0%) |
| 2.0x to 2.9x | 6 (18.8%) | 4 (20.0%) |
| 3.0x to 3.9x | 4 (12.5%) | 14 (70.0%) |
| 4.0x or more | 20 (62.5%) | 2 (10.0%) |
| Total | 32 (100.0%) | 20 (100.0%) |
Real Estate Taxes by Mortgage Status in Virginia City
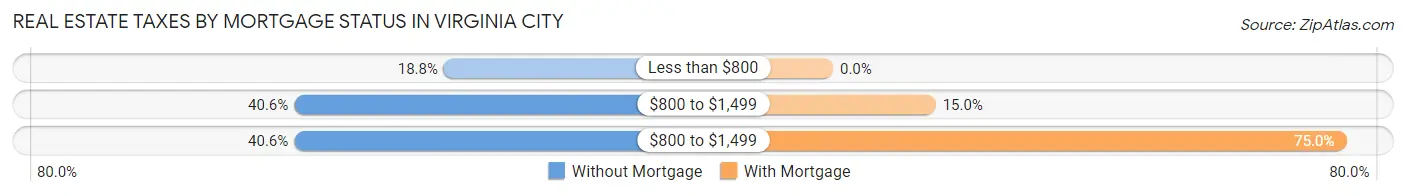
| Property Taxes | Without Mortgage | With Mortgage |
| Less than $800 | 6 (18.8%) | 0 (0.0%) |
| $800 to $1,499 | 13 (40.6%) | 3 (15.0%) |
| $800 to $1,499 | 13 (40.6%) | 15 (75.0%) |
| Total | 32 (100.0%) | 20 (100.0%) |
Health & Disability in Virginia City
Health Insurance Coverage by Age in Virginia City
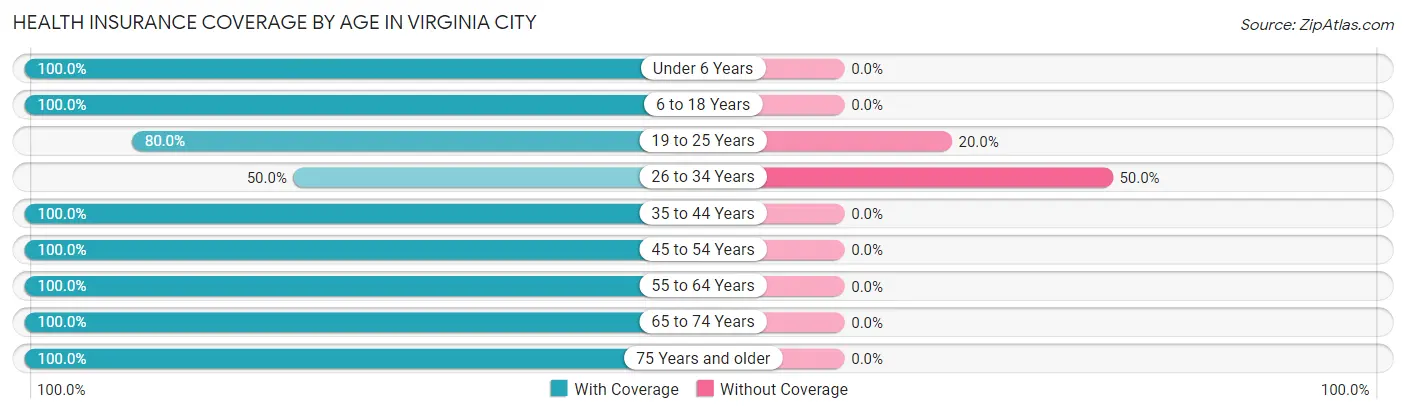
| Age Bracket | With Coverage | Without Coverage |
| Under 6 Years | 2 (100.0%) | 0 (0.0%) |
| 6 to 18 Years | 2 (100.0%) | 0 (0.0%) |
| 19 to 25 Years | 4 (80.0%) | 1 (20.0%) |
| 26 to 34 Years | 2 (50.0%) | 2 (50.0%) |
| 35 to 44 Years | 1 (100.0%) | 0 (0.0%) |
| 45 to 54 Years | 20 (100.0%) | 0 (0.0%) |
| 55 to 64 Years | 19 (100.0%) | 0 (0.0%) |
| 65 to 74 Years | 40 (100.0%) | 0 (0.0%) |
| 75 Years and older | 34 (100.0%) | 0 (0.0%) |
| Total | 124 (97.6%) | 3 (2.4%) |
Health Insurance Coverage by Citizenship Status in Virginia City
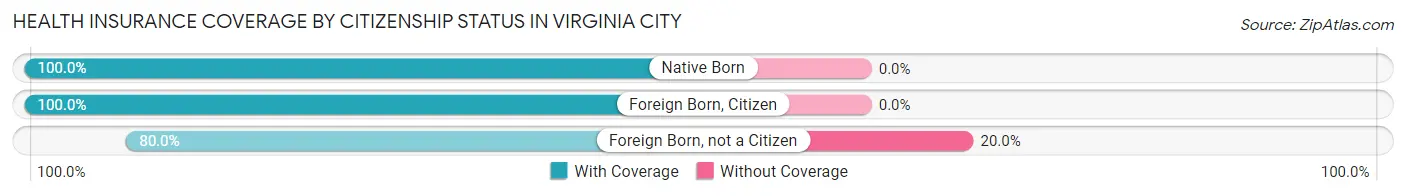
| Citizenship Status | With Coverage | Without Coverage |
| Native Born | 2 (100.0%) | 0 (0.0%) |
| Foreign Born, Citizen | 2 (100.0%) | 0 (0.0%) |
| Foreign Born, not a Citizen | 4 (80.0%) | 1 (20.0%) |
Health Insurance Coverage by Household Income in Virginia City
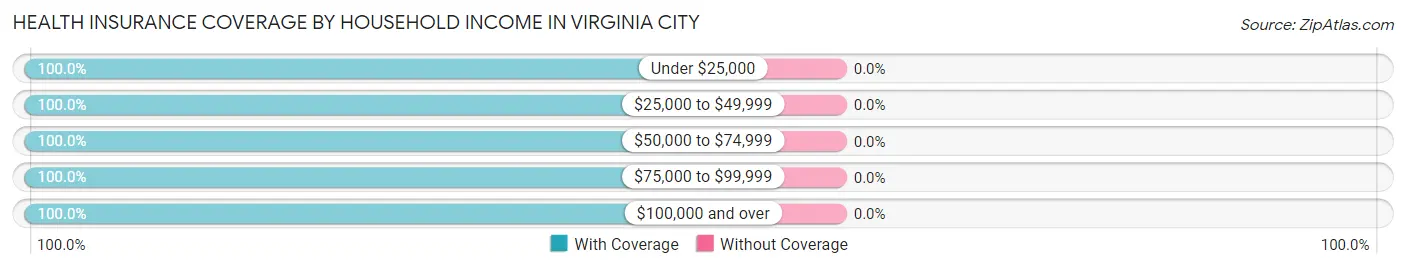
| Household Income | With Coverage | Without Coverage |
| Under $25,000 | 27 (100.0%) | 0 (0.0%) |
| $25,000 to $49,999 | 7 (100.0%) | 0 (0.0%) |
| $50,000 to $74,999 | 17 (100.0%) | 0 (0.0%) |
| $75,000 to $99,999 | 29 (100.0%) | 0 (0.0%) |
| $100,000 and over | 31 (100.0%) | 0 (0.0%) |
Public vs Private Health Insurance Coverage by Age in Virginia City
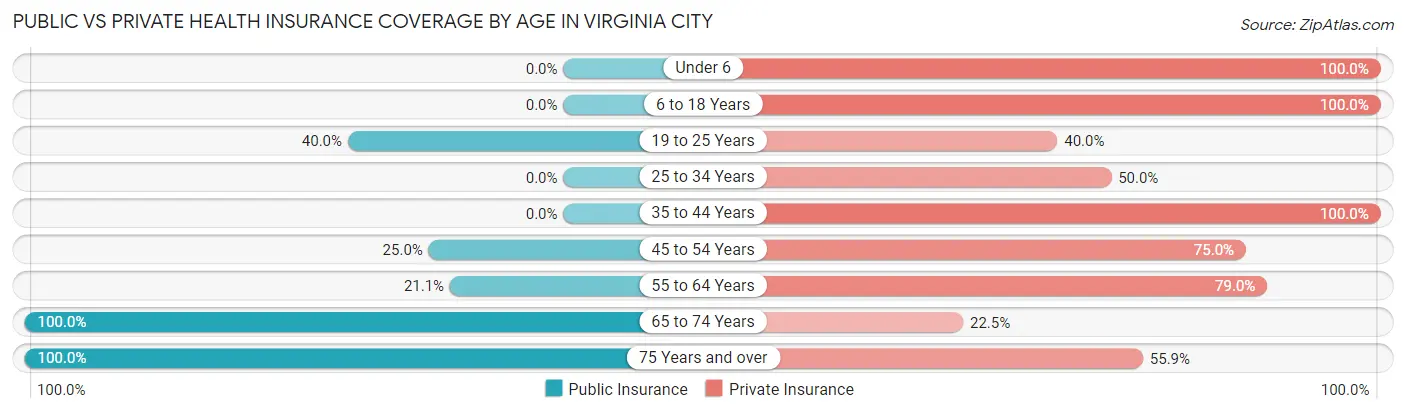
| Age Bracket | Public Insurance | Private Insurance |
| Under 6 | 0 (0.0%) | 2 (100.0%) |
| 6 to 18 Years | 0 (0.0%) | 2 (100.0%) |
| 19 to 25 Years | 2 (40.0%) | 2 (40.0%) |
| 25 to 34 Years | 0 (0.0%) | 2 (50.0%) |
| 35 to 44 Years | 0 (0.0%) | 1 (100.0%) |
| 45 to 54 Years | 5 (25.0%) | 15 (75.0%) |
| 55 to 64 Years | 4 (21.0%) | 15 (78.9%) |
| 65 to 74 Years | 40 (100.0%) | 9 (22.5%) |
| 75 Years and over | 34 (100.0%) | 19 (55.9%) |
| Total | 85 (66.9%) | 67 (52.8%) |
Disability Status by Sex by Age in Virginia City
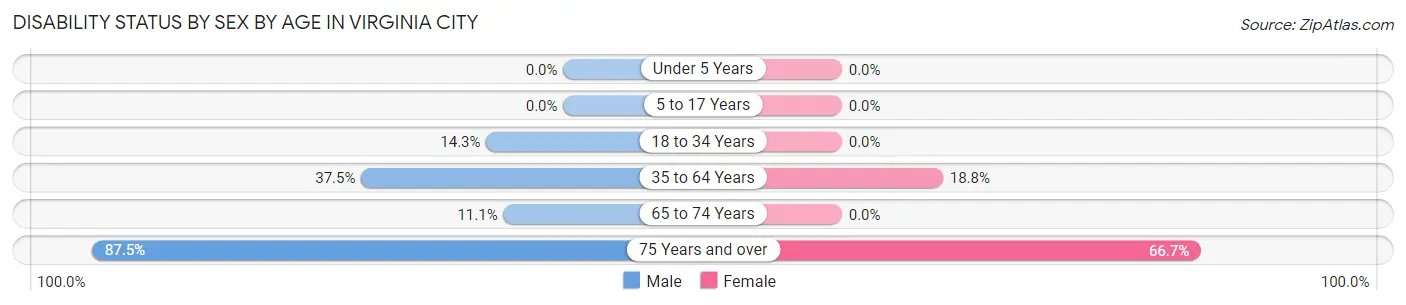
| Age Bracket | Male | Female |
| Under 5 Years | 0 (0.0%) | 0 (0.0%) |
| 5 to 17 Years | 0 (0.0%) | 0 (0.0%) |
| 18 to 34 Years | 1 (14.3%) | 0 (0.0%) |
| 35 to 64 Years | 3 (37.5%) | 6 (18.8%) |
| 65 to 74 Years | 3 (11.1%) | 0 (0.0%) |
| 75 Years and over | 14 (87.5%) | 12 (66.7%) |
Disability Class by Sex by Age in Virginia City
Disability Class: Hearing Difficulty
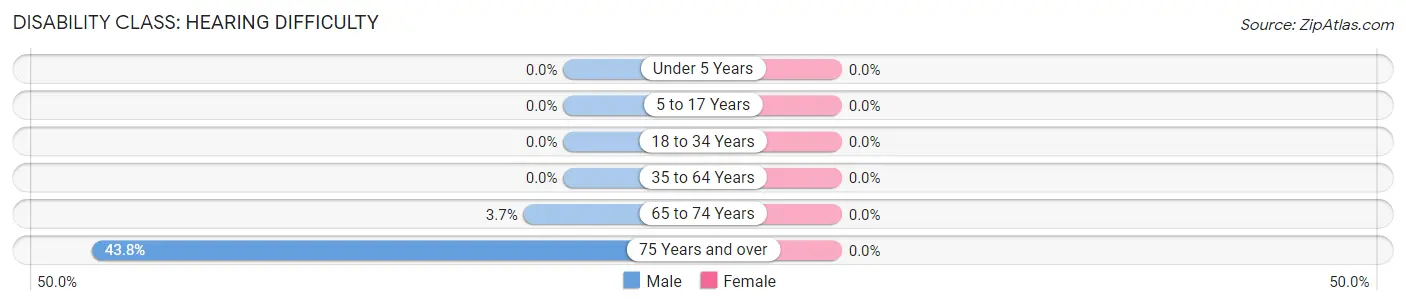
| Age Bracket | Male | Female |
| Under 5 Years | 0 (0.0%) | 0 (0.0%) |
| 5 to 17 Years | 0 (0.0%) | 0 (0.0%) |
| 18 to 34 Years | 0 (0.0%) | 0 (0.0%) |
| 35 to 64 Years | 0 (0.0%) | 0 (0.0%) |
| 65 to 74 Years | 1 (3.7%) | 0 (0.0%) |
| 75 Years and over | 7 (43.8%) | 0 (0.0%) |
Disability Class: Vision Difficulty
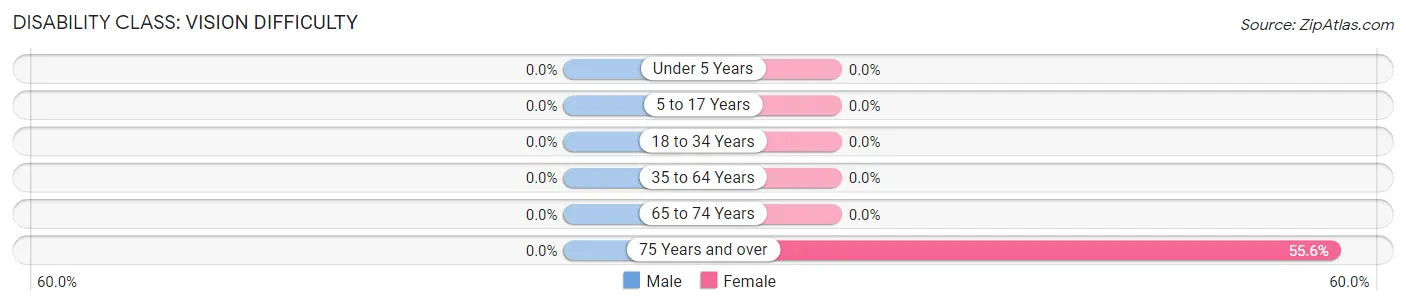
| Age Bracket | Male | Female |
| Under 5 Years | 0 (0.0%) | 0 (0.0%) |
| 5 to 17 Years | 0 (0.0%) | 0 (0.0%) |
| 18 to 34 Years | 0 (0.0%) | 0 (0.0%) |
| 35 to 64 Years | 0 (0.0%) | 0 (0.0%) |
| 65 to 74 Years | 0 (0.0%) | 0 (0.0%) |
| 75 Years and over | 0 (0.0%) | 10 (55.6%) |
Disability Class: Cognitive Difficulty
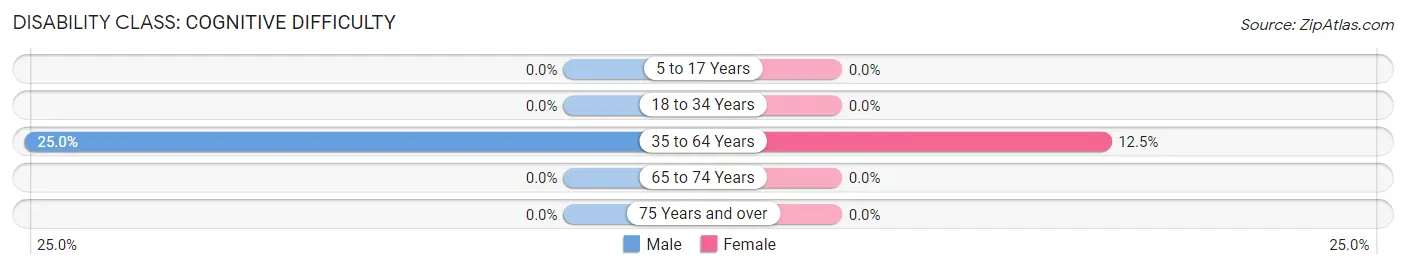
| Age Bracket | Male | Female |
| 5 to 17 Years | 0 (0.0%) | 0 (0.0%) |
| 18 to 34 Years | 0 (0.0%) | 0 (0.0%) |
| 35 to 64 Years | 2 (25.0%) | 4 (12.5%) |
| 65 to 74 Years | 0 (0.0%) | 0 (0.0%) |
| 75 Years and over | 0 (0.0%) | 0 (0.0%) |
Disability Class: Ambulatory Difficulty
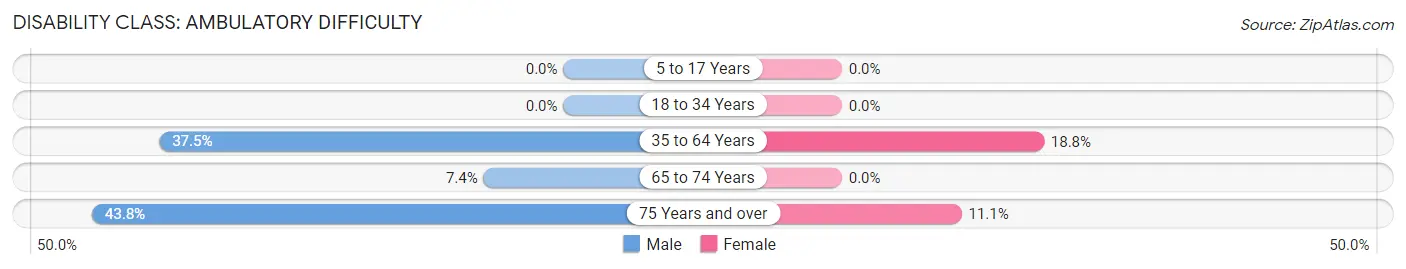
| Age Bracket | Male | Female |
| 5 to 17 Years | 0 (0.0%) | 0 (0.0%) |
| 18 to 34 Years | 0 (0.0%) | 0 (0.0%) |
| 35 to 64 Years | 3 (37.5%) | 6 (18.8%) |
| 65 to 74 Years | 2 (7.4%) | 0 (0.0%) |
| 75 Years and over | 7 (43.8%) | 2 (11.1%) |
Disability Class: Self-Care Difficulty
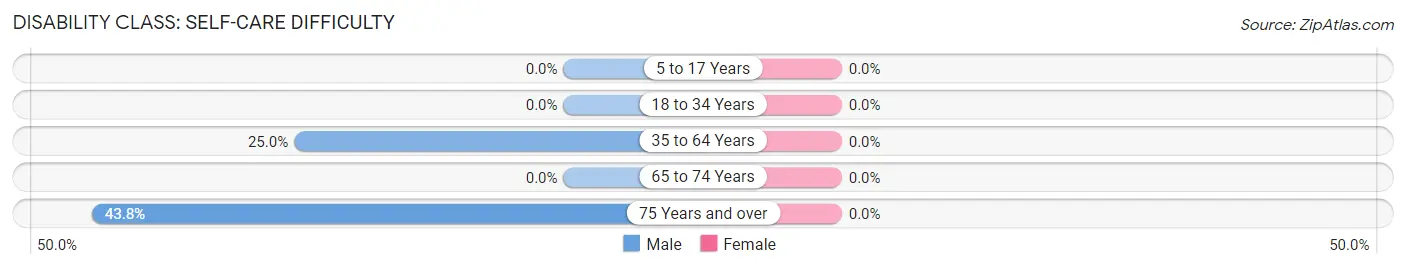
| Age Bracket | Male | Female |
| 5 to 17 Years | 0 (0.0%) | 0 (0.0%) |
| 18 to 34 Years | 0 (0.0%) | 0 (0.0%) |
| 35 to 64 Years | 2 (25.0%) | 0 (0.0%) |
| 65 to 74 Years | 0 (0.0%) | 0 (0.0%) |
| 75 Years and over | 7 (43.8%) | 0 (0.0%) |
Technology Access in Virginia City
Computing Device Access in Virginia City
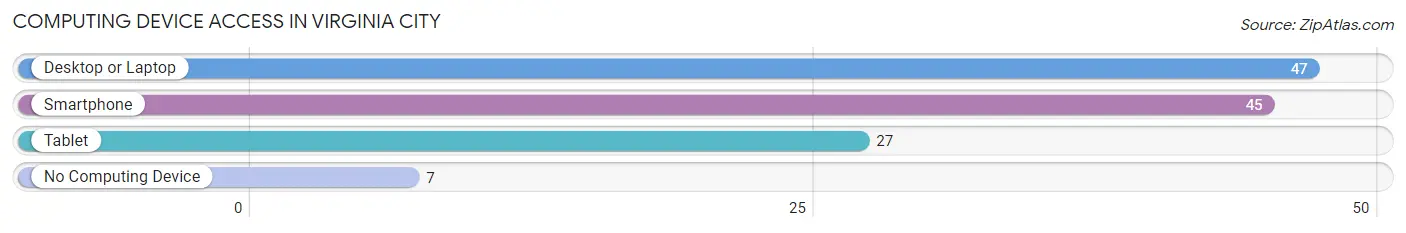
| Device Type | # Households | % Households |
| Desktop or Laptop | 47 | 83.9% |
| Smartphone | 45 | 80.4% |
| Tablet | 27 | 48.2% |
| No Computing Device | 7 | 12.5% |
| Total | 56 | 100.0% |
Internet Access in Virginia City
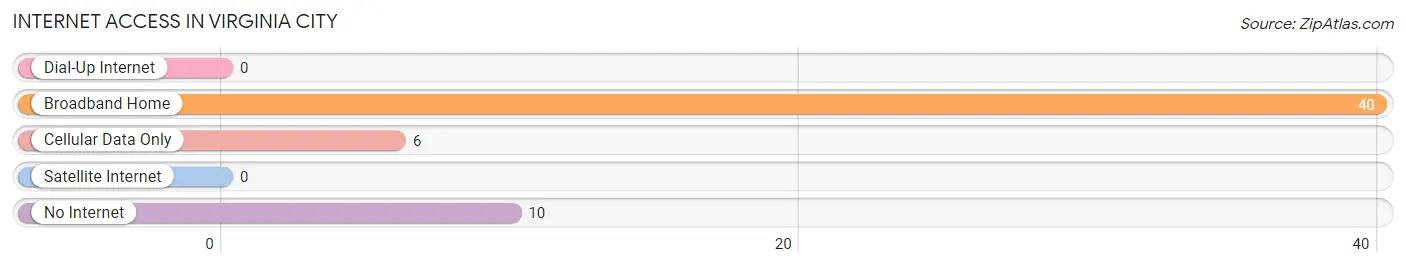
| Internet Type | # Households | % Households |
| Dial-Up Internet | 0 | 0.0% |
| Broadband Home | 40 | 71.4% |
| Cellular Data Only | 6 | 10.7% |
| Satellite Internet | 0 | 0.0% |
| No Internet | 10 | 17.9% |
| Total | 56 | 100.0% |
Virginia City Summary
History
The history of Virginia City, Montana dates back to the mid-1800s when gold was discovered in the area. The discovery of gold in the area led to a gold rush and the establishment of the town of Virginia City in 1863. The town was named after the Virginia City Mining District, which was established in 1862. The town quickly grew to become the largest city in Montana and the third largest in the United States.
The town was home to many of the most famous figures of the American West, including Calamity Jane, Wild Bill Hickok, and Buffalo Bill Cody. The town was also the site of the first Montana Territorial Legislature in 1864.
The town was a major hub for the mining industry in the late 1800s and early 1900s. The town was also home to many saloons, gambling halls, and brothels. The town was also the site of the first Montana Territorial Prison in 1871.
The town experienced a decline in the early 1900s due to the decline of the mining industry. The town was also affected by the Great Depression and World War II. The town experienced a resurgence in the 1950s and 1960s due to the popularity of the television show "Bonanza" which was filmed in the area.
The town is now a popular tourist destination and is home to many historic buildings and sites. The town is also home to the Montana Territorial Prison Museum and the Virginia City National Historic Landmark.
Geography
Virginia City is located in southwestern Montana in Madison County. The town is situated in the Madison Valley, which is surrounded by the Tobacco Root Mountains to the east and the Gravelly Range to the west. The town is located at an elevation of 5,000 feet and is approximately 30 miles south of the city of Bozeman.
The town is located along the Madison River and is surrounded by rolling hills and grasslands. The area is known for its scenic beauty and is a popular destination for outdoor activities such as fishing, hunting, and camping.
Economy
The economy of Virginia City is largely based on tourism. The town is home to many historic sites and buildings, which attract visitors from all over the world. The town is also home to many restaurants, shops, and galleries.
The town is also home to several small businesses, including a brewery, a distillery, and a winery. The town is also home to several ranches and farms, which produce beef, lamb, and hay.
Demographics
As of the 2010 census, the population of Virginia City was 876. The population is predominantly white (94.3%) and the median age is 44. The median household income is $41,250 and the median home value is $212,500.
The town is home to many historic buildings and sites, which attract visitors from all over the world. The town is also home to many restaurants, shops, and galleries. The town is also home to several small businesses, including a brewery, a distillery, and a winery.
Common Questions
What is Per Capita Income in Virginia City?
Per Capita income in Virginia City is $61,161.
What is the Median Family Income in Virginia City?
Median Family Income in Virginia City is $76,250.
What is the Median Household income in Virginia City?
Median Household Income in Virginia City is $75,625.
What is Inequality or Gini Index in Virginia City?
Inequality or Gini Index in Virginia City is 0.39.
What is the Total Population of Virginia City?
Total Population of Virginia City is 127.
What is the Total Male Population of Virginia City?
Total Male Population of Virginia City is 60.
What is the Total Female Population of Virginia City?
Total Female Population of Virginia City is 67.
What is the Ratio of Males per 100 Females in Virginia City?
There are 89.55 Males per 100 Females in Virginia City.
What is the Ratio of Females per 100 Males in Virginia City?
There are 111.67 Females per 100 Males in Virginia City.
What is the Median Population Age in Virginia City?
Median Population Age in Virginia City is 67.5 Years.
What is the Average Family Size in Virginia City
Average Family Size in Virginia City is 2.5 People.
What is the Average Household Size in Virginia City
Average Household Size in Virginia City is 2.0 People.
How Large is the Labor Force in Virginia City?
There are 61 People in the Labor Forcein in Virginia City.
What is the Percentage of People in the Labor Force in Virginia City?
49.6% of People are in the Labor Force in Virginia City.