Marysville, MT Map & Demographics
Marysville Map
Marysville Overview
$33,132
PER CAPITA INCOME
$103,750
AVG FAMILY INCOME
$60,227
AVG HOUSEHOLD INCOME
0.39
INEQUALITY / GINI INDEX
60
TOTAL POPULATION
37
MALE POPULATION
23
FEMALE POPULATION
160.87
MALES / 100 FEMALES
62.16
FEMALES / 100 MALES
61.9
MEDIAN AGE
2.5
AVG FAMILY SIZE
1.9
AVG HOUSEHOLD SIZE
37
LABOR FORCE [ PEOPLE ]
61.7%
PERCENT IN LABOR FORCE
Marysville Zip Codes
Marysville Area Codes
Income in Marysville
Income Overview in Marysville
Per Capita Income in Marysville is $33,132, while median incomes of families and households are $103,750 and $60,227 respectively.
| Characteristic | Number | Measure |
| Per Capita Income | 60 | $33,132 |
| Median Family Income | 10 | $103,750 |
| Mean Family Income | 10 | $107,650 |
| Median Household Income | 32 | $60,227 |
| Mean Household Income | 32 | $58,353 |
| Income Deficit | 10 | $0 |
| Wage / Income Gap (%) | 60 | 0.00% |
| Wage / Income Gap ($) | 60 | 100.00¢ per $1 |
| Gini / Inequality Index | 60 | 0.39 |
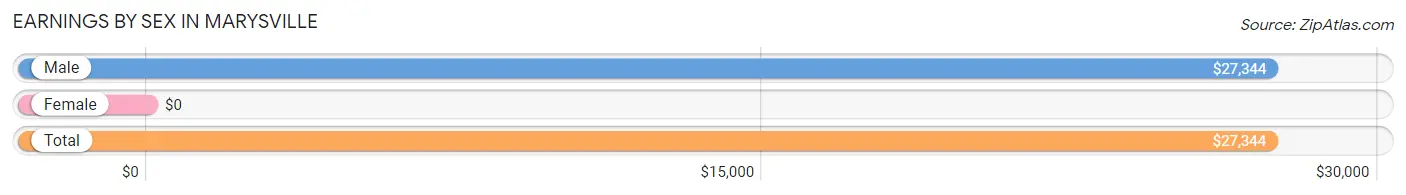
Earnings by Sex in Marysville
| Sex | Number | Average Earnings |
| Male | 23 (62.2%) | $27,344 |
| Female | 14 (37.8%) | $0 |
| Total | 37 (100.0%) | $27,344 |
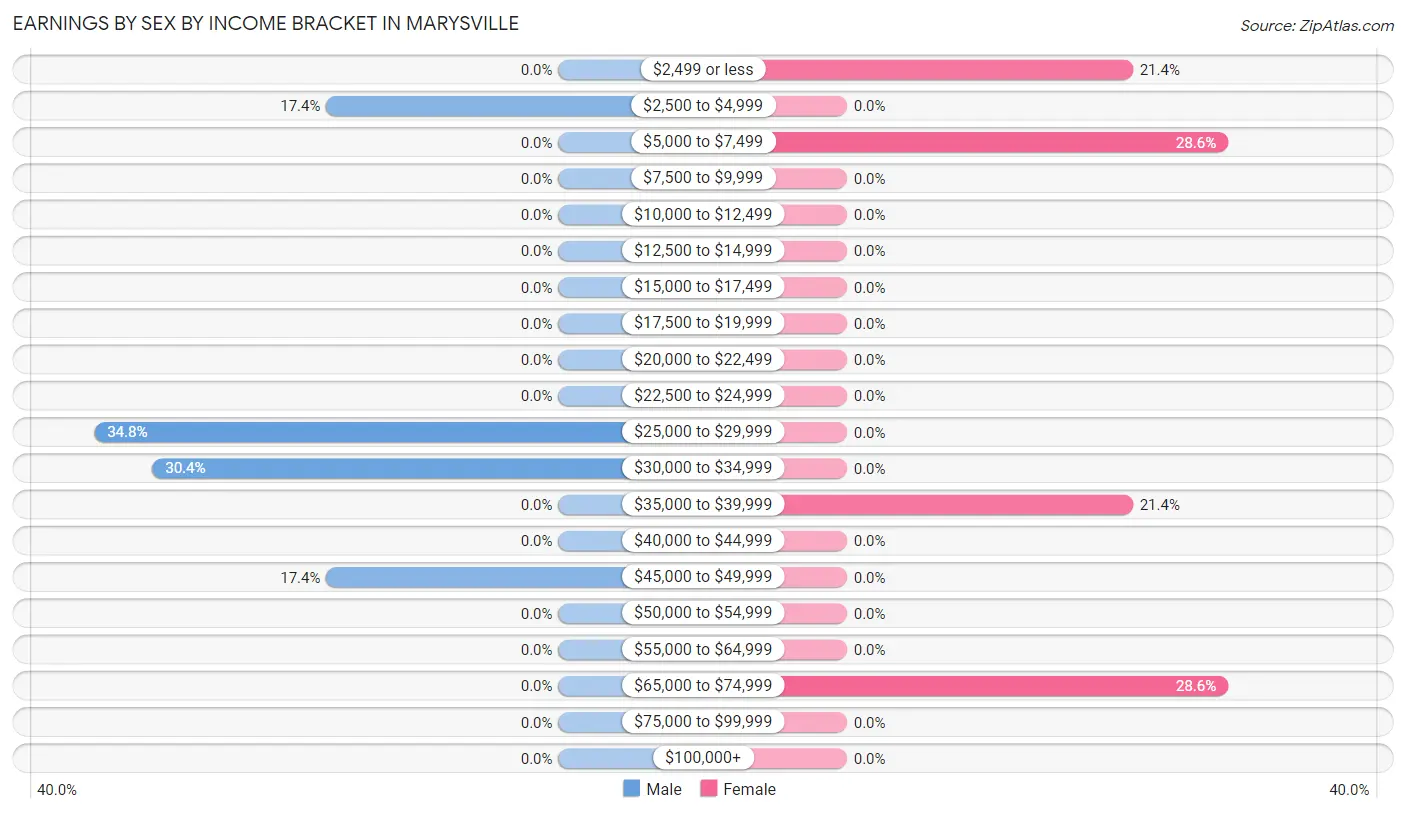
Earnings by Sex by Income Bracket in Marysville
The most common earnings brackets in Marysville are $25,000 to $29,999 for men (8 | 34.8%) and $5,000 to $7,499 for women (4 | 28.6%).
| Income | Male | Female |
| $2,499 or less | 0 (0.0%) | 3 (21.4%) |
| $2,500 to $4,999 | 4 (17.4%) | 0 (0.0%) |
| $5,000 to $7,499 | 0 (0.0%) | 4 (28.6%) |
| $7,500 to $9,999 | 0 (0.0%) | 0 (0.0%) |
| $10,000 to $12,499 | 0 (0.0%) | 0 (0.0%) |
| $12,500 to $14,999 | 0 (0.0%) | 0 (0.0%) |
| $15,000 to $17,499 | 0 (0.0%) | 0 (0.0%) |
| $17,500 to $19,999 | 0 (0.0%) | 0 (0.0%) |
| $20,000 to $22,499 | 0 (0.0%) | 0 (0.0%) |
| $22,500 to $24,999 | 0 (0.0%) | 0 (0.0%) |
| $25,000 to $29,999 | 8 (34.8%) | 0 (0.0%) |
| $30,000 to $34,999 | 7 (30.4%) | 0 (0.0%) |
| $35,000 to $39,999 | 0 (0.0%) | 3 (21.4%) |
| $40,000 to $44,999 | 0 (0.0%) | 0 (0.0%) |
| $45,000 to $49,999 | 4 (17.4%) | 0 (0.0%) |
| $50,000 to $54,999 | 0 (0.0%) | 0 (0.0%) |
| $55,000 to $64,999 | 0 (0.0%) | 0 (0.0%) |
| $65,000 to $74,999 | 0 (0.0%) | 4 (28.6%) |
| $75,000 to $99,999 | 0 (0.0%) | 0 (0.0%) |
| $100,000+ | 0 (0.0%) | 0 (0.0%) |
| Total | 23 (100.0%) | 14 (100.0%) |
Earnings by Sex by Educational Attainment in Marysville
| Educational Attainment | Male Income | Female Income |
| Less than High School | - | - |
| High School Diploma | - | - |
| College or Associate's Degree | - | - |
| Bachelor's Degree | - | - |
| Graduate Degree | - | - |
| Total | $33,036 | $0 |
Family Income in Marysville
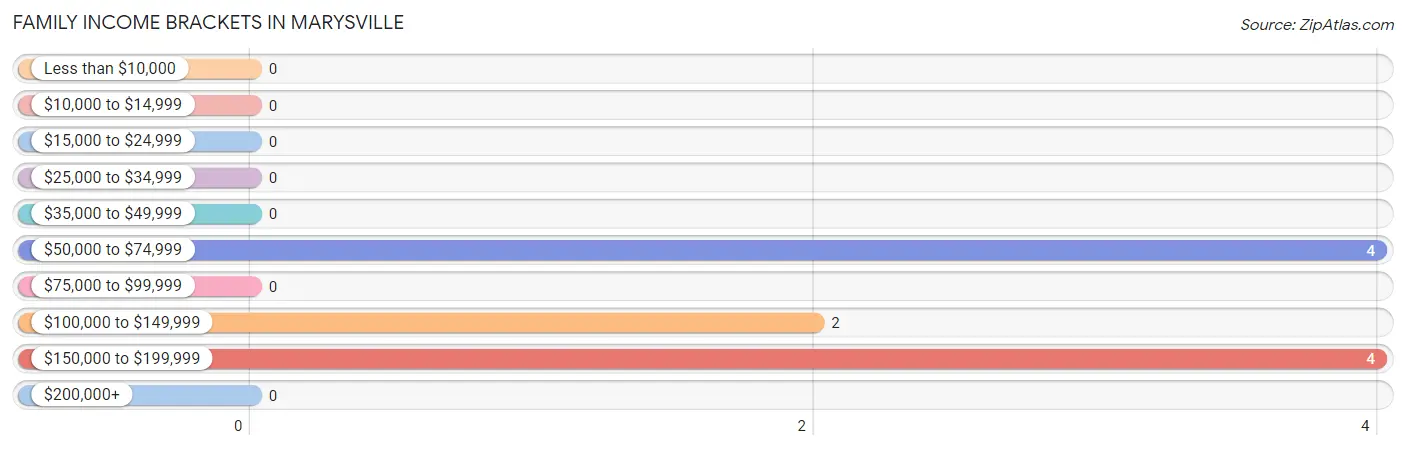
Family Income Brackets in Marysville
According to the Marysville family income data, there are 4 families falling into the $50,000 to $74,999 income range, which is the most common income bracket and makes up 40.0% of all families.
| Income Bracket | # Families | % Families |
| Less than $10,000 | 0 | 0.0% |
| $10,000 to $14,999 | 0 | 0.0% |
| $15,000 to $24,999 | 0 | 0.0% |
| $25,000 to $34,999 | 0 | 0.0% |
| $35,000 to $49,999 | 0 | 0.0% |
| $50,000 to $74,999 | 4 | 40.0% |
| $75,000 to $99,999 | 0 | 0.0% |
| $100,000 to $149,999 | 2 | 20.0% |
| $150,000 to $199,999 | 4 | 40.0% |
| $200,000+ | 0 | 0.0% |
Family Income by Famaliy Size in Marysville
| Income Bracket | # Families | Median Income |
| 2-Person Families | 6 (60.0%) | $0 |
| 3-Person Families | 4 (40.0%) | $0 |
| 4-Person Families | 0 (0.0%) | $0 |
| 5-Person Families | 0 (0.0%) | $0 |
| 6-Person Families | 0 (0.0%) | $0 |
| 7+ Person Families | 0 (0.0%) | $0 |
| Total | 10 (100.0%) | $103,750 |
Family Income by Number of Earners in Marysville
| Number of Earners | # Families | Median Income |
| No Earners | 0 (0.0%) | $0 |
| 1 Earner | 6 (60.0%) | $0 |
| 2 Earners | 0 (0.0%) | $0 |
| 3+ Earners | 4 (40.0%) | $0 |
| Total | 10 (100.0%) | $103,750 |
Household Income in Marysville
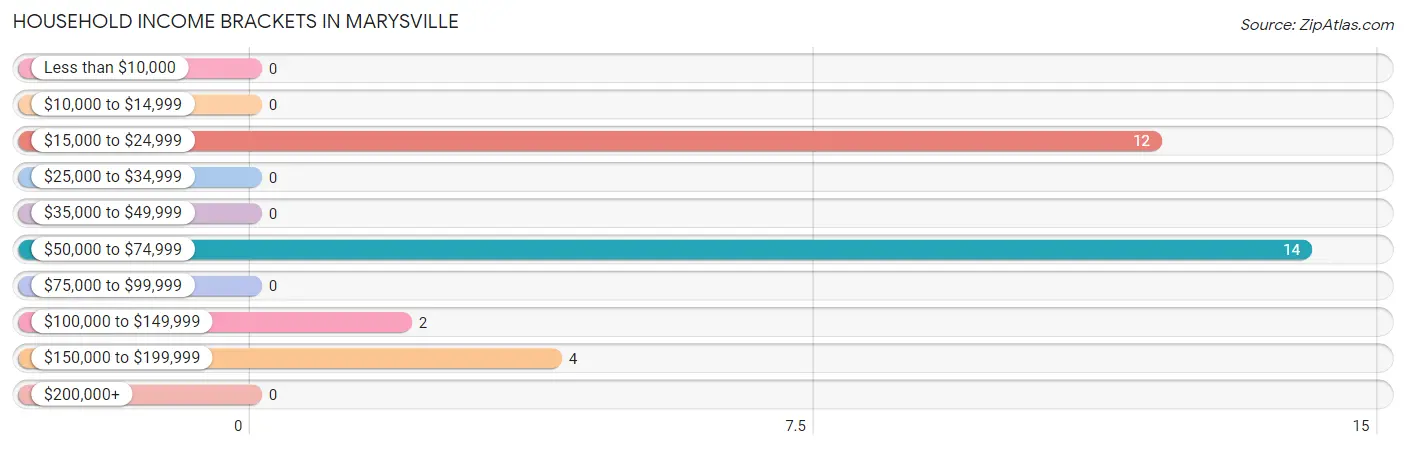
Household Income Brackets in Marysville
With 14 households falling in the category, the $50,000 to $74,999 income range is the most frequent in Marysville, accounting for 43.8% of all households.
| Income Bracket | # Households | % Households |
| Less than $10,000 | 0 | 0.0% |
| $10,000 to $14,999 | 0 | 0.0% |
| $15,000 to $24,999 | 12 | 37.5% |
| $25,000 to $34,999 | 0 | 0.0% |
| $35,000 to $49,999 | 0 | 0.0% |
| $50,000 to $74,999 | 14 | 43.8% |
| $75,000 to $99,999 | 0 | 0.0% |
| $100,000 to $149,999 | 2 | 6.3% |
| $150,000 to $199,999 | 4 | 12.5% |
| $200,000+ | 0 | 0.0% |
Household Income by Householder Age in Marysville
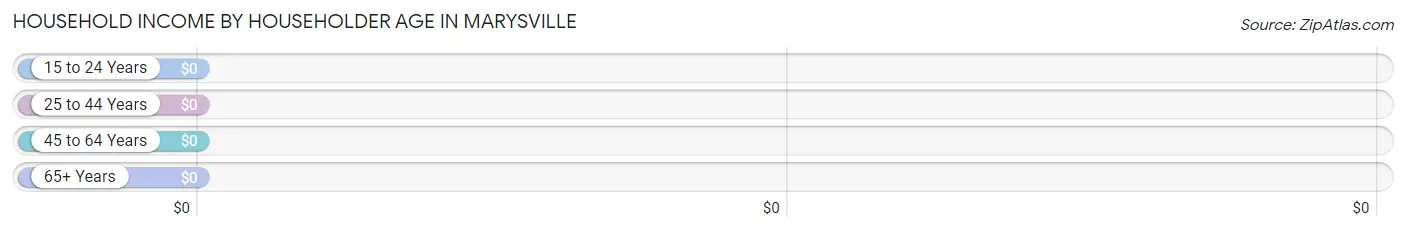
| Income Bracket | # Households | Median Income |
| 15 to 24 Years | 0 (0.0%) | $0 |
| 25 to 44 Years | 0 (0.0%) | $0 |
| 45 to 64 Years | 11 (34.4%) | $0 |
| 65+ Years | 21 (65.6%) | $0 |
| Total | 32 (100.0%) | $60,227 |
Poverty in Marysville
Income Below Poverty by Sex and Age in Marysville
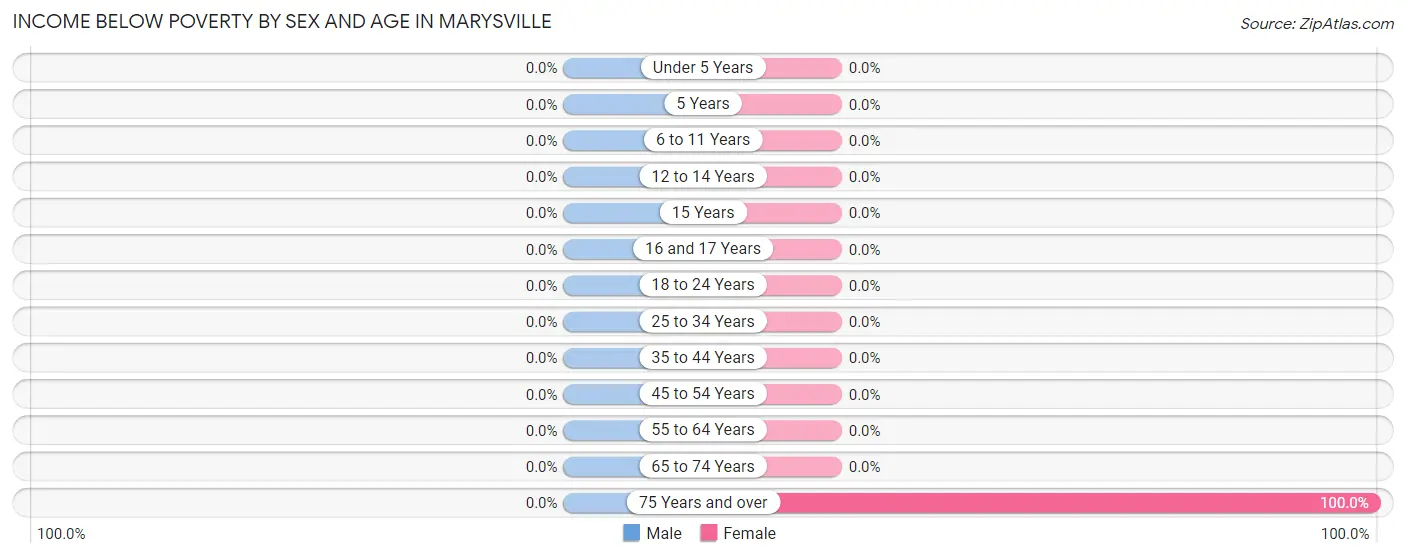
| Age Bracket | Male | Female |
| Under 5 Years | 0 (0.0%) | 0 (0.0%) |
| 5 Years | 0 (0.0%) | 0 (0.0%) |
| 6 to 11 Years | 0 (0.0%) | 0 (0.0%) |
| 12 to 14 Years | 0 (0.0%) | 0 (0.0%) |
| 15 Years | 0 (0.0%) | 0 (0.0%) |
| 16 and 17 Years | 0 (0.0%) | 0 (0.0%) |
| 18 to 24 Years | 0 (0.0%) | 0 (0.0%) |
| 25 to 34 Years | 0 (0.0%) | 0 (0.0%) |
| 35 to 44 Years | 0 (0.0%) | 0 (0.0%) |
| 45 to 54 Years | 0 (0.0%) | 0 (0.0%) |
| 55 to 64 Years | 0 (0.0%) | 0 (0.0%) |
| 65 to 74 Years | 0 (0.0%) | 0 (0.0%) |
| 75 Years and over | 0 (0.0%) | 4 (100.0%) |
| Total | 0 (0.0%) | 4 (17.4%) |
Income Above Poverty by Sex and Age in Marysville
According to the poverty statistics in Marysville, males aged 18 to 24 years and females aged 55 to 64 years are the age groups that are most secure financially, with 100.0% of males and 100.0% of females in these age groups living above the poverty line.
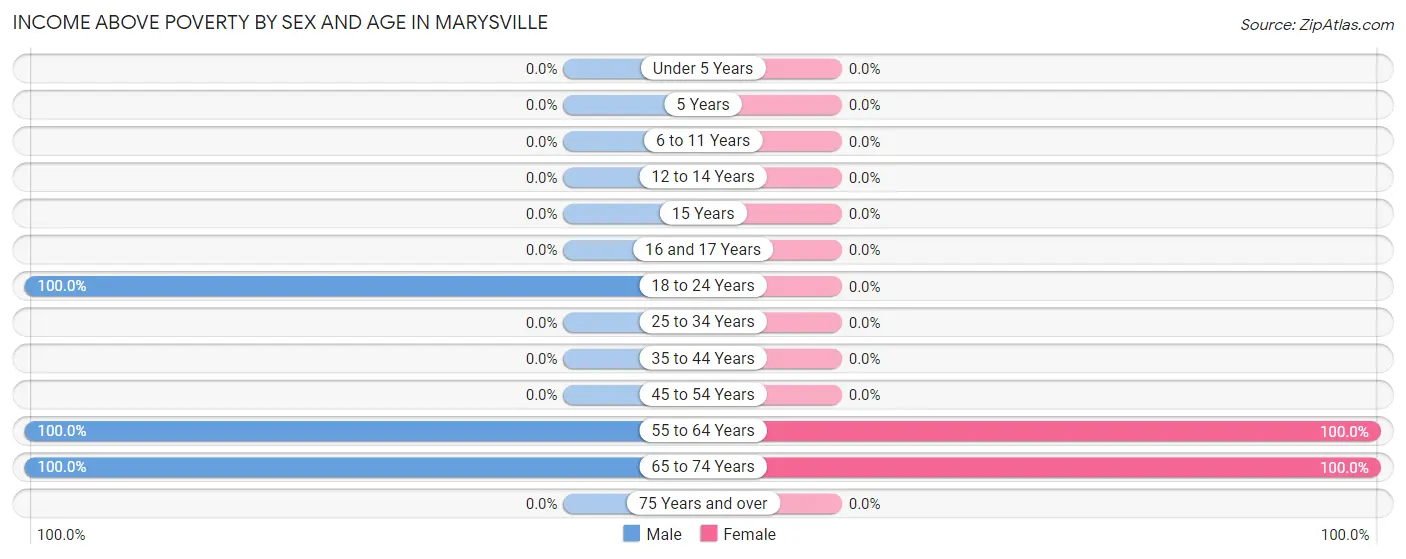
| Age Bracket | Male | Female |
| Under 5 Years | 0 (0.0%) | 0 (0.0%) |
| 5 Years | 0 (0.0%) | 0 (0.0%) |
| 6 to 11 Years | 0 (0.0%) | 0 (0.0%) |
| 12 to 14 Years | 0 (0.0%) | 0 (0.0%) |
| 15 Years | 0 (0.0%) | 0 (0.0%) |
| 16 and 17 Years | 0 (0.0%) | 0 (0.0%) |
| 18 to 24 Years | 4 (100.0%) | 0 (0.0%) |
| 25 to 34 Years | 0 (0.0%) | 0 (0.0%) |
| 35 to 44 Years | 0 (0.0%) | 0 (0.0%) |
| 45 to 54 Years | 0 (0.0%) | 0 (0.0%) |
| 55 to 64 Years | 19 (100.0%) | 8 (100.0%) |
| 65 to 74 Years | 14 (100.0%) | 11 (100.0%) |
| 75 Years and over | 0 (0.0%) | 0 (0.0%) |
| Total | 37 (100.0%) | 19 (82.6%) |
Income Below Poverty Among Married-Couple Families in Marysville
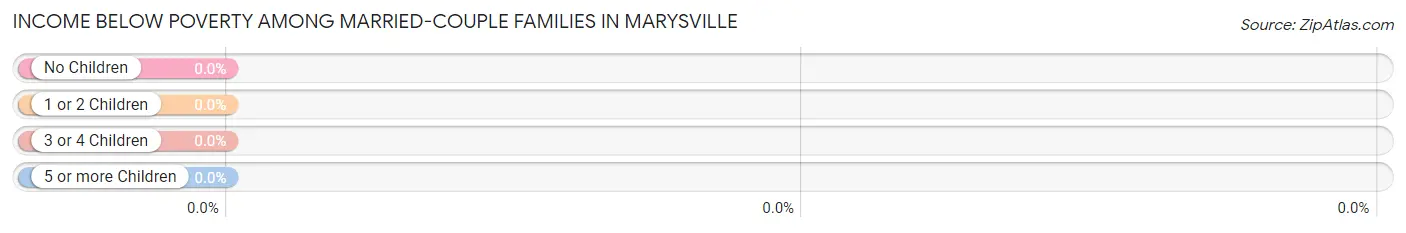
| Children | Above Poverty | Below Poverty |
| No Children | 10 (100.0%) | 0 (0.0%) |
| 1 or 2 Children | 0 (0.0%) | 0 (0.0%) |
| 3 or 4 Children | 0 (0.0%) | 0 (0.0%) |
| 5 or more Children | 0 (0.0%) | 0 (0.0%) |
| Total | 10 (100.0%) | 0 (0.0%) |
Income Below Poverty Among Single-Parent Households in Marysville
| Children | Single Father | Single Mother |
| No Children | 0 (0.0%) | 0 (0.0%) |
| 1 or 2 Children | 0 (0.0%) | 0 (0.0%) |
| 3 or 4 Children | 0 (0.0%) | 0 (0.0%) |
| 5 or more Children | 0 (0.0%) | 0 (0.0%) |
| Total | 0 (0.0%) | 0 (0.0%) |
Income Below Poverty Among Married-Couple vs Single-Parent Households in Marysville
| Children | Married-Couple Families | Single-Parent Households |
| No Children | 0 (0.0%) | 0 (0.0%) |
| 1 or 2 Children | 0 (0.0%) | 0 (0.0%) |
| 3 or 4 Children | 0 (0.0%) | 0 (0.0%) |
| 5 or more Children | 0 (0.0%) | 0 (0.0%) |
| Total | 0 (0.0%) | 0 (0.0%) |
Race in Marysville
The most populous races in Marysville are , and White / Caucasian (60 | 100.0%).
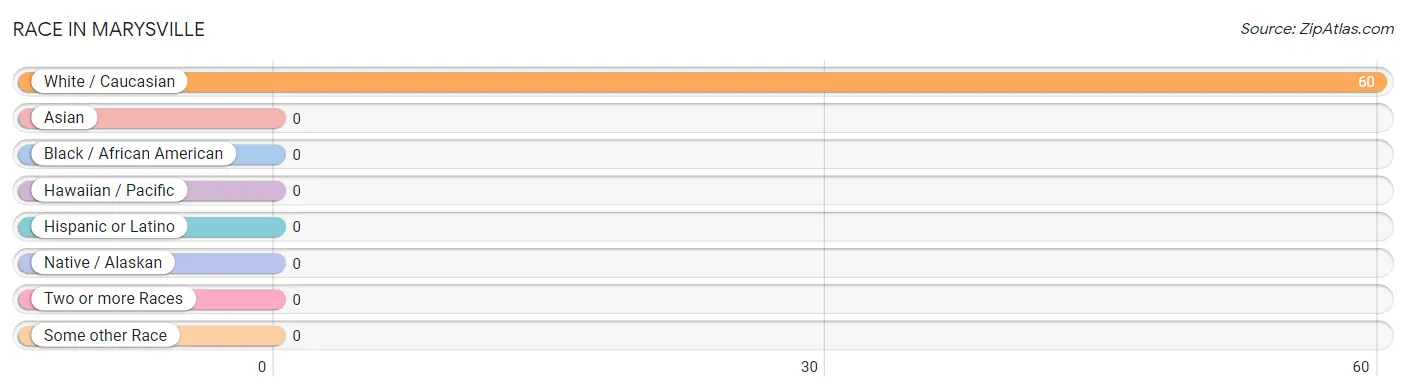
| Race | # Population | % Population |
| Asian | 0 | 0.0% |
| Black / African American | 0 | 0.0% |
| Hawaiian / Pacific | 0 | 0.0% |
| Hispanic or Latino | 0 | 0.0% |
| Native / Alaskan | 0 | 0.0% |
| White / Caucasian | 60 | 100.0% |
| Two or more Races | 0 | 0.0% |
| Some other Race | 0 | 0.0% |
| Total | 60 | 100.0% |
Ancestry in Marysville
The most populous ancestries reported in Marysville are Scotch-Irish (15 | 25.0%), English (12 | 20.0%), German (8 | 13.3%), Irish (7 | 11.7%), and American (4 | 6.7%), together accounting for 76.7% of all Marysville residents.
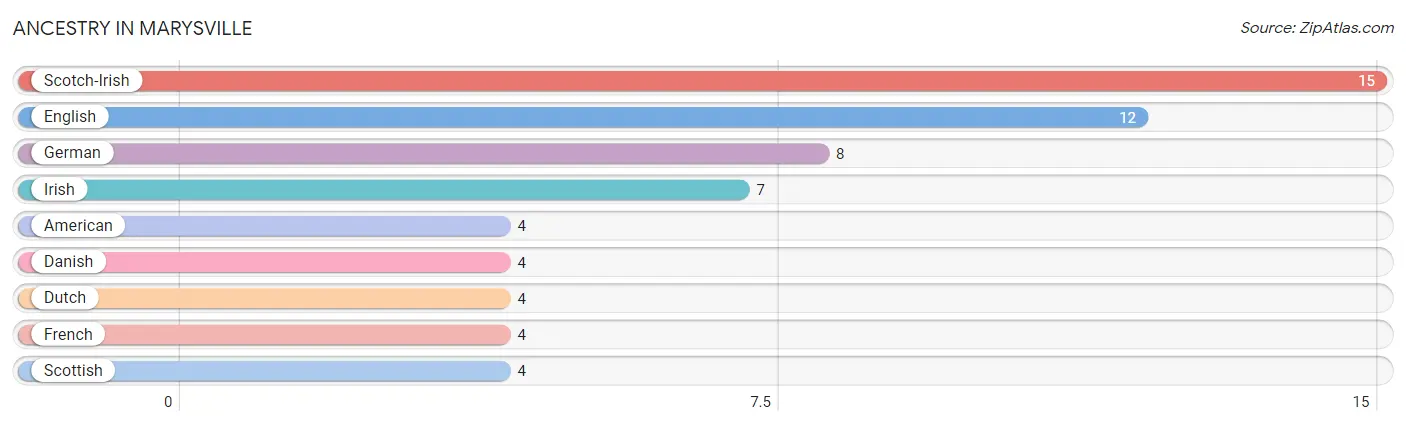
| Ancestry | # Population | % Population |
| American | 4 | 6.7% |
| Danish | 4 | 6.7% |
| Dutch | 4 | 6.7% |
| English | 12 | 20.0% |
| French | 4 | 6.7% |
| German | 8 | 13.3% |
| Irish | 7 | 11.7% |
| Scotch-Irish | 15 | 25.0% |
| Scottish | 4 | 6.7% | View All 9 Rows |
Immigrants in Marysville

| Immigration Origin | # Population | % Population | View All 0 Rows |
Sex and Age in Marysville
Sex and Age in Marysville
The most populous age groups in Marysville are 60 to 64 Years (15 | 40.5%) for men and 65 to 69 Years (6 | 26.1%) for women.
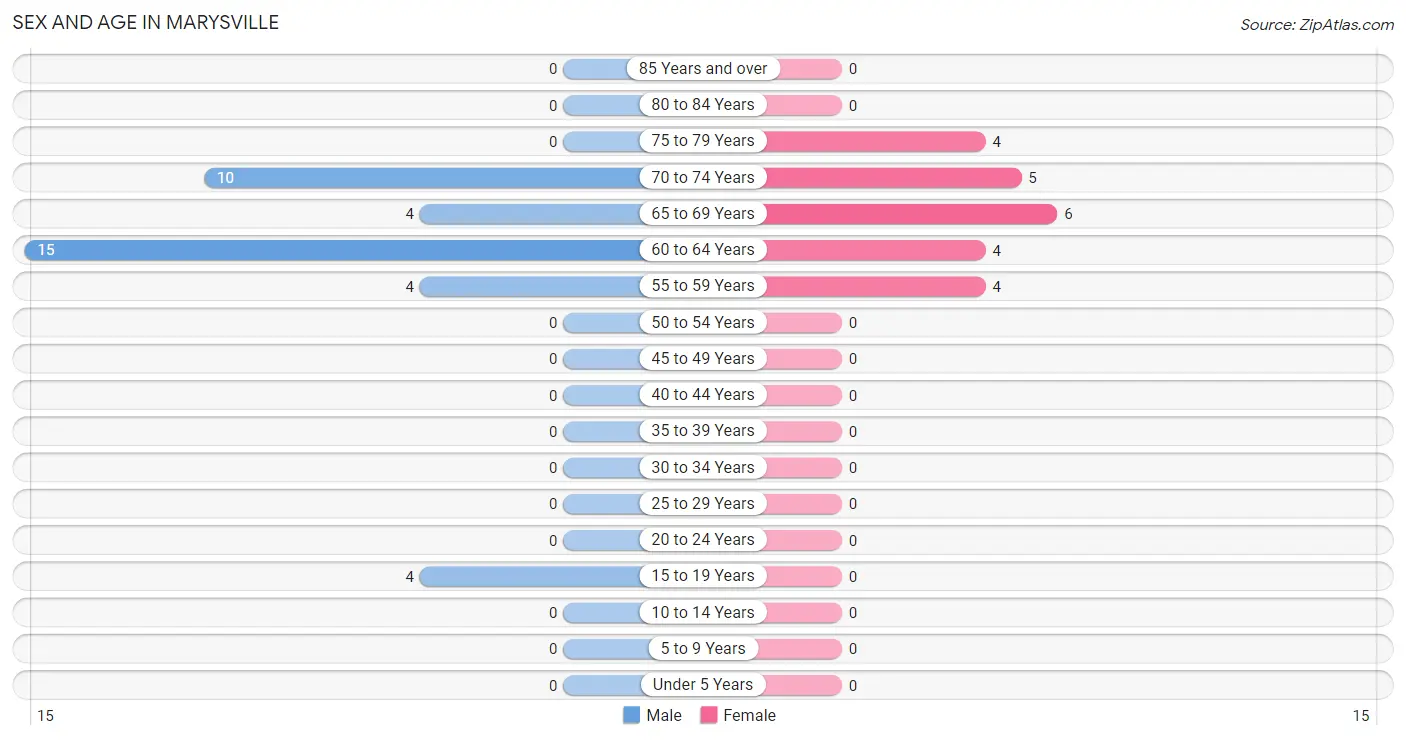
| Age Bracket | Male | Female |
| Under 5 Years | 0 (0.0%) | 0 (0.0%) |
| 5 to 9 Years | 0 (0.0%) | 0 (0.0%) |
| 10 to 14 Years | 0 (0.0%) | 0 (0.0%) |
| 15 to 19 Years | 4 (10.8%) | 0 (0.0%) |
| 20 to 24 Years | 0 (0.0%) | 0 (0.0%) |
| 25 to 29 Years | 0 (0.0%) | 0 (0.0%) |
| 30 to 34 Years | 0 (0.0%) | 0 (0.0%) |
| 35 to 39 Years | 0 (0.0%) | 0 (0.0%) |
| 40 to 44 Years | 0 (0.0%) | 0 (0.0%) |
| 45 to 49 Years | 0 (0.0%) | 0 (0.0%) |
| 50 to 54 Years | 0 (0.0%) | 0 (0.0%) |
| 55 to 59 Years | 4 (10.8%) | 4 (17.4%) |
| 60 to 64 Years | 15 (40.5%) | 4 (17.4%) |
| 65 to 69 Years | 4 (10.8%) | 6 (26.1%) |
| 70 to 74 Years | 10 (27.0%) | 5 (21.7%) |
| 75 to 79 Years | 0 (0.0%) | 4 (17.4%) |
| 80 to 84 Years | 0 (0.0%) | 0 (0.0%) |
| 85 Years and over | 0 (0.0%) | 0 (0.0%) |
| Total | 37 (100.0%) | 23 (100.0%) |
Families and Households in Marysville
Median Family Size in Marysville
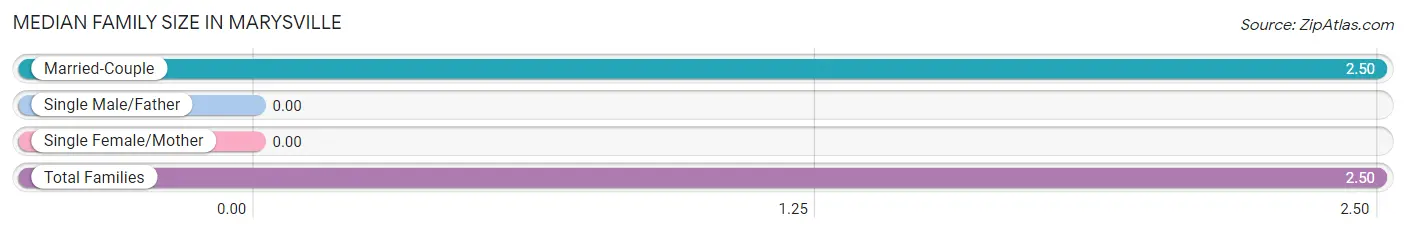
| Family Type | # Families | Family Size |
| Married-Couple | 10 (100.0%) | 2.50 |
| Single Male/Father | 0 (0.0%) | - |
| Single Female/Mother | 0 (0.0%) | - |
| Total Families | 10 (100.0%) | 2.50 |
Median Household Size in Marysville
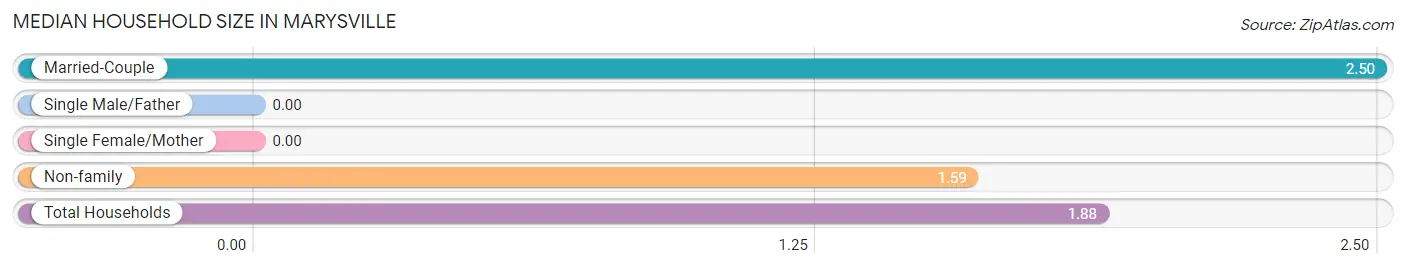
| Household Type | # Households | Household Size |
| Married-Couple | 10 (31.2%) | 2.50 |
| Single Male/Father | 0 (0.0%) | - |
| Single Female/Mother | 0 (0.0%) | - |
| Non-family | 22 (68.8%) | 1.59 |
| Total Households | 32 (100.0%) | 1.88 |
Household Size by Marriage Status in Marysville
Out of a total of 32 households in Marysville, 10 (31.2%) are family households, while 22 (68.8%) are nonfamily households. The most numerous type of family households are 2-person households, comprising 6, and the most common type of nonfamily households are 1-person households, comprising 11.
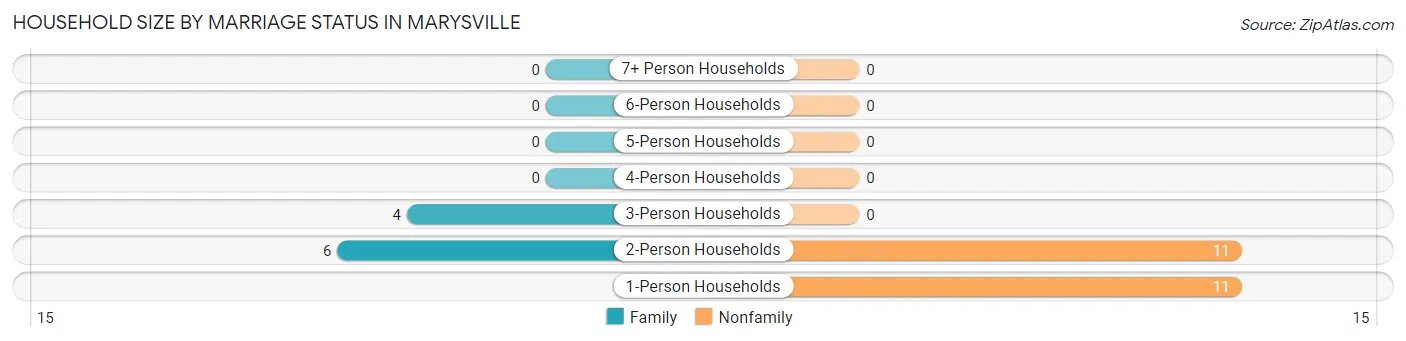
| Household Size | Family Households | Nonfamily Households |
| 1-Person Households | - | 11 (34.4%) |
| 2-Person Households | 6 (18.8%) | 11 (34.4%) |
| 3-Person Households | 4 (12.5%) | 0 (0.0%) |
| 4-Person Households | 0 (0.0%) | 0 (0.0%) |
| 5-Person Households | 0 (0.0%) | 0 (0.0%) |
| 6-Person Households | 0 (0.0%) | 0 (0.0%) |
| 7+ Person Households | 0 (0.0%) | 0 (0.0%) |
| Total | 10 (31.2%) | 22 (68.8%) |
Female Fertility in Marysville
Fertility by Age in Marysville
| Age Bracket | Women with Births | Births / 1,000 Women |
| 15 to 19 years | 0 (0.0%) | 0.0 |
| 20 to 34 years | 0 (0.0%) | 0.0 |
| 35 to 50 years | 0 (0.0%) | 0.0 |
| Total | 0 (0.0%) | 0.0 |
Fertility by Age by Marriage Status in Marysville
| Age Bracket | Married | Unmarried |
| 15 to 19 years | 0 (0.0%) | 0 (0.0%) |
| 20 to 34 years | 0 (0.0%) | 0 (0.0%) |
| 35 to 50 years | 0 (0.0%) | 0 (0.0%) |
| Total | 0 (0.0%) | 0 (0.0%) |
Fertility by Education in Marysville
| Educational Attainment | Women with Births | Births / 1,000 Women |
| Less than High School | 0 (0.0%) | 0.0 |
| High School Diploma | 0 (0.0%) | 0.0 |
| College or Associate's Degree | 0 (0.0%) | 0.0 |
| Bachelor's Degree | 0 (0.0%) | 0.0 |
| Graduate Degree | 0 (0.0%) | 0.0 |
| Total | 0 (0.0%) | 0.0 |
Fertility by Education by Marriage Status in Marysville
| Educational Attainment | Married | Unmarried |
| Less than High School | 0 (0.0%) | 0 (0.0%) |
| High School Diploma | 0 (0.0%) | 0 (0.0%) |
| College or Associate's Degree | 0 (0.0%) | 0 (0.0%) |
| Bachelor's Degree | 0 (0.0%) | 0 (0.0%) |
| Graduate Degree | 0 (0.0%) | 0 (0.0%) |
| Total | 0 (0.0%) | 0 (0.0%) |
Employment Characteristics in Marysville
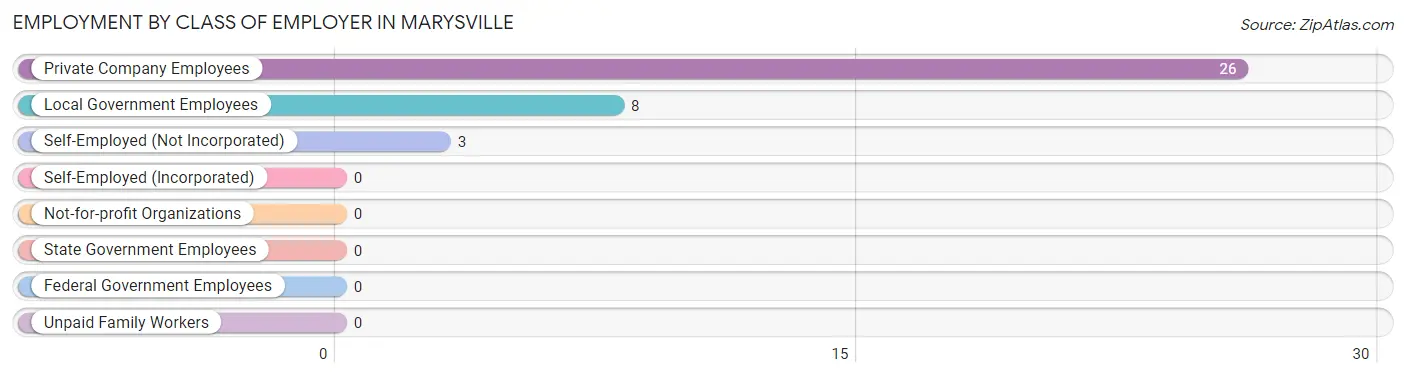
Employment by Class of Employer in Marysville
Among the 37 employed individuals in Marysville, private company employees (26 | 70.3%), local government employees (8 | 21.6%), and self-employed (not incorporated) (3 | 8.1%) make up the most common classes of employment.
| Employer Class | # Employees | % Employees |
| Private Company Employees | 26 | 70.3% |
| Self-Employed (Incorporated) | 0 | 0.0% |
| Self-Employed (Not Incorporated) | 3 | 8.1% |
| Not-for-profit Organizations | 0 | 0.0% |
| Local Government Employees | 8 | 21.6% |
| State Government Employees | 0 | 0.0% |
| Federal Government Employees | 0 | 0.0% |
| Unpaid Family Workers | 0 | 0.0% |
| Total | 37 | 100.0% |
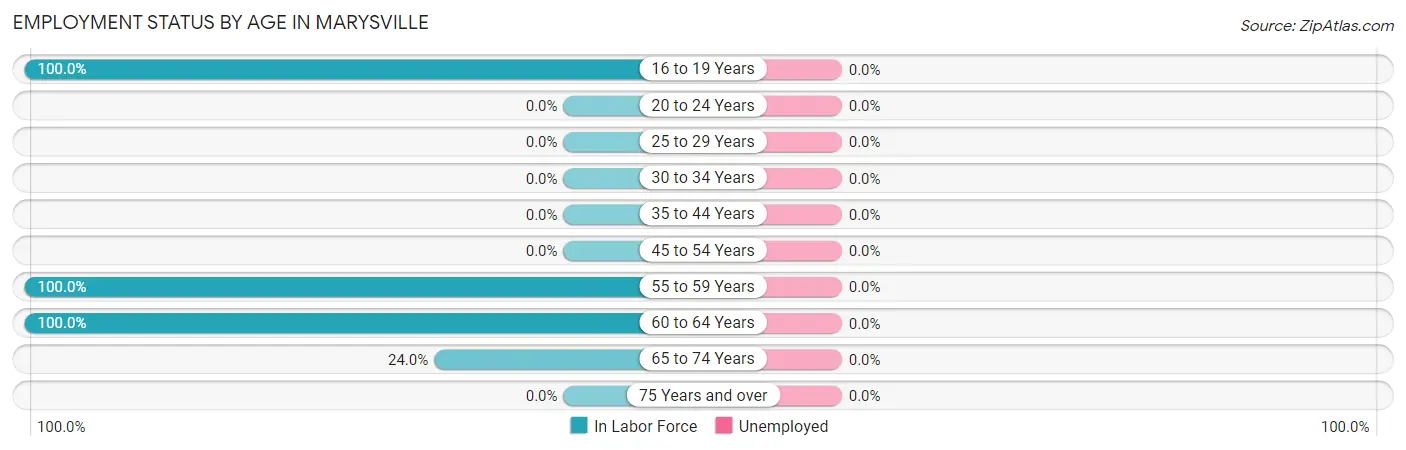
Employment Status by Age in Marysville
| Age Bracket | In Labor Force | Unemployed |
| 16 to 19 Years | 4 (100.0%) | 0 (0.0%) |
| 20 to 24 Years | 0 (0.0%) | 0 (0.0%) |
| 25 to 29 Years | 0 (0.0%) | 0 (0.0%) |
| 30 to 34 Years | 0 (0.0%) | 0 (0.0%) |
| 35 to 44 Years | 0 (0.0%) | 0 (0.0%) |
| 45 to 54 Years | 0 (0.0%) | 0 (0.0%) |
| 55 to 59 Years | 8 (100.0%) | 0 (0.0%) |
| 60 to 64 Years | 19 (100.0%) | 0 (0.0%) |
| 65 to 74 Years | 6 (24.0%) | 0 (0.0%) |
| 75 Years and over | 0 (0.0%) | 0 (0.0%) |
| Total | 37 (61.7%) | 0 (0.0%) |
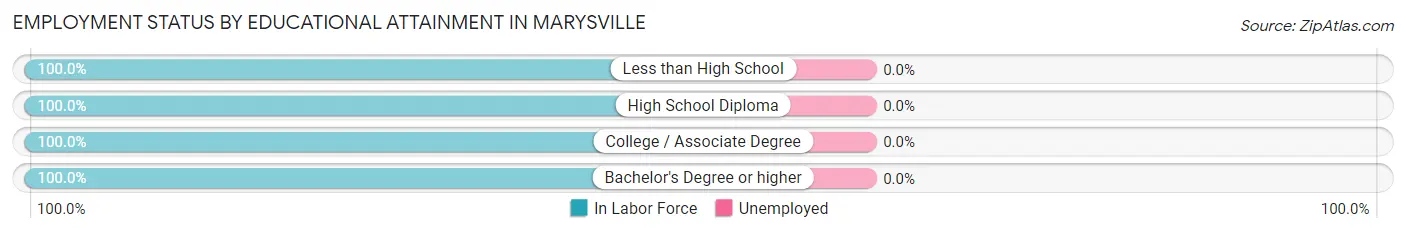
Employment Status by Educational Attainment in Marysville
| Educational Attainment | In Labor Force | Unemployed |
| Less than High School | 8 (100.0%) | 0 (0.0%) |
| High School Diploma | 4 (100.0%) | 0 (0.0%) |
| College / Associate Degree | 11 (100.0%) | 0 (0.0%) |
| Bachelor's Degree or higher | 4 (100.0%) | 0 (0.0%) |
| Total | 27 (100.0%) | 0 (0.0%) |
Employment Occupations by Sex in Marysville
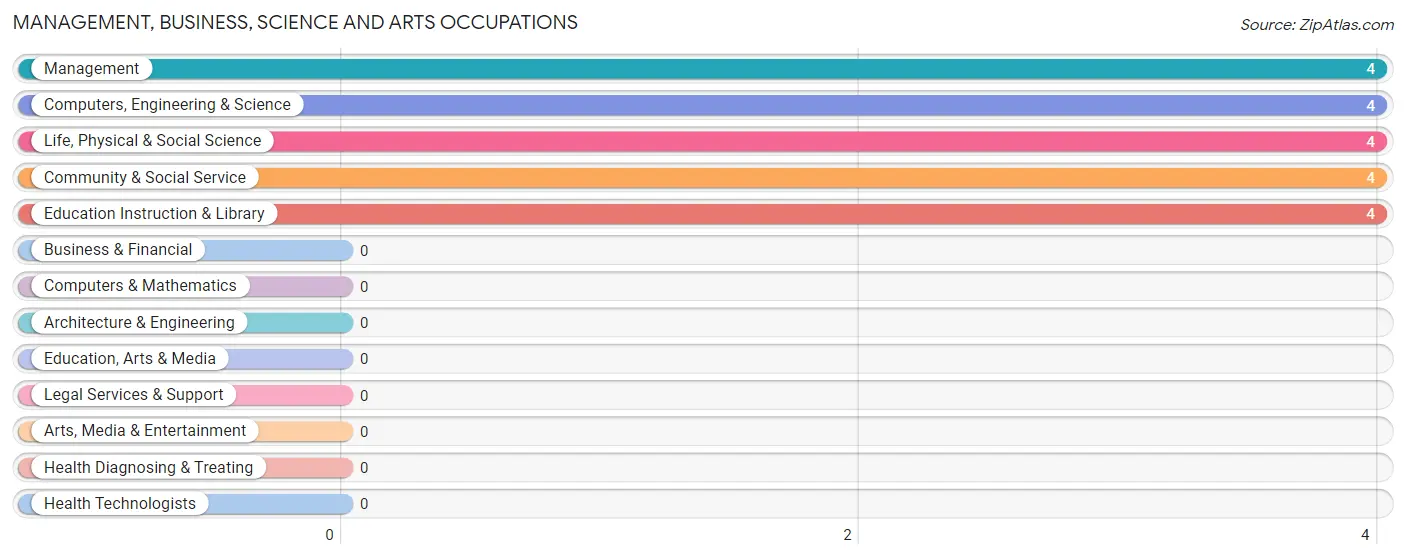
Management, Business, Science and Arts Occupations
The most common Management, Business, Science and Arts occupations in Marysville are Management (4 | 10.8%), Computers, Engineering & Science (4 | 10.8%), Life, Physical & Social Science (4 | 10.8%), Community & Social Service (4 | 10.8%), and Education Instruction & Library (4 | 10.8%).
Management, Business, Science and Arts Occupations by Sex
Within the Management, Business, Science and Arts occupations in Marysville, the most male-oriented occupations are Computers, Engineering & Science (100.0%), and Life, Physical & Social Science (100.0%), while the most female-oriented occupations are Management (100.0%), Community & Social Service (100.0%), and Education Instruction & Library (100.0%).
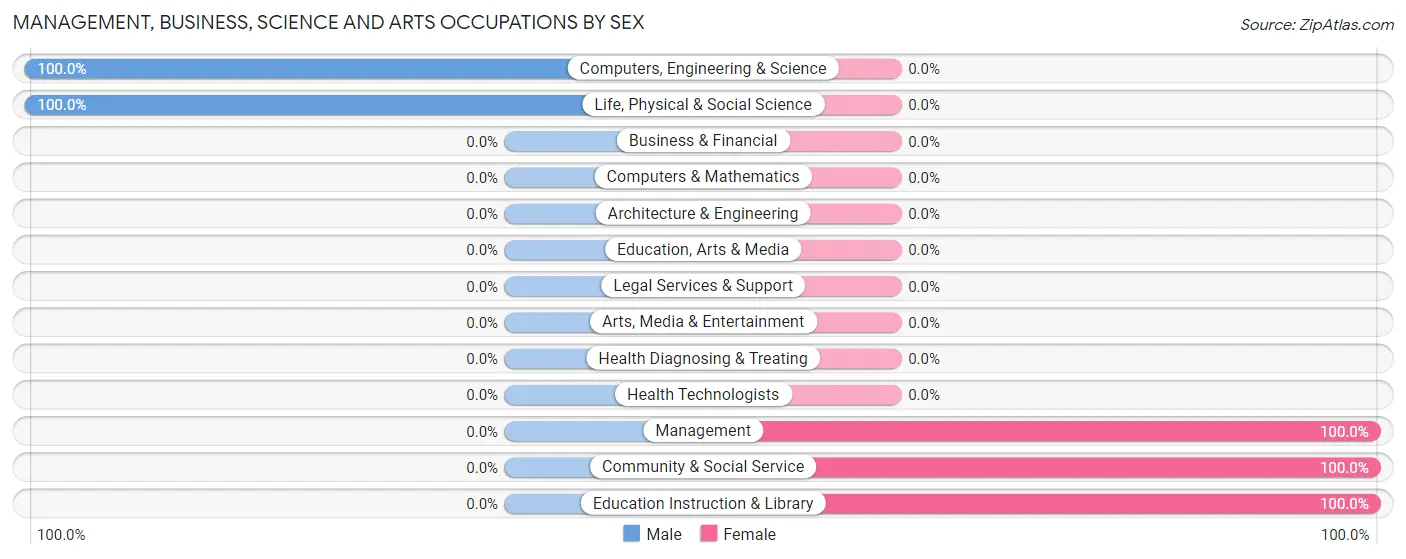
| Occupation | Male | Female |
| Management | 0 (0.0%) | 4 (100.0%) |
| Business & Financial | 0 (0.0%) | 0 (0.0%) |
| Computers, Engineering & Science | 4 (100.0%) | 0 (0.0%) |
| Computers & Mathematics | 0 (0.0%) | 0 (0.0%) |
| Architecture & Engineering | 0 (0.0%) | 0 (0.0%) |
| Life, Physical & Social Science | 4 (100.0%) | 0 (0.0%) |
| Community & Social Service | 0 (0.0%) | 4 (100.0%) |
| Education, Arts & Media | 0 (0.0%) | 0 (0.0%) |
| Legal Services & Support | 0 (0.0%) | 0 (0.0%) |
| Education Instruction & Library | 0 (0.0%) | 4 (100.0%) |
| Arts, Media & Entertainment | 0 (0.0%) | 0 (0.0%) |
| Health Diagnosing & Treating | 0 (0.0%) | 0 (0.0%) |
| Health Technologists | 0 (0.0%) | 0 (0.0%) |
| Total (Category) | 4 (33.3%) | 8 (66.7%) |
| Total (Overall) | 23 (62.2%) | 14 (37.8%) |
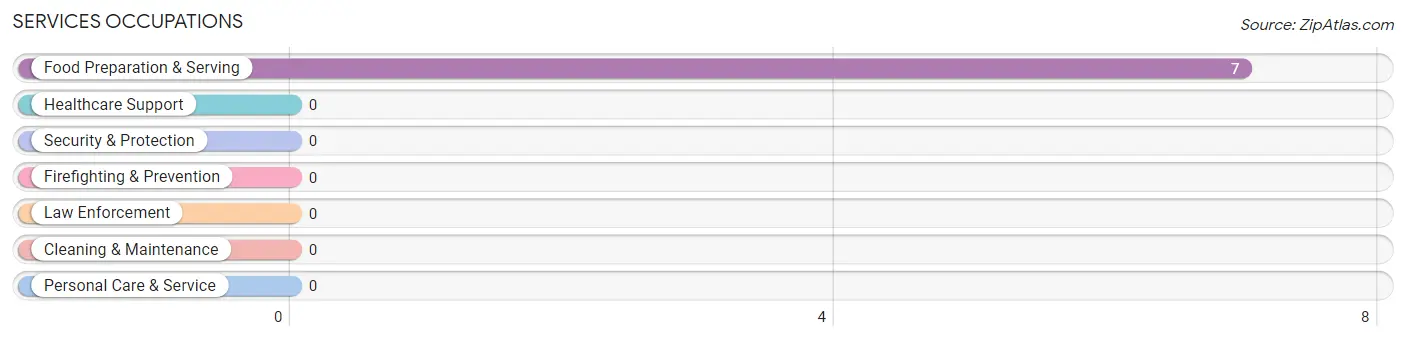
Services Occupations
The most common Services occupations in Marysville are , and Food Preparation & Serving (7 | 18.9%).
Services Occupations by Sex
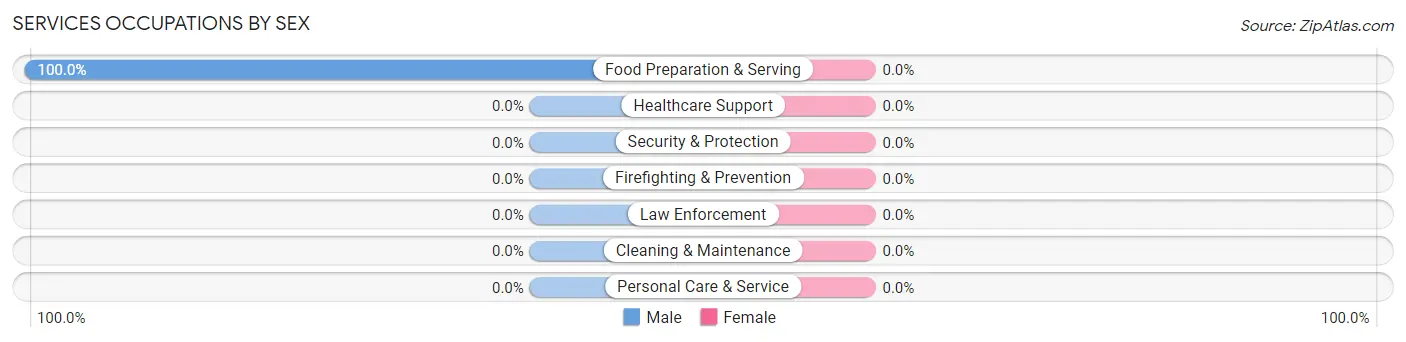
| Occupation | Male | Female |
| Healthcare Support | 0 (0.0%) | 0 (0.0%) |
| Security & Protection | 0 (0.0%) | 0 (0.0%) |
| Firefighting & Prevention | 0 (0.0%) | 0 (0.0%) |
| Law Enforcement | 0 (0.0%) | 0 (0.0%) |
| Food Preparation & Serving | 7 (100.0%) | 0 (0.0%) |
| Cleaning & Maintenance | 0 (0.0%) | 0 (0.0%) |
| Personal Care & Service | 0 (0.0%) | 0 (0.0%) |
| Total (Category) | 7 (100.0%) | 0 (0.0%) |
| Total (Overall) | 23 (62.2%) | 14 (37.8%) |
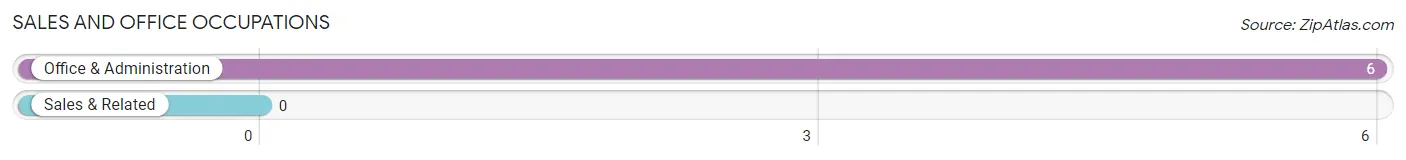
Sales and Office Occupations
The most common Sales and Office occupations in Marysville are , and Office & Administration (6 | 16.2%).
Sales and Office Occupations by Sex
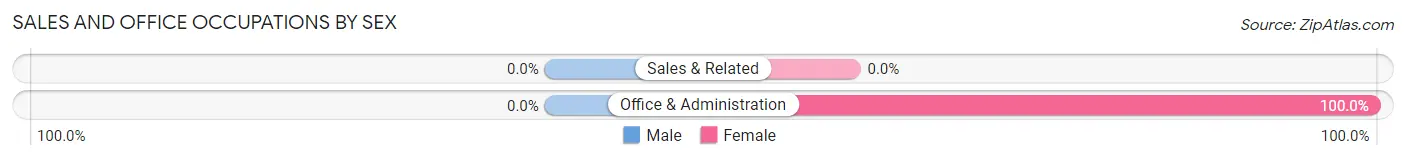
| Occupation | Male | Female |
| Sales & Related | 0 (0.0%) | 0 (0.0%) |
| Office & Administration | 0 (0.0%) | 6 (100.0%) |
| Total (Category) | 0 (0.0%) | 6 (100.0%) |
| Total (Overall) | 23 (62.2%) | 14 (37.8%) |
Natural Resources, Construction and Maintenance Occupations
The most common Natural Resources, Construction and Maintenance occupations in Marysville are , and Farming, Fishing & Forestry (4 | 10.8%).
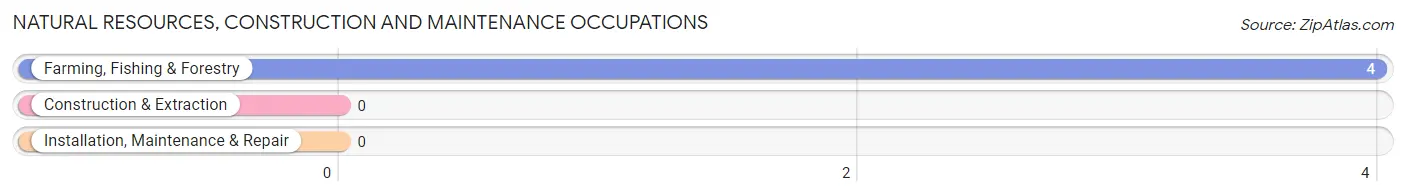
Natural Resources, Construction and Maintenance Occupations by Sex
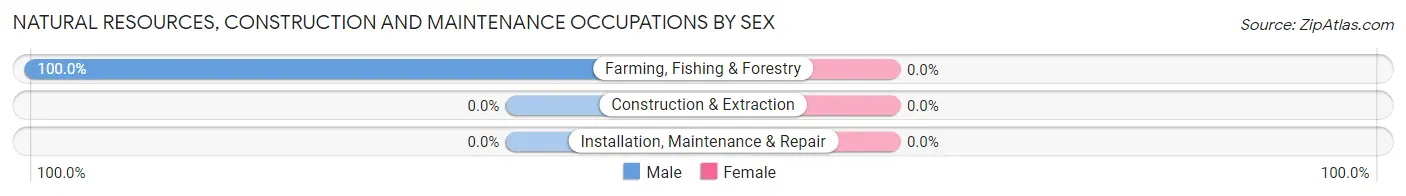
| Occupation | Male | Female |
| Farming, Fishing & Forestry | 4 (100.0%) | 0 (0.0%) |
| Construction & Extraction | 0 (0.0%) | 0 (0.0%) |
| Installation, Maintenance & Repair | 0 (0.0%) | 0 (0.0%) |
| Total (Category) | 4 (100.0%) | 0 (0.0%) |
| Total (Overall) | 23 (62.2%) | 14 (37.8%) |
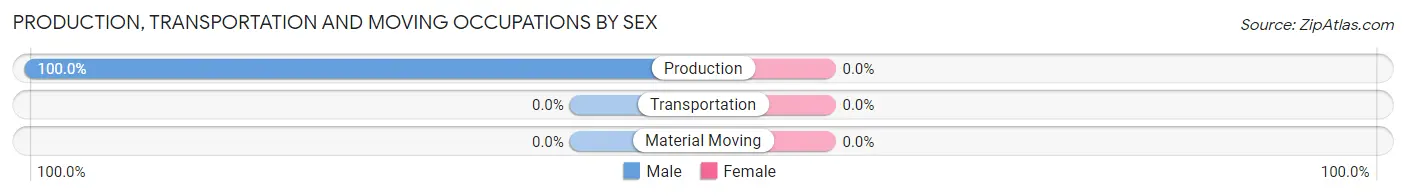
Production, Transportation and Moving Occupations
The most common Production, Transportation and Moving occupations in Marysville are , and Production (8 | 21.6%).
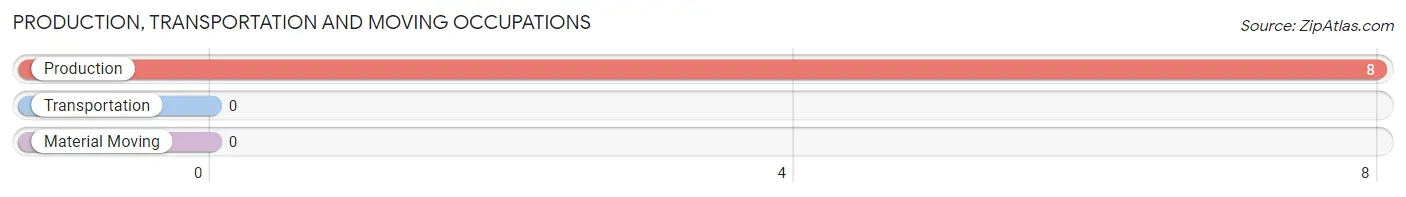
Production, Transportation and Moving Occupations by Sex
| Occupation | Male | Female |
| Production | 8 (100.0%) | 0 (0.0%) |
| Transportation | 0 (0.0%) | 0 (0.0%) |
| Material Moving | 0 (0.0%) | 0 (0.0%) |
| Total (Category) | 8 (100.0%) | 0 (0.0%) |
| Total (Overall) | 23 (62.2%) | 14 (37.8%) |
Employment Industries by Sex in Marysville
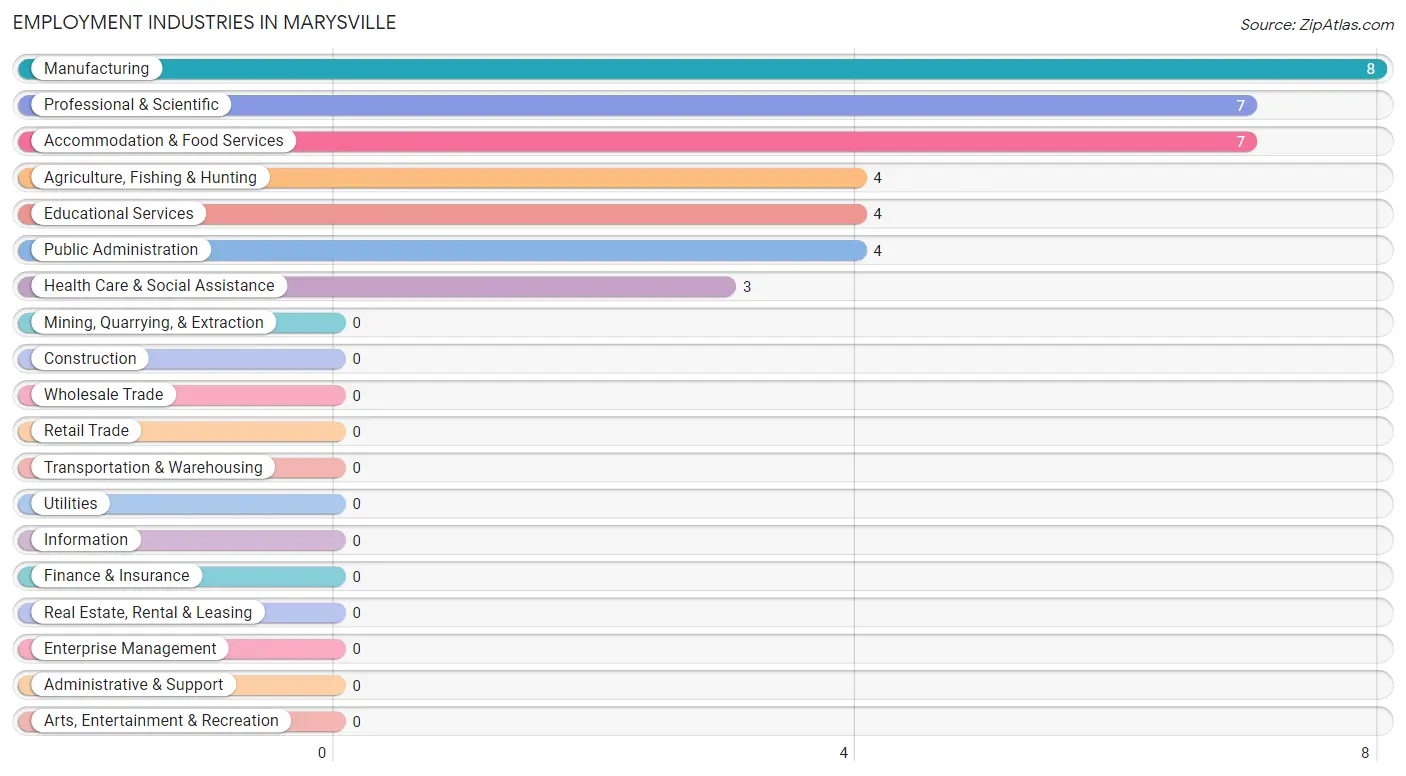
Employment Industries in Marysville
The major employment industries in Marysville include Manufacturing (8 | 21.6%), Professional & Scientific (7 | 18.9%), Accommodation & Food Services (7 | 18.9%), Agriculture, Fishing & Hunting (4 | 10.8%), and Educational Services (4 | 10.8%).
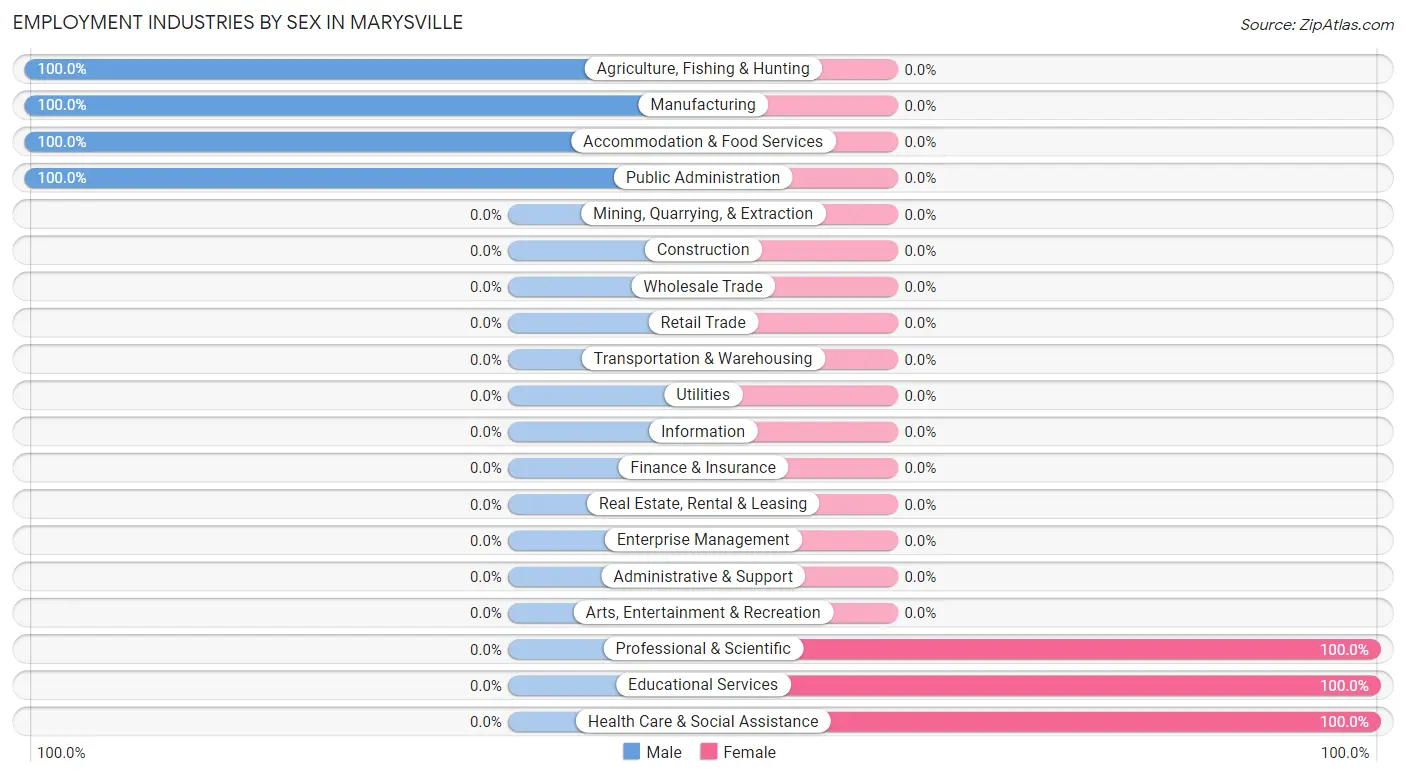
Employment Industries by Sex in Marysville
The Marysville industries that see more men than women are Agriculture, Fishing & Hunting (100.0%), Manufacturing (100.0%), and Accommodation & Food Services (100.0%), whereas the industries that tend to have a higher number of women are Professional & Scientific (100.0%), Educational Services (100.0%), and Health Care & Social Assistance (100.0%).
| Industry | Male | Female |
| Agriculture, Fishing & Hunting | 4 (100.0%) | 0 (0.0%) |
| Mining, Quarrying, & Extraction | 0 (0.0%) | 0 (0.0%) |
| Construction | 0 (0.0%) | 0 (0.0%) |
| Manufacturing | 8 (100.0%) | 0 (0.0%) |
| Wholesale Trade | 0 (0.0%) | 0 (0.0%) |
| Retail Trade | 0 (0.0%) | 0 (0.0%) |
| Transportation & Warehousing | 0 (0.0%) | 0 (0.0%) |
| Utilities | 0 (0.0%) | 0 (0.0%) |
| Information | 0 (0.0%) | 0 (0.0%) |
| Finance & Insurance | 0 (0.0%) | 0 (0.0%) |
| Real Estate, Rental & Leasing | 0 (0.0%) | 0 (0.0%) |
| Professional & Scientific | 0 (0.0%) | 7 (100.0%) |
| Enterprise Management | 0 (0.0%) | 0 (0.0%) |
| Administrative & Support | 0 (0.0%) | 0 (0.0%) |
| Educational Services | 0 (0.0%) | 4 (100.0%) |
| Health Care & Social Assistance | 0 (0.0%) | 3 (100.0%) |
| Arts, Entertainment & Recreation | 0 (0.0%) | 0 (0.0%) |
| Accommodation & Food Services | 7 (100.0%) | 0 (0.0%) |
| Public Administration | 4 (100.0%) | 0 (0.0%) |
| Total | 23 (62.2%) | 14 (37.8%) |
Education in Marysville
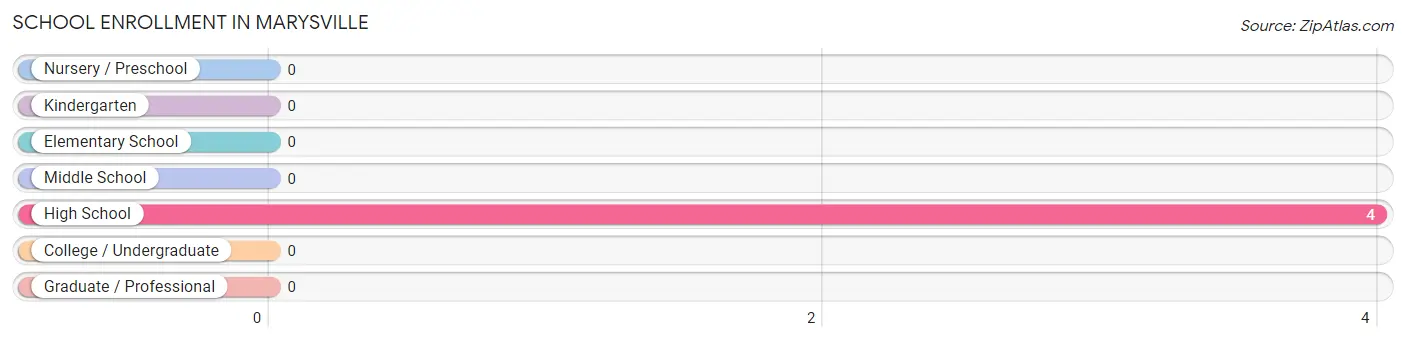
School Enrollment in Marysville
| School Level | # Students | % Students |
| Nursery / Preschool | 0 | 0.0% |
| Kindergarten | 0 | 0.0% |
| Elementary School | 0 | 0.0% |
| Middle School | 0 | 0.0% |
| High School | 4 | 100.0% |
| College / Undergraduate | 0 | 0.0% |
| Graduate / Professional | 0 | 0.0% |
| Total | 4 | 100.0% |
School Enrollment by Age by Funding Source in Marysville
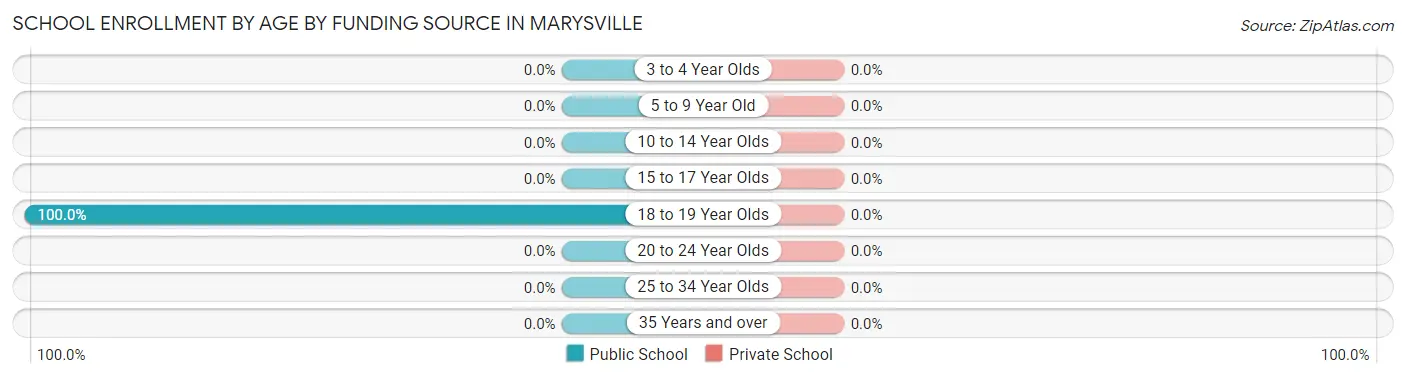
| Age Bracket | Public School | Private School |
| 3 to 4 Year Olds | 0 (0.0%) | 0 (0.0%) |
| 5 to 9 Year Old | 0 (0.0%) | 0 (0.0%) |
| 10 to 14 Year Olds | 0 (0.0%) | 0 (0.0%) |
| 15 to 17 Year Olds | 0 (0.0%) | 0 (0.0%) |
| 18 to 19 Year Olds | 4 (100.0%) | 0 (0.0%) |
| 20 to 24 Year Olds | 0 (0.0%) | 0 (0.0%) |
| 25 to 34 Year Olds | 0 (0.0%) | 0 (0.0%) |
| 35 Years and over | 0 (0.0%) | 0 (0.0%) |
| Total | 4 (100.0%) | 0 (0.0%) |
Educational Attainment by Field of Study in Marysville
Bio, nature & agricultural (8 | 47.1%), visual & performing arts (4 | 23.5%), education (3 | 17.6%), and business (2 | 11.8%) are the most common fields of study among 17 individuals in Marysville who have obtained a bachelor's degree or higher.
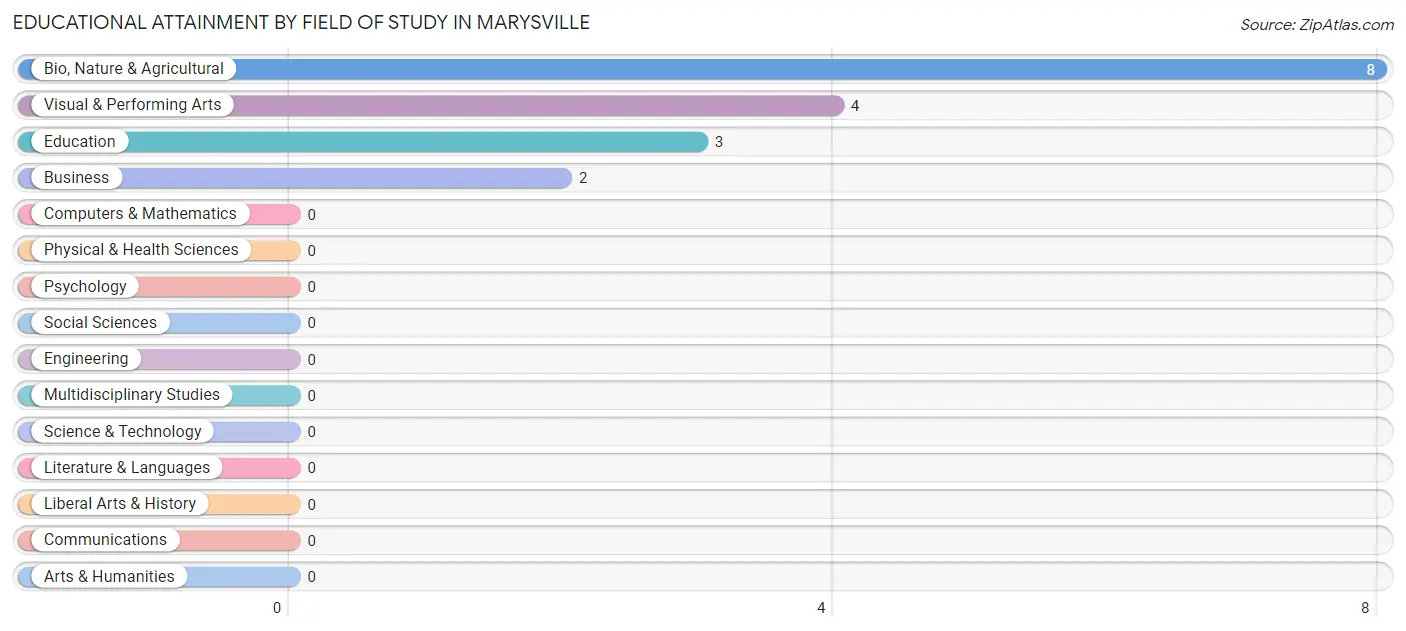
| Field of Study | # Graduates | % Graduates |
| Computers & Mathematics | 0 | 0.0% |
| Bio, Nature & Agricultural | 8 | 47.1% |
| Physical & Health Sciences | 0 | 0.0% |
| Psychology | 0 | 0.0% |
| Social Sciences | 0 | 0.0% |
| Engineering | 0 | 0.0% |
| Multidisciplinary Studies | 0 | 0.0% |
| Science & Technology | 0 | 0.0% |
| Business | 2 | 11.8% |
| Education | 3 | 17.6% |
| Literature & Languages | 0 | 0.0% |
| Liberal Arts & History | 0 | 0.0% |
| Visual & Performing Arts | 4 | 23.5% |
| Communications | 0 | 0.0% |
| Arts & Humanities | 0 | 0.0% |
| Total | 17 | 100.0% |
Transportation & Commute in Marysville
Vehicle Availability by Sex in Marysville
The most prevalent vehicle ownership categories in Marysville are males with 2 vehicles (15, accounting for 65.2%) and females with 2 vehicles (6, making up 107.1%).
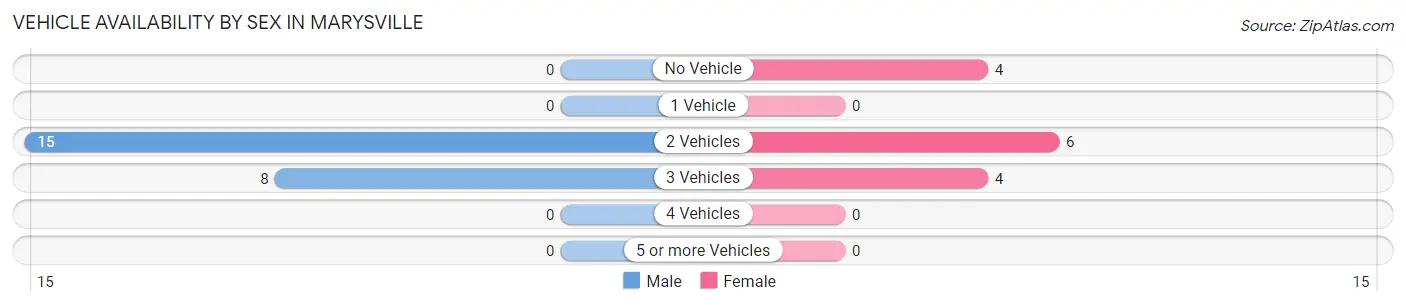
| Vehicles Available | Male | Female |
| No Vehicle | 0 (0.0%) | 4 (28.6%) |
| 1 Vehicle | 0 (0.0%) | 0 (0.0%) |
| 2 Vehicles | 15 (65.2%) | 6 (42.9%) |
| 3 Vehicles | 8 (34.8%) | 4 (28.6%) |
| 4 Vehicles | 0 (0.0%) | 0 (0.0%) |
| 5 or more Vehicles | 0 (0.0%) | 0 (0.0%) |
| Total | 23 (100.0%) | 14 (100.0%) |
Commute Time in Marysville
The most frequently occuring commute durations in Marysville are 20 to 24 minutes (19 commuters, 51.3%), 30 to 34 minutes (14 commuters, 37.8%), and 10 to 14 minutes (4 commuters, 10.8%).
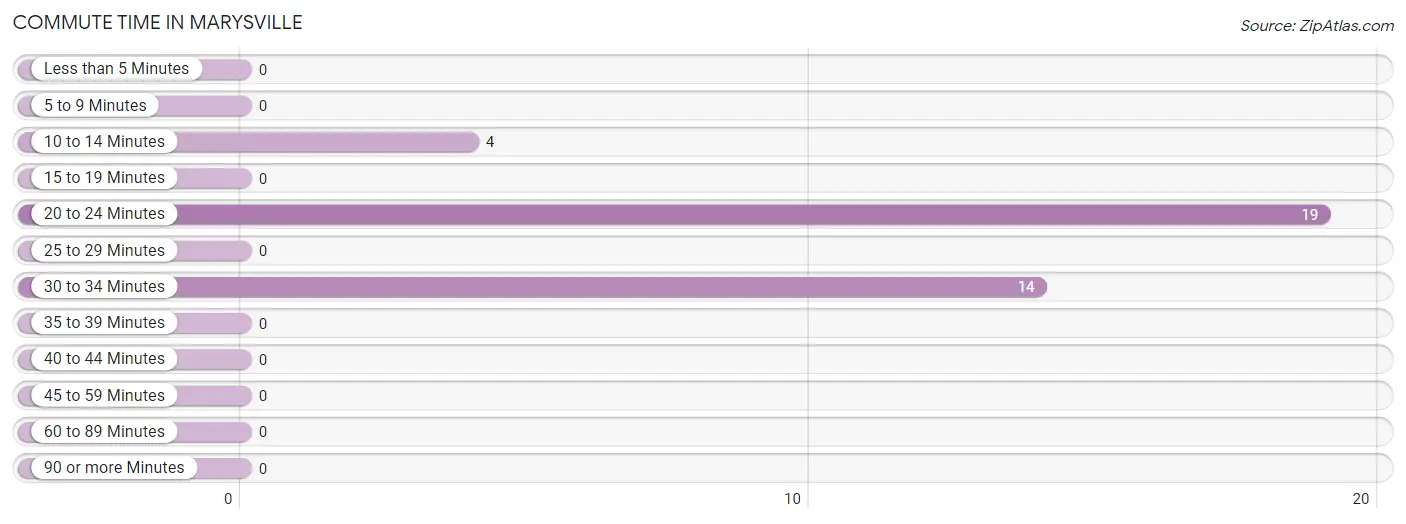
| Commute Time | # Commuters | % Commuters |
| Less than 5 Minutes | 0 | 0.0% |
| 5 to 9 Minutes | 0 | 0.0% |
| 10 to 14 Minutes | 4 | 10.8% |
| 15 to 19 Minutes | 0 | 0.0% |
| 20 to 24 Minutes | 19 | 51.3% |
| 25 to 29 Minutes | 0 | 0.0% |
| 30 to 34 Minutes | 14 | 37.8% |
| 35 to 39 Minutes | 0 | 0.0% |
| 40 to 44 Minutes | 0 | 0.0% |
| 45 to 59 Minutes | 0 | 0.0% |
| 60 to 89 Minutes | 0 | 0.0% |
| 90 or more Minutes | 0 | 0.0% |
Commute Time by Sex in Marysville
The most common commute times in Marysville are 20 to 24 minutes (15 commuters, 65.2%) for males and 30 to 34 minutes (10 commuters, 71.4%) for females.
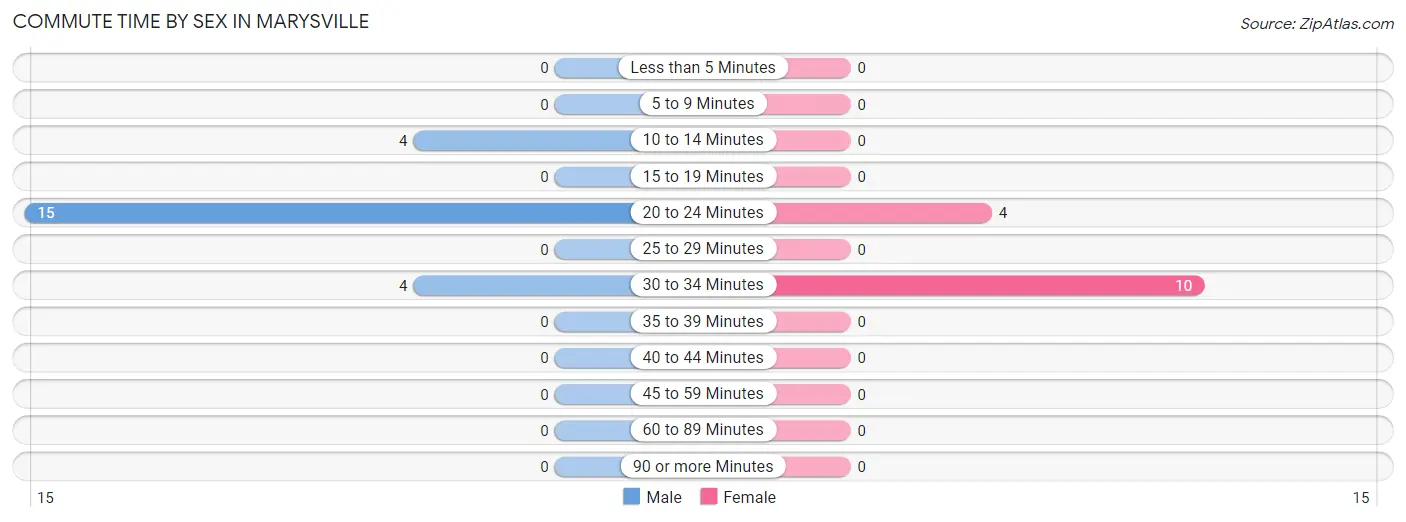
| Commute Time | Male | Female |
| Less than 5 Minutes | 0 (0.0%) | 0 (0.0%) |
| 5 to 9 Minutes | 0 (0.0%) | 0 (0.0%) |
| 10 to 14 Minutes | 4 (17.4%) | 0 (0.0%) |
| 15 to 19 Minutes | 0 (0.0%) | 0 (0.0%) |
| 20 to 24 Minutes | 15 (65.2%) | 4 (28.6%) |
| 25 to 29 Minutes | 0 (0.0%) | 0 (0.0%) |
| 30 to 34 Minutes | 4 (17.4%) | 10 (71.4%) |
| 35 to 39 Minutes | 0 (0.0%) | 0 (0.0%) |
| 40 to 44 Minutes | 0 (0.0%) | 0 (0.0%) |
| 45 to 59 Minutes | 0 (0.0%) | 0 (0.0%) |
| 60 to 89 Minutes | 0 (0.0%) | 0 (0.0%) |
| 90 or more Minutes | 0 (0.0%) | 0 (0.0%) |
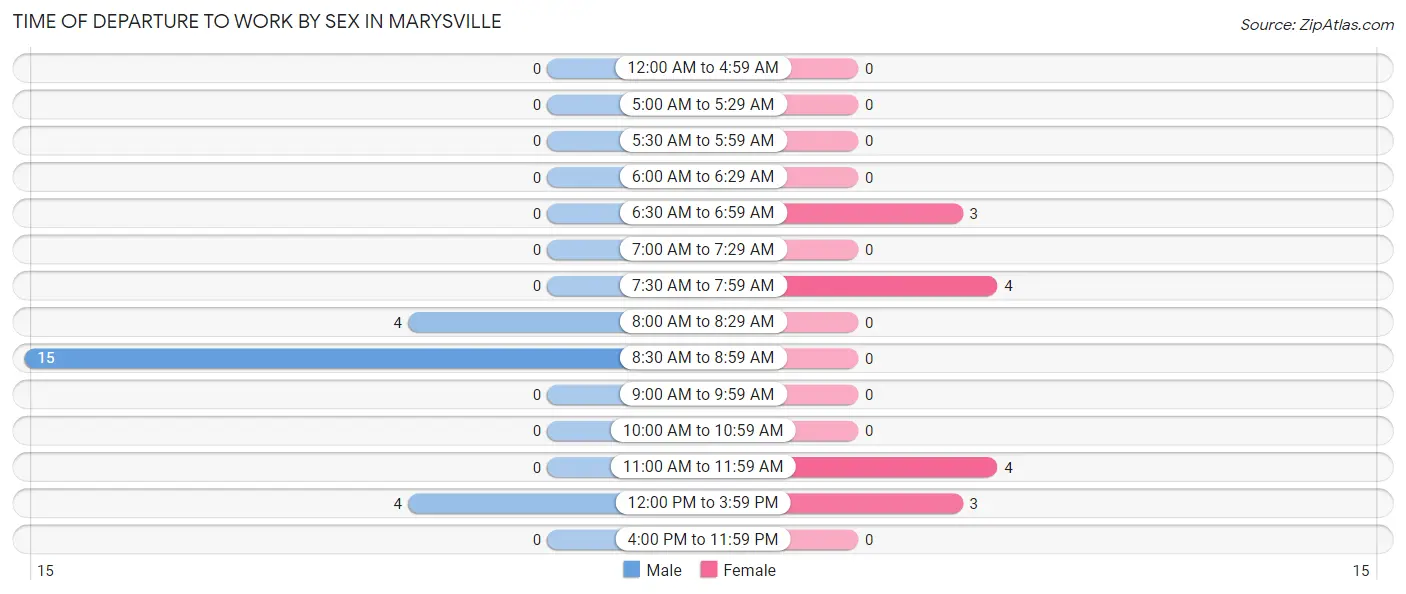
Time of Departure to Work by Sex in Marysville
The most frequent times of departure to work in Marysville are 8:30 AM to 8:59 AM (15, 65.2%) for males and 7:30 AM to 7:59 AM (4, 28.6%) for females.
| Time of Departure | Male | Female |
| 12:00 AM to 4:59 AM | 0 (0.0%) | 0 (0.0%) |
| 5:00 AM to 5:29 AM | 0 (0.0%) | 0 (0.0%) |
| 5:30 AM to 5:59 AM | 0 (0.0%) | 0 (0.0%) |
| 6:00 AM to 6:29 AM | 0 (0.0%) | 0 (0.0%) |
| 6:30 AM to 6:59 AM | 0 (0.0%) | 3 (21.4%) |
| 7:00 AM to 7:29 AM | 0 (0.0%) | 0 (0.0%) |
| 7:30 AM to 7:59 AM | 0 (0.0%) | 4 (28.6%) |
| 8:00 AM to 8:29 AM | 4 (17.4%) | 0 (0.0%) |
| 8:30 AM to 8:59 AM | 15 (65.2%) | 0 (0.0%) |
| 9:00 AM to 9:59 AM | 0 (0.0%) | 0 (0.0%) |
| 10:00 AM to 10:59 AM | 0 (0.0%) | 0 (0.0%) |
| 11:00 AM to 11:59 AM | 0 (0.0%) | 4 (28.6%) |
| 12:00 PM to 3:59 PM | 4 (17.4%) | 3 (21.4%) |
| 4:00 PM to 11:59 PM | 0 (0.0%) | 0 (0.0%) |
| Total | 23 (100.0%) | 14 (100.0%) |
Housing Occupancy in Marysville
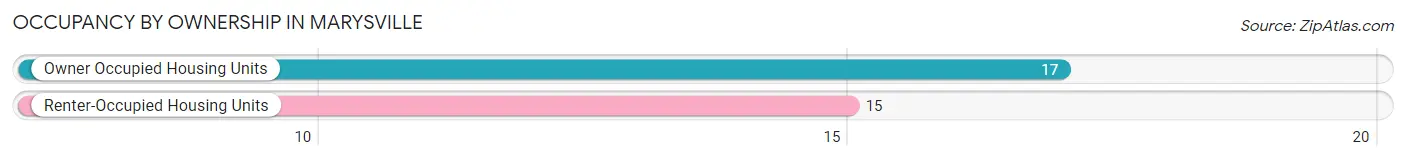
Occupancy by Ownership in Marysville
Of the total 32 dwellings in Marysville, owner-occupied units account for 17 (53.1%), while renter-occupied units make up 15 (46.9%).
| Occupancy | # Housing Units | % Housing Units |
| Owner Occupied Housing Units | 17 | 53.1% |
| Renter-Occupied Housing Units | 15 | 46.9% |
| Total Occupied Housing Units | 32 | 100.0% |
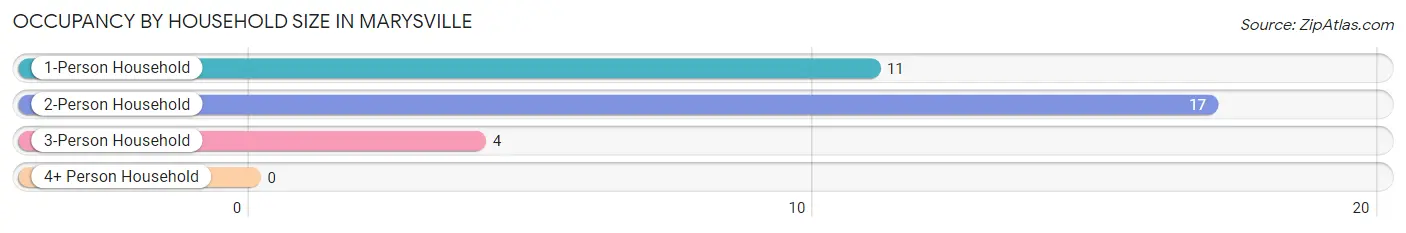
Occupancy by Household Size in Marysville
| Household Size | # Housing Units | % Housing Units |
| 1-Person Household | 11 | 34.4% |
| 2-Person Household | 17 | 53.1% |
| 3-Person Household | 4 | 12.5% |
| 4+ Person Household | 0 | 0.0% |
| Total Housing Units | 32 | 100.0% |
Occupancy by Ownership by Household Size in Marysville
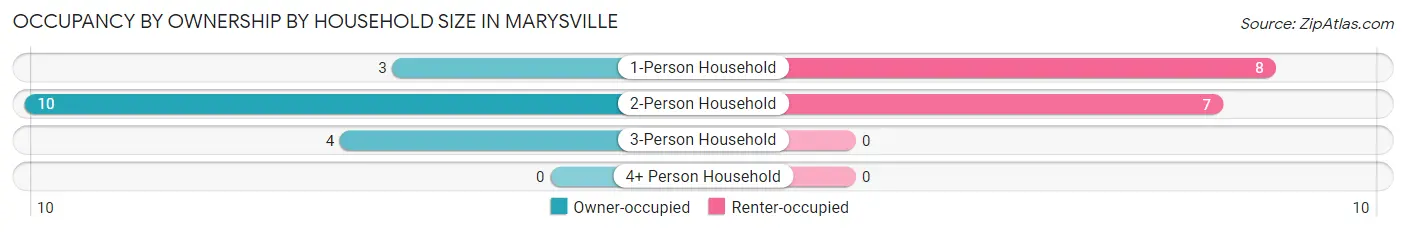
| Household Size | Owner-occupied | Renter-occupied |
| 1-Person Household | 3 (27.3%) | 8 (72.7%) |
| 2-Person Household | 10 (58.8%) | 7 (41.2%) |
| 3-Person Household | 4 (100.0%) | 0 (0.0%) |
| 4+ Person Household | 0 (0.0%) | 0 (0.0%) |
| Total Housing Units | 17 (53.1%) | 15 (46.9%) |
Occupancy by Educational Attainment in Marysville
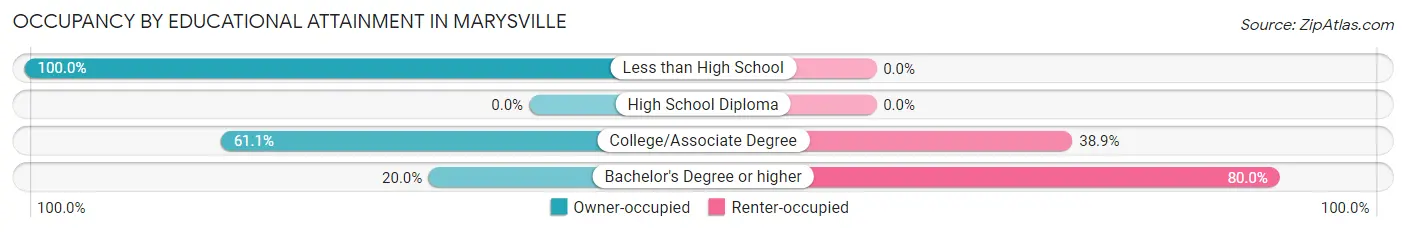
| Household Size | Owner-occupied | Renter-occupied |
| Less than High School | 4 (100.0%) | 0 (0.0%) |
| High School Diploma | 0 (0.0%) | 0 (0.0%) |
| College/Associate Degree | 11 (61.1%) | 7 (38.9%) |
| Bachelor's Degree or higher | 2 (20.0%) | 8 (80.0%) |
Occupancy by Age of Householder in Marysville
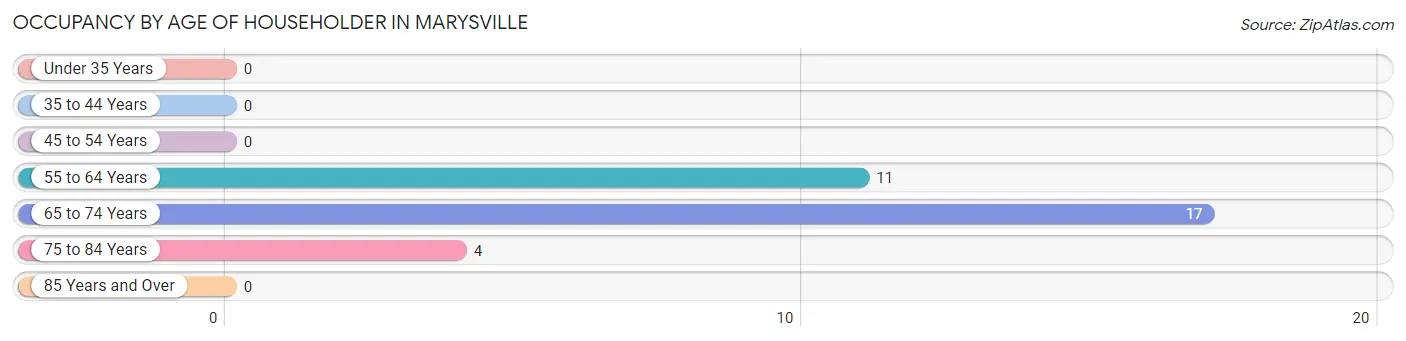
| Age Bracket | # Households | % Households |
| Under 35 Years | 0 | 0.0% |
| 35 to 44 Years | 0 | 0.0% |
| 45 to 54 Years | 0 | 0.0% |
| 55 to 64 Years | 11 | 34.4% |
| 65 to 74 Years | 17 | 53.1% |
| 75 to 84 Years | 4 | 12.5% |
| 85 Years and Over | 0 | 0.0% |
| Total | 32 | 100.0% |
Housing Finances in Marysville
Median Income by Occupancy in Marysville
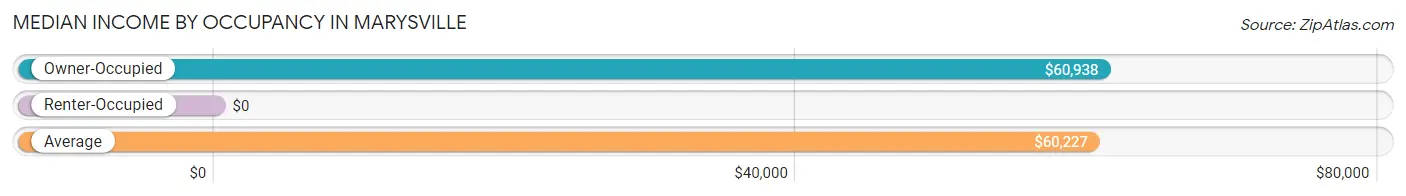
| Occupancy Type | # Households | Median Income |
| Owner-Occupied | 17 (53.1%) | $60,938 |
| Renter-Occupied | 15 (46.9%) | $0 |
| Average | 32 (100.0%) | $60,227 |
Occupancy by Householder Income Bracket in Marysville
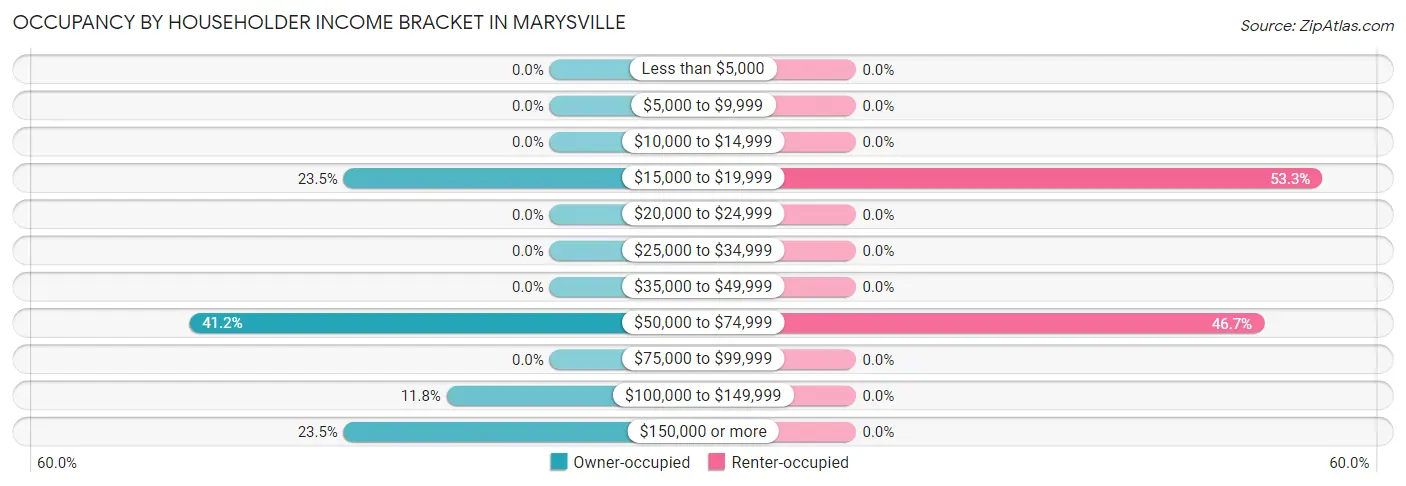
| Income Bracket | Owner-occupied | Renter-occupied |
| Less than $5,000 | 0 (0.0%) | 0 (0.0%) |
| $5,000 to $9,999 | 0 (0.0%) | 0 (0.0%) |
| $10,000 to $14,999 | 0 (0.0%) | 0 (0.0%) |
| $15,000 to $19,999 | 4 (23.5%) | 8 (53.3%) |
| $20,000 to $24,999 | 0 (0.0%) | 0 (0.0%) |
| $25,000 to $34,999 | 0 (0.0%) | 0 (0.0%) |
| $35,000 to $49,999 | 0 (0.0%) | 0 (0.0%) |
| $50,000 to $74,999 | 7 (41.2%) | 7 (46.7%) |
| $75,000 to $99,999 | 0 (0.0%) | 0 (0.0%) |
| $100,000 to $149,999 | 2 (11.8%) | 0 (0.0%) |
| $150,000 or more | 4 (23.5%) | 0 (0.0%) |
| Total | 17 (100.0%) | 15 (100.0%) |
Monthly Housing Cost Tiers in Marysville
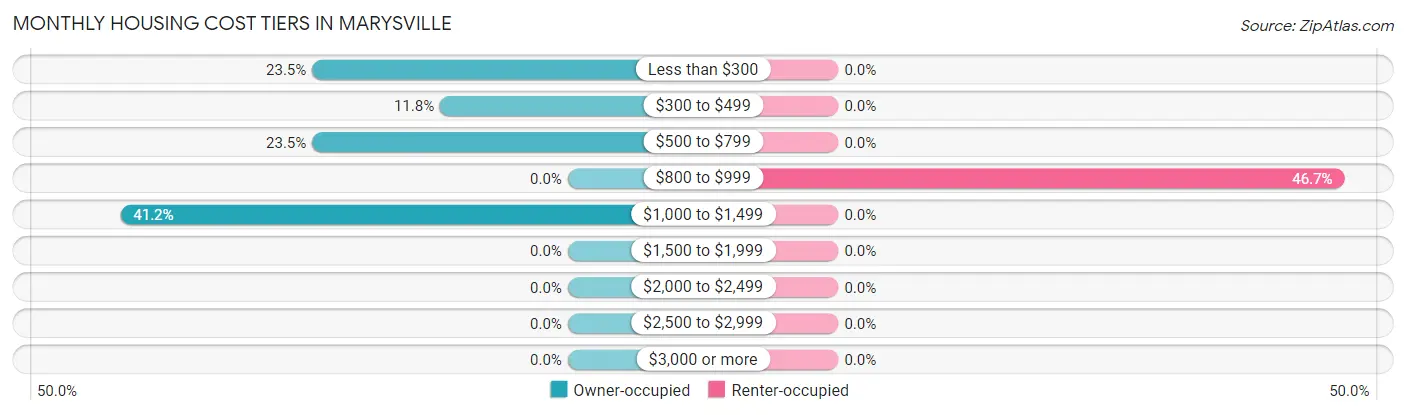
| Monthly Cost | Owner-occupied | Renter-occupied |
| Less than $300 | 4 (23.5%) | 0 (0.0%) |
| $300 to $499 | 2 (11.8%) | 0 (0.0%) |
| $500 to $799 | 4 (23.5%) | 0 (0.0%) |
| $800 to $999 | 0 (0.0%) | 7 (46.7%) |
| $1,000 to $1,499 | 7 (41.2%) | 0 (0.0%) |
| $1,500 to $1,999 | 0 (0.0%) | 0 (0.0%) |
| $2,000 to $2,499 | 0 (0.0%) | 0 (0.0%) |
| $2,500 to $2,999 | 0 (0.0%) | 0 (0.0%) |
| $3,000 or more | 0 (0.0%) | 0 (0.0%) |
| Total | 17 (100.0%) | 15 (100.0%) |
Physical Housing Characteristics in Marysville
Housing Structures in Marysville
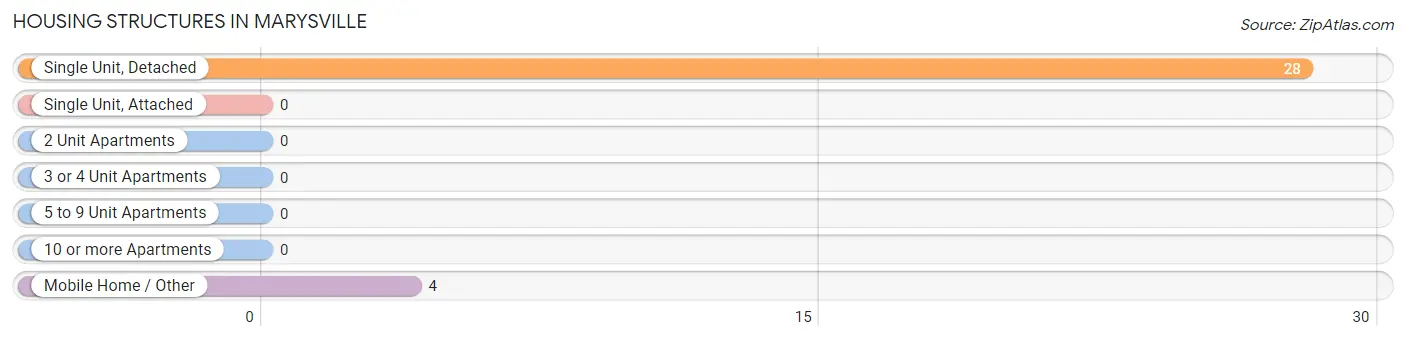
| Structure Type | # Housing Units | % Housing Units |
| Single Unit, Detached | 28 | 87.5% |
| Single Unit, Attached | 0 | 0.0% |
| 2 Unit Apartments | 0 | 0.0% |
| 3 or 4 Unit Apartments | 0 | 0.0% |
| 5 to 9 Unit Apartments | 0 | 0.0% |
| 10 or more Apartments | 0 | 0.0% |
| Mobile Home / Other | 4 | 12.5% |
| Total | 32 | 100.0% |
Housing Structures by Occupancy in Marysville
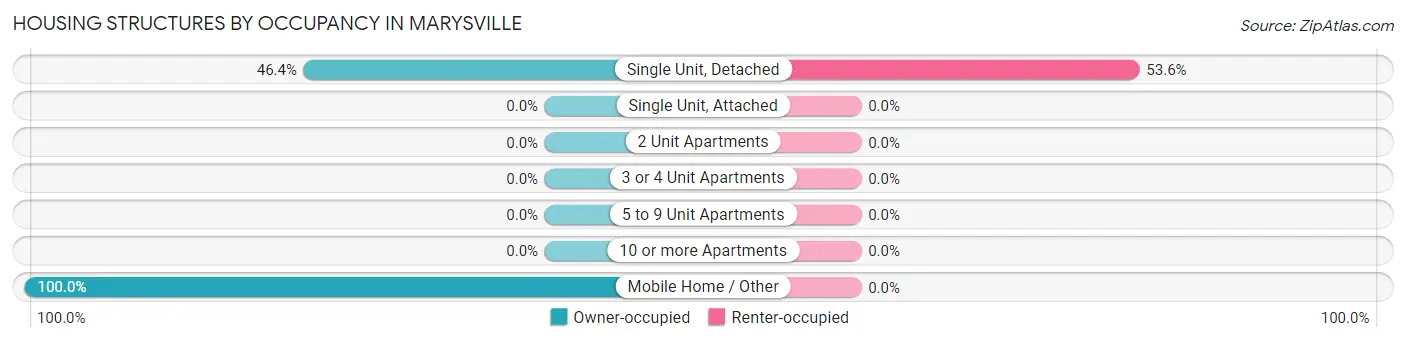
| Structure Type | Owner-occupied | Renter-occupied |
| Single Unit, Detached | 13 (46.4%) | 15 (53.6%) |
| Single Unit, Attached | 0 (0.0%) | 0 (0.0%) |
| 2 Unit Apartments | 0 (0.0%) | 0 (0.0%) |
| 3 or 4 Unit Apartments | 0 (0.0%) | 0 (0.0%) |
| 5 to 9 Unit Apartments | 0 (0.0%) | 0 (0.0%) |
| 10 or more Apartments | 0 (0.0%) | 0 (0.0%) |
| Mobile Home / Other | 4 (100.0%) | 0 (0.0%) |
| Total | 17 (53.1%) | 15 (46.9%) |
Housing Structures by Number of Rooms in Marysville
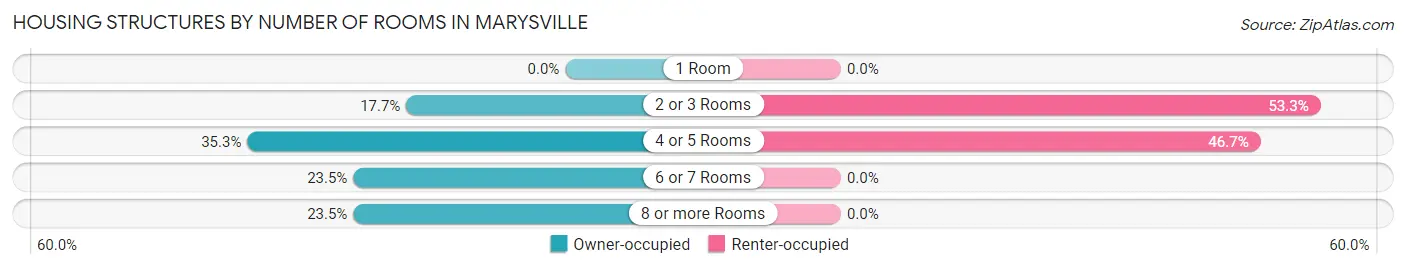
| Number of Rooms | Owner-occupied | Renter-occupied |
| 1 Room | 0 (0.0%) | 0 (0.0%) |
| 2 or 3 Rooms | 3 (17.6%) | 8 (53.3%) |
| 4 or 5 Rooms | 6 (35.3%) | 7 (46.7%) |
| 6 or 7 Rooms | 4 (23.5%) | 0 (0.0%) |
| 8 or more Rooms | 4 (23.5%) | 0 (0.0%) |
| Total | 17 (100.0%) | 15 (100.0%) |
Housing Structure by Heating Type in Marysville
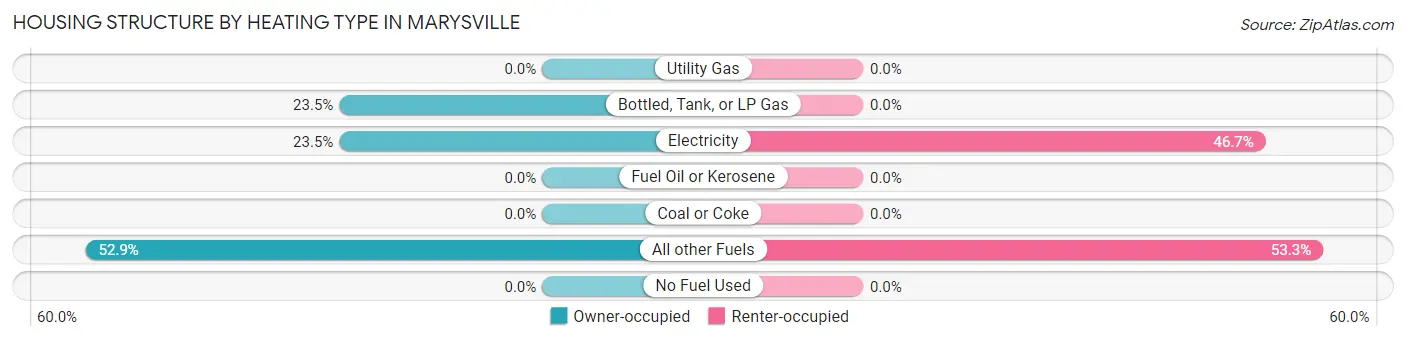
| Heating Type | Owner-occupied | Renter-occupied |
| Utility Gas | 0 (0.0%) | 0 (0.0%) |
| Bottled, Tank, or LP Gas | 4 (23.5%) | 0 (0.0%) |
| Electricity | 4 (23.5%) | 7 (46.7%) |
| Fuel Oil or Kerosene | 0 (0.0%) | 0 (0.0%) |
| Coal or Coke | 0 (0.0%) | 0 (0.0%) |
| All other Fuels | 9 (52.9%) | 8 (53.3%) |
| No Fuel Used | 0 (0.0%) | 0 (0.0%) |
| Total | 17 (100.0%) | 15 (100.0%) |
Household Vehicle Usage in Marysville
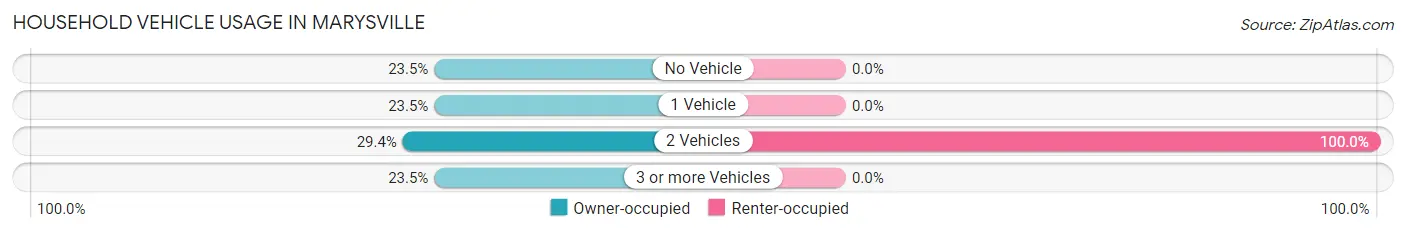
| Vehicles per Household | Owner-occupied | Renter-occupied |
| No Vehicle | 4 (23.5%) | 0 (0.0%) |
| 1 Vehicle | 4 (23.5%) | 0 (0.0%) |
| 2 Vehicles | 5 (29.4%) | 15 (100.0%) |
| 3 or more Vehicles | 4 (23.5%) | 0 (0.0%) |
| Total | 17 (100.0%) | 15 (100.0%) |
Real Estate & Mortgages in Marysville
Real Estate and Mortgage Overview in Marysville
| Characteristic | Without Mortgage | With Mortgage |
| Housing Units | 6 | 11 |
| Median Property Value | - | - |
| Median Household Income | - | - |
| Monthly Housing Costs | - | - |
| Real Estate Taxes | - | - |
Property Value by Mortgage Status in Marysville
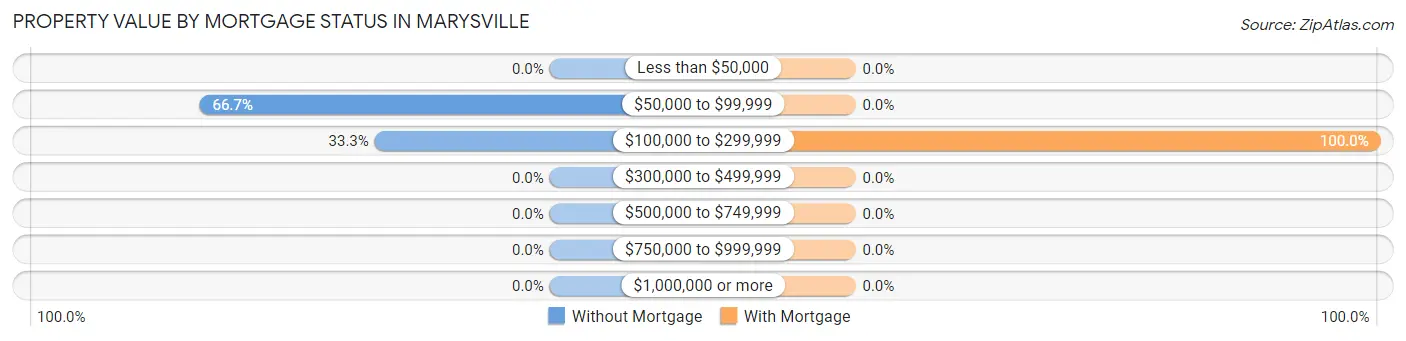
| Property Value | Without Mortgage | With Mortgage |
| Less than $50,000 | 0 (0.0%) | 0 (0.0%) |
| $50,000 to $99,999 | 4 (66.7%) | 0 (0.0%) |
| $100,000 to $299,999 | 2 (33.3%) | 11 (100.0%) |
| $300,000 to $499,999 | 0 (0.0%) | 0 (0.0%) |
| $500,000 to $749,999 | 0 (0.0%) | 0 (0.0%) |
| $750,000 to $999,999 | 0 (0.0%) | 0 (0.0%) |
| $1,000,000 or more | 0 (0.0%) | 0 (0.0%) |
| Total | 6 (100.0%) | 11 (100.0%) |
Household Income by Mortgage Status in Marysville
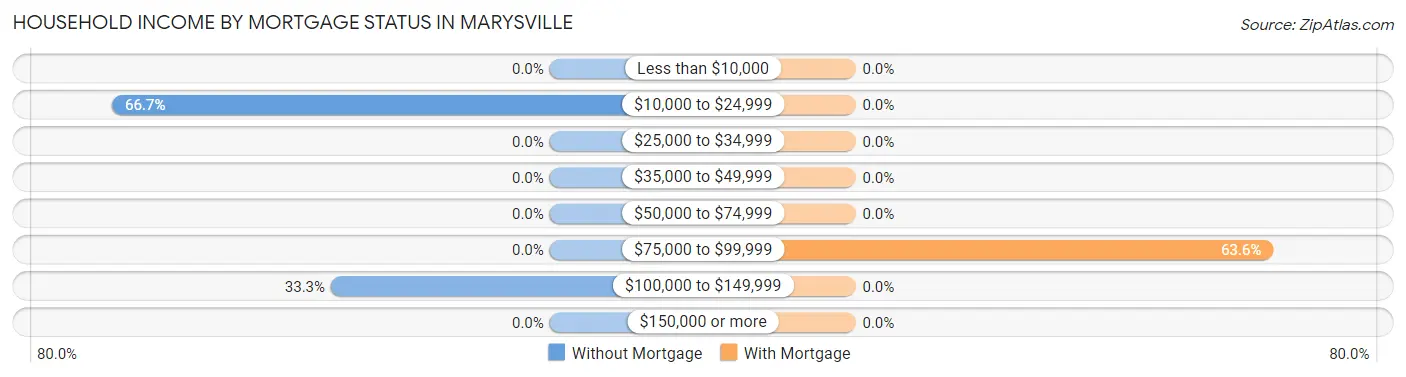
| Household Income | Without Mortgage | With Mortgage |
| Less than $10,000 | 0 (0.0%) | 0 (0.0%) |
| $10,000 to $24,999 | 4 (66.7%) | 0 (0.0%) |
| $25,000 to $34,999 | 0 (0.0%) | 0 (0.0%) |
| $35,000 to $49,999 | 0 (0.0%) | 0 (0.0%) |
| $50,000 to $74,999 | 0 (0.0%) | 0 (0.0%) |
| $75,000 to $99,999 | 0 (0.0%) | 7 (63.6%) |
| $100,000 to $149,999 | 2 (33.3%) | 0 (0.0%) |
| $150,000 or more | 0 (0.0%) | 0 (0.0%) |
| Total | 6 (100.0%) | 11 (100.0%) |
Property Value to Household Income Ratio in Marysville
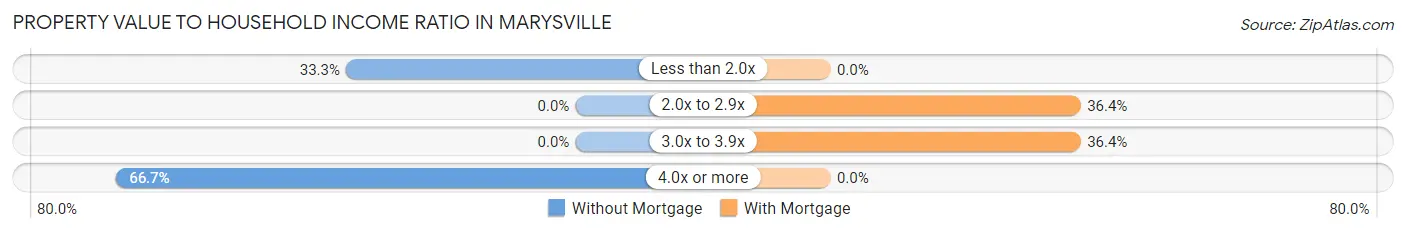
| Value-to-Income Ratio | Without Mortgage | With Mortgage |
| Less than 2.0x | 2 (33.3%) | 0 (0.0%) |
| 2.0x to 2.9x | 0 (0.0%) | 4 (36.4%) |
| 3.0x to 3.9x | 0 (0.0%) | 4 (36.4%) |
| 4.0x or more | 4 (66.7%) | 0 (0.0%) |
| Total | 6 (100.0%) | 11 (100.0%) |
Real Estate Taxes by Mortgage Status in Marysville
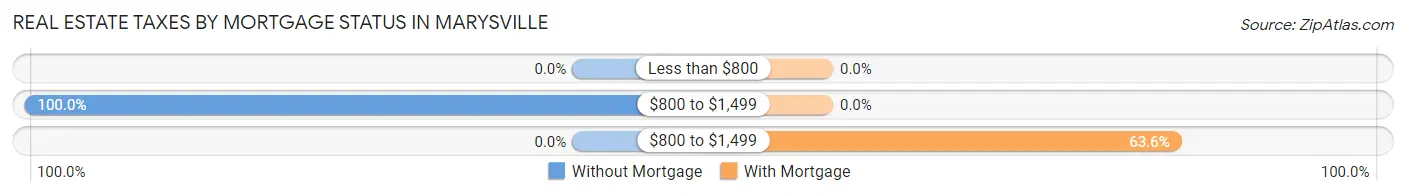
| Property Taxes | Without Mortgage | With Mortgage |
| Less than $800 | 0 (0.0%) | 0 (0.0%) |
| $800 to $1,499 | 6 (100.0%) | 0 (0.0%) |
| $800 to $1,499 | 0 (0.0%) | 7 (63.6%) |
| Total | 6 (100.0%) | 11 (100.0%) |
Health & Disability in Marysville
Health Insurance Coverage by Age in Marysville
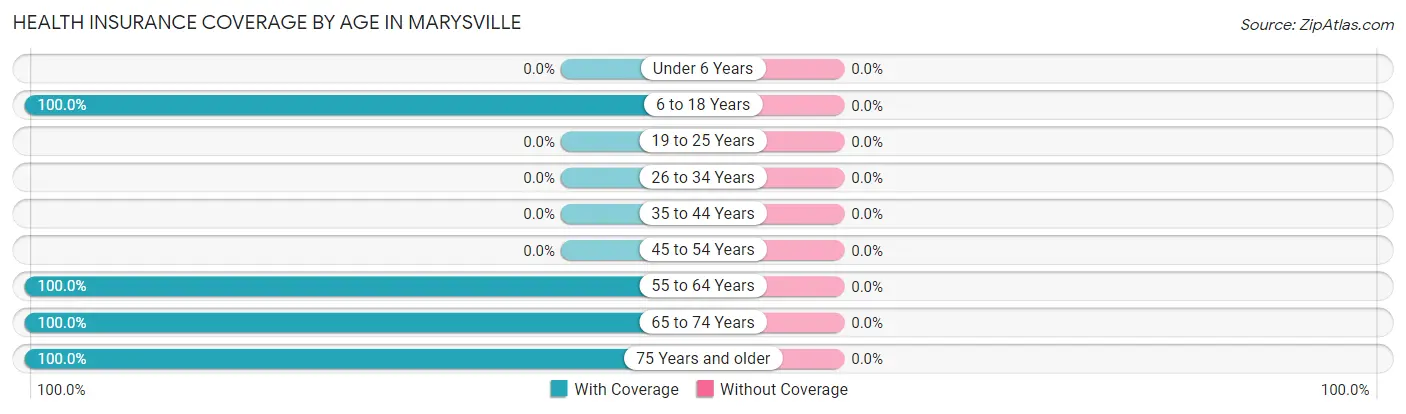
| Age Bracket | With Coverage | Without Coverage |
| Under 6 Years | 0 (0.0%) | 0 (0.0%) |
| 6 to 18 Years | 4 (100.0%) | 0 (0.0%) |
| 19 to 25 Years | 0 (0.0%) | 0 (0.0%) |
| 26 to 34 Years | 0 (0.0%) | 0 (0.0%) |
| 35 to 44 Years | 0 (0.0%) | 0 (0.0%) |
| 45 to 54 Years | 0 (0.0%) | 0 (0.0%) |
| 55 to 64 Years | 27 (100.0%) | 0 (0.0%) |
| 65 to 74 Years | 25 (100.0%) | 0 (0.0%) |
| 75 Years and older | 4 (100.0%) | 0 (0.0%) |
| Total | 60 (100.0%) | 0 (0.0%) |
Health Insurance Coverage by Citizenship Status in Marysville
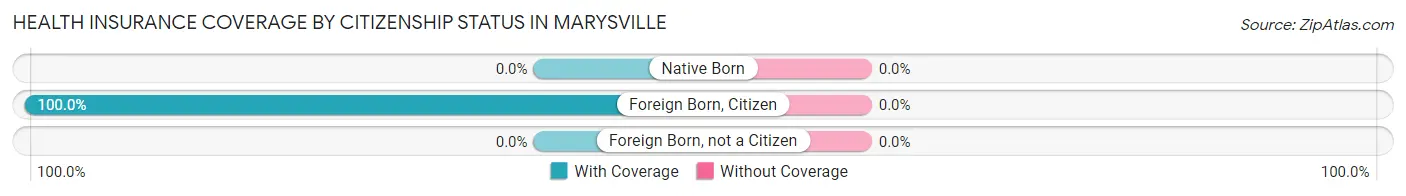
| Citizenship Status | With Coverage | Without Coverage |
| Native Born | 0 (0.0%) | 0 (0.0%) |
| Foreign Born, Citizen | 4 (100.0%) | 0 (0.0%) |
| Foreign Born, not a Citizen | 0 (0.0%) | 0 (0.0%) |
Health Insurance Coverage by Household Income in Marysville
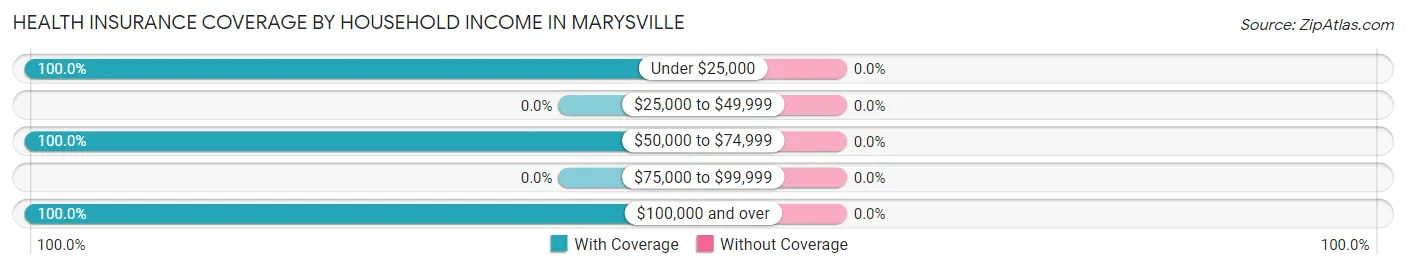
| Household Income | With Coverage | Without Coverage |
| Under $25,000 | 17 (100.0%) | 0 (0.0%) |
| $25,000 to $49,999 | 0 (0.0%) | 0 (0.0%) |
| $50,000 to $74,999 | 30 (100.0%) | 0 (0.0%) |
| $75,000 to $99,999 | 0 (0.0%) | 0 (0.0%) |
| $100,000 and over | 13 (100.0%) | 0 (0.0%) |
Public vs Private Health Insurance Coverage by Age in Marysville
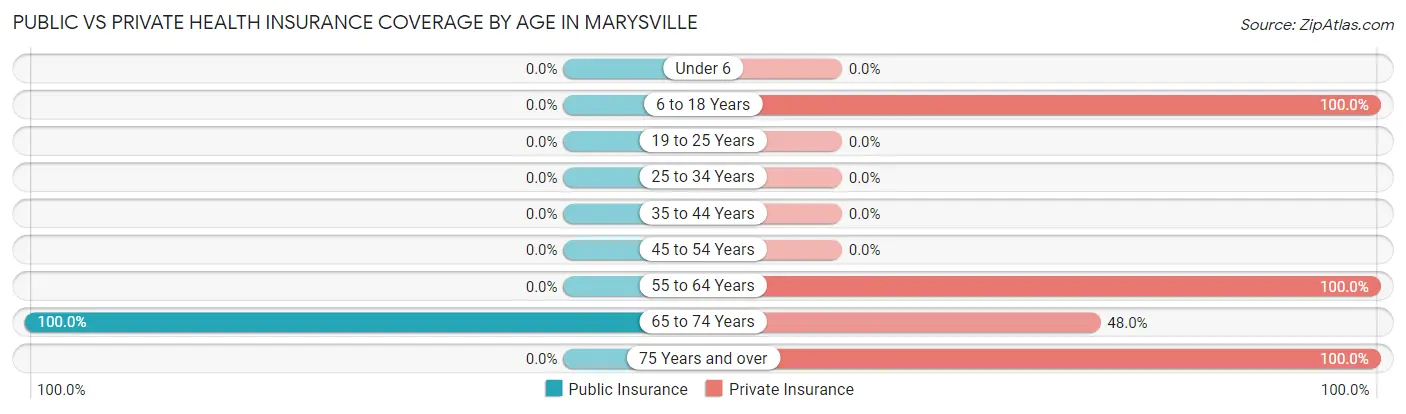
| Age Bracket | Public Insurance | Private Insurance |
| Under 6 | 0 (0.0%) | 0 (0.0%) |
| 6 to 18 Years | 0 (0.0%) | 4 (100.0%) |
| 19 to 25 Years | 0 (0.0%) | 0 (0.0%) |
| 25 to 34 Years | 0 (0.0%) | 0 (0.0%) |
| 35 to 44 Years | 0 (0.0%) | 0 (0.0%) |
| 45 to 54 Years | 0 (0.0%) | 0 (0.0%) |
| 55 to 64 Years | 0 (0.0%) | 27 (100.0%) |
| 65 to 74 Years | 25 (100.0%) | 12 (48.0%) |
| 75 Years and over | 0 (0.0%) | 4 (100.0%) |
| Total | 25 (41.7%) | 47 (78.3%) |
Disability Status by Sex by Age in Marysville
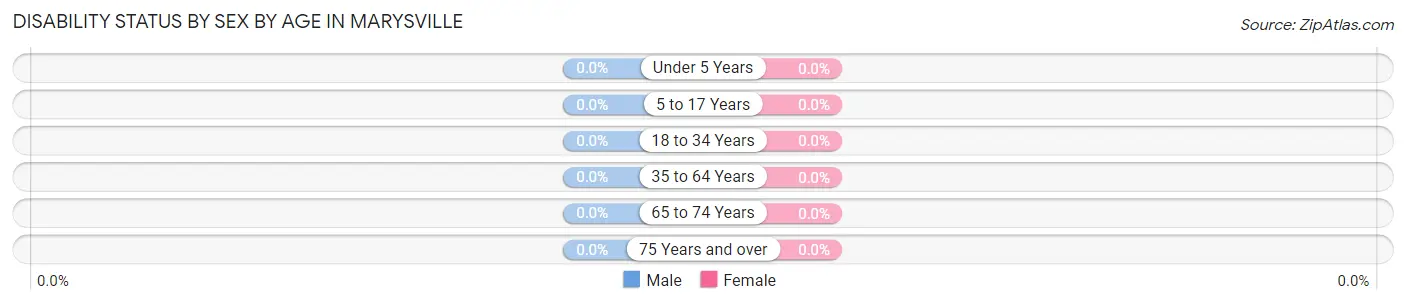
| Age Bracket | Male | Female |
| Under 5 Years | 0 (0.0%) | 0 (0.0%) |
| 5 to 17 Years | 0 (0.0%) | 0 (0.0%) |
| 18 to 34 Years | 0 (0.0%) | 0 (0.0%) |
| 35 to 64 Years | 0 (0.0%) | 0 (0.0%) |
| 65 to 74 Years | 0 (0.0%) | 0 (0.0%) |
| 75 Years and over | 0 (0.0%) | 0 (0.0%) |
Disability Class by Sex by Age in Marysville
Disability Class: Hearing Difficulty
| Age Bracket | Male | Female |
| Under 5 Years | 0 (0.0%) | 0 (0.0%) |
| 5 to 17 Years | 0 (0.0%) | 0 (0.0%) |
| 18 to 34 Years | 0 (0.0%) | 0 (0.0%) |
| 35 to 64 Years | 0 (0.0%) | 0 (0.0%) |
| 65 to 74 Years | 0 (0.0%) | 0 (0.0%) |
| 75 Years and over | 0 (0.0%) | 0 (0.0%) |
Disability Class: Vision Difficulty
| Age Bracket | Male | Female |
| Under 5 Years | 0 (0.0%) | 0 (0.0%) |
| 5 to 17 Years | 0 (0.0%) | 0 (0.0%) |
| 18 to 34 Years | 0 (0.0%) | 0 (0.0%) |
| 35 to 64 Years | 0 (0.0%) | 0 (0.0%) |
| 65 to 74 Years | 0 (0.0%) | 0 (0.0%) |
| 75 Years and over | 0 (0.0%) | 0 (0.0%) |
Disability Class: Cognitive Difficulty
| Age Bracket | Male | Female |
| 5 to 17 Years | 0 (0.0%) | 0 (0.0%) |
| 18 to 34 Years | 0 (0.0%) | 0 (0.0%) |
| 35 to 64 Years | 0 (0.0%) | 0 (0.0%) |
| 65 to 74 Years | 0 (0.0%) | 0 (0.0%) |
| 75 Years and over | 0 (0.0%) | 0 (0.0%) |
Disability Class: Ambulatory Difficulty
| Age Bracket | Male | Female |
| 5 to 17 Years | 0 (0.0%) | 0 (0.0%) |
| 18 to 34 Years | 0 (0.0%) | 0 (0.0%) |
| 35 to 64 Years | 0 (0.0%) | 0 (0.0%) |
| 65 to 74 Years | 0 (0.0%) | 0 (0.0%) |
| 75 Years and over | 0 (0.0%) | 0 (0.0%) |
Disability Class: Self-Care Difficulty
| Age Bracket | Male | Female |
| 5 to 17 Years | 0 (0.0%) | 0 (0.0%) |
| 18 to 34 Years | 0 (0.0%) | 0 (0.0%) |
| 35 to 64 Years | 0 (0.0%) | 0 (0.0%) |
| 65 to 74 Years | 0 (0.0%) | 0 (0.0%) |
| 75 Years and over | 0 (0.0%) | 0 (0.0%) |
Technology Access in Marysville
Computing Device Access in Marysville
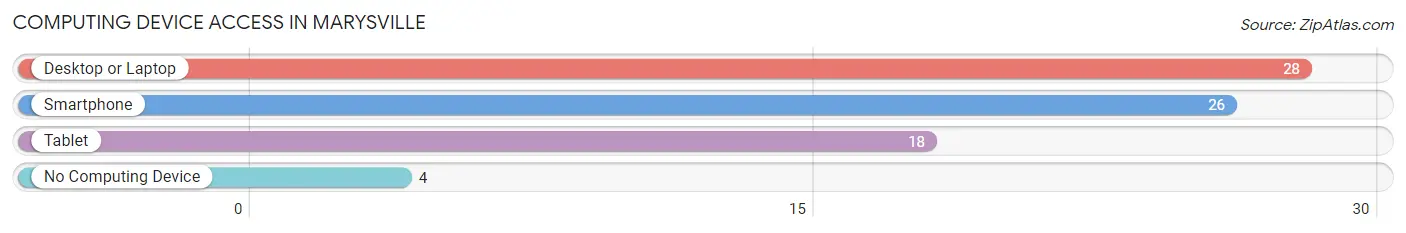
| Device Type | # Households | % Households |
| Desktop or Laptop | 28 | 87.5% |
| Smartphone | 26 | 81.2% |
| Tablet | 18 | 56.2% |
| No Computing Device | 4 | 12.5% |
| Total | 32 | 100.0% |
Internet Access in Marysville
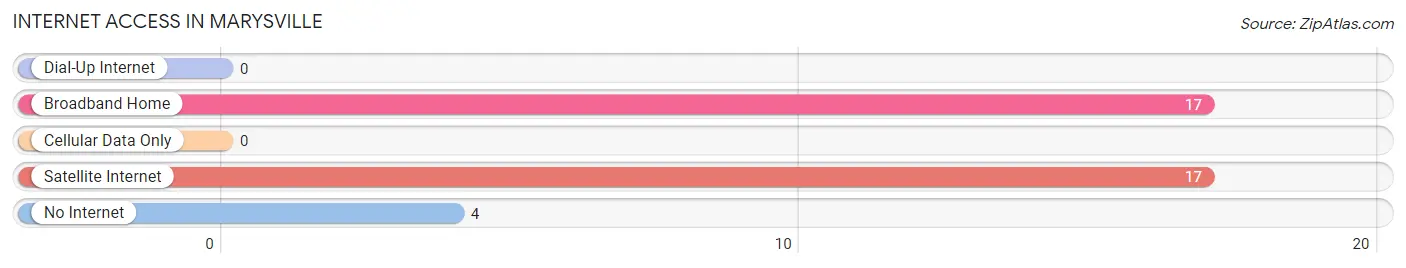
| Internet Type | # Households | % Households |
| Dial-Up Internet | 0 | 0.0% |
| Broadband Home | 17 | 53.1% |
| Cellular Data Only | 0 | 0.0% |
| Satellite Internet | 17 | 53.1% |
| No Internet | 4 | 12.5% |
| Total | 32 | 100.0% |
Marysville Summary
Marysville, Montana is a small town located in the western part of the state, near the Idaho border. It is situated in the foothills of the Rocky Mountains, and is surrounded by beautiful scenery. The town has a population of just over 500 people, and is the county seat of Lewis and Clark County.
History
Marysville was founded in 1864 by a group of miners who were looking for gold in the area. The town was named after Mary, the wife of one of the miners. The town quickly grew, and by 1868 it had become the county seat of Lewis and Clark County.
In the late 1800s, Marysville was a bustling town with a variety of businesses, including a hotel, a bank, a newspaper, and a stagecoach line. The town was also home to a number of saloons and gambling halls.
In the early 1900s, Marysville began to decline as the gold rush ended and the population began to move away. The town was nearly abandoned by the 1940s, but was revived in the 1950s when the nearby Fort Harrison military base was established.
Geography
Marysville is located in the western part of Montana, near the Idaho border. It is situated in the foothills of the Rocky Mountains, and is surrounded by beautiful scenery. The town is located at an elevation of 4,000 feet, and has a total area of 0.6 square miles.
The climate in Marysville is semi-arid, with hot summers and cold winters. The average annual temperature is around 50 degrees Fahrenheit, and the average annual precipitation is around 15 inches.
Economy
The economy of Marysville is largely based on tourism and agriculture. The town is home to a number of tourist attractions, including the Lewis and Clark National Historic Trail, the Lewis and Clark Interpretive Center, and the Fort Harrison Military Base.
Agriculture is also an important part of the local economy. The area is home to a number of farms, and the main crops grown in the area are wheat, barley, and hay.
Demographics
As of the 2010 census, the population of Marysville was 517. The racial makeup of the town was 95.3% White, 0.6% Native American, 0.2% Asian, 0.2% from other races, and 3.7% from two or more races.
The median household income in Marysville was $37,500, and the median family income was $41,250. The per capita income was $17,500. The town has a poverty rate of 16.7%.
Conclusion
Marysville, Montana is a small town located in the western part of the state, near the Idaho border. It is situated in the foothills of the Rocky Mountains, and is surrounded by beautiful scenery. The town has a population of just over 500 people, and is the county seat of Lewis and Clark County. The economy of Marysville is largely based on tourism and agriculture, and the town is home to a number of tourist attractions. The racial makeup of the town is mostly White, with a small percentage of Native American and Asian residents. The median household income in Marysville is $37,500, and the poverty rate is 16.7%.
Common Questions
What is Per Capita Income in Marysville?
Per Capita income in Marysville is $33,132.
What is the Median Family Income in Marysville?
Median Family Income in Marysville is $103,750.
What is the Median Household income in Marysville?
Median Household Income in Marysville is $60,227.
What is Inequality or Gini Index in Marysville?
Inequality or Gini Index in Marysville is 0.39.
What is the Total Population of Marysville?
Total Population of Marysville is 60.
What is the Total Male Population of Marysville?
Total Male Population of Marysville is 37.
What is the Total Female Population of Marysville?
Total Female Population of Marysville is 23.
What is the Ratio of Males per 100 Females in Marysville?
There are 160.87 Males per 100 Females in Marysville.
What is the Ratio of Females per 100 Males in Marysville?
There are 62.16 Females per 100 Males in Marysville.
What is the Median Population Age in Marysville?
Median Population Age in Marysville is 61.9 Years.
What is the Average Family Size in Marysville
Average Family Size in Marysville is 2.5 People.
What is the Average Household Size in Marysville
Average Household Size in Marysville is 1.9 People.
How Large is the Labor Force in Marysville?
There are 37 People in the Labor Forcein in Marysville.
What is the Percentage of People in the Labor Force in Marysville?
61.7% of People are in the Labor Force in Marysville.