Turah, MT Map & Demographics
Turah Map
Turah Overview
$56,165
PER CAPITA INCOME
$124,464
AVG FAMILY INCOME
$123,393
AVG HOUSEHOLD INCOME
34.9%
WAGE / INCOME GAP [ % ]
65.1¢/ $1
WAGE / INCOME GAP [ $ ]
0.36
INEQUALITY / GINI INDEX
466
TOTAL POPULATION
265
MALE POPULATION
201
FEMALE POPULATION
131.84
MALES / 100 FEMALES
75.85
FEMALES / 100 MALES
43.6
MEDIAN AGE
3.0
AVG FAMILY SIZE
2.8
AVG HOUSEHOLD SIZE
286
LABOR FORCE [ PEOPLE ]
77.9%
PERCENT IN LABOR FORCE
8.7%
UNEMPLOYMENT RATE
Income in Turah
Income Overview in Turah
Per Capita Income in Turah is $56,165, while median incomes of families and households are $124,464 and $123,393 respectively.
| Characteristic | Number | Measure |
| Per Capita Income | 466 | $56,165 |
| Median Family Income | 122 | $124,464 |
| Mean Family Income | 122 | $187,441 |
| Median Household Income | 164 | $123,393 |
| Mean Household Income | 164 | $166,896 |
| Income Deficit | 122 | $0 |
| Wage / Income Gap (%) | 466 | 34.92% |
| Wage / Income Gap ($) | 466 | 65.08¢ per $1 |
| Gini / Inequality Index | 466 | 0.36 |
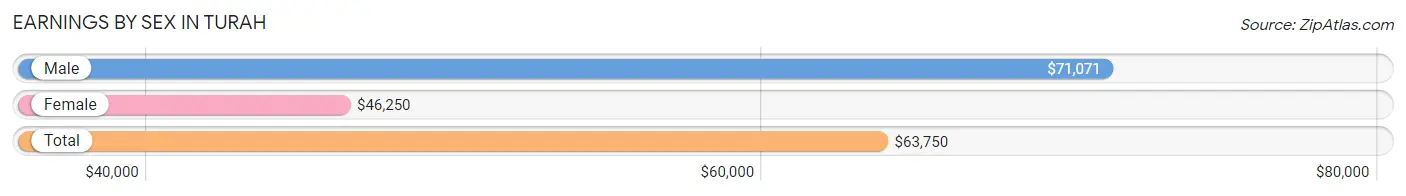
Earnings by Sex in Turah
Average Earnings in Turah are $63,750, $71,071 for men and $46,250 for women, a difference of 34.9%.
| Sex | Number | Average Earnings |
| Male | 150 (49.2%) | $71,071 |
| Female | 155 (50.8%) | $46,250 |
| Total | 305 (100.0%) | $63,750 |
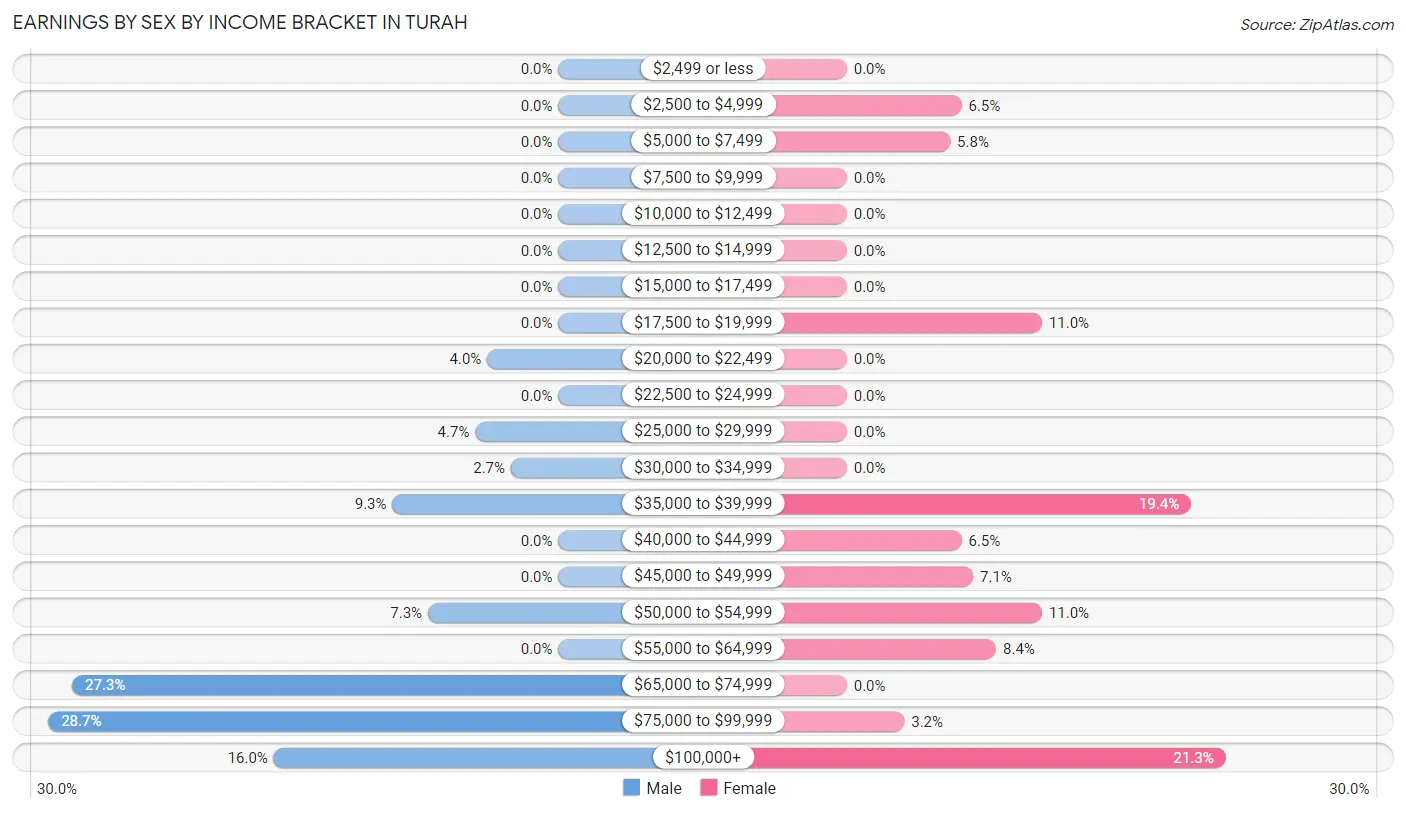
Earnings by Sex by Income Bracket in Turah
The most common earnings brackets in Turah are $75,000 to $99,999 for men (43 | 28.7%) and $100,000+ for women (33 | 21.3%).
| Income | Male | Female |
| $2,499 or less | 0 (0.0%) | 0 (0.0%) |
| $2,500 to $4,999 | 0 (0.0%) | 10 (6.5%) |
| $5,000 to $7,499 | 0 (0.0%) | 9 (5.8%) |
| $7,500 to $9,999 | 0 (0.0%) | 0 (0.0%) |
| $10,000 to $12,499 | 0 (0.0%) | 0 (0.0%) |
| $12,500 to $14,999 | 0 (0.0%) | 0 (0.0%) |
| $15,000 to $17,499 | 0 (0.0%) | 0 (0.0%) |
| $17,500 to $19,999 | 0 (0.0%) | 17 (11.0%) |
| $20,000 to $22,499 | 6 (4.0%) | 0 (0.0%) |
| $22,500 to $24,999 | 0 (0.0%) | 0 (0.0%) |
| $25,000 to $29,999 | 7 (4.7%) | 0 (0.0%) |
| $30,000 to $34,999 | 4 (2.7%) | 0 (0.0%) |
| $35,000 to $39,999 | 14 (9.3%) | 30 (19.4%) |
| $40,000 to $44,999 | 0 (0.0%) | 10 (6.5%) |
| $45,000 to $49,999 | 0 (0.0%) | 11 (7.1%) |
| $50,000 to $54,999 | 11 (7.3%) | 17 (11.0%) |
| $55,000 to $64,999 | 0 (0.0%) | 13 (8.4%) |
| $65,000 to $74,999 | 41 (27.3%) | 0 (0.0%) |
| $75,000 to $99,999 | 43 (28.7%) | 5 (3.2%) |
| $100,000+ | 24 (16.0%) | 33 (21.3%) |
| Total | 150 (100.0%) | 155 (100.0%) |
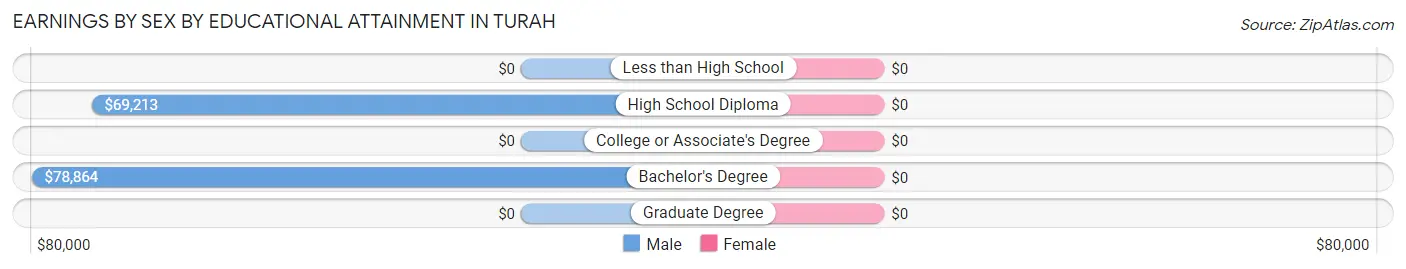
Earnings by Sex by Educational Attainment in Turah
| Educational Attainment | Male Income | Female Income |
| Less than High School | - | - |
| High School Diploma | $69,213 | $0 |
| College or Associate's Degree | - | - |
| Bachelor's Degree | $78,864 | $0 |
| Graduate Degree | - | - |
| Total | $77,552 | $53,088 |
Family Income in Turah
Family Income Brackets in Turah
According to the Turah family income data, there are 34 families falling into the $100,000 to $149,999 income range, which is the most common income bracket and makes up 27.9% of all families.
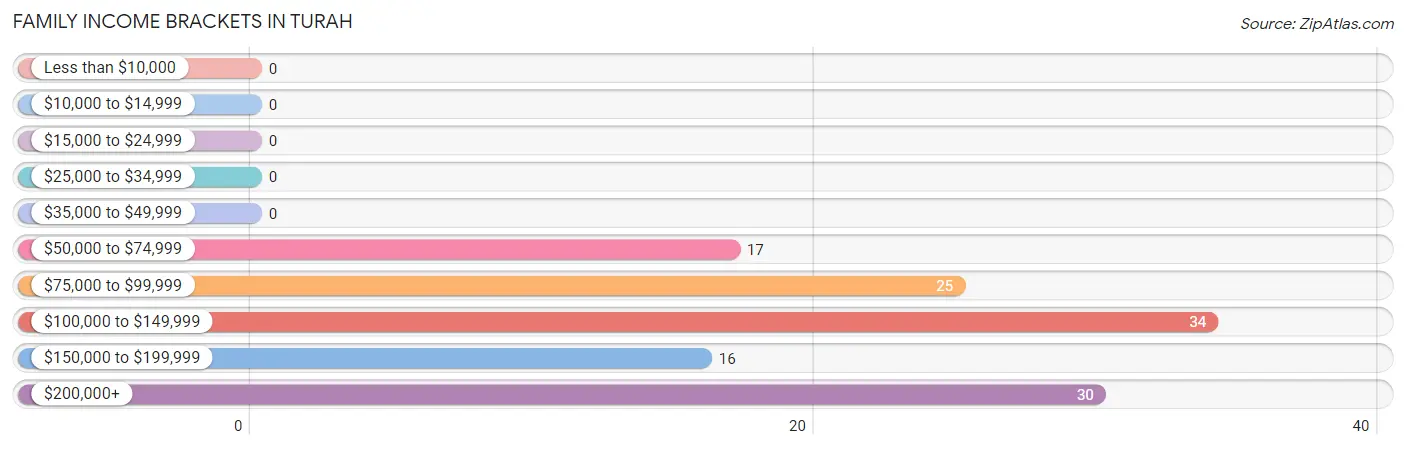
| Income Bracket | # Families | % Families |
| Less than $10,000 | 0 | 0.0% |
| $10,000 to $14,999 | 0 | 0.0% |
| $15,000 to $24,999 | 0 | 0.0% |
| $25,000 to $34,999 | 0 | 0.0% |
| $35,000 to $49,999 | 0 | 0.0% |
| $50,000 to $74,999 | 17 | 13.9% |
| $75,000 to $99,999 | 25 | 20.5% |
| $100,000 to $149,999 | 34 | 27.9% |
| $150,000 to $199,999 | 16 | 13.1% |
| $200,000+ | 30 | 24.6% |
Family Income by Famaliy Size in Turah
2-person families (55 | 45.1%) account for the highest median family income in Turah with $124,554 per family, while 2-person families (55 | 45.1%) have the highest median income of $62,277 per family member.
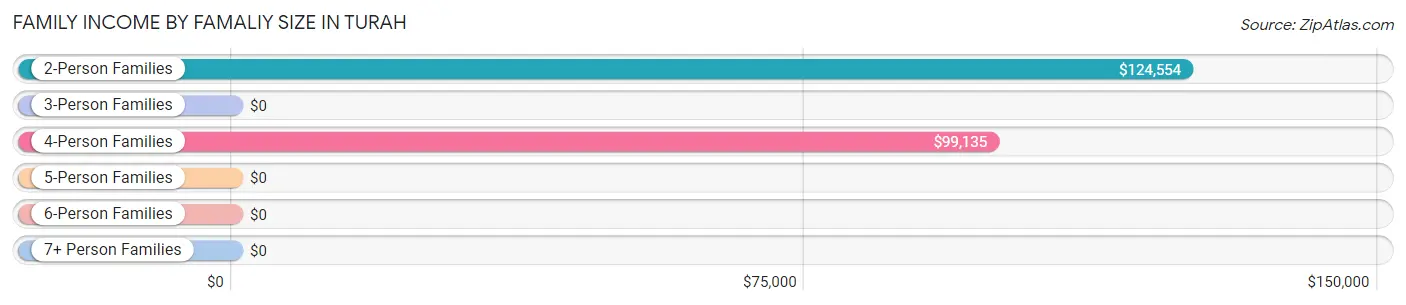
| Income Bracket | # Families | Median Income |
| 2-Person Families | 55 (45.1%) | $124,554 |
| 3-Person Families | 32 (26.2%) | $0 |
| 4-Person Families | 31 (25.4%) | $99,135 |
| 5-Person Families | 0 (0.0%) | $0 |
| 6-Person Families | 4 (3.3%) | $0 |
| 7+ Person Families | 0 (0.0%) | $0 |
| Total | 122 (100.0%) | $124,464 |
Family Income by Number of Earners in Turah
The median family income in Turah is $124,464, with families comprising 3+ earners (25) having the highest median family income of $250,001, while families with no earners (18) have the lowest median family income of $63,750, accounting for 20.5% and 14.7% of families, respectively.
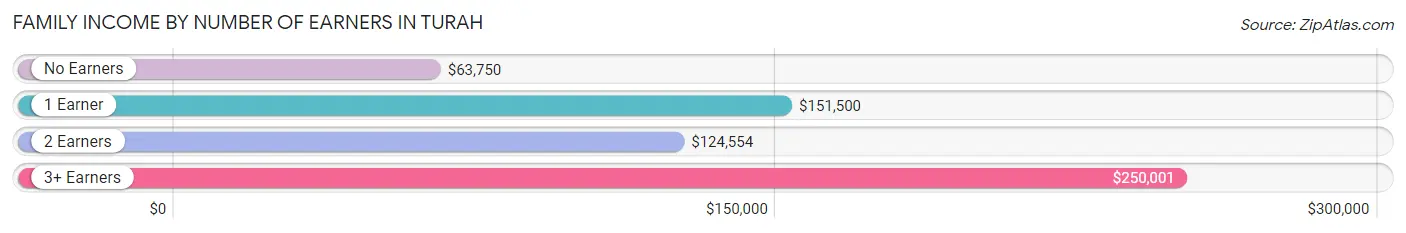
| Number of Earners | # Families | Median Income |
| No Earners | 18 (14.7%) | $63,750 |
| 1 Earner | 16 (13.1%) | $151,500 |
| 2 Earners | 63 (51.6%) | $124,554 |
| 3+ Earners | 25 (20.5%) | $250,001 |
| Total | 122 (100.0%) | $124,464 |
Household Income in Turah
Household Income Brackets in Turah
With 76 households falling in the category, the $100,000 to $149,999 income range is the most frequent in Turah, accounting for 46.3% of all households.
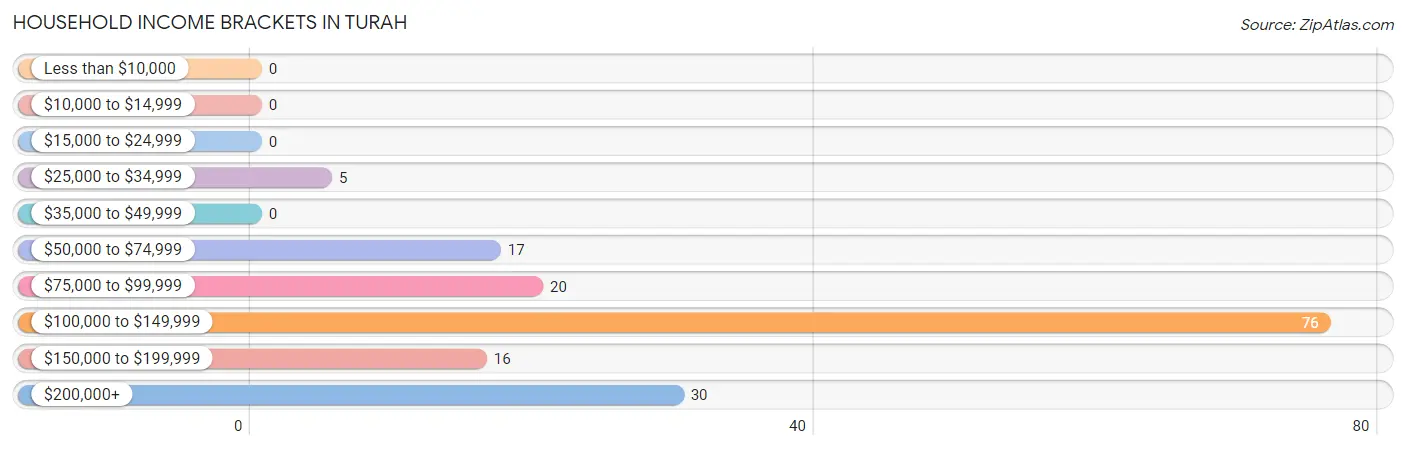
| Income Bracket | # Households | % Households |
| Less than $10,000 | 0 | 0.0% |
| $10,000 to $14,999 | 0 | 0.0% |
| $15,000 to $24,999 | 0 | 0.0% |
| $25,000 to $34,999 | 5 | 3.0% |
| $35,000 to $49,999 | 0 | 0.0% |
| $50,000 to $74,999 | 17 | 10.4% |
| $75,000 to $99,999 | 20 | 12.2% |
| $100,000 to $149,999 | 76 | 46.3% |
| $150,000 to $199,999 | 16 | 9.8% |
| $200,000+ | 30 | 18.3% |
Household Income by Householder Age in Turah
The median household income in Turah is $123,393, with the highest median household income of $131,000 found in the 25 to 44 years age bracket for the primary householder. A total of 48 households (29.3%) fall into this category.
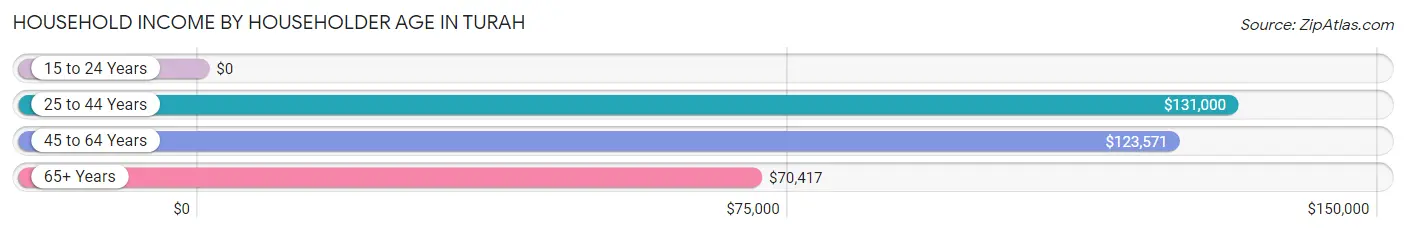
| Income Bracket | # Households | Median Income |
| 15 to 24 Years | 0 (0.0%) | $0 |
| 25 to 44 Years | 48 (29.3%) | $131,000 |
| 45 to 64 Years | 82 (50.0%) | $123,571 |
| 65+ Years | 34 (20.7%) | $70,417 |
| Total | 164 (100.0%) | $123,393 |
Poverty in Turah
Income Below Poverty by Sex and Age in Turah
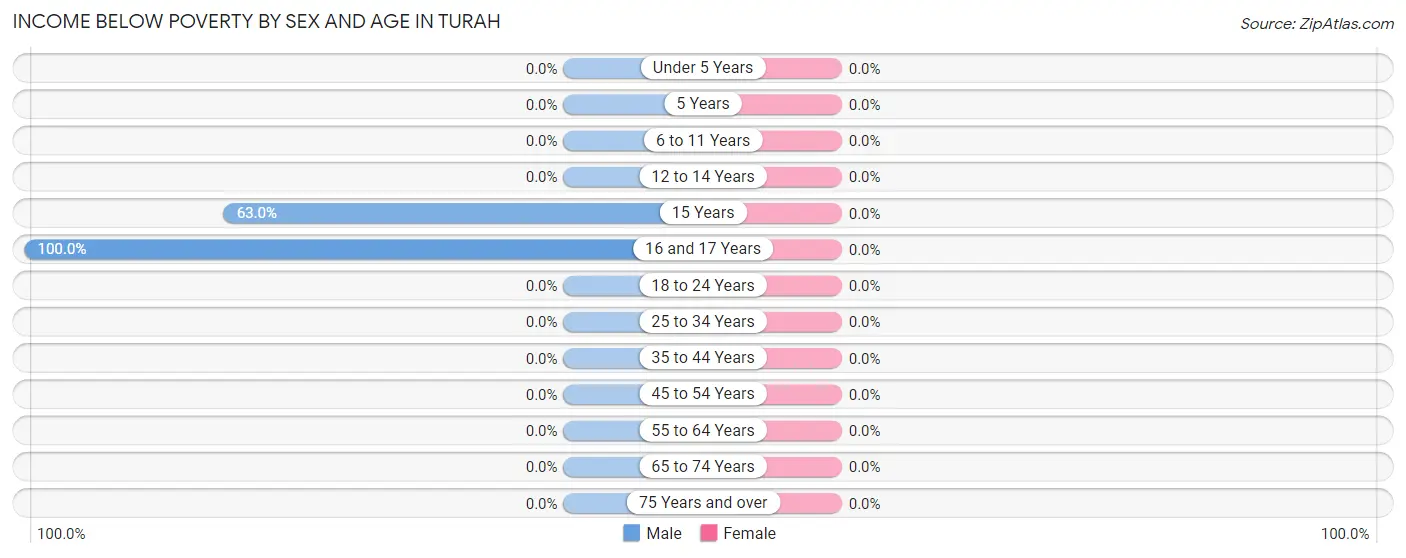
| Age Bracket | Male | Female |
| Under 5 Years | 0 (0.0%) | 0 (0.0%) |
| 5 Years | 0 (0.0%) | 0 (0.0%) |
| 6 to 11 Years | 0 (0.0%) | 0 (0.0%) |
| 12 to 14 Years | 0 (0.0%) | 0 (0.0%) |
| 15 Years | 29 (63.0%) | 0 (0.0%) |
| 16 and 17 Years | 5 (100.0%) | 0 (0.0%) |
| 18 to 24 Years | 0 (0.0%) | 0 (0.0%) |
| 25 to 34 Years | 0 (0.0%) | 0 (0.0%) |
| 35 to 44 Years | 0 (0.0%) | 0 (0.0%) |
| 45 to 54 Years | 0 (0.0%) | 0 (0.0%) |
| 55 to 64 Years | 0 (0.0%) | 0 (0.0%) |
| 65 to 74 Years | 0 (0.0%) | 0 (0.0%) |
| 75 Years and over | 0 (0.0%) | 0 (0.0%) |
| Total | 34 (12.8%) | 0 (0.0%) |
Income Above Poverty by Sex and Age in Turah
According to the poverty statistics in Turah, males aged under 5 years and females aged under 5 years are the age groups that are most secure financially, with 100.0% of males and 100.0% of females in these age groups living above the poverty line.
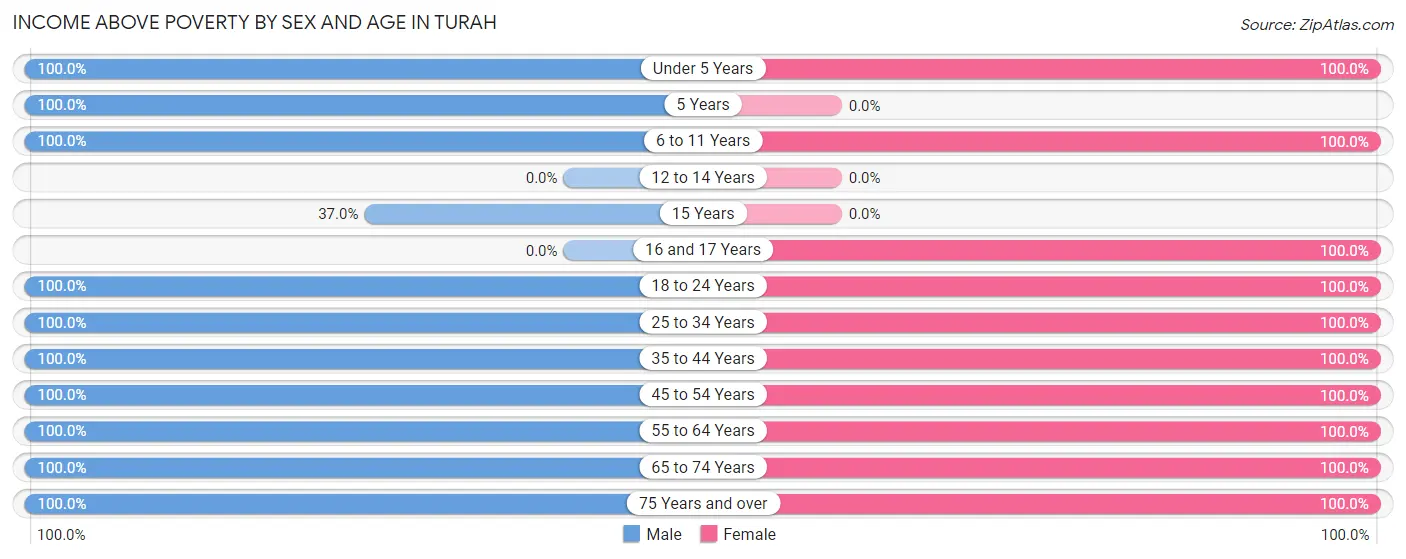
| Age Bracket | Male | Female |
| Under 5 Years | 18 (100.0%) | 4 (100.0%) |
| 5 Years | 6 (100.0%) | 0 (0.0%) |
| 6 to 11 Years | 11 (100.0%) | 14 (100.0%) |
| 12 to 14 Years | 0 (0.0%) | 0 (0.0%) |
| 15 Years | 17 (37.0%) | 0 (0.0%) |
| 16 and 17 Years | 0 (0.0%) | 10 (100.0%) |
| 18 to 24 Years | 17 (100.0%) | 17 (100.0%) |
| 25 to 34 Years | 9 (100.0%) | 3 (100.0%) |
| 35 to 44 Years | 49 (100.0%) | 46 (100.0%) |
| 45 to 54 Years | 56 (100.0%) | 42 (100.0%) |
| 55 to 64 Years | 19 (100.0%) | 18 (100.0%) |
| 65 to 74 Years | 16 (100.0%) | 29 (100.0%) |
| 75 Years and over | 13 (100.0%) | 18 (100.0%) |
| Total | 231 (87.2%) | 201 (100.0%) |
Income Below Poverty Among Married-Couple Families in Turah
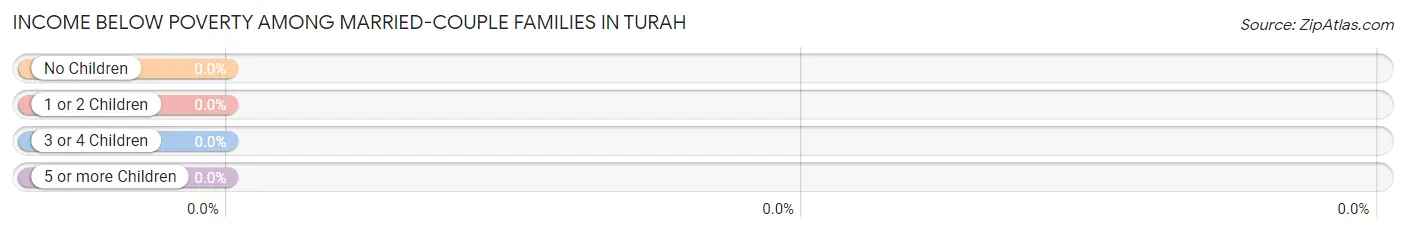
| Children | Above Poverty | Below Poverty |
| No Children | 60 (100.0%) | 0 (0.0%) |
| 1 or 2 Children | 31 (100.0%) | 0 (0.0%) |
| 3 or 4 Children | 0 (0.0%) | 0 (0.0%) |
| 5 or more Children | 0 (0.0%) | 0 (0.0%) |
| Total | 91 (100.0%) | 0 (0.0%) |
Income Below Poverty Among Single-Parent Households in Turah
| Children | Single Father | Single Mother |
| No Children | 0 (0.0%) | 0 (0.0%) |
| 1 or 2 Children | 0 (0.0%) | 0 (0.0%) |
| 3 or 4 Children | 0 (0.0%) | 0 (0.0%) |
| 5 or more Children | 0 (0.0%) | 0 (0.0%) |
| Total | 0 (0.0%) | 0 (0.0%) |
Income Below Poverty Among Married-Couple vs Single-Parent Households in Turah
| Children | Married-Couple Families | Single-Parent Households |
| No Children | 0 (0.0%) | 0 (0.0%) |
| 1 or 2 Children | 0 (0.0%) | 0 (0.0%) |
| 3 or 4 Children | 0 (0.0%) | 0 (0.0%) |
| 5 or more Children | 0 (0.0%) | 0 (0.0%) |
| Total | 0 (0.0%) | 0 (0.0%) |
Race in Turah
The most populous races in Turah are White / Caucasian (445 | 95.5%), Two or more Races (12 | 2.6%), and Asian (9 | 1.9%).
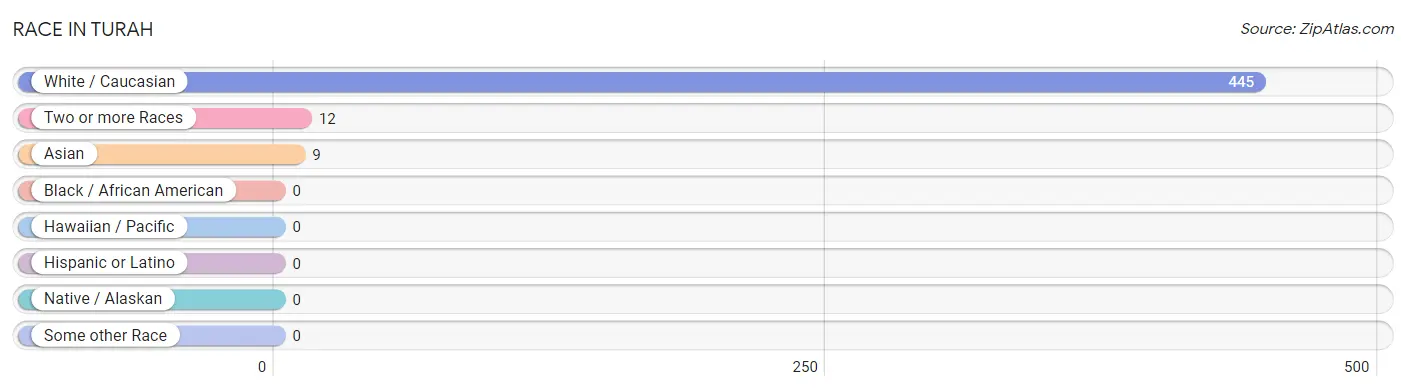
| Race | # Population | % Population |
| Asian | 9 | 1.9% |
| Black / African American | 0 | 0.0% |
| Hawaiian / Pacific | 0 | 0.0% |
| Hispanic or Latino | 0 | 0.0% |
| Native / Alaskan | 0 | 0.0% |
| White / Caucasian | 445 | 95.5% |
| Two or more Races | 12 | 2.6% |
| Some other Race | 0 | 0.0% |
| Total | 466 | 100.0% |
Ancestry in Turah
The most populous ancestries reported in Turah are Ukrainian (54 | 11.6%), English (49 | 10.5%), German (49 | 10.5%), Scottish (33 | 7.1%), and Northern European (31 | 6.7%), together accounting for 46.4% of all Turah residents.
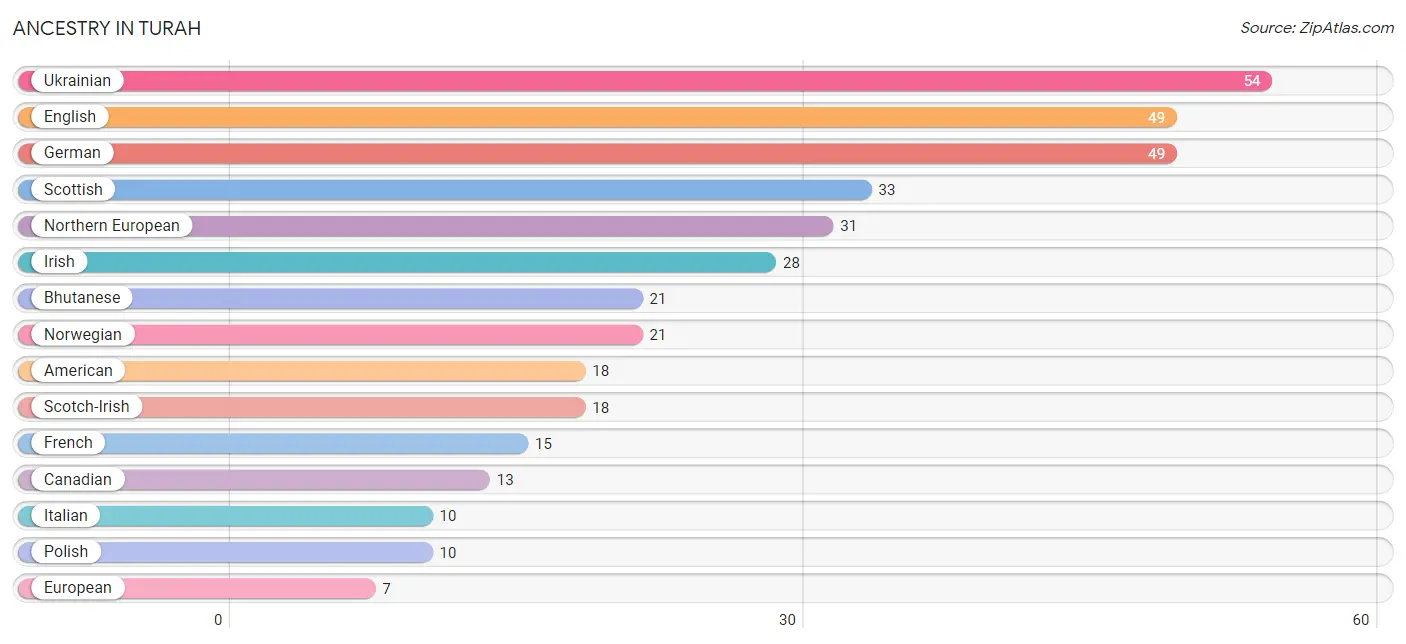
| Ancestry | # Population | % Population |
| American | 18 | 3.9% |
| Bhutanese | 21 | 4.5% |
| Canadian | 13 | 2.8% |
| Dutch | 1 | 0.2% |
| English | 49 | 10.5% |
| European | 7 | 1.5% |
| French | 15 | 3.2% |
| German | 49 | 10.5% |
| Irish | 28 | 6.0% |
| Italian | 10 | 2.1% |
| Northern European | 31 | 6.7% |
| Norwegian | 21 | 4.5% |
| Polish | 10 | 2.1% |
| Scotch-Irish | 18 | 3.9% |
| Scottish | 33 | 7.1% |
| Ukrainian | 54 | 11.6% | View All 16 Rows |
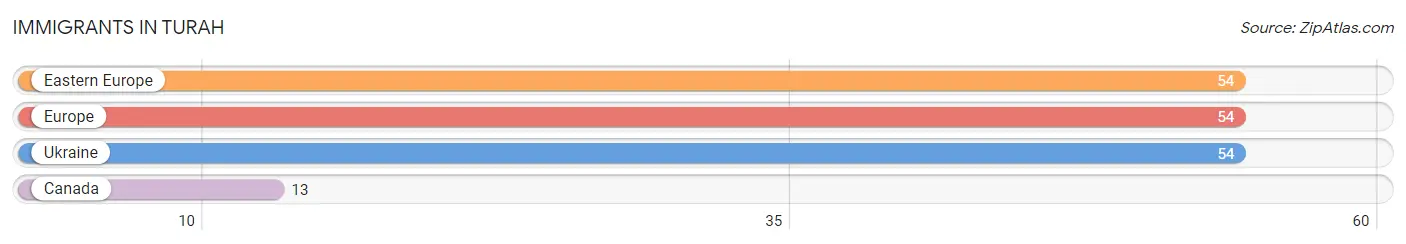
Immigrants in Turah
The most numerous immigrant groups reported in Turah came from Eastern Europe (54 | 11.6%), Europe (54 | 11.6%), Ukraine (54 | 11.6%), and Canada (13 | 2.8%), together accounting for 37.6% of all Turah residents.
| Immigration Origin | # Population | % Population |
| Canada | 13 | 2.8% |
| Eastern Europe | 54 | 11.6% |
| Europe | 54 | 11.6% |
| Ukraine | 54 | 11.6% | View All 4 Rows |
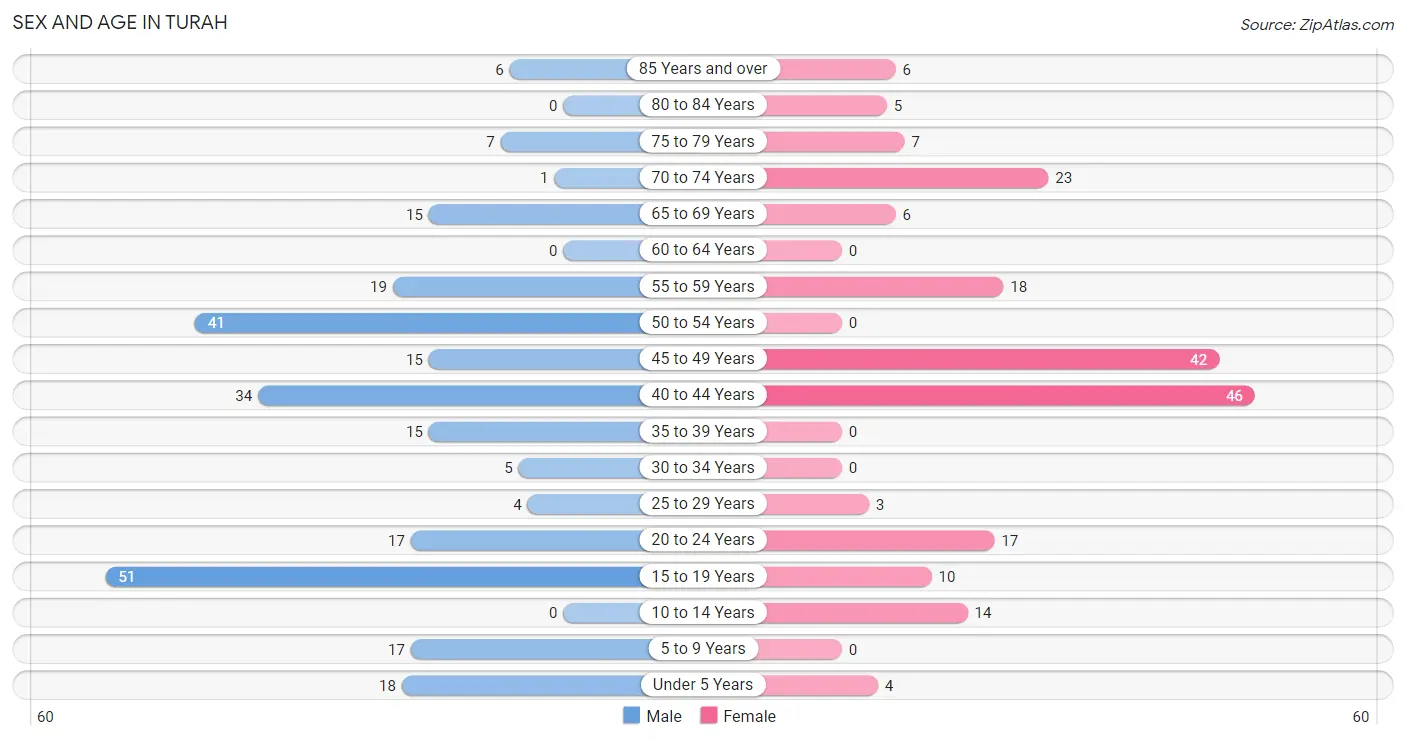
Sex and Age in Turah
Sex and Age in Turah
The most populous age groups in Turah are 15 to 19 Years (51 | 19.3%) for men and 40 to 44 Years (46 | 22.9%) for women.
| Age Bracket | Male | Female |
| Under 5 Years | 18 (6.8%) | 4 (2.0%) |
| 5 to 9 Years | 17 (6.4%) | 0 (0.0%) |
| 10 to 14 Years | 0 (0.0%) | 14 (7.0%) |
| 15 to 19 Years | 51 (19.3%) | 10 (5.0%) |
| 20 to 24 Years | 17 (6.4%) | 17 (8.5%) |
| 25 to 29 Years | 4 (1.5%) | 3 (1.5%) |
| 30 to 34 Years | 5 (1.9%) | 0 (0.0%) |
| 35 to 39 Years | 15 (5.7%) | 0 (0.0%) |
| 40 to 44 Years | 34 (12.8%) | 46 (22.9%) |
| 45 to 49 Years | 15 (5.7%) | 42 (20.9%) |
| 50 to 54 Years | 41 (15.5%) | 0 (0.0%) |
| 55 to 59 Years | 19 (7.2%) | 18 (9.0%) |
| 60 to 64 Years | 0 (0.0%) | 0 (0.0%) |
| 65 to 69 Years | 15 (5.7%) | 6 (3.0%) |
| 70 to 74 Years | 1 (0.4%) | 23 (11.4%) |
| 75 to 79 Years | 7 (2.6%) | 7 (3.5%) |
| 80 to 84 Years | 0 (0.0%) | 5 (2.5%) |
| 85 Years and over | 6 (2.3%) | 6 (3.0%) |
| Total | 265 (100.0%) | 201 (100.0%) |
Families and Households in Turah
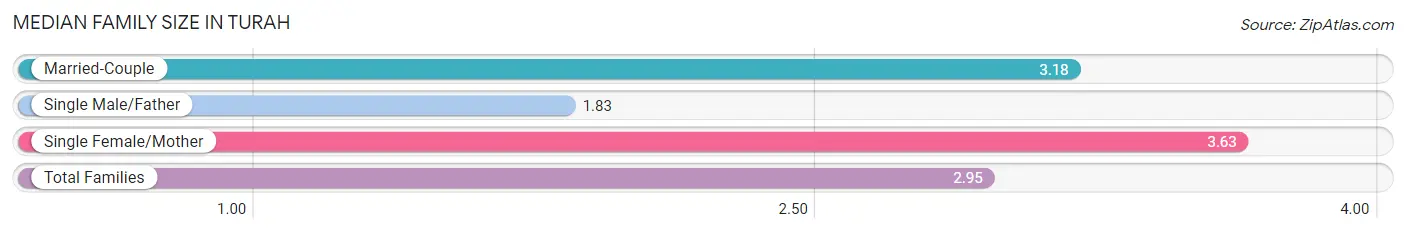
Median Family Size in Turah
The median family size in Turah is 2.95 persons per family, with single female/mother families (8 | 6.6%) accounting for the largest median family size of 3.63 persons per family. On the other hand, single male/father families (23 | 18.9%) represent the smallest median family size with 1.83 persons per family.
| Family Type | # Families | Family Size |
| Married-Couple | 91 (74.6%) | 3.18 |
| Single Male/Father | 23 (18.9%) | 1.83 |
| Single Female/Mother | 8 (6.6%) | 3.63 |
| Total Families | 122 (100.0%) | 2.95 |
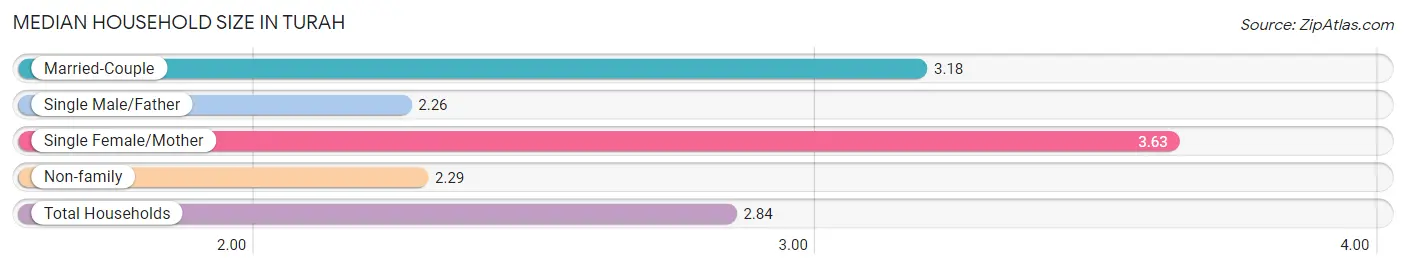
Median Household Size in Turah
The median household size in Turah is 2.84 persons per household, with single female/mother households (8 | 4.9%) accounting for the largest median household size of 3.63 persons per household. single male/father households (23 | 14.0%) represent the smallest median household size with 2.26 persons per household.
| Household Type | # Households | Household Size |
| Married-Couple | 91 (55.5%) | 3.18 |
| Single Male/Father | 23 (14.0%) | 2.26 |
| Single Female/Mother | 8 (4.9%) | 3.63 |
| Non-family | 42 (25.6%) | 2.29 |
| Total Households | 164 (100.0%) | 2.84 |
Household Size by Marriage Status in Turah
Out of a total of 164 households in Turah, 122 (74.4%) are family households, while 42 (25.6%) are nonfamily households. The most numerous type of family households are 2-person households, comprising 50, and the most common type of nonfamily households are 3-person households, comprising 27.
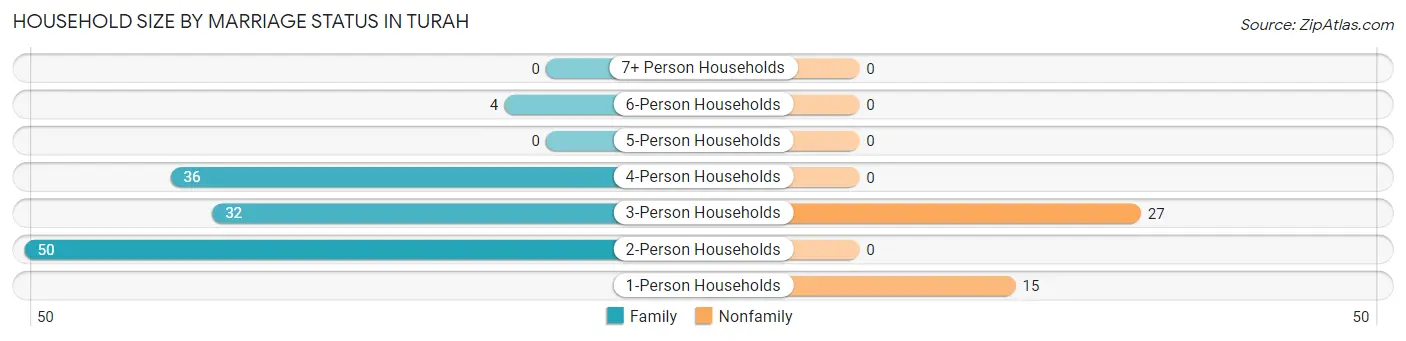
| Household Size | Family Households | Nonfamily Households |
| 1-Person Households | - | 15 (9.1%) |
| 2-Person Households | 50 (30.5%) | 0 (0.0%) |
| 3-Person Households | 32 (19.5%) | 27 (16.5%) |
| 4-Person Households | 36 (22.0%) | 0 (0.0%) |
| 5-Person Households | 0 (0.0%) | 0 (0.0%) |
| 6-Person Households | 4 (2.4%) | 0 (0.0%) |
| 7+ Person Households | 0 (0.0%) | 0 (0.0%) |
| Total | 122 (74.4%) | 42 (25.6%) |
Female Fertility in Turah
Fertility by Age in Turah
| Age Bracket | Women with Births | Births / 1,000 Women |
| 15 to 19 years | 0 (0.0%) | 0.0 |
| 20 to 34 years | 0 (0.0%) | 0.0 |
| 35 to 50 years | 0 (0.0%) | 0.0 |
| Total | 0 (0.0%) | 0.0 |
Fertility by Age by Marriage Status in Turah
| Age Bracket | Married | Unmarried |
| 15 to 19 years | 0 (0.0%) | 0 (0.0%) |
| 20 to 34 years | 0 (0.0%) | 0 (0.0%) |
| 35 to 50 years | 0 (0.0%) | 0 (0.0%) |
| Total | 0 (0.0%) | 0 (0.0%) |
Fertility by Education in Turah
| Educational Attainment | Women with Births | Births / 1,000 Women |
| Less than High School | 0 (0.0%) | 0.0 |
| High School Diploma | 0 (0.0%) | 0.0 |
| College or Associate's Degree | 0 (0.0%) | 0.0 |
| Bachelor's Degree | 0 (0.0%) | 0.0 |
| Graduate Degree | 0 (0.0%) | 0.0 |
| Total | 0 (0.0%) | 0.0 |
Fertility by Education by Marriage Status in Turah
| Educational Attainment | Married | Unmarried |
| Less than High School | 0 (0.0%) | 0 (0.0%) |
| High School Diploma | 0 (0.0%) | 0 (0.0%) |
| College or Associate's Degree | 0 (0.0%) | 0 (0.0%) |
| Bachelor's Degree | 0 (0.0%) | 0 (0.0%) |
| Graduate Degree | 0 (0.0%) | 0 (0.0%) |
| Total | 0 (0.0%) | 0 (0.0%) |
Employment Characteristics in Turah
Employment by Class of Employer in Turah
Among the 261 employed individuals in Turah, private company employees (180 | 69.0%), not-for-profit organizations (37 | 14.2%), and self-employed (not incorporated) (14 | 5.4%) make up the most common classes of employment.
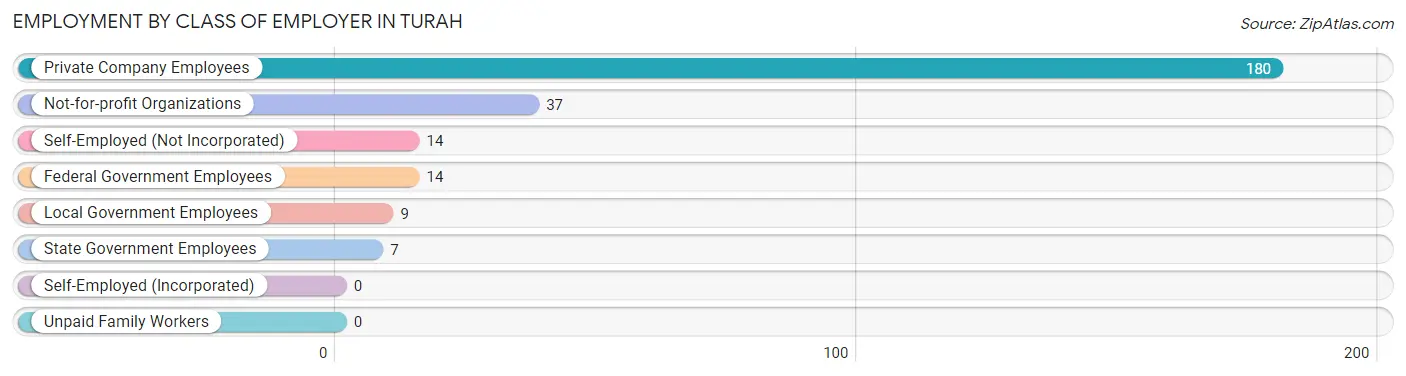
| Employer Class | # Employees | % Employees |
| Private Company Employees | 180 | 69.0% |
| Self-Employed (Incorporated) | 0 | 0.0% |
| Self-Employed (Not Incorporated) | 14 | 5.4% |
| Not-for-profit Organizations | 37 | 14.2% |
| Local Government Employees | 9 | 3.5% |
| State Government Employees | 7 | 2.7% |
| Federal Government Employees | 14 | 5.4% |
| Unpaid Family Workers | 0 | 0.0% |
| Total | 261 | 100.0% |
Employment Status by Age in Turah
According to the labor force statistics for Turah, out of the total population over 16 years of age (367), 77.9% or 286 individuals are in the labor force, with 8.7% or 25 of them unemployed. The age group with the highest labor force participation rate is 20 to 24 years, with 100.0% or 34 individuals in the labor force. Within the labor force, the 45 to 54 years age range has the highest percentage of unemployed individuals, with 25.5% or 25 of them being unemployed.
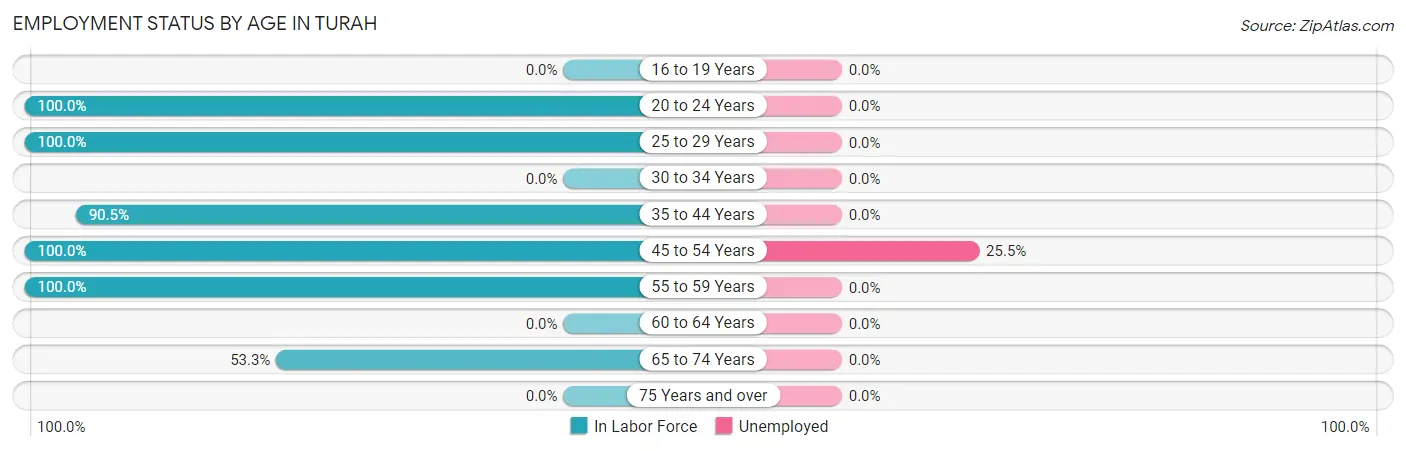
| Age Bracket | In Labor Force | Unemployed |
| 16 to 19 Years | 0 (0.0%) | 0 (0.0%) |
| 20 to 24 Years | 34 (100.0%) | 0 (0.0%) |
| 25 to 29 Years | 7 (100.0%) | 0 (0.0%) |
| 30 to 34 Years | 0 (0.0%) | 0 (0.0%) |
| 35 to 44 Years | 86 (90.5%) | 0 (0.0%) |
| 45 to 54 Years | 98 (100.0%) | 25 (25.5%) |
| 55 to 59 Years | 37 (100.0%) | 0 (0.0%) |
| 60 to 64 Years | 0 (0.0%) | 0 (0.0%) |
| 65 to 74 Years | 24 (53.3%) | 0 (0.0%) |
| 75 Years and over | 0 (0.0%) | 0 (0.0%) |
| Total | 286 (77.9%) | 25 (8.7%) |
Employment Status by Educational Attainment in Turah
According to labor force statistics for Turah, 94.2% of individuals (228) out of the total population between 25 and 64 years of age (242) are in the labor force, with 11.0% or 25 of them being unemployed. The group with the highest labor force participation rate are those with the educational attainment of high school diploma, with 100.0% or 64 individuals in the labor force. Within the labor force, individuals with bachelor's degree or higher education have the highest percentage of unemployment, with 19.5% or 25 of them being unemployed.
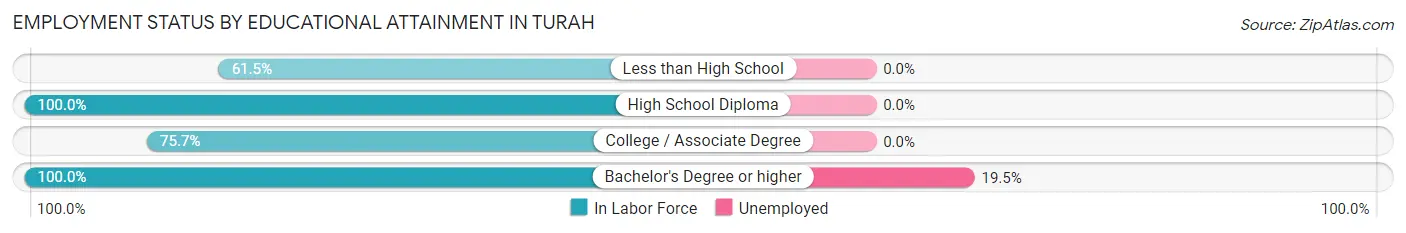
| Educational Attainment | In Labor Force | Unemployed |
| Less than High School | 8 (61.5%) | 0 (0.0%) |
| High School Diploma | 64 (100.0%) | 0 (0.0%) |
| College / Associate Degree | 28 (75.7%) | 0 (0.0%) |
| Bachelor's Degree or higher | 128 (100.0%) | 25 (19.5%) |
| Total | 228 (94.2%) | 27 (11.0%) |
Employment Occupations by Sex in Turah
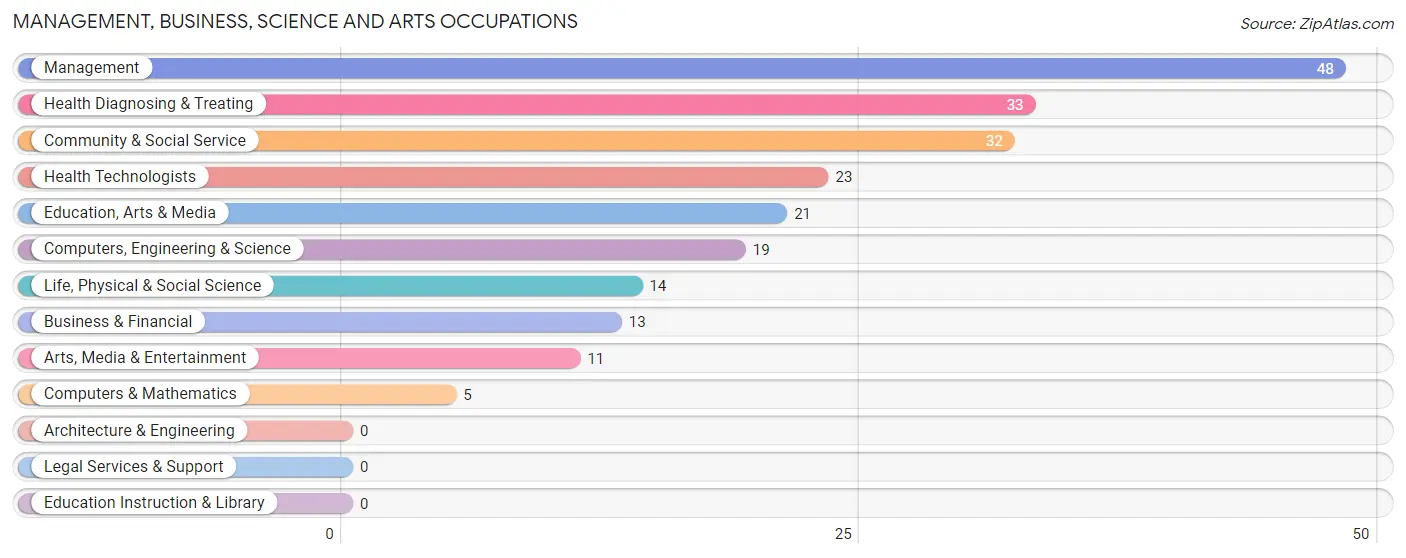
Management, Business, Science and Arts Occupations
The most common Management, Business, Science and Arts occupations in Turah are Management (48 | 18.4%), Health Diagnosing & Treating (33 | 12.6%), Community & Social Service (32 | 12.3%), Health Technologists (23 | 8.8%), and Education, Arts & Media (21 | 8.1%).
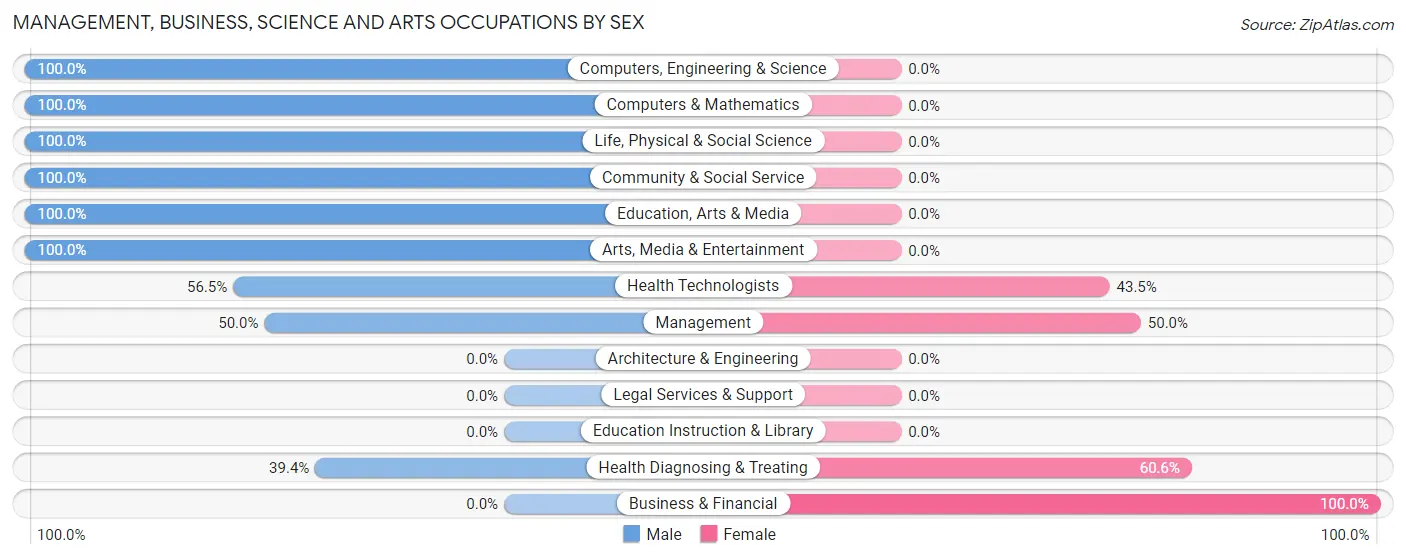
Management, Business, Science and Arts Occupations by Sex
Within the Management, Business, Science and Arts occupations in Turah, the most male-oriented occupations are Computers, Engineering & Science (100.0%), Computers & Mathematics (100.0%), and Life, Physical & Social Science (100.0%), while the most female-oriented occupations are Business & Financial (100.0%), Health Diagnosing & Treating (60.6%), and Management (50.0%).
| Occupation | Male | Female |
| Management | 24 (50.0%) | 24 (50.0%) |
| Business & Financial | 0 (0.0%) | 13 (100.0%) |
| Computers, Engineering & Science | 19 (100.0%) | 0 (0.0%) |
| Computers & Mathematics | 5 (100.0%) | 0 (0.0%) |
| Architecture & Engineering | 0 (0.0%) | 0 (0.0%) |
| Life, Physical & Social Science | 14 (100.0%) | 0 (0.0%) |
| Community & Social Service | 32 (100.0%) | 0 (0.0%) |
| Education, Arts & Media | 21 (100.0%) | 0 (0.0%) |
| Legal Services & Support | 0 (0.0%) | 0 (0.0%) |
| Education Instruction & Library | 0 (0.0%) | 0 (0.0%) |
| Arts, Media & Entertainment | 11 (100.0%) | 0 (0.0%) |
| Health Diagnosing & Treating | 13 (39.4%) | 20 (60.6%) |
| Health Technologists | 13 (56.5%) | 10 (43.5%) |
| Total (Category) | 88 (60.7%) | 57 (39.3%) |
| Total (Overall) | 150 (57.5%) | 111 (42.5%) |
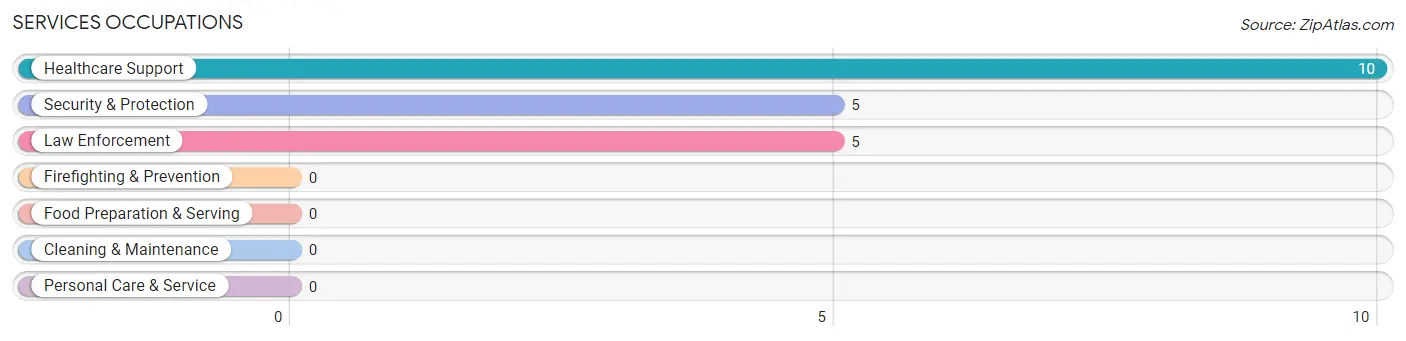
Services Occupations
The most common Services occupations in Turah are Healthcare Support (10 | 3.8%), Security & Protection (5 | 1.9%), and Law Enforcement (5 | 1.9%).
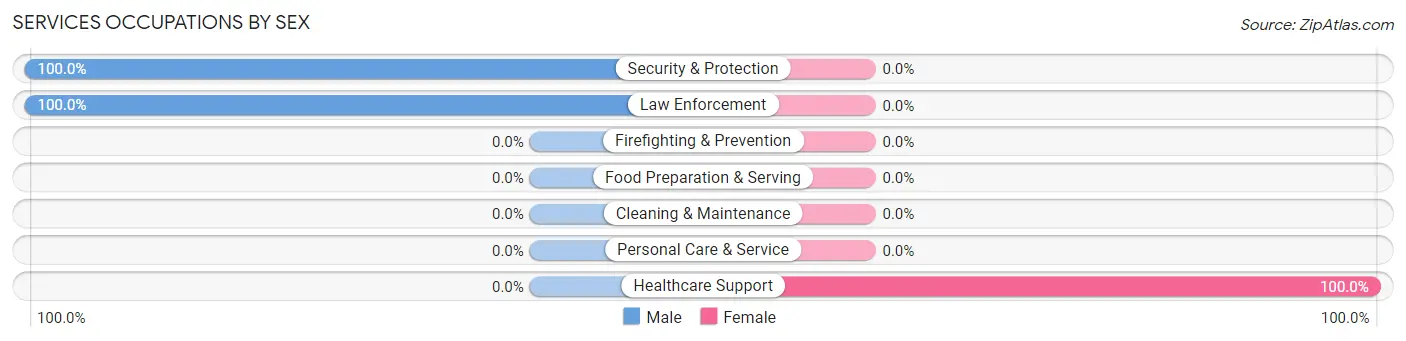
Services Occupations by Sex
| Occupation | Male | Female |
| Healthcare Support | 0 (0.0%) | 10 (100.0%) |
| Security & Protection | 5 (100.0%) | 0 (0.0%) |
| Firefighting & Prevention | 0 (0.0%) | 0 (0.0%) |
| Law Enforcement | 5 (100.0%) | 0 (0.0%) |
| Food Preparation & Serving | 0 (0.0%) | 0 (0.0%) |
| Cleaning & Maintenance | 0 (0.0%) | 0 (0.0%) |
| Personal Care & Service | 0 (0.0%) | 0 (0.0%) |
| Total (Category) | 5 (33.3%) | 10 (66.7%) |
| Total (Overall) | 150 (57.5%) | 111 (42.5%) |
Sales and Office Occupations
The most common Sales and Office occupations in Turah are Sales & Related (57 | 21.8%), and Office & Administration (14 | 5.4%).
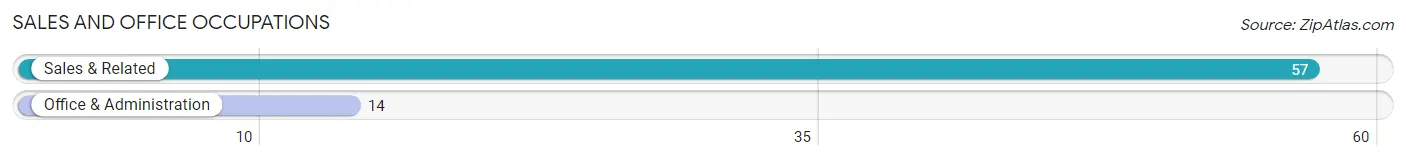
Sales and Office Occupations by Sex
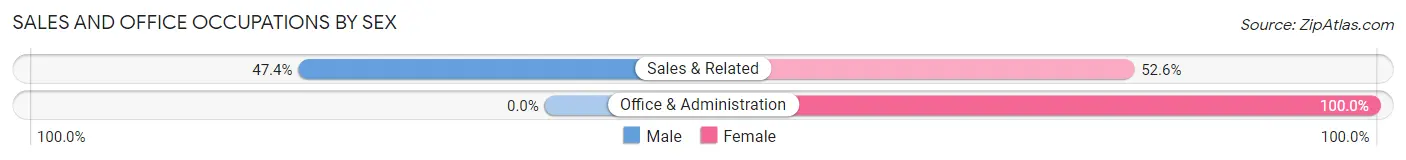
| Occupation | Male | Female |
| Sales & Related | 27 (47.4%) | 30 (52.6%) |
| Office & Administration | 0 (0.0%) | 14 (100.0%) |
| Total (Category) | 27 (38.0%) | 44 (62.0%) |
| Total (Overall) | 150 (57.5%) | 111 (42.5%) |
Natural Resources, Construction and Maintenance Occupations
The most common Natural Resources, Construction and Maintenance occupations in Turah are , and Construction & Extraction (5 | 1.9%).
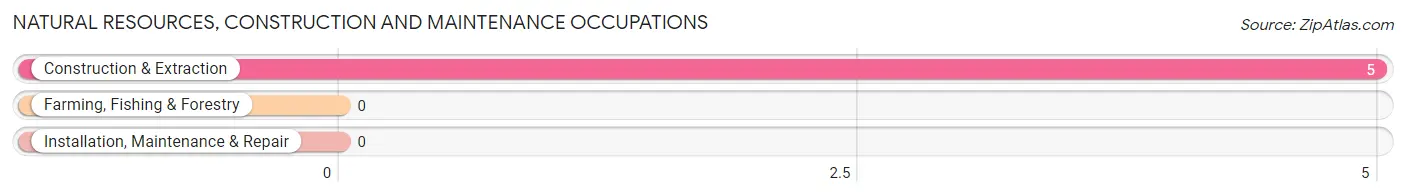
Natural Resources, Construction and Maintenance Occupations by Sex
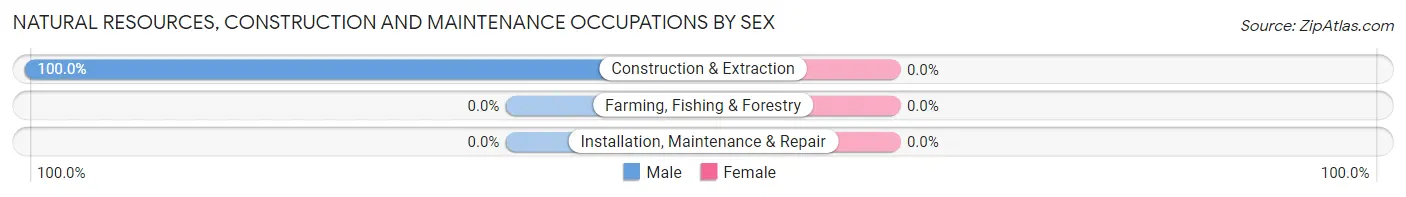
| Occupation | Male | Female |
| Farming, Fishing & Forestry | 0 (0.0%) | 0 (0.0%) |
| Construction & Extraction | 5 (100.0%) | 0 (0.0%) |
| Installation, Maintenance & Repair | 0 (0.0%) | 0 (0.0%) |
| Total (Category) | 5 (100.0%) | 0 (0.0%) |
| Total (Overall) | 150 (57.5%) | 111 (42.5%) |
Production, Transportation and Moving Occupations
The most common Production, Transportation and Moving occupations in Turah are Production (17 | 6.5%), and Transportation (8 | 3.1%).
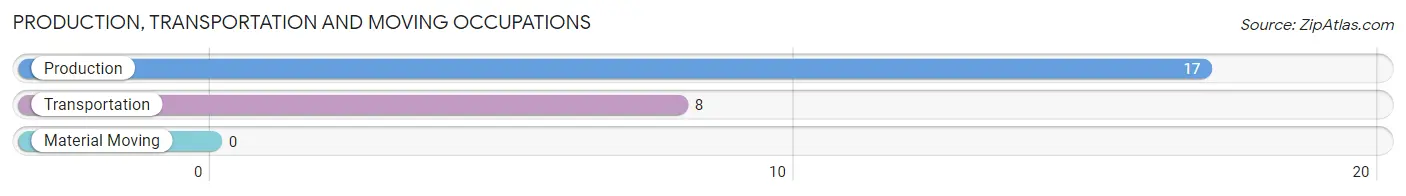
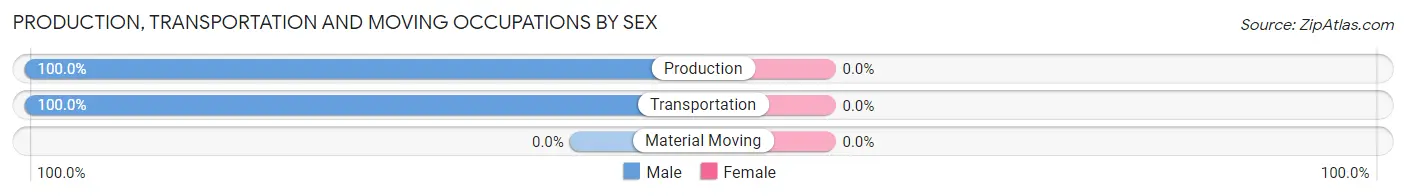
Production, Transportation and Moving Occupations by Sex
| Occupation | Male | Female |
| Production | 17 (100.0%) | 0 (0.0%) |
| Transportation | 8 (100.0%) | 0 (0.0%) |
| Material Moving | 0 (0.0%) | 0 (0.0%) |
| Total (Category) | 25 (100.0%) | 0 (0.0%) |
| Total (Overall) | 150 (57.5%) | 111 (42.5%) |
Employment Industries by Sex in Turah
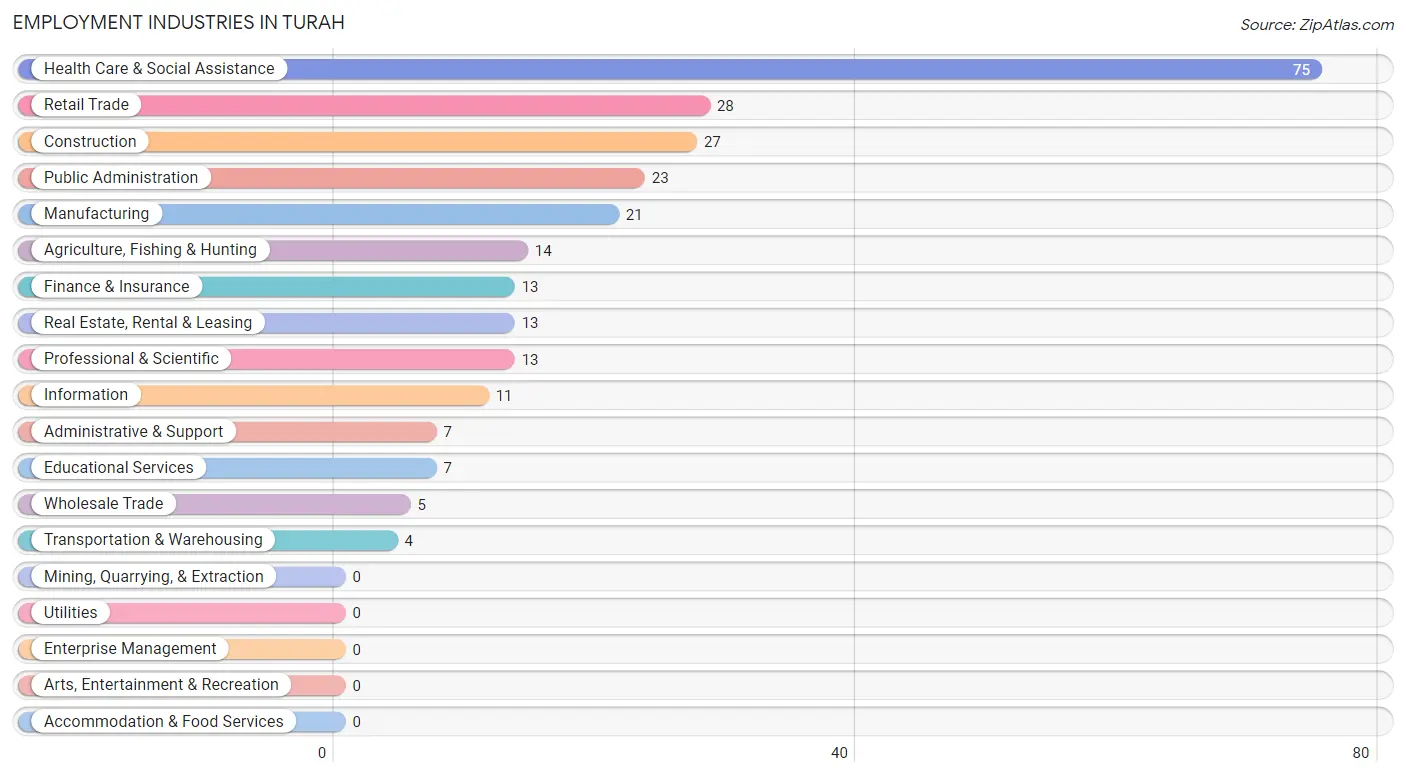
Employment Industries in Turah
The major employment industries in Turah include Health Care & Social Assistance (75 | 28.7%), Retail Trade (28 | 10.7%), Construction (27 | 10.3%), Public Administration (23 | 8.8%), and Manufacturing (21 | 8.1%).
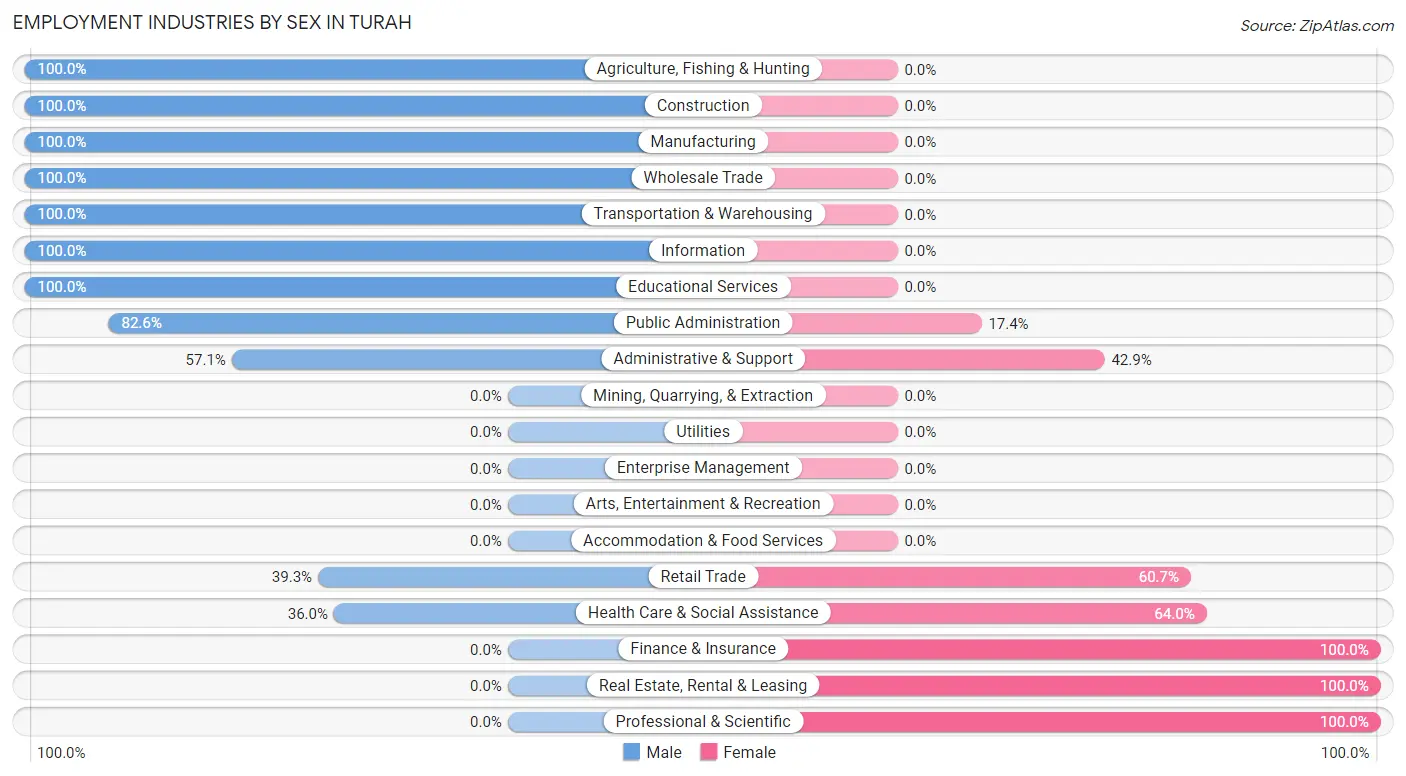
Employment Industries by Sex in Turah
The Turah industries that see more men than women are Agriculture, Fishing & Hunting (100.0%), Construction (100.0%), and Manufacturing (100.0%), whereas the industries that tend to have a higher number of women are Finance & Insurance (100.0%), Real Estate, Rental & Leasing (100.0%), and Professional & Scientific (100.0%).
| Industry | Male | Female |
| Agriculture, Fishing & Hunting | 14 (100.0%) | 0 (0.0%) |
| Mining, Quarrying, & Extraction | 0 (0.0%) | 0 (0.0%) |
| Construction | 27 (100.0%) | 0 (0.0%) |
| Manufacturing | 21 (100.0%) | 0 (0.0%) |
| Wholesale Trade | 5 (100.0%) | 0 (0.0%) |
| Retail Trade | 11 (39.3%) | 17 (60.7%) |
| Transportation & Warehousing | 4 (100.0%) | 0 (0.0%) |
| Utilities | 0 (0.0%) | 0 (0.0%) |
| Information | 11 (100.0%) | 0 (0.0%) |
| Finance & Insurance | 0 (0.0%) | 13 (100.0%) |
| Real Estate, Rental & Leasing | 0 (0.0%) | 13 (100.0%) |
| Professional & Scientific | 0 (0.0%) | 13 (100.0%) |
| Enterprise Management | 0 (0.0%) | 0 (0.0%) |
| Administrative & Support | 4 (57.1%) | 3 (42.9%) |
| Educational Services | 7 (100.0%) | 0 (0.0%) |
| Health Care & Social Assistance | 27 (36.0%) | 48 (64.0%) |
| Arts, Entertainment & Recreation | 0 (0.0%) | 0 (0.0%) |
| Accommodation & Food Services | 0 (0.0%) | 0 (0.0%) |
| Public Administration | 19 (82.6%) | 4 (17.4%) |
| Total | 150 (57.5%) | 111 (42.5%) |
Education in Turah
School Enrollment in Turah
The most common levels of schooling among the 134 students in Turah are high school (66 | 49.2%), college / undergraduate (24 | 17.9%), and middle school (19 | 14.2%).
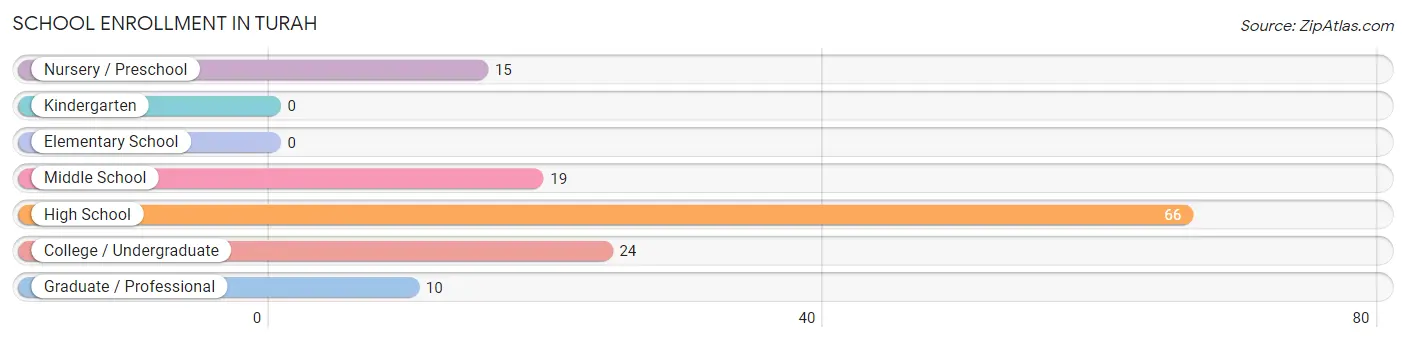
| School Level | # Students | % Students |
| Nursery / Preschool | 15 | 11.2% |
| Kindergarten | 0 | 0.0% |
| Elementary School | 0 | 0.0% |
| Middle School | 19 | 14.2% |
| High School | 66 | 49.2% |
| College / Undergraduate | 24 | 17.9% |
| Graduate / Professional | 10 | 7.5% |
| Total | 134 | 100.0% |
School Enrollment by Age by Funding Source in Turah
Out of a total of 134 students who are enrolled in schools in Turah, 25 (18.7%) attend a private institution, while the remaining 109 (81.3%) are enrolled in public schools. The age group of 3 to 4 year olds has the highest likelihood of being enrolled in private schools, with 9 (100.0% in the age bracket) enrolled. Conversely, the age group of 10 to 14 year olds has the lowest likelihood of being enrolled in a private school, with 14 (100.0% in the age bracket) attending a public institution.
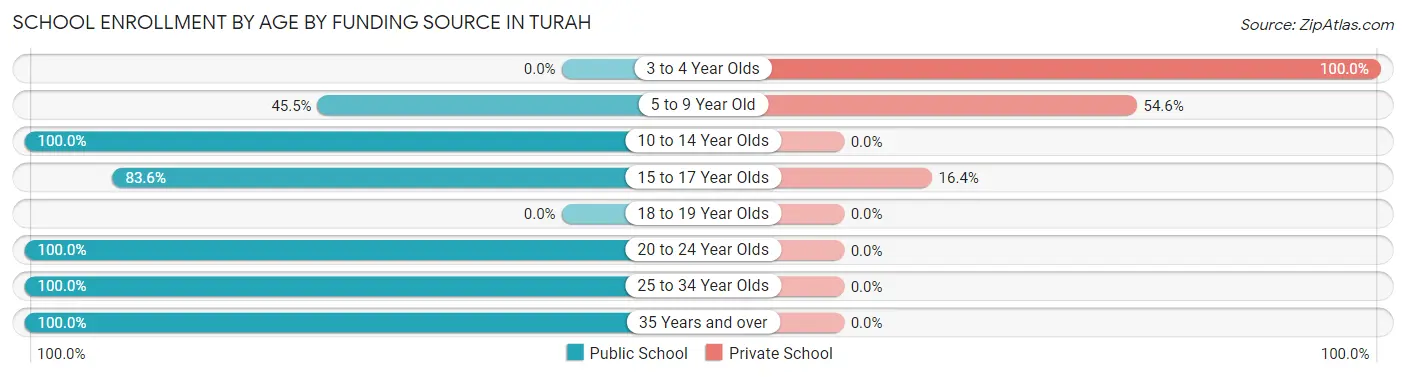
| Age Bracket | Public School | Private School |
| 3 to 4 Year Olds | 0 (0.0%) | 9 (100.0%) |
| 5 to 9 Year Old | 5 (45.5%) | 6 (54.5%) |
| 10 to 14 Year Olds | 14 (100.0%) | 0 (0.0%) |
| 15 to 17 Year Olds | 51 (83.6%) | 10 (16.4%) |
| 18 to 19 Year Olds | 0 (0.0%) | 0 (0.0%) |
| 20 to 24 Year Olds | 17 (100.0%) | 0 (0.0%) |
| 25 to 34 Year Olds | 5 (100.0%) | 0 (0.0%) |
| 35 Years and over | 17 (100.0%) | 0 (0.0%) |
| Total | 109 (81.3%) | 25 (18.7%) |
Educational Attainment by Field of Study in Turah
Bio, nature & agricultural (45 | 25.9%), engineering (26 | 14.9%), physical & health sciences (25 | 14.4%), psychology (14 | 8.1%), and liberal arts & history (13 | 7.5%) are the most common fields of study among 174 individuals in Turah who have obtained a bachelor's degree or higher.
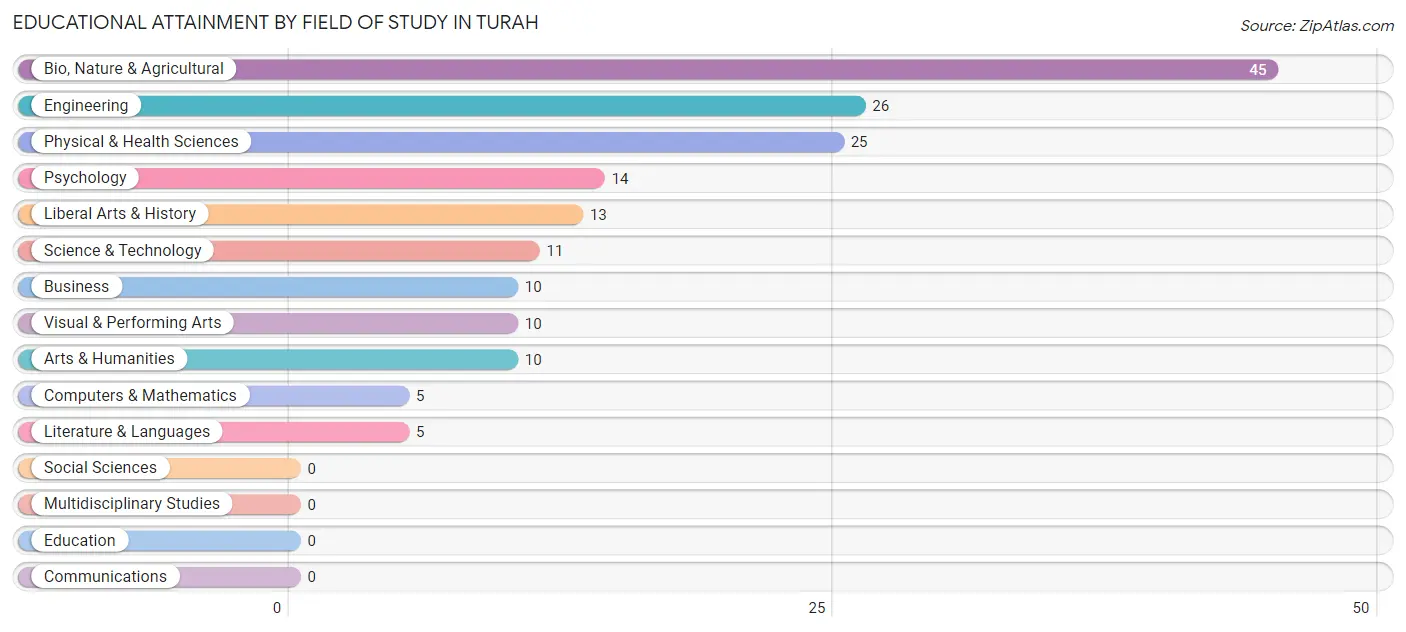
| Field of Study | # Graduates | % Graduates |
| Computers & Mathematics | 5 | 2.9% |
| Bio, Nature & Agricultural | 45 | 25.9% |
| Physical & Health Sciences | 25 | 14.4% |
| Psychology | 14 | 8.1% |
| Social Sciences | 0 | 0.0% |
| Engineering | 26 | 14.9% |
| Multidisciplinary Studies | 0 | 0.0% |
| Science & Technology | 11 | 6.3% |
| Business | 10 | 5.8% |
| Education | 0 | 0.0% |
| Literature & Languages | 5 | 2.9% |
| Liberal Arts & History | 13 | 7.5% |
| Visual & Performing Arts | 10 | 5.8% |
| Communications | 0 | 0.0% |
| Arts & Humanities | 10 | 5.8% |
| Total | 174 | 100.0% |
Transportation & Commute in Turah
Vehicle Availability by Sex in Turah
The most prevalent vehicle ownership categories in Turah are males with 2 vehicles (59, accounting for 39.3%) and females with 2 vehicles (46, making up 53.1%).
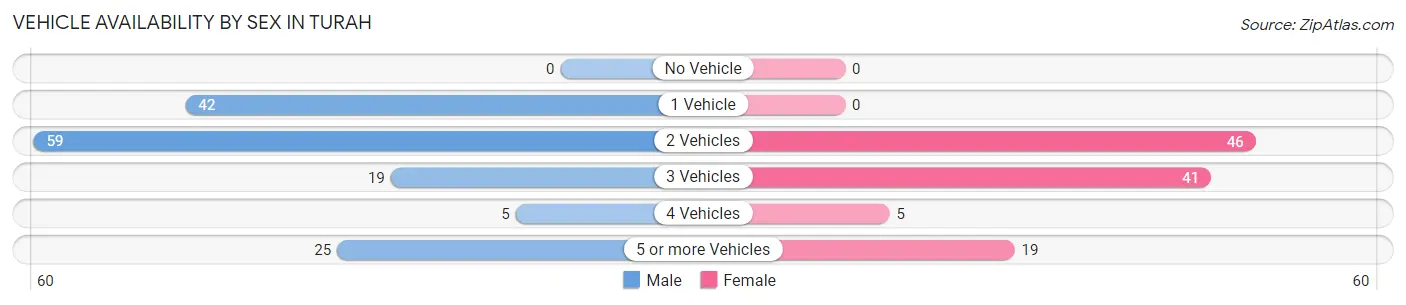
| Vehicles Available | Male | Female |
| No Vehicle | 0 (0.0%) | 0 (0.0%) |
| 1 Vehicle | 42 (28.0%) | 0 (0.0%) |
| 2 Vehicles | 59 (39.3%) | 46 (41.4%) |
| 3 Vehicles | 19 (12.7%) | 41 (36.9%) |
| 4 Vehicles | 5 (3.3%) | 5 (4.5%) |
| 5 or more Vehicles | 25 (16.7%) | 19 (17.1%) |
| Total | 150 (100.0%) | 111 (100.0%) |
Commute Time in Turah
The most frequently occuring commute durations in Turah are 20 to 24 minutes (85 commuters, 33.0%), 10 to 14 minutes (49 commuters, 19.0%), and 15 to 19 minutes (44 commuters, 17.1%).
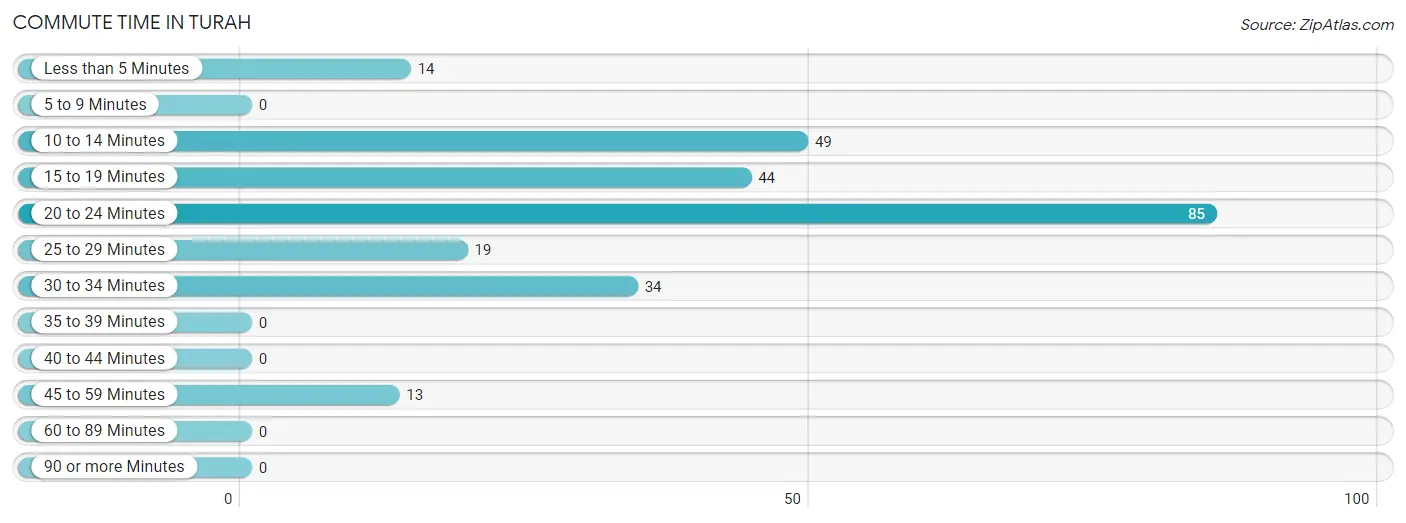
| Commute Time | # Commuters | % Commuters |
| Less than 5 Minutes | 14 | 5.4% |
| 5 to 9 Minutes | 0 | 0.0% |
| 10 to 14 Minutes | 49 | 19.0% |
| 15 to 19 Minutes | 44 | 17.1% |
| 20 to 24 Minutes | 85 | 33.0% |
| 25 to 29 Minutes | 19 | 7.4% |
| 30 to 34 Minutes | 34 | 13.2% |
| 35 to 39 Minutes | 0 | 0.0% |
| 40 to 44 Minutes | 0 | 0.0% |
| 45 to 59 Minutes | 13 | 5.0% |
| 60 to 89 Minutes | 0 | 0.0% |
| 90 or more Minutes | 0 | 0.0% |
Commute Time by Sex in Turah
The most common commute times in Turah are 20 to 24 minutes (41 commuters, 27.3%) for males and 20 to 24 minutes (44 commuters, 40.7%) for females.
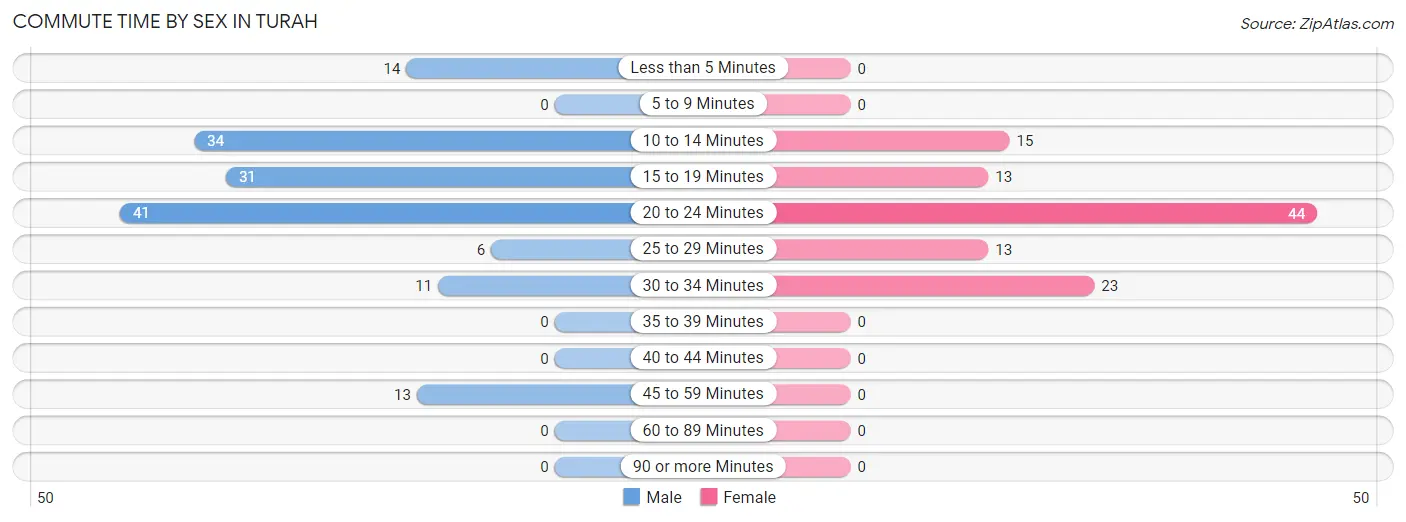
| Commute Time | Male | Female |
| Less than 5 Minutes | 14 (9.3%) | 0 (0.0%) |
| 5 to 9 Minutes | 0 (0.0%) | 0 (0.0%) |
| 10 to 14 Minutes | 34 (22.7%) | 15 (13.9%) |
| 15 to 19 Minutes | 31 (20.7%) | 13 (12.0%) |
| 20 to 24 Minutes | 41 (27.3%) | 44 (40.7%) |
| 25 to 29 Minutes | 6 (4.0%) | 13 (12.0%) |
| 30 to 34 Minutes | 11 (7.3%) | 23 (21.3%) |
| 35 to 39 Minutes | 0 (0.0%) | 0 (0.0%) |
| 40 to 44 Minutes | 0 (0.0%) | 0 (0.0%) |
| 45 to 59 Minutes | 13 (8.7%) | 0 (0.0%) |
| 60 to 89 Minutes | 0 (0.0%) | 0 (0.0%) |
| 90 or more Minutes | 0 (0.0%) | 0 (0.0%) |
Time of Departure to Work by Sex in Turah
The most frequent times of departure to work in Turah are 8:00 AM to 8:29 AM (51, 34.0%) for males and 6:00 AM to 6:29 AM (57, 52.8%) for females.
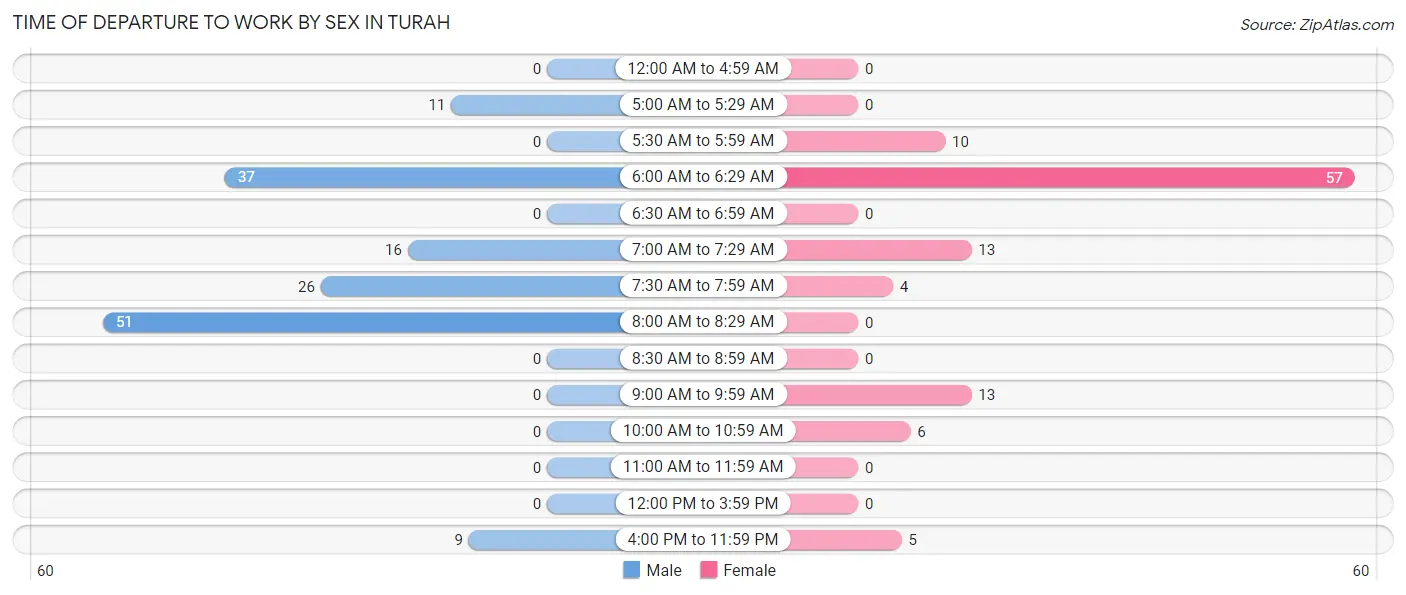
| Time of Departure | Male | Female |
| 12:00 AM to 4:59 AM | 0 (0.0%) | 0 (0.0%) |
| 5:00 AM to 5:29 AM | 11 (7.3%) | 0 (0.0%) |
| 5:30 AM to 5:59 AM | 0 (0.0%) | 10 (9.3%) |
| 6:00 AM to 6:29 AM | 37 (24.7%) | 57 (52.8%) |
| 6:30 AM to 6:59 AM | 0 (0.0%) | 0 (0.0%) |
| 7:00 AM to 7:29 AM | 16 (10.7%) | 13 (12.0%) |
| 7:30 AM to 7:59 AM | 26 (17.3%) | 4 (3.7%) |
| 8:00 AM to 8:29 AM | 51 (34.0%) | 0 (0.0%) |
| 8:30 AM to 8:59 AM | 0 (0.0%) | 0 (0.0%) |
| 9:00 AM to 9:59 AM | 0 (0.0%) | 13 (12.0%) |
| 10:00 AM to 10:59 AM | 0 (0.0%) | 6 (5.6%) |
| 11:00 AM to 11:59 AM | 0 (0.0%) | 0 (0.0%) |
| 12:00 PM to 3:59 PM | 0 (0.0%) | 0 (0.0%) |
| 4:00 PM to 11:59 PM | 9 (6.0%) | 5 (4.6%) |
| Total | 150 (100.0%) | 108 (100.0%) |
Housing Occupancy in Turah
Occupancy by Ownership in Turah
Of the total 164 dwellings in Turah, owner-occupied units account for 132 (80.5%), while renter-occupied units make up 32 (19.5%).
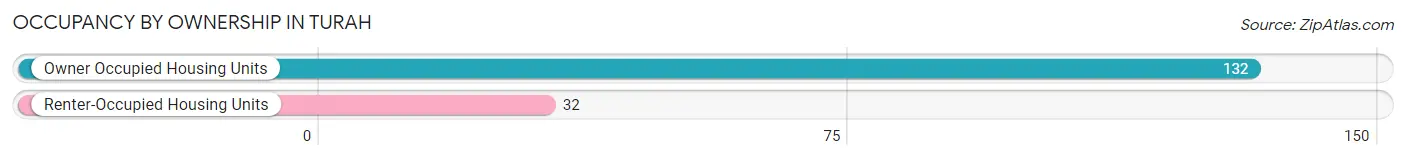
| Occupancy | # Housing Units | % Housing Units |
| Owner Occupied Housing Units | 132 | 80.5% |
| Renter-Occupied Housing Units | 32 | 19.5% |
| Total Occupied Housing Units | 164 | 100.0% |
Occupancy by Household Size in Turah
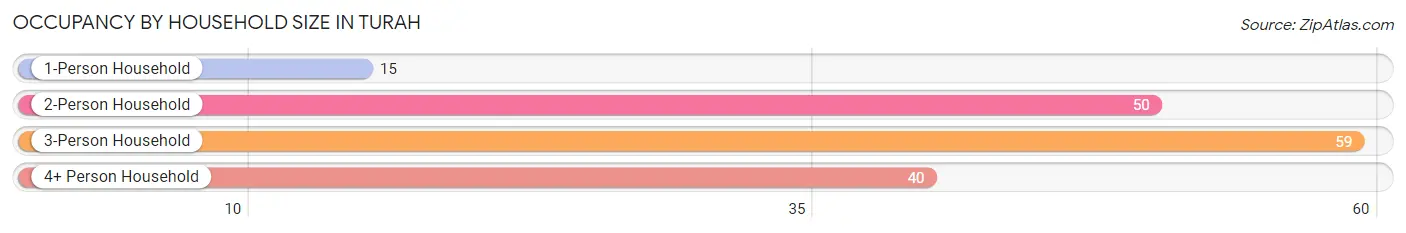
| Household Size | # Housing Units | % Housing Units |
| 1-Person Household | 15 | 9.1% |
| 2-Person Household | 50 | 30.5% |
| 3-Person Household | 59 | 36.0% |
| 4+ Person Household | 40 | 24.4% |
| Total Housing Units | 164 | 100.0% |
Occupancy by Ownership by Household Size in Turah
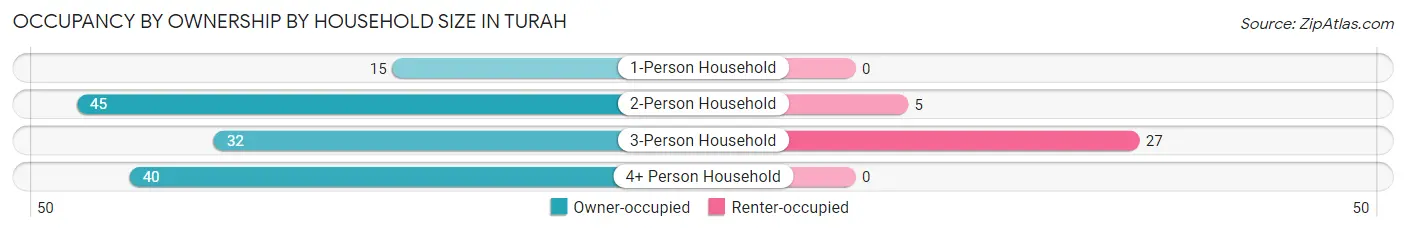
| Household Size | Owner-occupied | Renter-occupied |
| 1-Person Household | 15 (100.0%) | 0 (0.0%) |
| 2-Person Household | 45 (90.0%) | 5 (10.0%) |
| 3-Person Household | 32 (54.2%) | 27 (45.8%) |
| 4+ Person Household | 40 (100.0%) | 0 (0.0%) |
| Total Housing Units | 132 (80.5%) | 32 (19.5%) |
Occupancy by Educational Attainment in Turah
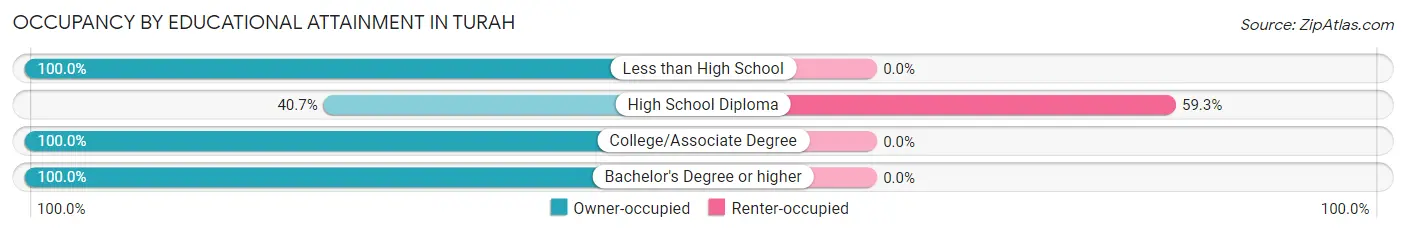
| Household Size | Owner-occupied | Renter-occupied |
| Less than High School | 8 (100.0%) | 0 (0.0%) |
| High School Diploma | 22 (40.7%) | 32 (59.3%) |
| College/Associate Degree | 29 (100.0%) | 0 (0.0%) |
| Bachelor's Degree or higher | 73 (100.0%) | 0 (0.0%) |
Occupancy by Age of Householder in Turah
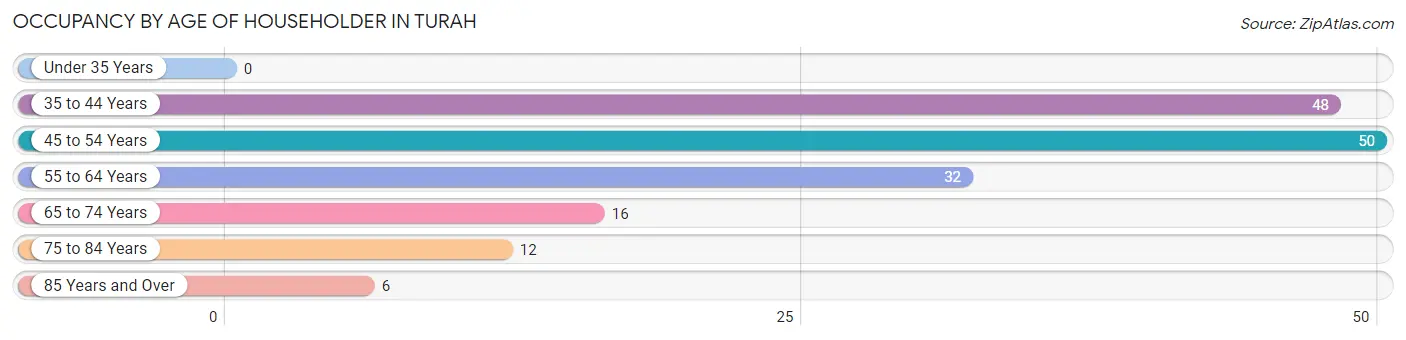
| Age Bracket | # Households | % Households |
| Under 35 Years | 0 | 0.0% |
| 35 to 44 Years | 48 | 29.3% |
| 45 to 54 Years | 50 | 30.5% |
| 55 to 64 Years | 32 | 19.5% |
| 65 to 74 Years | 16 | 9.8% |
| 75 to 84 Years | 12 | 7.3% |
| 85 Years and Over | 6 | 3.7% |
| Total | 164 | 100.0% |
Housing Finances in Turah
Median Income by Occupancy in Turah
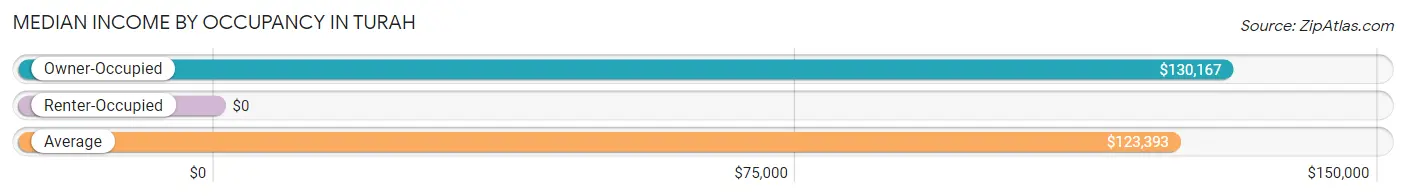
| Occupancy Type | # Households | Median Income |
| Owner-Occupied | 132 (80.5%) | $130,167 |
| Renter-Occupied | 32 (19.5%) | $0 |
| Average | 164 (100.0%) | $123,393 |
Occupancy by Householder Income Bracket in Turah
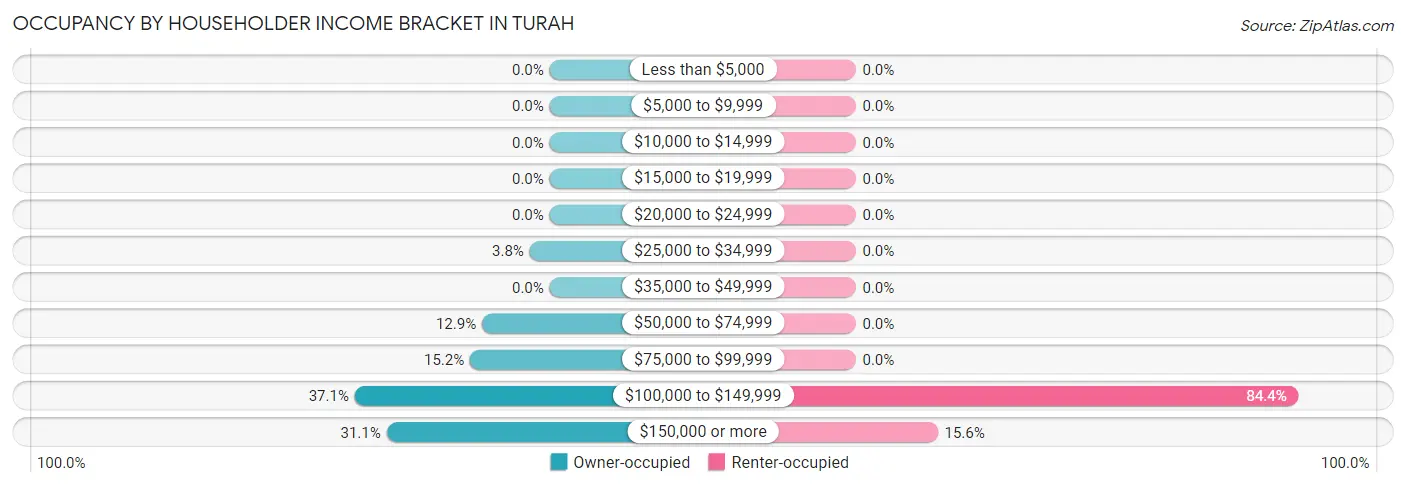
| Income Bracket | Owner-occupied | Renter-occupied |
| Less than $5,000 | 0 (0.0%) | 0 (0.0%) |
| $5,000 to $9,999 | 0 (0.0%) | 0 (0.0%) |
| $10,000 to $14,999 | 0 (0.0%) | 0 (0.0%) |
| $15,000 to $19,999 | 0 (0.0%) | 0 (0.0%) |
| $20,000 to $24,999 | 0 (0.0%) | 0 (0.0%) |
| $25,000 to $34,999 | 5 (3.8%) | 0 (0.0%) |
| $35,000 to $49,999 | 0 (0.0%) | 0 (0.0%) |
| $50,000 to $74,999 | 17 (12.9%) | 0 (0.0%) |
| $75,000 to $99,999 | 20 (15.1%) | 0 (0.0%) |
| $100,000 to $149,999 | 49 (37.1%) | 27 (84.4%) |
| $150,000 or more | 41 (31.1%) | 5 (15.6%) |
| Total | 132 (100.0%) | 32 (100.0%) |
Monthly Housing Cost Tiers in Turah
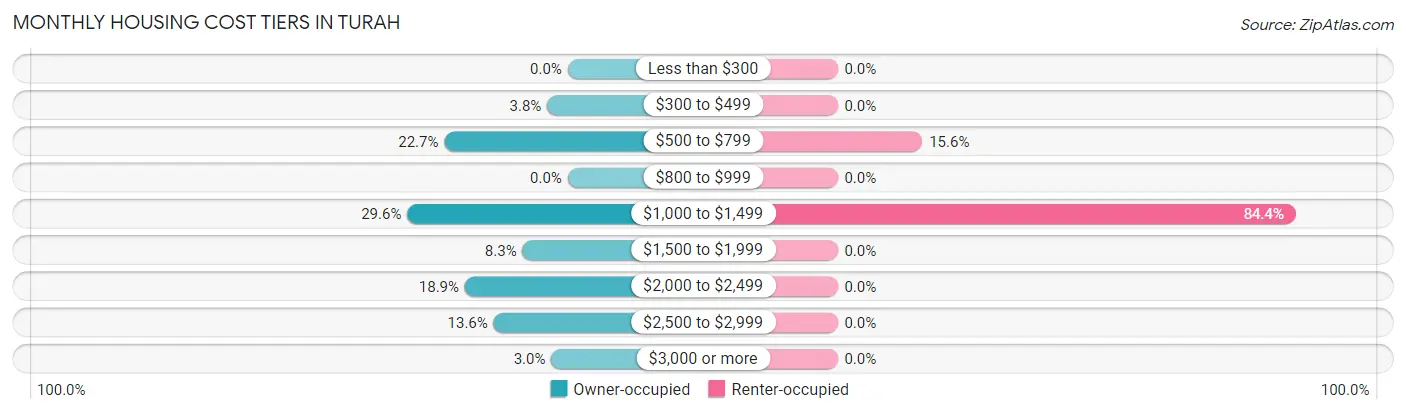
| Monthly Cost | Owner-occupied | Renter-occupied |
| Less than $300 | 0 (0.0%) | 0 (0.0%) |
| $300 to $499 | 5 (3.8%) | 0 (0.0%) |
| $500 to $799 | 30 (22.7%) | 5 (15.6%) |
| $800 to $999 | 0 (0.0%) | 0 (0.0%) |
| $1,000 to $1,499 | 39 (29.5%) | 27 (84.4%) |
| $1,500 to $1,999 | 11 (8.3%) | 0 (0.0%) |
| $2,000 to $2,499 | 25 (18.9%) | 0 (0.0%) |
| $2,500 to $2,999 | 18 (13.6%) | 0 (0.0%) |
| $3,000 or more | 4 (3.0%) | 0 (0.0%) |
| Total | 132 (100.0%) | 32 (100.0%) |
Physical Housing Characteristics in Turah
Housing Structures in Turah
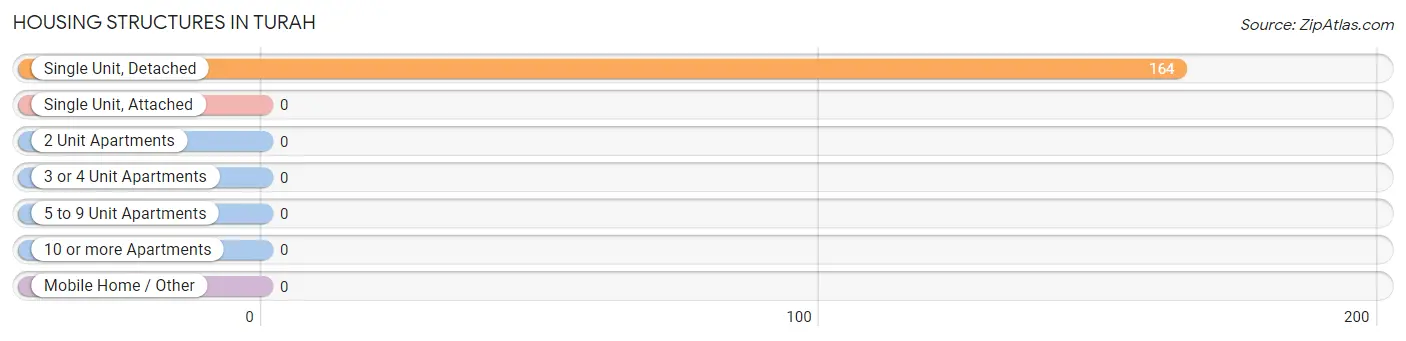
| Structure Type | # Housing Units | % Housing Units |
| Single Unit, Detached | 164 | 100.0% |
| Single Unit, Attached | 0 | 0.0% |
| 2 Unit Apartments | 0 | 0.0% |
| 3 or 4 Unit Apartments | 0 | 0.0% |
| 5 to 9 Unit Apartments | 0 | 0.0% |
| 10 or more Apartments | 0 | 0.0% |
| Mobile Home / Other | 0 | 0.0% |
| Total | 164 | 100.0% |
Housing Structures by Occupancy in Turah
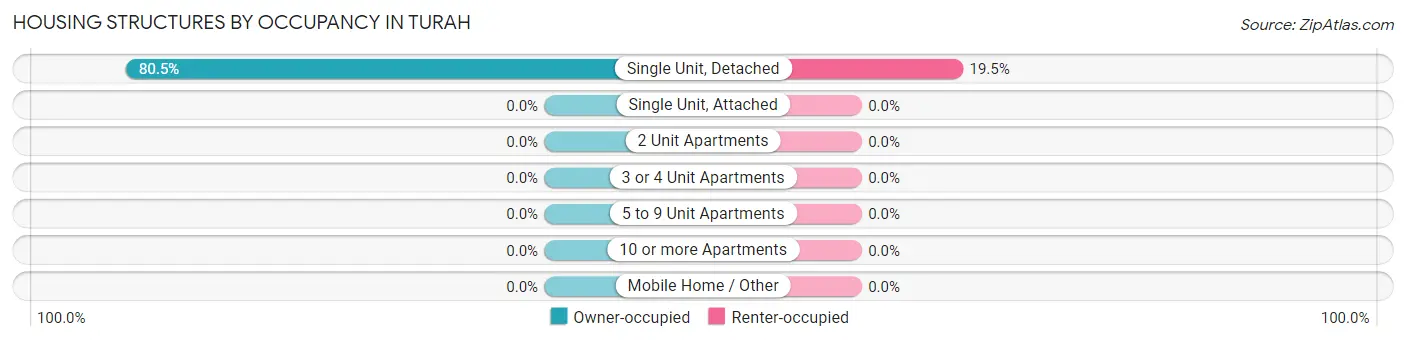
| Structure Type | Owner-occupied | Renter-occupied |
| Single Unit, Detached | 132 (80.5%) | 32 (19.5%) |
| Single Unit, Attached | 0 (0.0%) | 0 (0.0%) |
| 2 Unit Apartments | 0 (0.0%) | 0 (0.0%) |
| 3 or 4 Unit Apartments | 0 (0.0%) | 0 (0.0%) |
| 5 to 9 Unit Apartments | 0 (0.0%) | 0 (0.0%) |
| 10 or more Apartments | 0 (0.0%) | 0 (0.0%) |
| Mobile Home / Other | 0 (0.0%) | 0 (0.0%) |
| Total | 132 (80.5%) | 32 (19.5%) |
Housing Structures by Number of Rooms in Turah
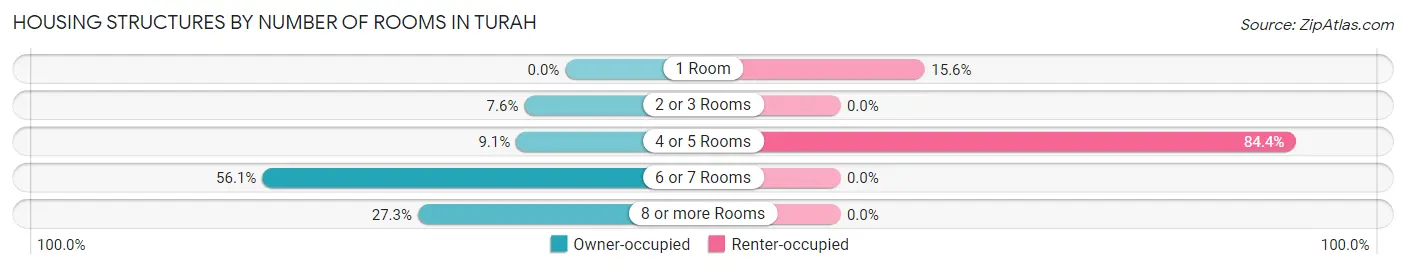
| Number of Rooms | Owner-occupied | Renter-occupied |
| 1 Room | 0 (0.0%) | 5 (15.6%) |
| 2 or 3 Rooms | 10 (7.6%) | 0 (0.0%) |
| 4 or 5 Rooms | 12 (9.1%) | 27 (84.4%) |
| 6 or 7 Rooms | 74 (56.1%) | 0 (0.0%) |
| 8 or more Rooms | 36 (27.3%) | 0 (0.0%) |
| Total | 132 (100.0%) | 32 (100.0%) |
Housing Structure by Heating Type in Turah
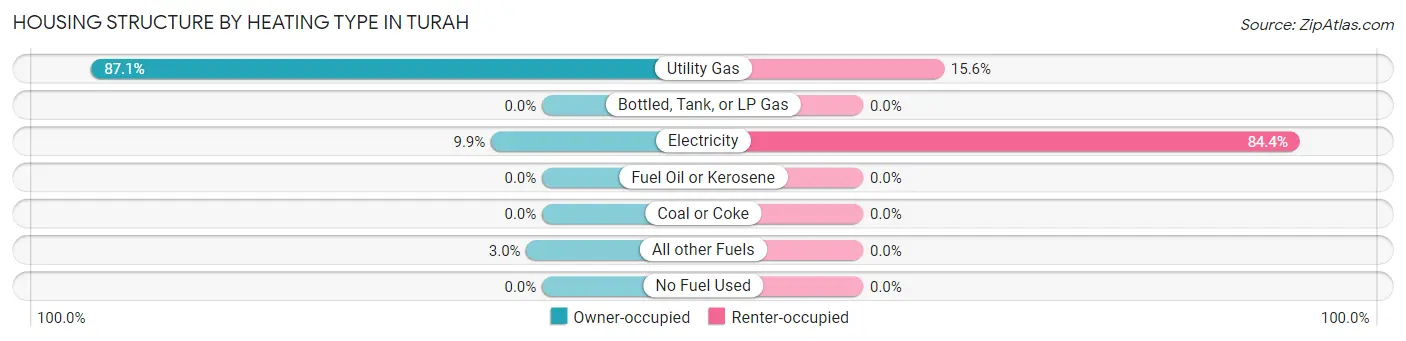
| Heating Type | Owner-occupied | Renter-occupied |
| Utility Gas | 115 (87.1%) | 5 (15.6%) |
| Bottled, Tank, or LP Gas | 0 (0.0%) | 0 (0.0%) |
| Electricity | 13 (9.9%) | 27 (84.4%) |
| Fuel Oil or Kerosene | 0 (0.0%) | 0 (0.0%) |
| Coal or Coke | 0 (0.0%) | 0 (0.0%) |
| All other Fuels | 4 (3.0%) | 0 (0.0%) |
| No Fuel Used | 0 (0.0%) | 0 (0.0%) |
| Total | 132 (100.0%) | 32 (100.0%) |
Household Vehicle Usage in Turah
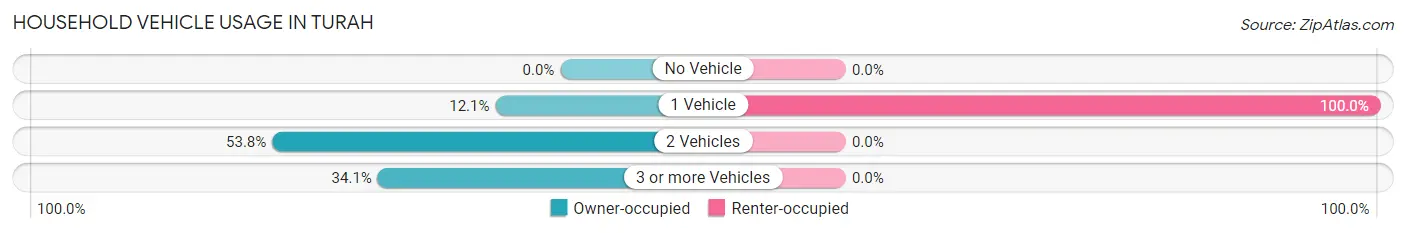
| Vehicles per Household | Owner-occupied | Renter-occupied |
| No Vehicle | 0 (0.0%) | 0 (0.0%) |
| 1 Vehicle | 16 (12.1%) | 32 (100.0%) |
| 2 Vehicles | 71 (53.8%) | 0 (0.0%) |
| 3 or more Vehicles | 45 (34.1%) | 0 (0.0%) |
| Total | 132 (100.0%) | 32 (100.0%) |
Real Estate & Mortgages in Turah
Real Estate and Mortgage Overview in Turah
| Characteristic | Without Mortgage | With Mortgage |
| Housing Units | 42 | 90 |
| Median Property Value | $455,600 | $397,800 |
| Median Household Income | - | - |
| Monthly Housing Costs | $594 | $4 |
| Real Estate Taxes | $3,941 | $0 |
Property Value by Mortgage Status in Turah
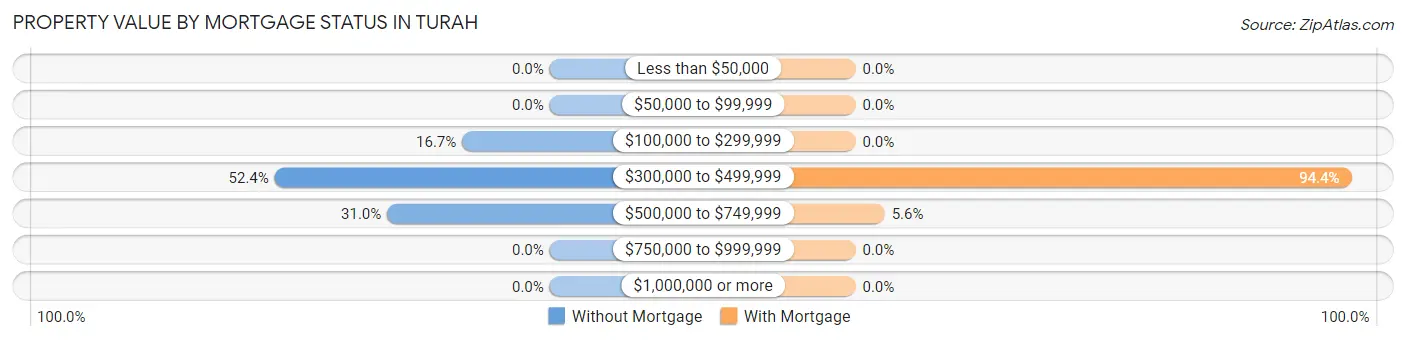
| Property Value | Without Mortgage | With Mortgage |
| Less than $50,000 | 0 (0.0%) | 0 (0.0%) |
| $50,000 to $99,999 | 0 (0.0%) | 0 (0.0%) |
| $100,000 to $299,999 | 7 (16.7%) | 0 (0.0%) |
| $300,000 to $499,999 | 22 (52.4%) | 85 (94.4%) |
| $500,000 to $749,999 | 13 (30.9%) | 5 (5.6%) |
| $750,000 to $999,999 | 0 (0.0%) | 0 (0.0%) |
| $1,000,000 or more | 0 (0.0%) | 0 (0.0%) |
| Total | 42 (100.0%) | 90 (100.0%) |
Household Income by Mortgage Status in Turah
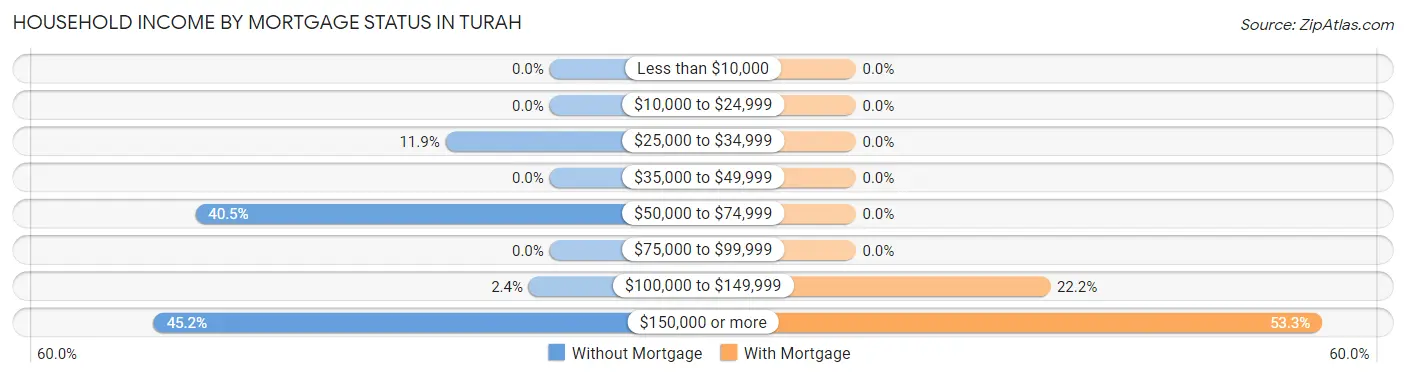
| Household Income | Without Mortgage | With Mortgage |
| Less than $10,000 | 0 (0.0%) | 0 (0.0%) |
| $10,000 to $24,999 | 0 (0.0%) | 0 (0.0%) |
| $25,000 to $34,999 | 5 (11.9%) | 0 (0.0%) |
| $35,000 to $49,999 | 0 (0.0%) | 0 (0.0%) |
| $50,000 to $74,999 | 17 (40.5%) | 0 (0.0%) |
| $75,000 to $99,999 | 0 (0.0%) | 0 (0.0%) |
| $100,000 to $149,999 | 1 (2.4%) | 20 (22.2%) |
| $150,000 or more | 19 (45.2%) | 48 (53.3%) |
| Total | 42 (100.0%) | 90 (100.0%) |
Property Value to Household Income Ratio in Turah
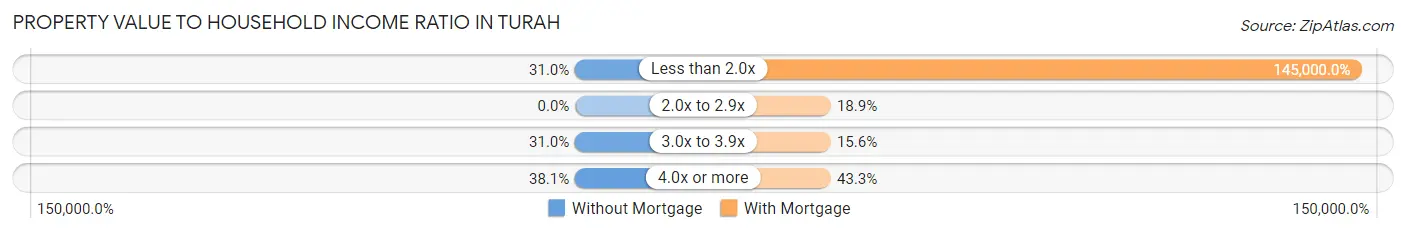
| Value-to-Income Ratio | Without Mortgage | With Mortgage |
| Less than 2.0x | 13 (30.9%) | 130,500 (145,000.0%) |
| 2.0x to 2.9x | 0 (0.0%) | 17 (18.9%) |
| 3.0x to 3.9x | 13 (30.9%) | 14 (15.6%) |
| 4.0x or more | 16 (38.1%) | 39 (43.3%) |
| Total | 42 (100.0%) | 90 (100.0%) |
Real Estate Taxes by Mortgage Status in Turah
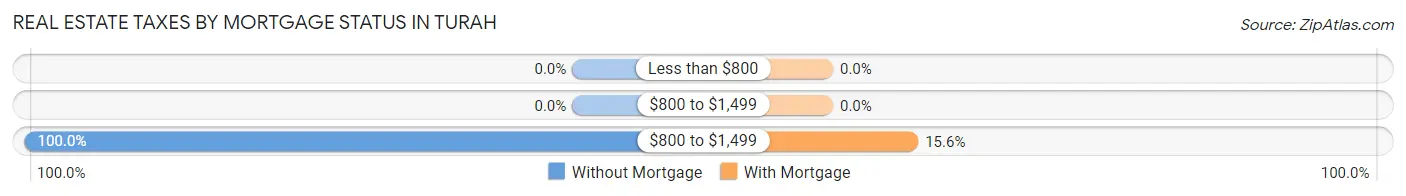
| Property Taxes | Without Mortgage | With Mortgage |
| Less than $800 | 0 (0.0%) | 0 (0.0%) |
| $800 to $1,499 | 0 (0.0%) | 0 (0.0%) |
| $800 to $1,499 | 42 (100.0%) | 14 (15.6%) |
| Total | 42 (100.0%) | 90 (100.0%) |
Health & Disability in Turah
Health Insurance Coverage by Age in Turah
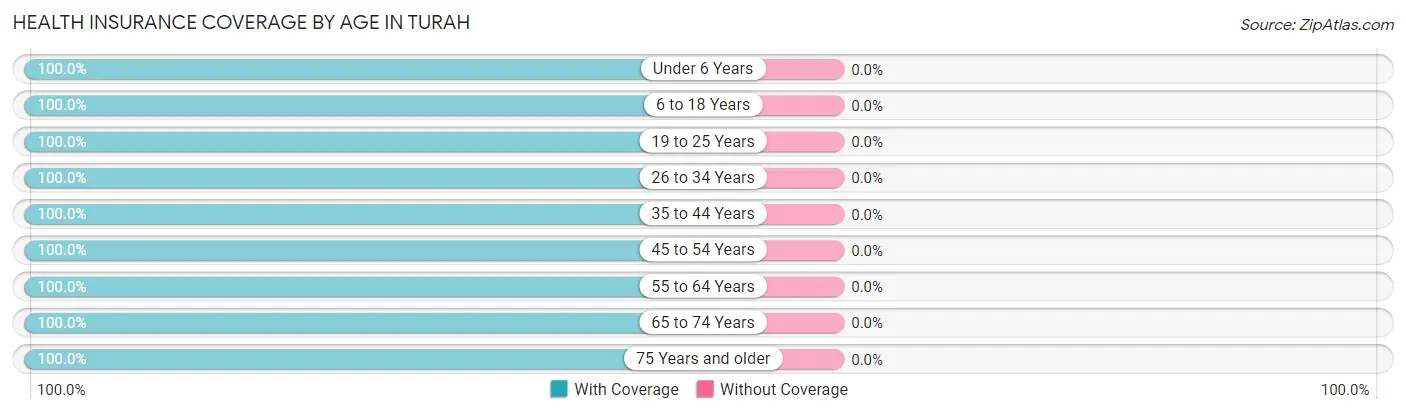
| Age Bracket | With Coverage | Without Coverage |
| Under 6 Years | 28 (100.0%) | 0 (0.0%) |
| 6 to 18 Years | 86 (100.0%) | 0 (0.0%) |
| 19 to 25 Years | 34 (100.0%) | 0 (0.0%) |
| 26 to 34 Years | 12 (100.0%) | 0 (0.0%) |
| 35 to 44 Years | 95 (100.0%) | 0 (0.0%) |
| 45 to 54 Years | 98 (100.0%) | 0 (0.0%) |
| 55 to 64 Years | 37 (100.0%) | 0 (0.0%) |
| 65 to 74 Years | 45 (100.0%) | 0 (0.0%) |
| 75 Years and older | 31 (100.0%) | 0 (0.0%) |
| Total | 466 (100.0%) | 0 (0.0%) |
Health Insurance Coverage by Citizenship Status in Turah
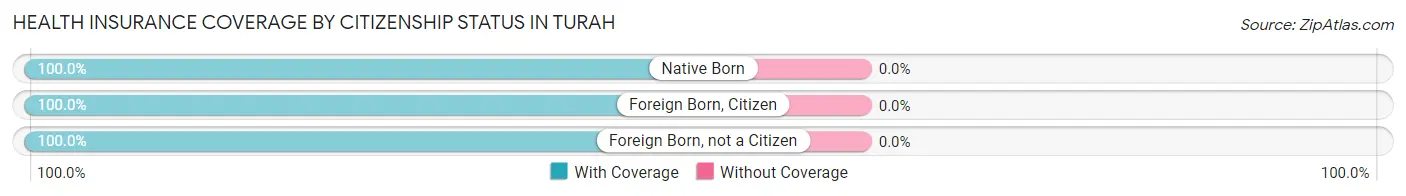
| Citizenship Status | With Coverage | Without Coverage |
| Native Born | 28 (100.0%) | 0 (0.0%) |
| Foreign Born, Citizen | 86 (100.0%) | 0 (0.0%) |
| Foreign Born, not a Citizen | 34 (100.0%) | 0 (0.0%) |
Health Insurance Coverage by Household Income in Turah
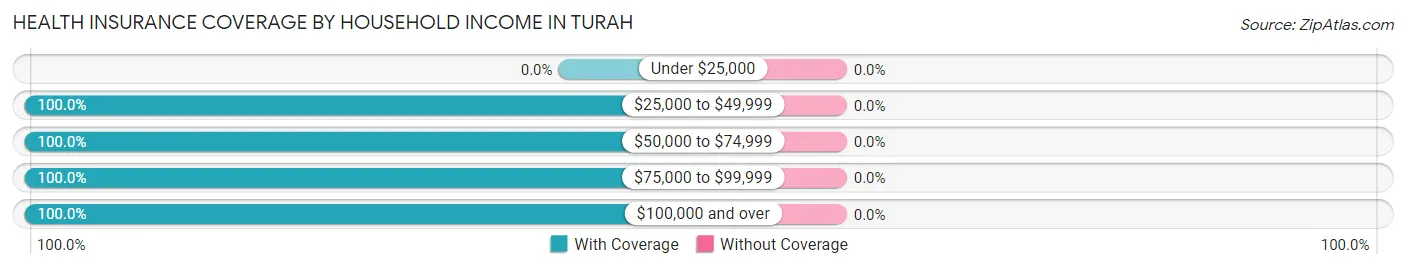
| Household Income | With Coverage | Without Coverage |
| Under $25,000 | 0 (0.0%) | 0 (0.0%) |
| $25,000 to $49,999 | 5 (100.0%) | 0 (0.0%) |
| $50,000 to $74,999 | 40 (100.0%) | 0 (0.0%) |
| $75,000 to $99,999 | 86 (100.0%) | 0 (0.0%) |
| $100,000 and over | 335 (100.0%) | 0 (0.0%) |
Public vs Private Health Insurance Coverage by Age in Turah
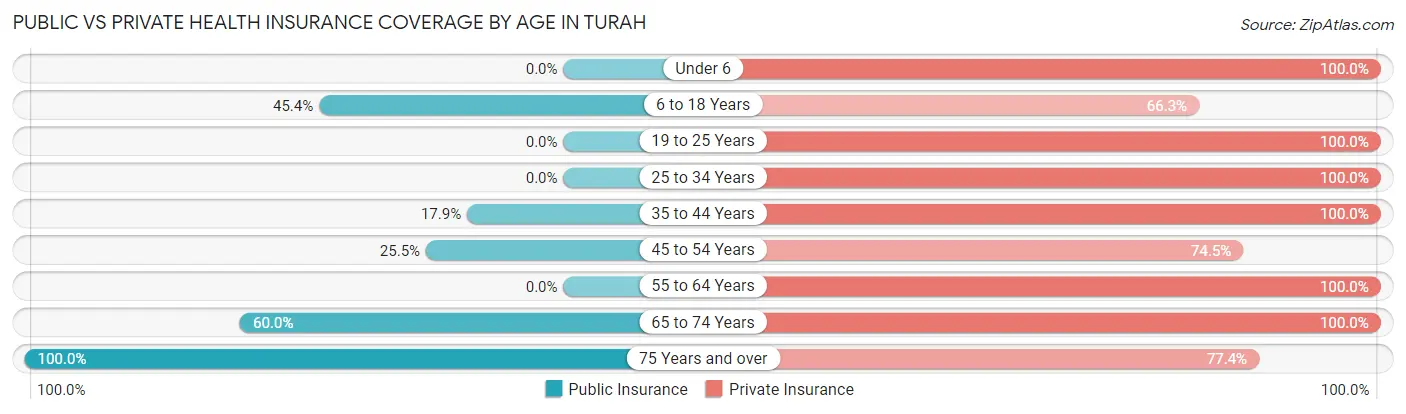
| Age Bracket | Public Insurance | Private Insurance |
| Under 6 | 0 (0.0%) | 28 (100.0%) |
| 6 to 18 Years | 39 (45.4%) | 57 (66.3%) |
| 19 to 25 Years | 0 (0.0%) | 34 (100.0%) |
| 25 to 34 Years | 0 (0.0%) | 12 (100.0%) |
| 35 to 44 Years | 17 (17.9%) | 95 (100.0%) |
| 45 to 54 Years | 25 (25.5%) | 73 (74.5%) |
| 55 to 64 Years | 0 (0.0%) | 37 (100.0%) |
| 65 to 74 Years | 27 (60.0%) | 45 (100.0%) |
| 75 Years and over | 31 (100.0%) | 24 (77.4%) |
| Total | 139 (29.8%) | 405 (86.9%) |
Disability Status by Sex by Age in Turah
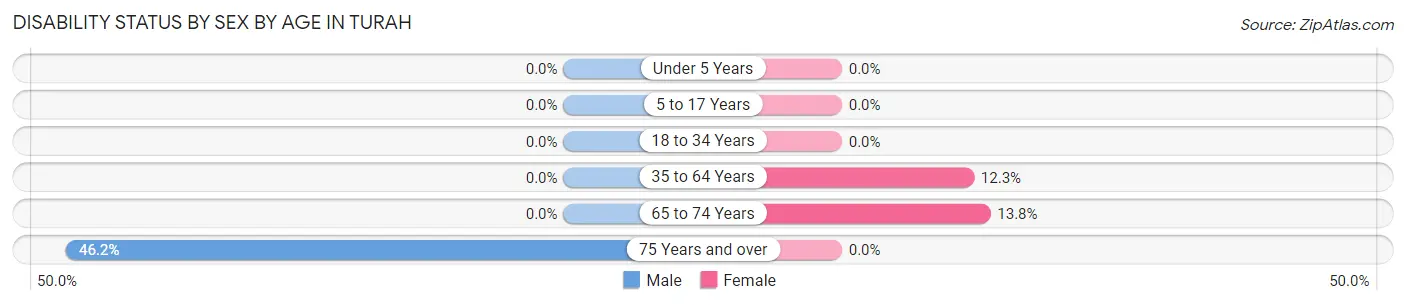
| Age Bracket | Male | Female |
| Under 5 Years | 0 (0.0%) | 0 (0.0%) |
| 5 to 17 Years | 0 (0.0%) | 0 (0.0%) |
| 18 to 34 Years | 0 (0.0%) | 0 (0.0%) |
| 35 to 64 Years | 0 (0.0%) | 13 (12.3%) |
| 65 to 74 Years | 0 (0.0%) | 4 (13.8%) |
| 75 Years and over | 6 (46.2%) | 0 (0.0%) |
Disability Class by Sex by Age in Turah
Disability Class: Hearing Difficulty
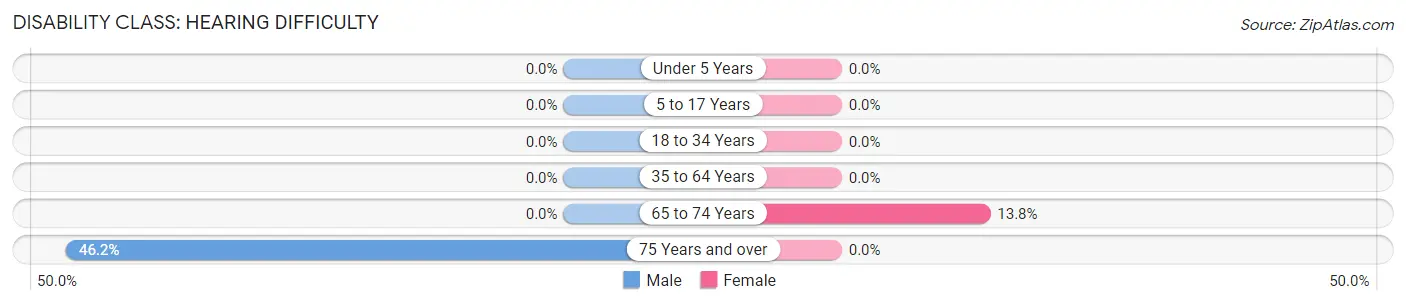
| Age Bracket | Male | Female |
| Under 5 Years | 0 (0.0%) | 0 (0.0%) |
| 5 to 17 Years | 0 (0.0%) | 0 (0.0%) |
| 18 to 34 Years | 0 (0.0%) | 0 (0.0%) |
| 35 to 64 Years | 0 (0.0%) | 0 (0.0%) |
| 65 to 74 Years | 0 (0.0%) | 4 (13.8%) |
| 75 Years and over | 6 (46.2%) | 0 (0.0%) |
Disability Class: Vision Difficulty
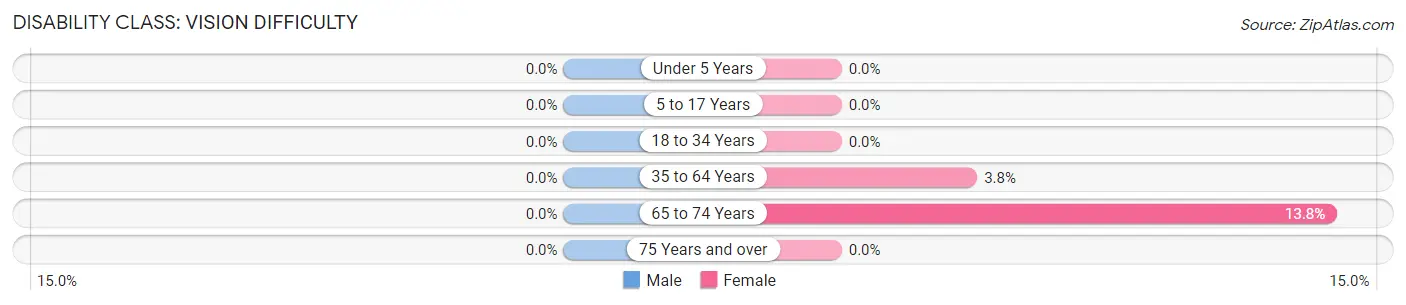
| Age Bracket | Male | Female |
| Under 5 Years | 0 (0.0%) | 0 (0.0%) |
| 5 to 17 Years | 0 (0.0%) | 0 (0.0%) |
| 18 to 34 Years | 0 (0.0%) | 0 (0.0%) |
| 35 to 64 Years | 0 (0.0%) | 4 (3.8%) |
| 65 to 74 Years | 0 (0.0%) | 4 (13.8%) |
| 75 Years and over | 0 (0.0%) | 0 (0.0%) |
Disability Class: Cognitive Difficulty
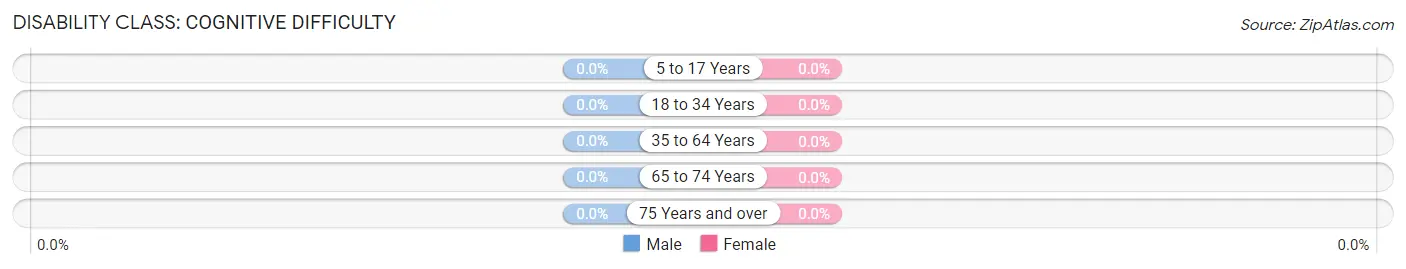
| Age Bracket | Male | Female |
| 5 to 17 Years | 0 (0.0%) | 0 (0.0%) |
| 18 to 34 Years | 0 (0.0%) | 0 (0.0%) |
| 35 to 64 Years | 0 (0.0%) | 0 (0.0%) |
| 65 to 74 Years | 0 (0.0%) | 0 (0.0%) |
| 75 Years and over | 0 (0.0%) | 0 (0.0%) |
Disability Class: Ambulatory Difficulty
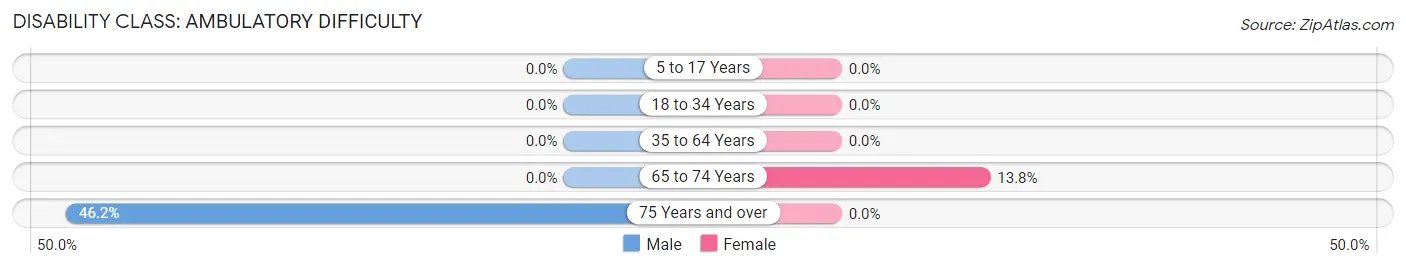
| Age Bracket | Male | Female |
| 5 to 17 Years | 0 (0.0%) | 0 (0.0%) |
| 18 to 34 Years | 0 (0.0%) | 0 (0.0%) |
| 35 to 64 Years | 0 (0.0%) | 0 (0.0%) |
| 65 to 74 Years | 0 (0.0%) | 4 (13.8%) |
| 75 Years and over | 6 (46.2%) | 0 (0.0%) |
Disability Class: Self-Care Difficulty
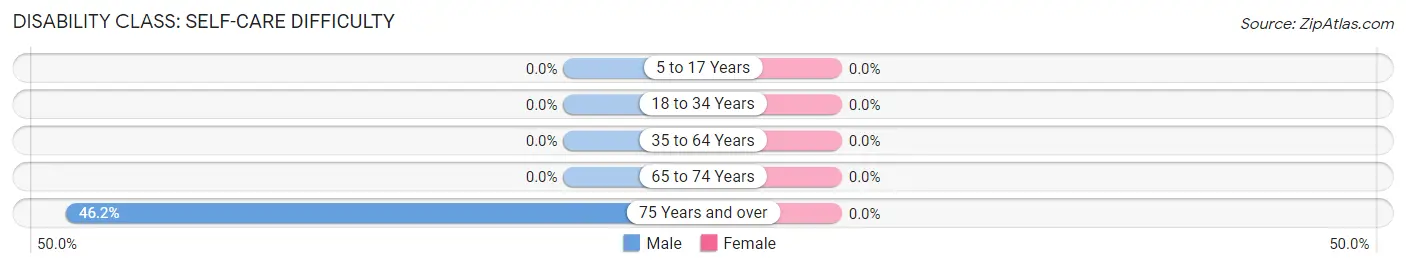
| Age Bracket | Male | Female |
| 5 to 17 Years | 0 (0.0%) | 0 (0.0%) |
| 18 to 34 Years | 0 (0.0%) | 0 (0.0%) |
| 35 to 64 Years | 0 (0.0%) | 0 (0.0%) |
| 65 to 74 Years | 0 (0.0%) | 0 (0.0%) |
| 75 Years and over | 6 (46.2%) | 0 (0.0%) |
Technology Access in Turah
Computing Device Access in Turah
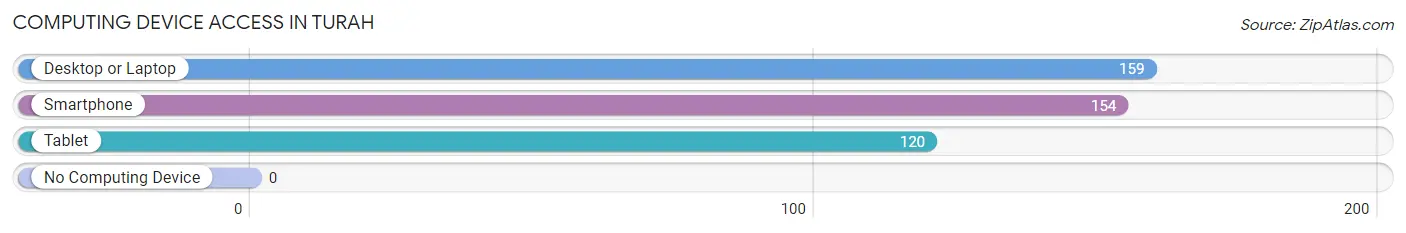
| Device Type | # Households | % Households |
| Desktop or Laptop | 159 | 97.0% |
| Smartphone | 154 | 93.9% |
| Tablet | 120 | 73.2% |
| No Computing Device | 0 | 0.0% |
| Total | 164 | 100.0% |
Internet Access in Turah
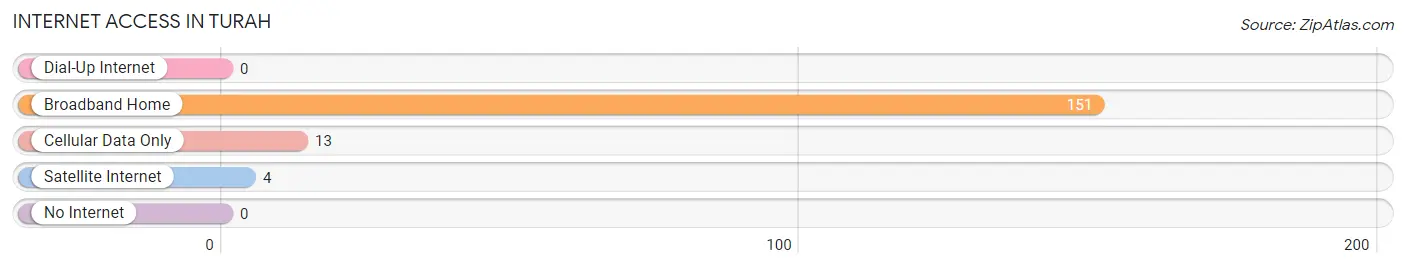
| Internet Type | # Households | % Households |
| Dial-Up Internet | 0 | 0.0% |
| Broadband Home | 151 | 92.1% |
| Cellular Data Only | 13 | 7.9% |
| Satellite Internet | 4 | 2.4% |
| No Internet | 0 | 0.0% |
| Total | 164 | 100.0% |
Turah Summary
Turah is a small unincorporated community located in Missoula County, Montana. It is situated along the Clark Fork River, approximately 10 miles east of Missoula. The population of Turah was estimated to be around 200 people in 2020.
History
The area that is now Turah was first settled in the late 1800s by homesteaders. The town was originally known as “Turah Station” and was a stop on the Northern Pacific Railway. The town was officially incorporated in 1909 and the name was changed to Turah.
The town was a popular stop for travelers and tourists, as it was located near the entrance to the Flathead Indian Reservation. The town was also known for its logging industry, which provided employment for many of the town’s residents.
Geography
Turah is located in the western part of Montana, in Missoula County. It is situated along the Clark Fork River, approximately 10 miles east of Missoula. The town is surrounded by the Rocky Mountains and is located in a valley. The elevation of Turah is 3,400 feet above sea level.
The climate in Turah is semi-arid, with hot summers and cold winters. The average annual temperature is around 50 degrees Fahrenheit. The average annual precipitation is around 15 inches.
Economy
The economy of Turah is largely based on agriculture and tourism. The town is home to several small farms and ranches, which produce a variety of crops and livestock. The town is also a popular destination for tourists, as it is located near the entrance to the Flathead Indian Reservation.
The town is also home to several small businesses, including restaurants, stores, and a gas station. The town is also home to a post office and a library.
Demographics
The population of Turah was estimated to be around 200 people in 2020. The racial makeup of the town is predominantly white, with a small percentage of Native American and Hispanic residents. The median household income in Turah is around $35,000. The median age of the town’s residents is around 40 years old.
Turah is a small, rural community with a rich history and a unique culture. The town is home to a diverse population and is a popular destination for tourists. The town is also home to several small businesses and farms, which provide employment for many of the town’s residents. Turah is a great place to live and visit, and is a great example of the beauty and culture of Montana.
Common Questions
What is Per Capita Income in Turah?
Per Capita income in Turah is $56,165.
What is the Median Family Income in Turah?
Median Family Income in Turah is $124,464.
What is the Median Household income in Turah?
Median Household Income in Turah is $123,393.
What is Income or Wage Gap in Turah?
Income or Wage Gap in Turah is 34.9%.
Women in Turah earn 65.1 cents for every dollar earned by a man.
What is Inequality or Gini Index in Turah?
Inequality or Gini Index in Turah is 0.36.
What is the Total Population of Turah?
Total Population of Turah is 466.
What is the Total Male Population of Turah?
Total Male Population of Turah is 265.
What is the Total Female Population of Turah?
Total Female Population of Turah is 201.
What is the Ratio of Males per 100 Females in Turah?
There are 131.84 Males per 100 Females in Turah.
What is the Ratio of Females per 100 Males in Turah?
There are 75.85 Females per 100 Males in Turah.
What is the Median Population Age in Turah?
Median Population Age in Turah is 43.6 Years.
What is the Average Family Size in Turah
Average Family Size in Turah is 3.0 People.
What is the Average Household Size in Turah
Average Household Size in Turah is 2.8 People.
How Large is the Labor Force in Turah?
There are 286 People in the Labor Forcein in Turah.
What is the Percentage of People in the Labor Force in Turah?
77.9% of People are in the Labor Force in Turah.
What is the Unemployment Rate in Turah?
Unemployment Rate in Turah is 8.7%.