Helena Valley Northeast, MT Map & Demographics
Helena Valley Northeast Map
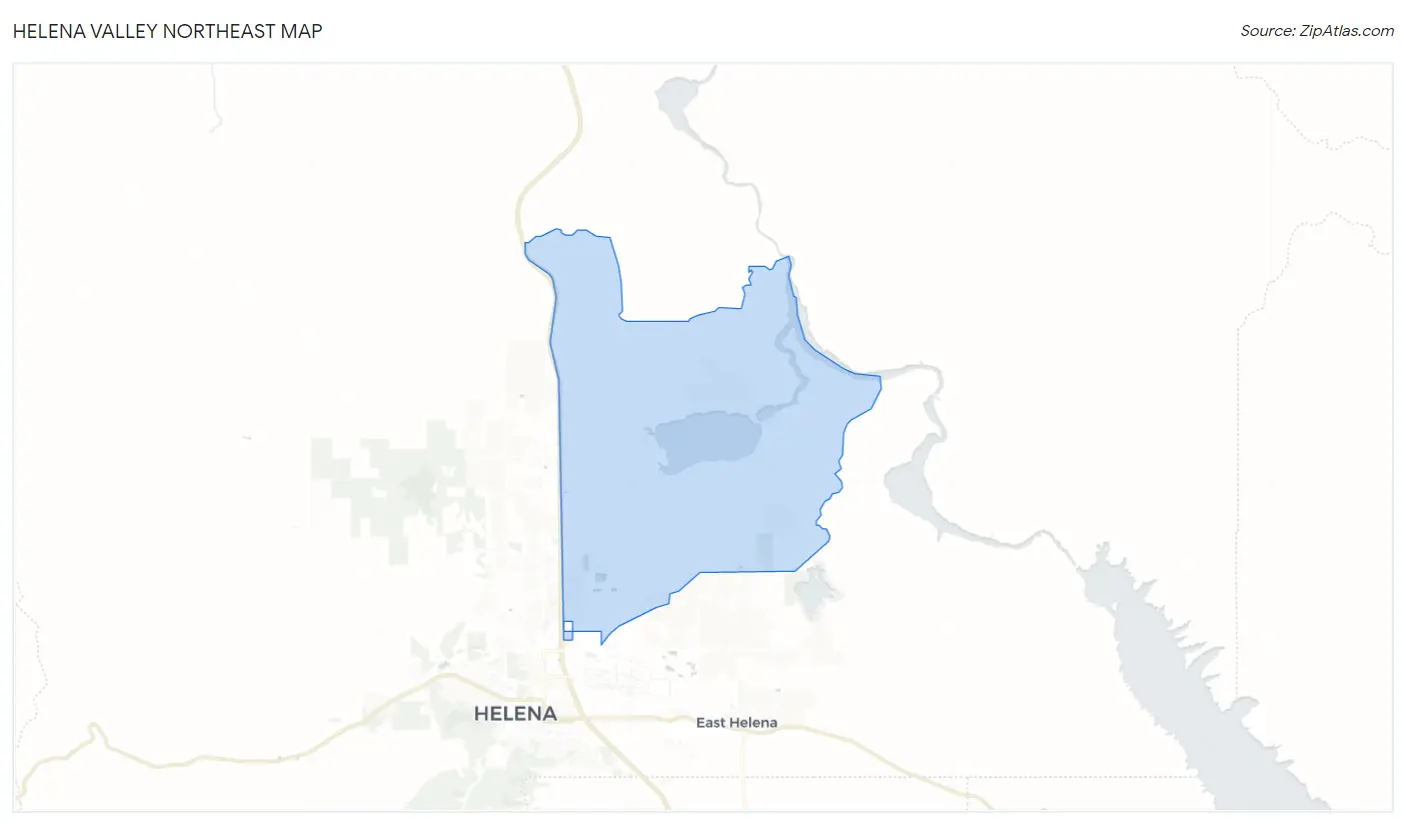
Helena Valley Northeast Overview
$61,957
PER CAPITA INCOME
$146,641
AVG FAMILY INCOME
$137,500
AVG HOUSEHOLD INCOME
40.5%
WAGE / INCOME GAP [ % ]
59.5¢/ $1
WAGE / INCOME GAP [ $ ]
0.40
INEQUALITY / GINI INDEX
4,245
TOTAL POPULATION
2,217
MALE POPULATION
2,028
FEMALE POPULATION
109.32
MALES / 100 FEMALES
91.47
FEMALES / 100 MALES
47.4
MEDIAN AGE
2.8
AVG FAMILY SIZE
2.8
AVG HOUSEHOLD SIZE
2,481
LABOR FORCE [ PEOPLE ]
67.2%
PERCENT IN LABOR FORCE
1.5%
UNEMPLOYMENT RATE
Income in Helena Valley Northeast
Income Overview in Helena Valley Northeast
Per Capita Income in Helena Valley Northeast is $61,957, while median incomes of families and households are $146,641 and $137,500 respectively.
| Characteristic | Number | Measure |
| Per Capita Income | 4,245 | $61,957 |
| Median Family Income | 1,212 | $146,641 |
| Mean Family Income | 1,212 | $189,554 |
| Median Household Income | 1,528 | $137,500 |
| Mean Household Income | 1,528 | $170,943 |
| Income Deficit | 1,212 | $0 |
| Wage / Income Gap (%) | 4,245 | 40.47% |
| Wage / Income Gap ($) | 4,245 | 59.53¢ per $1 |
| Gini / Inequality Index | 4,245 | 0.40 |
Earnings by Sex in Helena Valley Northeast
Average Earnings in Helena Valley Northeast are $66,935, $80,243 for men and $47,768 for women, a difference of 40.5%.
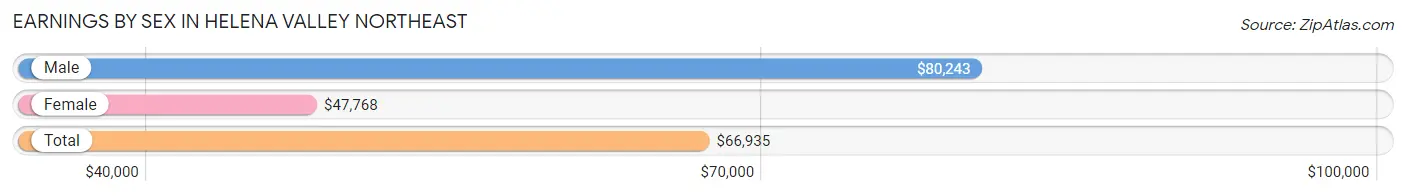
| Sex | Number | Average Earnings |
| Male | 1,402 (53.6%) | $80,243 |
| Female | 1,214 (46.4%) | $47,768 |
| Total | 2,616 (100.0%) | $66,935 |
Earnings by Sex by Income Bracket in Helena Valley Northeast
The most common earnings brackets in Helena Valley Northeast are $100,000+ for men (441 | 31.5%) and $75,000 to $99,999 for women (268 | 22.1%).
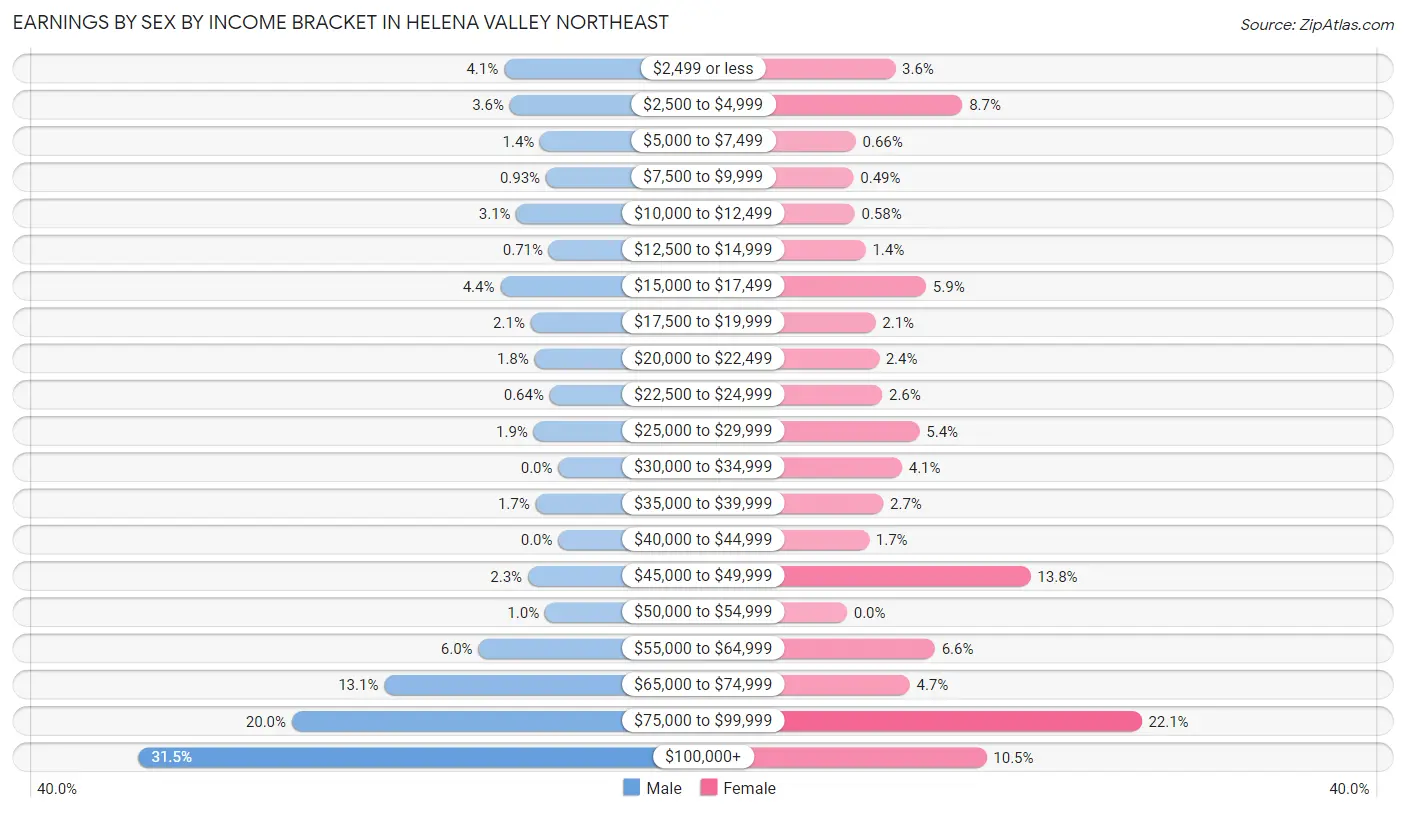
| Income | Male | Female |
| $2,499 or less | 57 (4.1%) | 44 (3.6%) |
| $2,500 to $4,999 | 51 (3.6%) | 105 (8.6%) |
| $5,000 to $7,499 | 19 (1.4%) | 8 (0.7%) |
| $7,500 to $9,999 | 13 (0.9%) | 6 (0.5%) |
| $10,000 to $12,499 | 44 (3.1%) | 7 (0.6%) |
| $12,500 to $14,999 | 10 (0.7%) | 17 (1.4%) |
| $15,000 to $17,499 | 61 (4.3%) | 72 (5.9%) |
| $17,500 to $19,999 | 29 (2.1%) | 26 (2.1%) |
| $20,000 to $22,499 | 25 (1.8%) | 29 (2.4%) |
| $22,500 to $24,999 | 9 (0.6%) | 32 (2.6%) |
| $25,000 to $29,999 | 26 (1.8%) | 66 (5.4%) |
| $30,000 to $34,999 | 0 (0.0%) | 50 (4.1%) |
| $35,000 to $39,999 | 24 (1.7%) | 33 (2.7%) |
| $40,000 to $44,999 | 0 (0.0%) | 20 (1.7%) |
| $45,000 to $49,999 | 32 (2.3%) | 167 (13.8%) |
| $50,000 to $54,999 | 14 (1.0%) | 0 (0.0%) |
| $55,000 to $64,999 | 84 (6.0%) | 80 (6.6%) |
| $65,000 to $74,999 | 183 (13.1%) | 57 (4.7%) |
| $75,000 to $99,999 | 280 (20.0%) | 268 (22.1%) |
| $100,000+ | 441 (31.5%) | 127 (10.5%) |
| Total | 1,402 (100.0%) | 1,214 (100.0%) |
Earnings by Sex by Educational Attainment in Helena Valley Northeast
Average earnings in Helena Valley Northeast are $81,570 for men and $49,524 for women, a difference of 39.3%. Men with an educational attainment of high school diploma enjoy the highest average annual earnings of $95,365, while those with college or associate's degree education earn the least with $67,989. Women with an educational attainment of bachelor's degree earn the most with the average annual earnings of $75,336, while those with high school diploma education have the smallest earnings of $17,083.
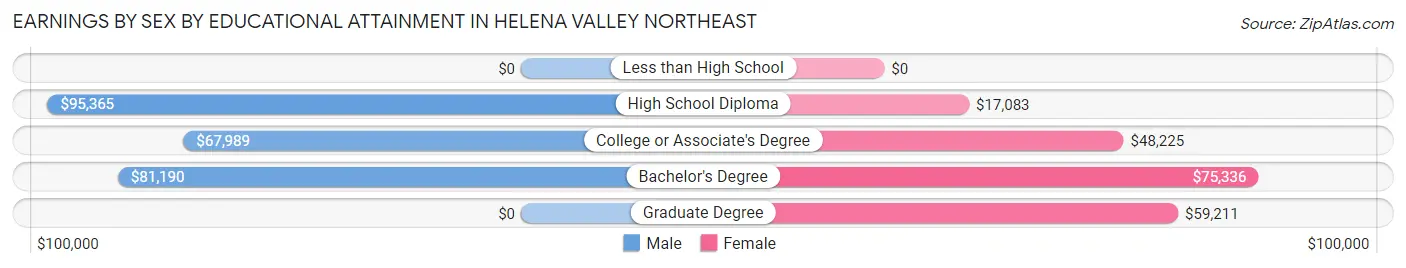
| Educational Attainment | Male Income | Female Income |
| Less than High School | - | - |
| High School Diploma | $95,365 | $17,083 |
| College or Associate's Degree | $67,989 | $48,225 |
| Bachelor's Degree | $81,190 | $75,336 |
| Graduate Degree | - | - |
| Total | $81,570 | $49,524 |
Family Income in Helena Valley Northeast
Family Income Brackets in Helena Valley Northeast
According to the Helena Valley Northeast family income data, there are 360 families falling into the $100,000 to $149,999 income range, which is the most common income bracket and makes up 29.7% of all families.
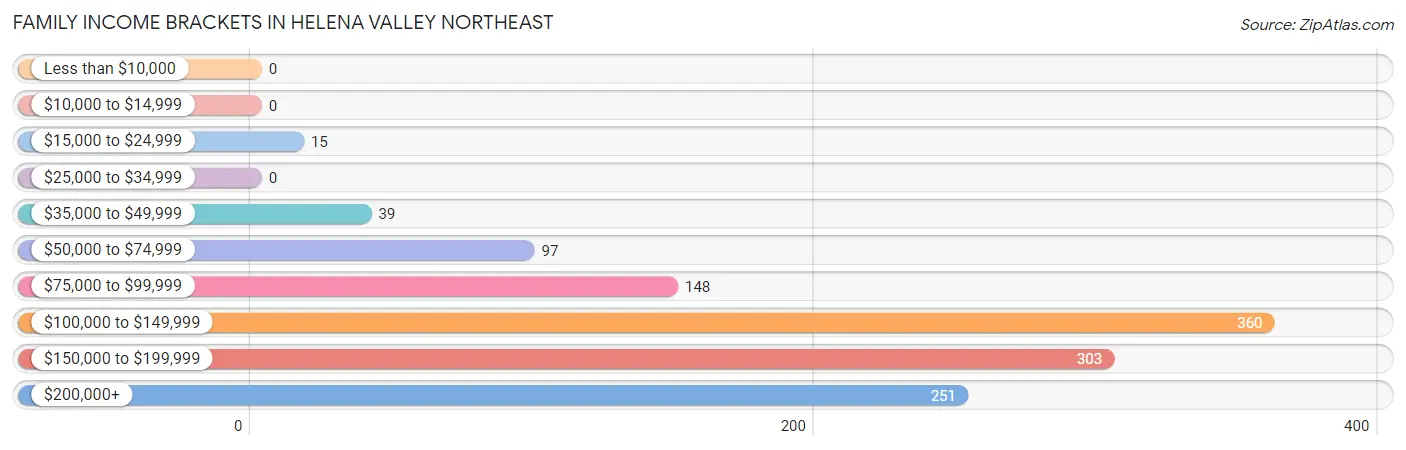
| Income Bracket | # Families | % Families |
| Less than $10,000 | 0 | 0.0% |
| $10,000 to $14,999 | 0 | 0.0% |
| $15,000 to $24,999 | 15 | 1.2% |
| $25,000 to $34,999 | 0 | 0.0% |
| $35,000 to $49,999 | 39 | 3.2% |
| $50,000 to $74,999 | 97 | 8.0% |
| $75,000 to $99,999 | 148 | 12.2% |
| $100,000 to $149,999 | 360 | 29.7% |
| $150,000 to $199,999 | 303 | 25.0% |
| $200,000+ | 251 | 20.7% |
Family Income by Famaliy Size in Helena Valley Northeast
3-person families (268 | 22.1%) account for the highest median family income in Helena Valley Northeast with $233,088 per family, while 3-person families (268 | 22.1%) have the highest median income of $77,696 per family member.
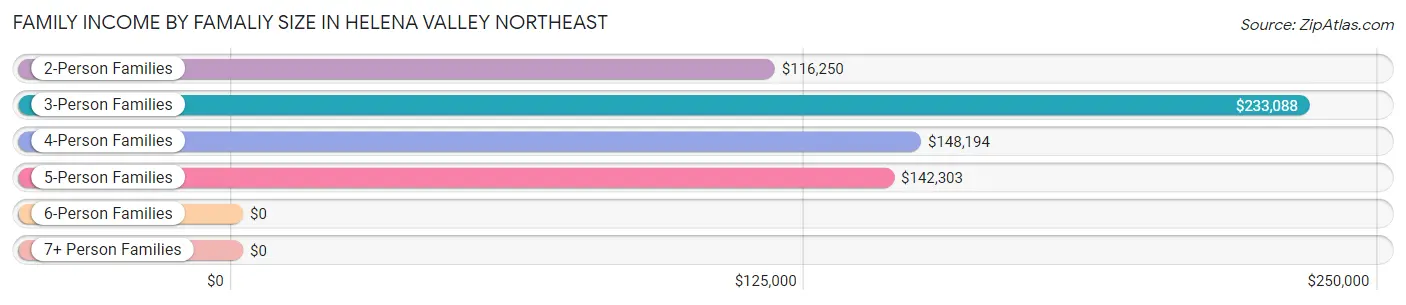
| Income Bracket | # Families | Median Income |
| 2-Person Families | 623 (51.4%) | $116,250 |
| 3-Person Families | 268 (22.1%) | $233,088 |
| 4-Person Families | 188 (15.5%) | $148,194 |
| 5-Person Families | 114 (9.4%) | $142,303 |
| 6-Person Families | 19 (1.6%) | $0 |
| 7+ Person Families | 0 (0.0%) | $0 |
| Total | 1,212 (100.0%) | $146,641 |
Family Income by Number of Earners in Helena Valley Northeast
The median family income in Helena Valley Northeast is $146,641, with families comprising 2 earners (731) having the highest median family income of $158,810, while families with 1 earner (227) have the lowest median family income of $75,685, accounting for 60.3% and 18.7% of families, respectively.
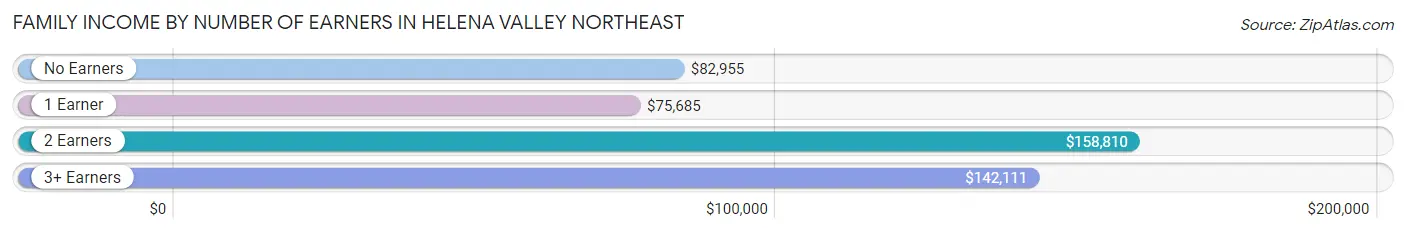
| Number of Earners | # Families | Median Income |
| No Earners | 104 (8.6%) | $82,955 |
| 1 Earner | 227 (18.7%) | $75,685 |
| 2 Earners | 731 (60.3%) | $158,810 |
| 3+ Earners | 150 (12.4%) | $142,111 |
| Total | 1,212 (100.0%) | $146,641 |
Household Income in Helena Valley Northeast
Household Income Brackets in Helena Valley Northeast
With 397 households falling in the category, the $100,000 to $149,999 income range is the most frequent in Helena Valley Northeast, accounting for 26.0% of all households.
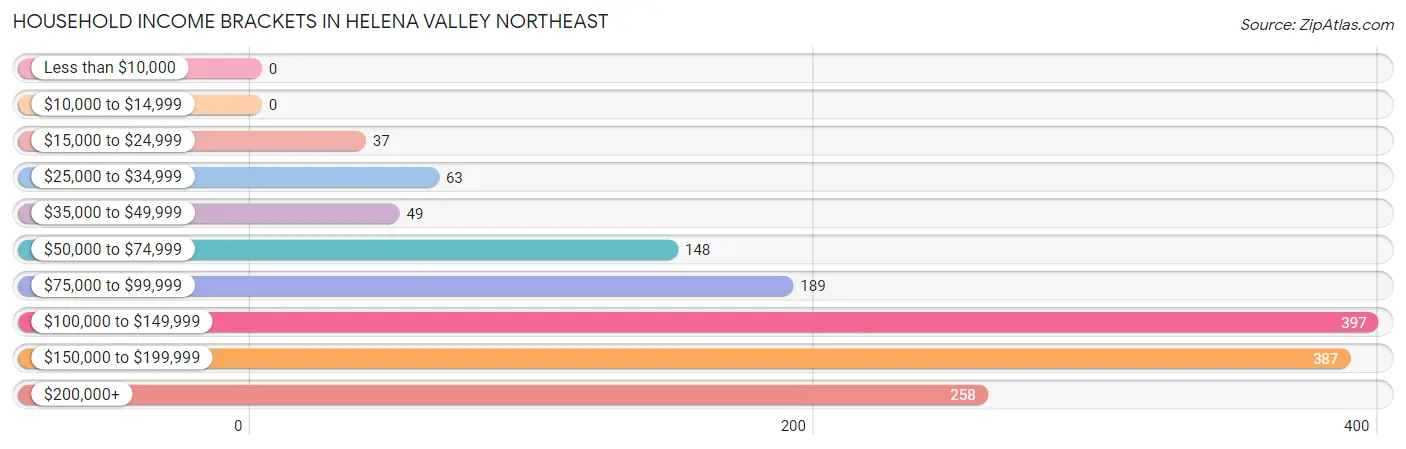
| Income Bracket | # Households | % Households |
| Less than $10,000 | 0 | 0.0% |
| $10,000 to $14,999 | 0 | 0.0% |
| $15,000 to $24,999 | 37 | 2.4% |
| $25,000 to $34,999 | 63 | 4.1% |
| $35,000 to $49,999 | 49 | 3.2% |
| $50,000 to $74,999 | 148 | 9.7% |
| $75,000 to $99,999 | 189 | 12.4% |
| $100,000 to $149,999 | 397 | 26.0% |
| $150,000 to $199,999 | 387 | 25.3% |
| $200,000+ | 258 | 16.9% |
Household Income by Householder Age in Helena Valley Northeast
The median household income in Helena Valley Northeast is $137,500, with the highest median household income of $170,357 found in the 25 to 44 years age bracket for the primary householder. A total of 448 households (29.3%) fall into this category.
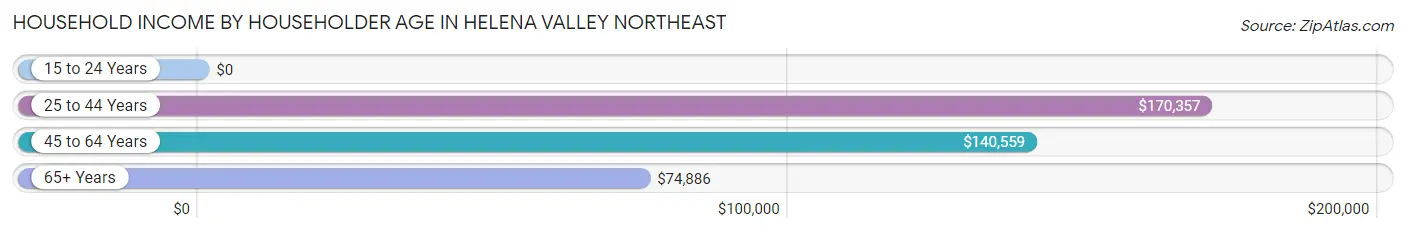
| Income Bracket | # Households | Median Income |
| 15 to 24 Years | 0 (0.0%) | $0 |
| 25 to 44 Years | 448 (29.3%) | $170,357 |
| 45 to 64 Years | 799 (52.3%) | $140,559 |
| 65+ Years | 281 (18.4%) | $74,886 |
| Total | 1,528 (100.0%) | $137,500 |
Poverty in Helena Valley Northeast
Income Below Poverty by Sex and Age in Helena Valley Northeast
With 5.1% poverty level for males and 7.3% for females among the residents of Helena Valley Northeast, 65 to 74 year old males and 75 year old and over females are the most vulnerable to poverty, with 34 males (18.3%) and 96 females (47.1%) in their respective age groups living below the poverty level.
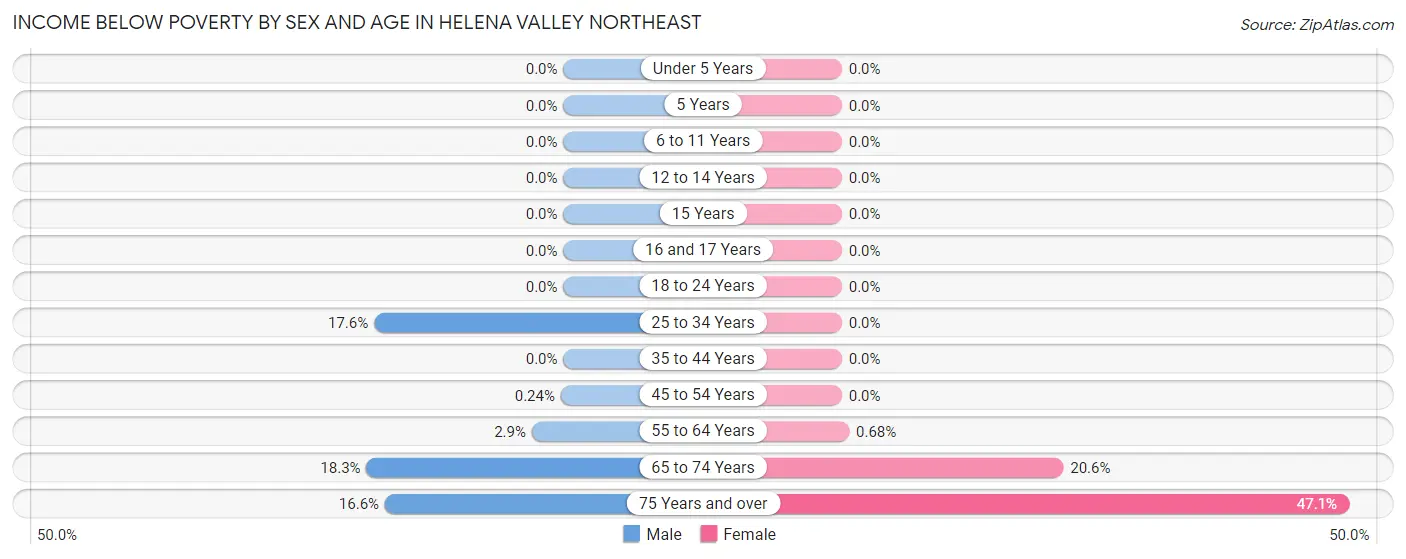
| Age Bracket | Male | Female |
| Under 5 Years | 0 (0.0%) | 0 (0.0%) |
| 5 Years | 0 (0.0%) | 0 (0.0%) |
| 6 to 11 Years | 0 (0.0%) | 0 (0.0%) |
| 12 to 14 Years | 0 (0.0%) | 0 (0.0%) |
| 15 Years | 0 (0.0%) | 0 (0.0%) |
| 16 and 17 Years | 0 (0.0%) | 0 (0.0%) |
| 18 to 24 Years | 0 (0.0%) | 0 (0.0%) |
| 25 to 34 Years | 42 (17.6%) | 0 (0.0%) |
| 35 to 44 Years | 0 (0.0%) | 0 (0.0%) |
| 45 to 54 Years | 1 (0.2%) | 0 (0.0%) |
| 55 to 64 Years | 11 (2.9%) | 2 (0.7%) |
| 65 to 74 Years | 34 (18.3%) | 51 (20.6%) |
| 75 Years and over | 25 (16.6%) | 96 (47.1%) |
| Total | 113 (5.1%) | 149 (7.3%) |
Income Above Poverty by Sex and Age in Helena Valley Northeast
According to the poverty statistics in Helena Valley Northeast, males aged under 5 years and females aged under 5 years are the age groups that are most secure financially, with 100.0% of males and 100.0% of females in these age groups living above the poverty line.
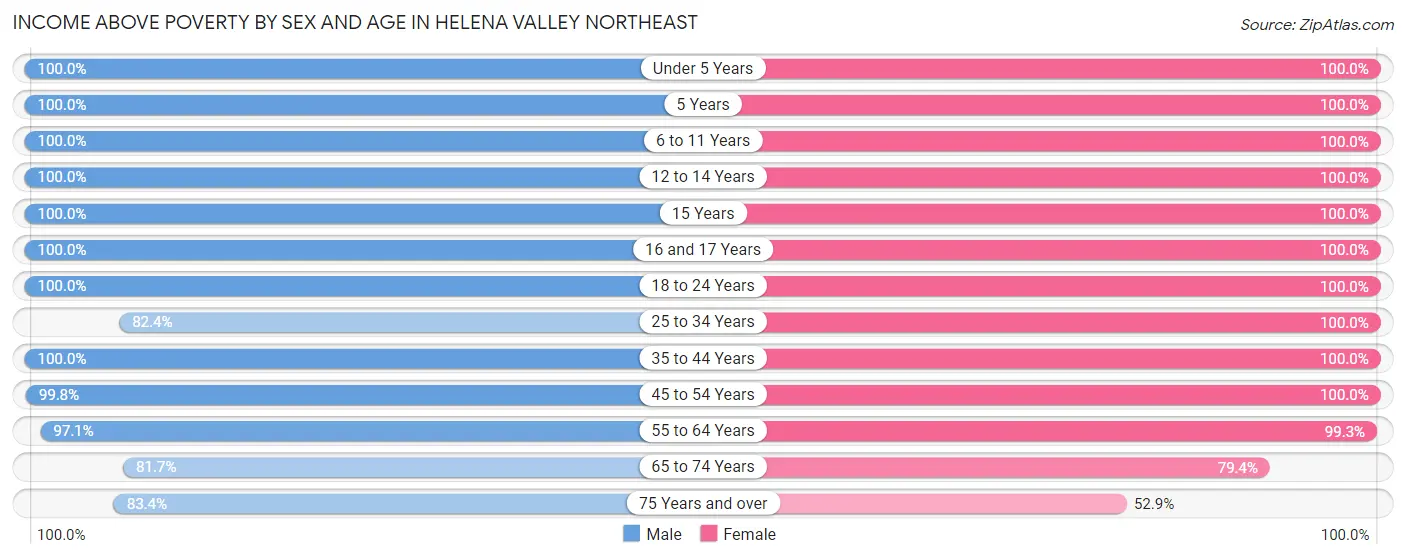
| Age Bracket | Male | Female |
| Under 5 Years | 75 (100.0%) | 112 (100.0%) |
| 5 Years | 19 (100.0%) | 33 (100.0%) |
| 6 to 11 Years | 77 (100.0%) | 62 (100.0%) |
| 12 to 14 Years | 96 (100.0%) | 34 (100.0%) |
| 15 Years | 29 (100.0%) | 16 (100.0%) |
| 16 and 17 Years | 75 (100.0%) | 52 (100.0%) |
| 18 to 24 Years | 188 (100.0%) | 118 (100.0%) |
| 25 to 34 Years | 197 (82.4%) | 192 (100.0%) |
| 35 to 44 Years | 292 (100.0%) | 235 (100.0%) |
| 45 to 54 Years | 414 (99.8%) | 429 (100.0%) |
| 55 to 64 Years | 364 (97.1%) | 291 (99.3%) |
| 65 to 74 Years | 152 (81.7%) | 197 (79.4%) |
| 75 Years and over | 126 (83.4%) | 108 (52.9%) |
| Total | 2,104 (94.9%) | 1,879 (92.6%) |
Income Below Poverty Among Married-Couple Families in Helena Valley Northeast
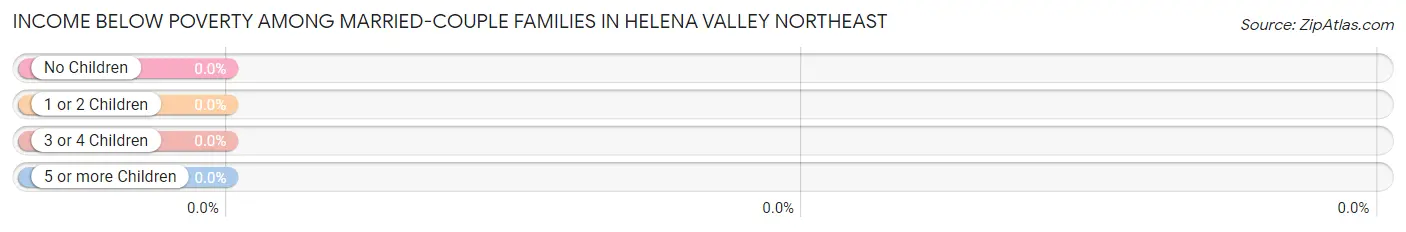
| Children | Above Poverty | Below Poverty |
| No Children | 620 (100.0%) | 0 (0.0%) |
| 1 or 2 Children | 439 (100.0%) | 0 (0.0%) |
| 3 or 4 Children | 52 (100.0%) | 0 (0.0%) |
| 5 or more Children | 0 (0.0%) | 0 (0.0%) |
| Total | 1,111 (100.0%) | 0 (0.0%) |
Income Below Poverty Among Single-Parent Households in Helena Valley Northeast
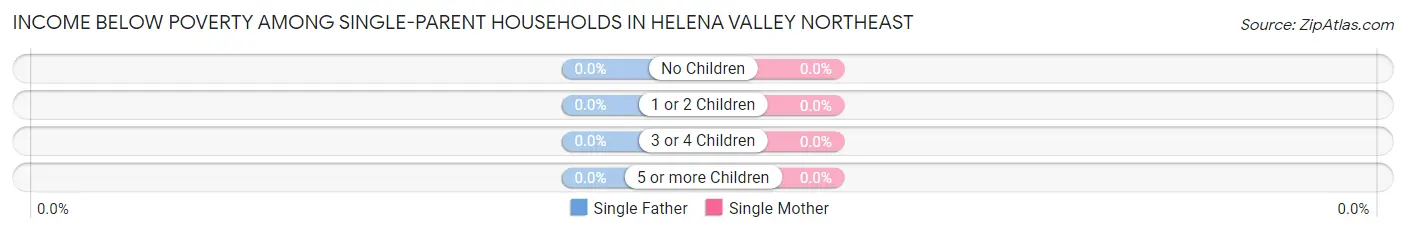
| Children | Single Father | Single Mother |
| No Children | 0 (0.0%) | 0 (0.0%) |
| 1 or 2 Children | 0 (0.0%) | 0 (0.0%) |
| 3 or 4 Children | 0 (0.0%) | 0 (0.0%) |
| 5 or more Children | 0 (0.0%) | 0 (0.0%) |
| Total | 0 (0.0%) | 0 (0.0%) |
Income Below Poverty Among Married-Couple vs Single-Parent Households in Helena Valley Northeast
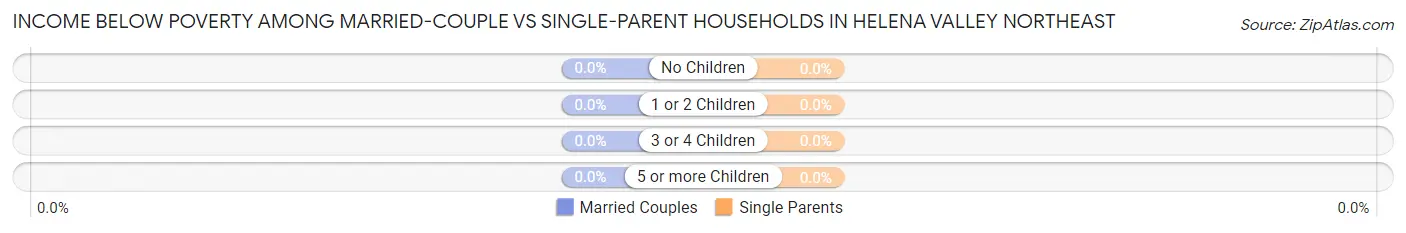
| Children | Married-Couple Families | Single-Parent Households |
| No Children | 0 (0.0%) | 0 (0.0%) |
| 1 or 2 Children | 0 (0.0%) | 0 (0.0%) |
| 3 or 4 Children | 0 (0.0%) | 0 (0.0%) |
| 5 or more Children | 0 (0.0%) | 0 (0.0%) |
| Total | 0 (0.0%) | 0 (0.0%) |
Race in Helena Valley Northeast
The most populous races in Helena Valley Northeast are White / Caucasian (4,016 | 94.6%), Two or more Races (126 | 3.0%), and Asian (72 | 1.7%).
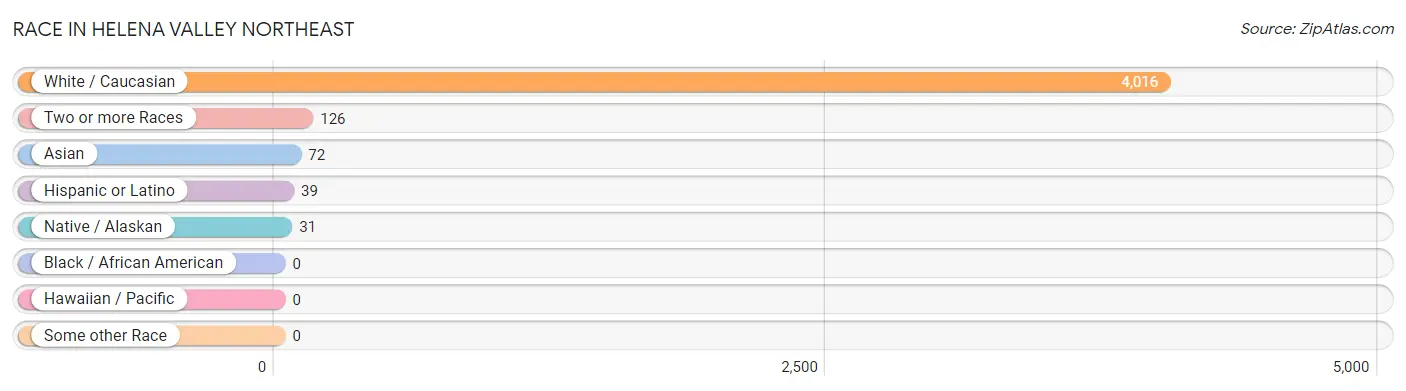
| Race | # Population | % Population |
| Asian | 72 | 1.7% |
| Black / African American | 0 | 0.0% |
| Hawaiian / Pacific | 0 | 0.0% |
| Hispanic or Latino | 39 | 0.9% |
| Native / Alaskan | 31 | 0.7% |
| White / Caucasian | 4,016 | 94.6% |
| Two or more Races | 126 | 3.0% |
| Some other Race | 0 | 0.0% |
| Total | 4,245 | 100.0% |
Ancestry in Helena Valley Northeast
The most populous ancestries reported in Helena Valley Northeast are German (1,136 | 26.8%), Irish (681 | 16.0%), English (657 | 15.5%), Norwegian (348 | 8.2%), and Italian (318 | 7.5%), together accounting for 74.0% of all Helena Valley Northeast residents.
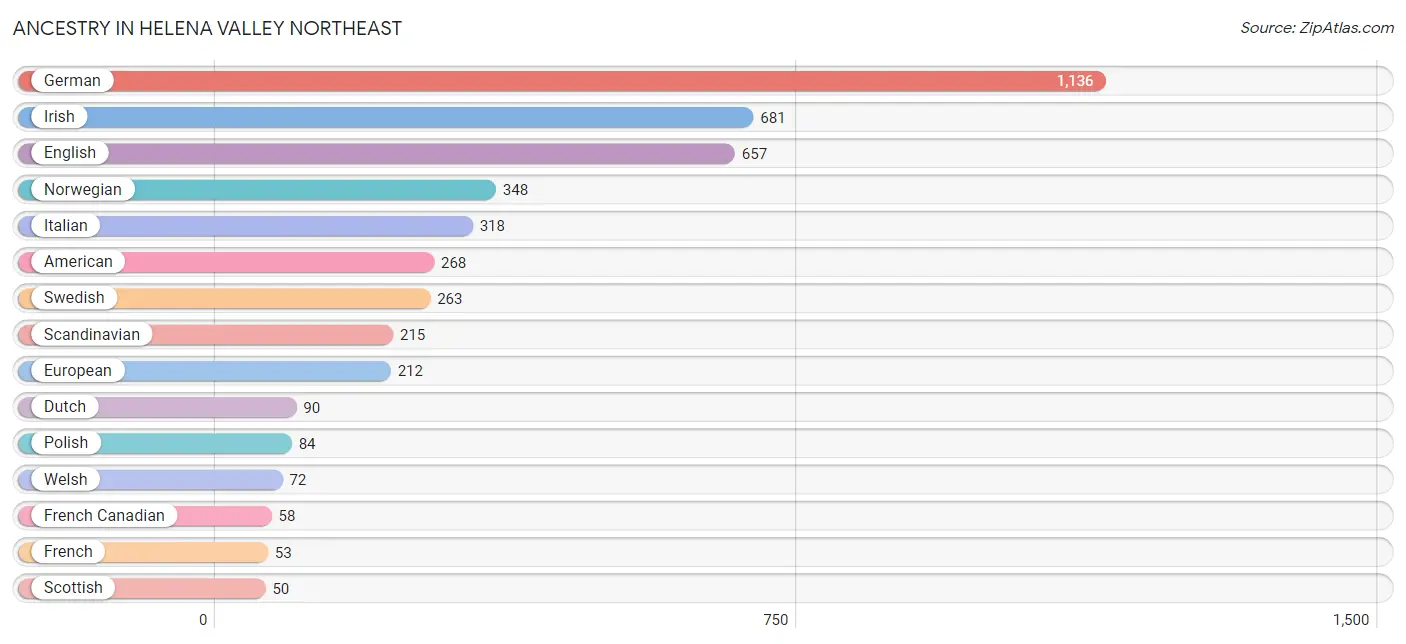
| Ancestry | # Population | % Population |
| American | 268 | 6.3% |
| Bhutanese | 16 | 0.4% |
| British | 15 | 0.4% |
| Canadian | 18 | 0.4% |
| Czech | 6 | 0.1% |
| Danish | 15 | 0.4% |
| Dutch | 90 | 2.1% |
| English | 657 | 15.5% |
| European | 212 | 5.0% |
| Filipino | 20 | 0.5% |
| French | 53 | 1.3% |
| French Canadian | 58 | 1.4% |
| German | 1,136 | 26.8% |
| Hungarian | 14 | 0.3% |
| Irish | 681 | 16.0% |
| Italian | 318 | 7.5% |
| Korean | 18 | 0.4% |
| Mexican | 39 | 0.9% |
| Norwegian | 348 | 8.2% |
| Polish | 84 | 2.0% |
| Portuguese | 7 | 0.2% |
| Romanian | 20 | 0.5% |
| Scandinavian | 215 | 5.1% |
| Scotch-Irish | 7 | 0.2% |
| Scottish | 50 | 1.2% |
| Shoshone | 24 | 0.6% |
| Swedish | 263 | 6.2% |
| Thai | 34 | 0.8% |
| Welsh | 72 | 1.7% |
| Yugoslavian | 7 | 0.2% | View All 30 Rows |
Immigrants in Helena Valley Northeast
The most numerous immigrant groups reported in Helena Valley Northeast came from Asia (52 | 1.2%), Philippines (42 | 1.0%), South Eastern Asia (42 | 1.0%), Europe (29 | 0.7%), and Eastern Europe (20 | 0.5%), together accounting for 4.4% of all Helena Valley Northeast residents.
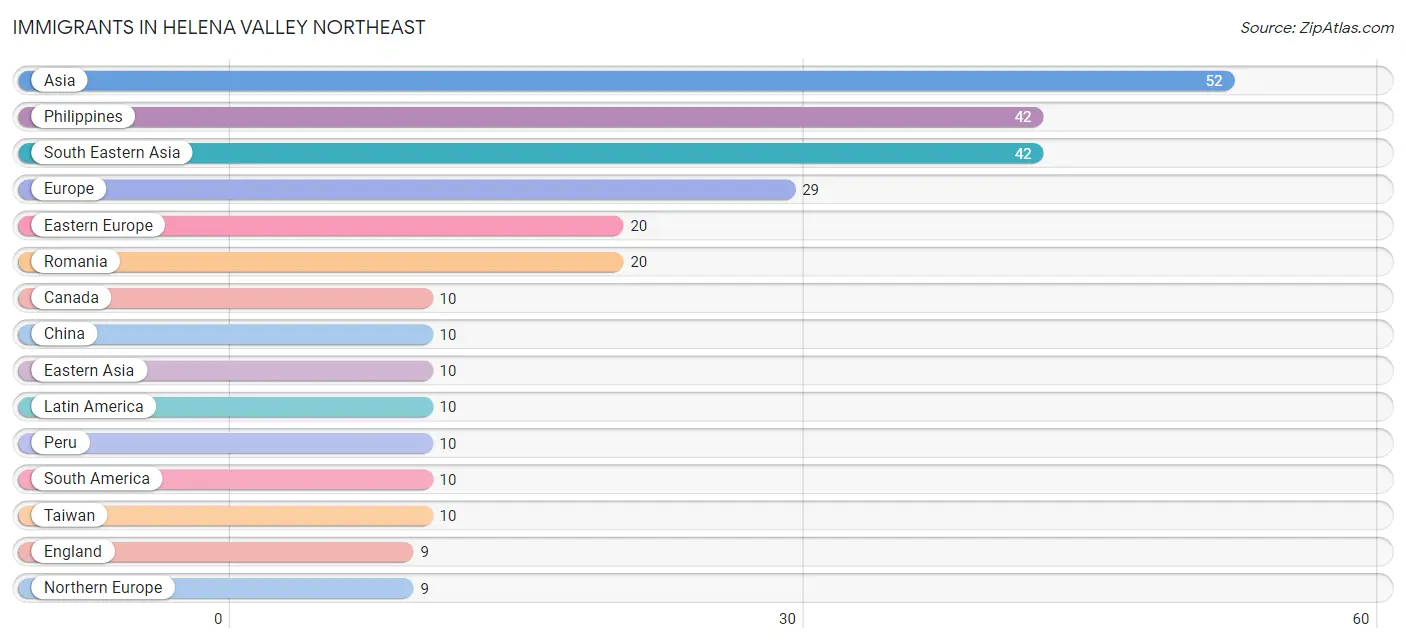
| Immigration Origin | # Population | % Population |
| Asia | 52 | 1.2% |
| Canada | 10 | 0.2% |
| China | 10 | 0.2% |
| Eastern Asia | 10 | 0.2% |
| Eastern Europe | 20 | 0.5% |
| England | 9 | 0.2% |
| Europe | 29 | 0.7% |
| Latin America | 10 | 0.2% |
| Northern Europe | 9 | 0.2% |
| Peru | 10 | 0.2% |
| Philippines | 42 | 1.0% |
| Romania | 20 | 0.5% |
| South America | 10 | 0.2% |
| South Eastern Asia | 42 | 1.0% |
| Taiwan | 10 | 0.2% | View All 15 Rows |
Sex and Age in Helena Valley Northeast
Sex and Age in Helena Valley Northeast
The most populous age groups in Helena Valley Northeast are 50 to 54 Years (225 | 10.2%) for men and 45 to 49 Years (247 | 12.2%) for women.
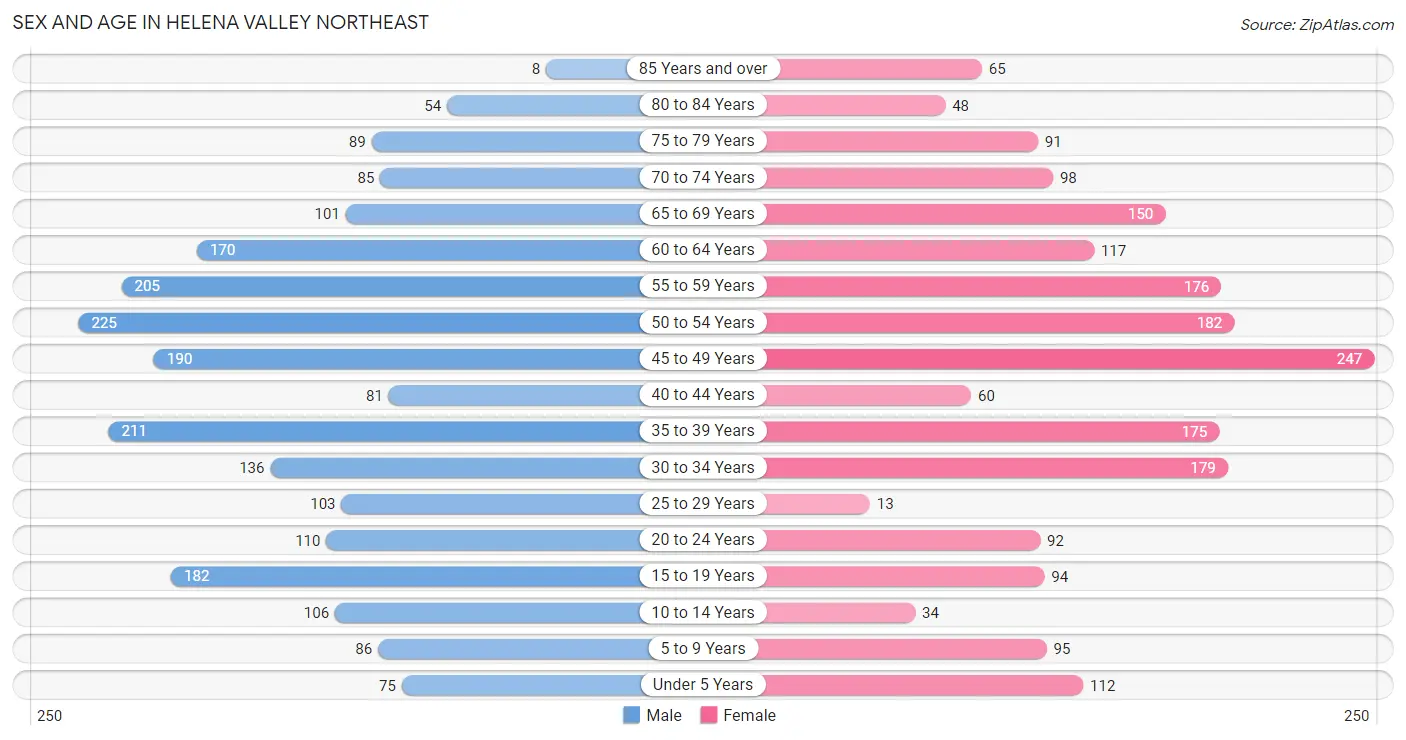
| Age Bracket | Male | Female |
| Under 5 Years | 75 (3.4%) | 112 (5.5%) |
| 5 to 9 Years | 86 (3.9%) | 95 (4.7%) |
| 10 to 14 Years | 106 (4.8%) | 34 (1.7%) |
| 15 to 19 Years | 182 (8.2%) | 94 (4.6%) |
| 20 to 24 Years | 110 (5.0%) | 92 (4.5%) |
| 25 to 29 Years | 103 (4.6%) | 13 (0.6%) |
| 30 to 34 Years | 136 (6.1%) | 179 (8.8%) |
| 35 to 39 Years | 211 (9.5%) | 175 (8.6%) |
| 40 to 44 Years | 81 (3.6%) | 60 (3.0%) |
| 45 to 49 Years | 190 (8.6%) | 247 (12.2%) |
| 50 to 54 Years | 225 (10.2%) | 182 (9.0%) |
| 55 to 59 Years | 205 (9.2%) | 176 (8.7%) |
| 60 to 64 Years | 170 (7.7%) | 117 (5.8%) |
| 65 to 69 Years | 101 (4.6%) | 150 (7.4%) |
| 70 to 74 Years | 85 (3.8%) | 98 (4.8%) |
| 75 to 79 Years | 89 (4.0%) | 91 (4.5%) |
| 80 to 84 Years | 54 (2.4%) | 48 (2.4%) |
| 85 Years and over | 8 (0.4%) | 65 (3.2%) |
| Total | 2,217 (100.0%) | 2,028 (100.0%) |
Families and Households in Helena Valley Northeast
Median Family Size in Helena Valley Northeast
The median family size in Helena Valley Northeast is 2.81 persons per family, with married-couple families (1,111 | 91.7%) accounting for the largest median family size of 2.85 persons per family. On the other hand, single male/father families (49 | 4.0%) represent the smallest median family size with 2.04 persons per family.
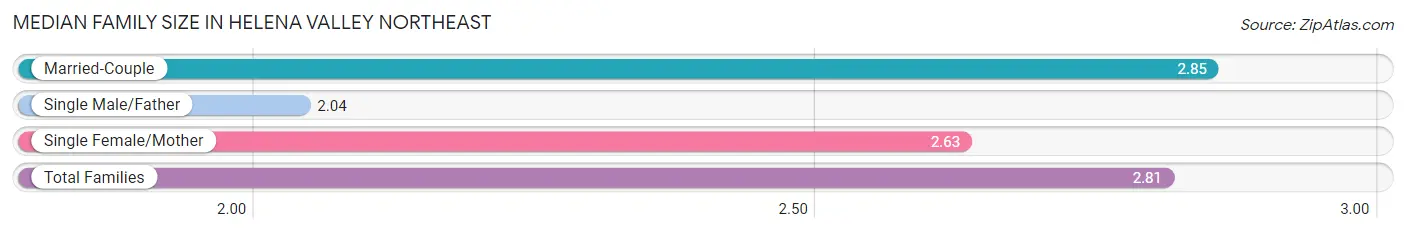
| Family Type | # Families | Family Size |
| Married-Couple | 1,111 (91.7%) | 2.85 |
| Single Male/Father | 49 (4.0%) | 2.04 |
| Single Female/Mother | 52 (4.3%) | 2.63 |
| Total Families | 1,212 (100.0%) | 2.81 |
Median Household Size in Helena Valley Northeast
The median household size in Helena Valley Northeast is 2.77 persons per household, with married-couple households (1,111 | 72.7%) accounting for the largest median household size of 2.92 persons per household. single male/father households (49 | 3.2%) represent the smallest median household size with 2.04 persons per household.
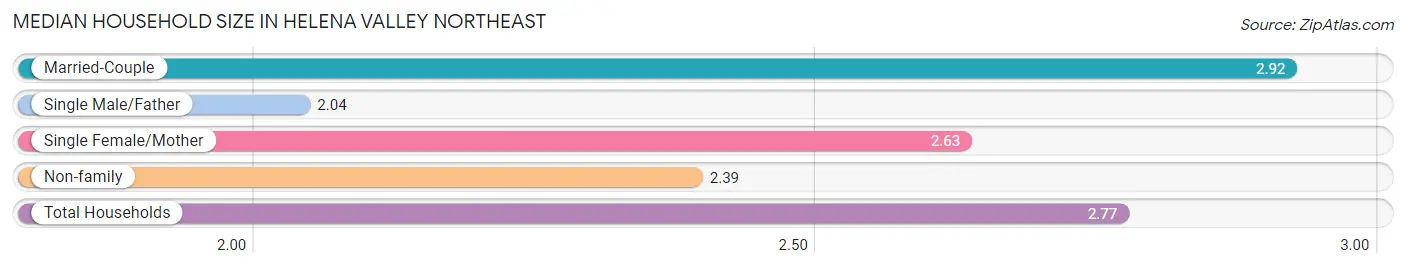
| Household Type | # Households | Household Size |
| Married-Couple | 1,111 (72.7%) | 2.92 |
| Single Male/Father | 49 (3.2%) | 2.04 |
| Single Female/Mother | 52 (3.4%) | 2.63 |
| Non-family | 316 (20.7%) | 2.39 |
| Total Households | 1,528 (100.0%) | 2.77 |
Household Size by Marriage Status in Helena Valley Northeast
Out of a total of 1,528 households in Helena Valley Northeast, 1,212 (79.3%) are family households, while 316 (20.7%) are nonfamily households. The most numerous type of family households are 2-person households, comprising 616, and the most common type of nonfamily households are 2-person households, comprising 214.
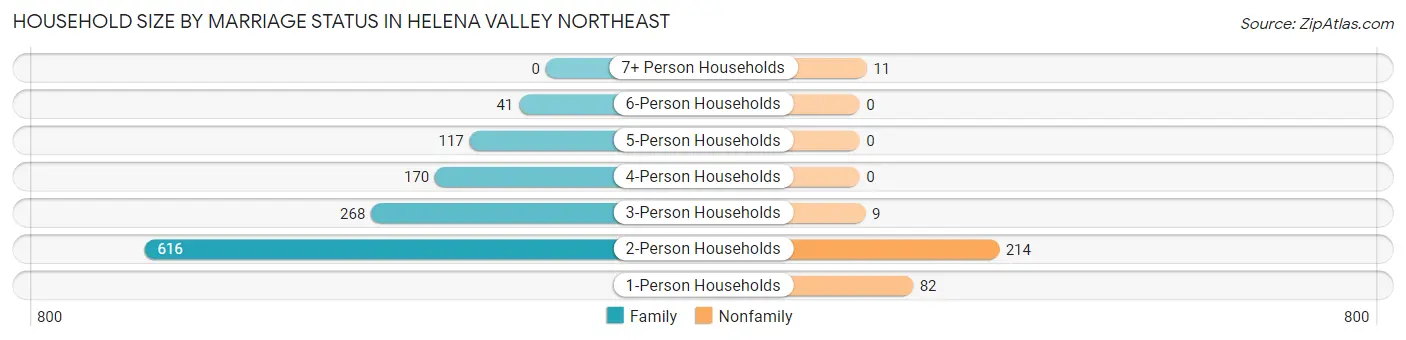
| Household Size | Family Households | Nonfamily Households |
| 1-Person Households | - | 82 (5.4%) |
| 2-Person Households | 616 (40.3%) | 214 (14.0%) |
| 3-Person Households | 268 (17.5%) | 9 (0.6%) |
| 4-Person Households | 170 (11.1%) | 0 (0.0%) |
| 5-Person Households | 117 (7.7%) | 0 (0.0%) |
| 6-Person Households | 41 (2.7%) | 0 (0.0%) |
| 7+ Person Households | 0 (0.0%) | 11 (0.7%) |
| Total | 1,212 (79.3%) | 316 (20.7%) |
Female Fertility in Helena Valley Northeast
Fertility by Age in Helena Valley Northeast
Average fertility rate in Helena Valley Northeast is 54.0 births per 1,000 women. Women in the age bracket of 20 to 34 years have the highest fertility rate with 134.0 births per 1,000 women. Women in the age bracket of 20 to 34 years acount for 80.8% of all women with births.
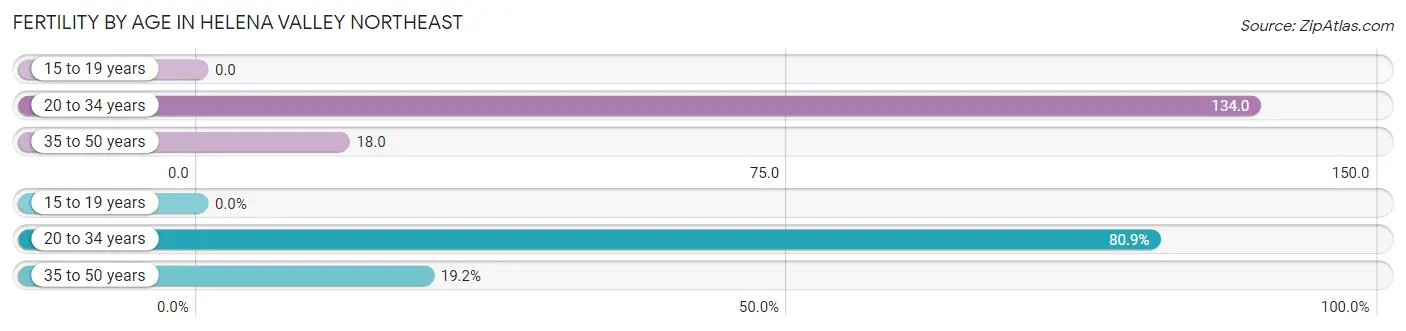
| Age Bracket | Women with Births | Births / 1,000 Women |
| 15 to 19 years | 0 (0.0%) | 0.0 |
| 20 to 34 years | 38 (80.8%) | 134.0 |
| 35 to 50 years | 9 (19.2%) | 18.0 |
| Total | 47 (100.0%) | 54.0 |
Fertility by Age by Marriage Status in Helena Valley Northeast
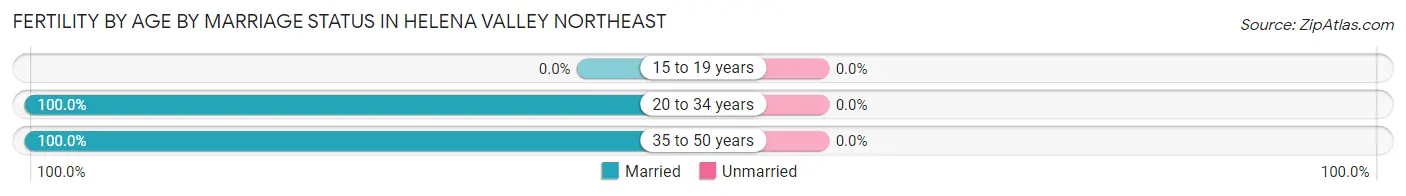
| Age Bracket | Married | Unmarried |
| 15 to 19 years | 0 (0.0%) | 0 (0.0%) |
| 20 to 34 years | 38 (100.0%) | 0 (0.0%) |
| 35 to 50 years | 9 (100.0%) | 0 (0.0%) |
| Total | 47 (100.0%) | 0 (0.0%) |
Fertility by Education in Helena Valley Northeast
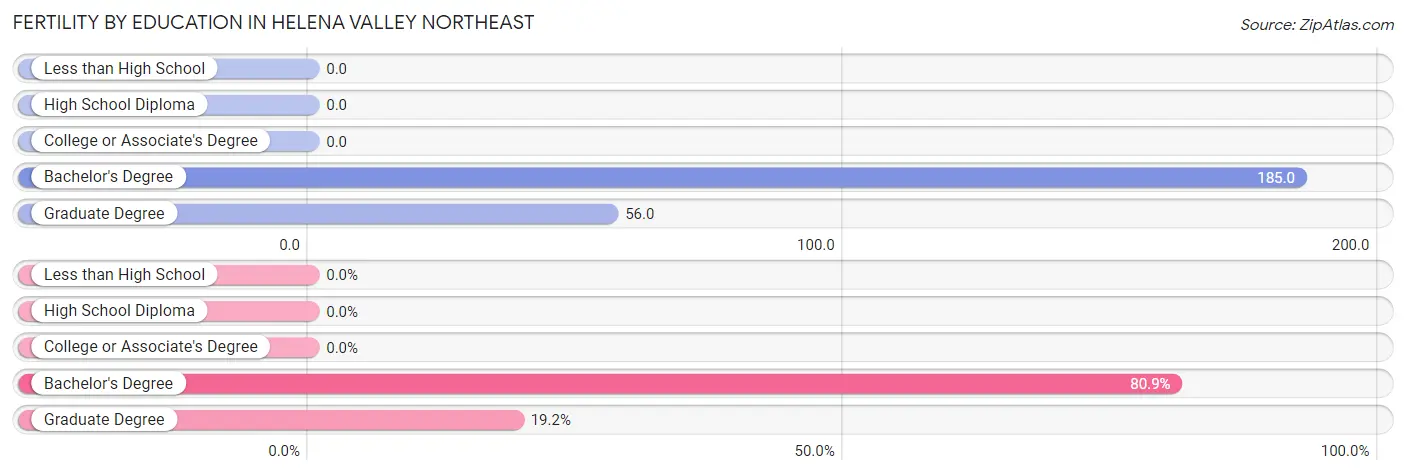
| Educational Attainment | Women with Births | Births / 1,000 Women |
| Less than High School | 0 (0.0%) | 0.0 |
| High School Diploma | 0 (0.0%) | 0.0 |
| College or Associate's Degree | 0 (0.0%) | 0.0 |
| Bachelor's Degree | 38 (80.8%) | 185.0 |
| Graduate Degree | 9 (19.2%) | 56.0 |
| Total | 47 (100.0%) | 54.0 |
Fertility by Education by Marriage Status in Helena Valley Northeast
| Educational Attainment | Married | Unmarried |
| Less than High School | 0 (0.0%) | 0 (0.0%) |
| High School Diploma | 0 (0.0%) | 0 (0.0%) |
| College or Associate's Degree | 0 (0.0%) | 0 (0.0%) |
| Bachelor's Degree | 38 (100.0%) | 0 (0.0%) |
| Graduate Degree | 9 (100.0%) | 0 (0.0%) |
| Total | 47 (100.0%) | 0 (0.0%) |
Employment Characteristics in Helena Valley Northeast
Employment by Class of Employer in Helena Valley Northeast
Among the 2,402 employed individuals in Helena Valley Northeast, private company employees (934 | 38.9%), state government employees (394 | 16.4%), and not-for-profit organizations (384 | 16.0%) make up the most common classes of employment.
| Employer Class | # Employees | % Employees |
| Private Company Employees | 934 | 38.9% |
| Self-Employed (Incorporated) | 164 | 6.8% |
| Self-Employed (Not Incorporated) | 146 | 6.1% |
| Not-for-profit Organizations | 384 | 16.0% |
| Local Government Employees | 183 | 7.6% |
| State Government Employees | 394 | 16.4% |
| Federal Government Employees | 141 | 5.9% |
| Unpaid Family Workers | 56 | 2.3% |
| Total | 2,402 | 100.0% |
Employment Status by Age in Helena Valley Northeast
According to the labor force statistics for Helena Valley Northeast, out of the total population over 16 years of age (3,692), 67.2% or 2,481 individuals are in the labor force, with 1.5% or 37 of them unemployed. The age group with the highest labor force participation rate is 25 to 29 years, with 100.0% or 116 individuals in the labor force. Within the labor force, the 65 to 74 years age range has the highest percentage of unemployed individuals, with 20.5% or 18 of them being unemployed.
| Age Bracket | In Labor Force | Unemployed |
| 16 to 19 Years | 59 (25.5%) | 0 (0.0%) |
| 20 to 24 Years | 114 (56.4%) | 12 (10.5%) |
| 25 to 29 Years | 116 (100.0%) | 0 (0.0%) |
| 30 to 34 Years | 315 (100.0%) | 0 (0.0%) |
| 35 to 44 Years | 487 (92.4%) | 0 (0.0%) |
| 45 to 54 Years | 788 (93.4%) | 7 (0.9%) |
| 55 to 59 Years | 336 (88.2%) | 0 (0.0%) |
| 60 to 64 Years | 132 (46.0%) | 0 (0.0%) |
| 65 to 74 Years | 88 (20.3%) | 18 (20.5%) |
| 75 Years and over | 47 (13.2%) | 0 (0.0%) |
| Total | 2,481 (67.2%) | 37 (1.5%) |
Employment Status by Educational Attainment in Helena Valley Northeast
According to labor force statistics for Helena Valley Northeast, 88.0% of individuals (2,174) out of the total population between 25 and 64 years of age (2,470) are in the labor force, with 0.3% or 7 of them being unemployed. The group with the highest labor force participation rate are those with the educational attainment of high school diploma, with 91.0% or 563 individuals in the labor force. Within the labor force, individuals with bachelor's degree or higher education have the highest percentage of unemployment, with 0.7% or 7 of them being unemployed.
| Educational Attainment | In Labor Force | Unemployed |
| Less than High School | 46 (59.7%) | 0 (0.0%) |
| High School Diploma | 563 (91.0%) | 0 (0.0%) |
| College / Associate Degree | 513 (86.9%) | 0 (0.0%) |
| Bachelor's Degree or higher | 1,053 (88.9%) | 8 (0.7%) |
| Total | 2,174 (88.0%) | 7 (0.3%) |
Employment Occupations by Sex in Helena Valley Northeast
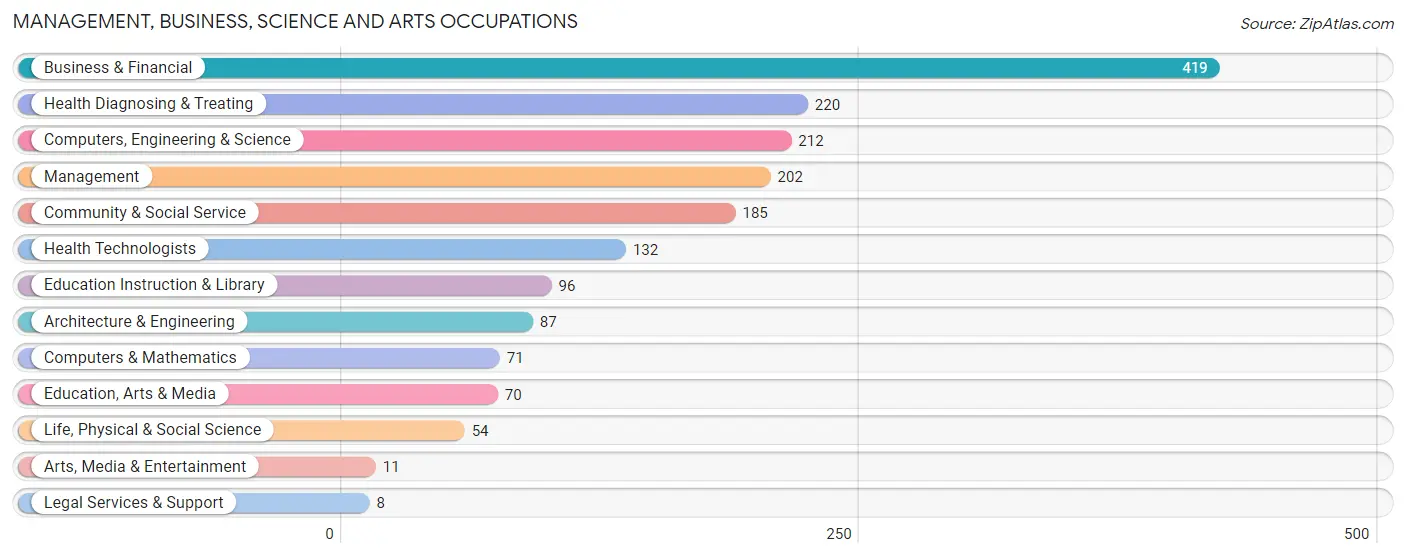
Management, Business, Science and Arts Occupations
The most common Management, Business, Science and Arts occupations in Helena Valley Northeast are Business & Financial (419 | 17.1%), Health Diagnosing & Treating (220 | 9.0%), Computers, Engineering & Science (212 | 8.7%), Management (202 | 8.3%), and Community & Social Service (185 | 7.6%).
Management, Business, Science and Arts Occupations by Sex
Within the Management, Business, Science and Arts occupations in Helena Valley Northeast, the most male-oriented occupations are Architecture & Engineering (100.0%), Computers & Mathematics (76.1%), and Education, Arts & Media (75.7%), while the most female-oriented occupations are Legal Services & Support (100.0%), Arts, Media & Entertainment (100.0%), and Health Technologists (100.0%).
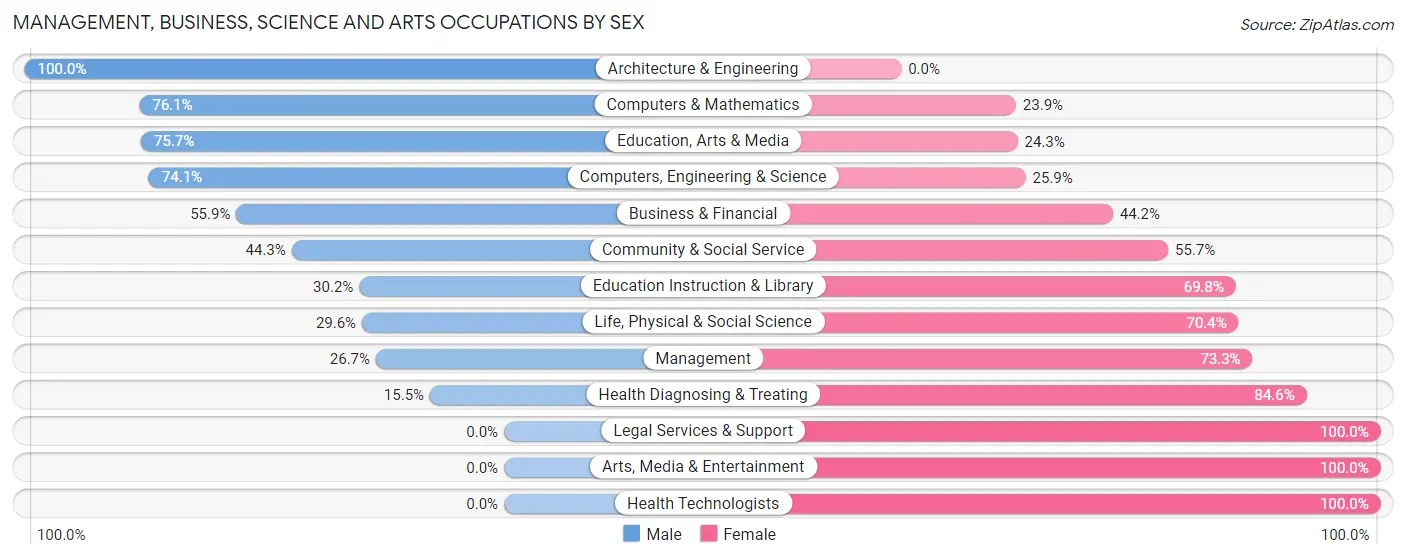
| Occupation | Male | Female |
| Management | 54 (26.7%) | 148 (73.3%) |
| Business & Financial | 234 (55.8%) | 185 (44.2%) |
| Computers, Engineering & Science | 157 (74.1%) | 55 (25.9%) |
| Computers & Mathematics | 54 (76.1%) | 17 (23.9%) |
| Architecture & Engineering | 87 (100.0%) | 0 (0.0%) |
| Life, Physical & Social Science | 16 (29.6%) | 38 (70.4%) |
| Community & Social Service | 82 (44.3%) | 103 (55.7%) |
| Education, Arts & Media | 53 (75.7%) | 17 (24.3%) |
| Legal Services & Support | 0 (0.0%) | 8 (100.0%) |
| Education Instruction & Library | 29 (30.2%) | 67 (69.8%) |
| Arts, Media & Entertainment | 0 (0.0%) | 11 (100.0%) |
| Health Diagnosing & Treating | 34 (15.4%) | 186 (84.6%) |
| Health Technologists | 0 (0.0%) | 132 (100.0%) |
| Total (Category) | 561 (45.3%) | 677 (54.7%) |
| Total (Overall) | 1,335 (54.6%) | 1,110 (45.4%) |
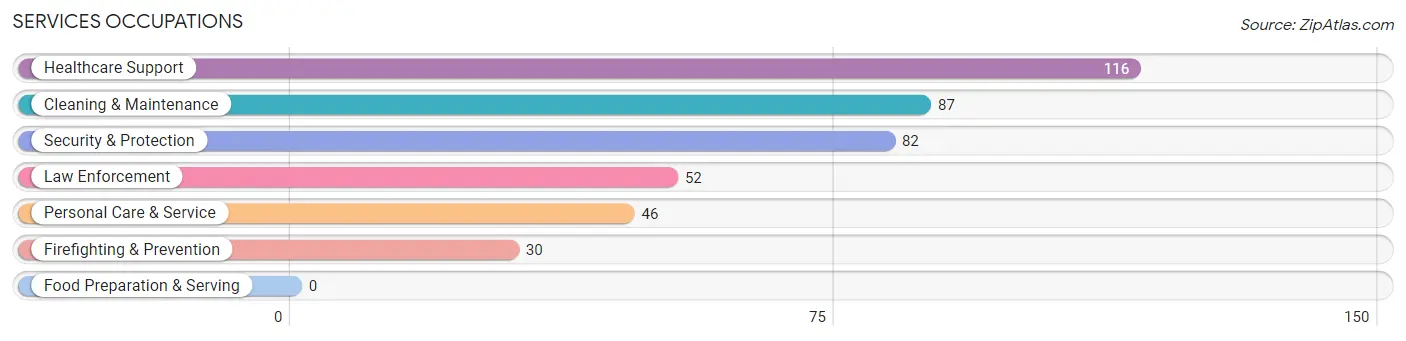
Services Occupations
The most common Services occupations in Helena Valley Northeast are Healthcare Support (116 | 4.7%), Cleaning & Maintenance (87 | 3.6%), Security & Protection (82 | 3.4%), Law Enforcement (52 | 2.1%), and Personal Care & Service (46 | 1.9%).
Services Occupations by Sex
Within the Services occupations in Helena Valley Northeast, the most male-oriented occupations are Security & Protection (100.0%), Firefighting & Prevention (100.0%), and Law Enforcement (100.0%), while the most female-oriented occupations are Healthcare Support (86.2%), Cleaning & Maintenance (56.3%), and Personal Care & Service (13.0%).
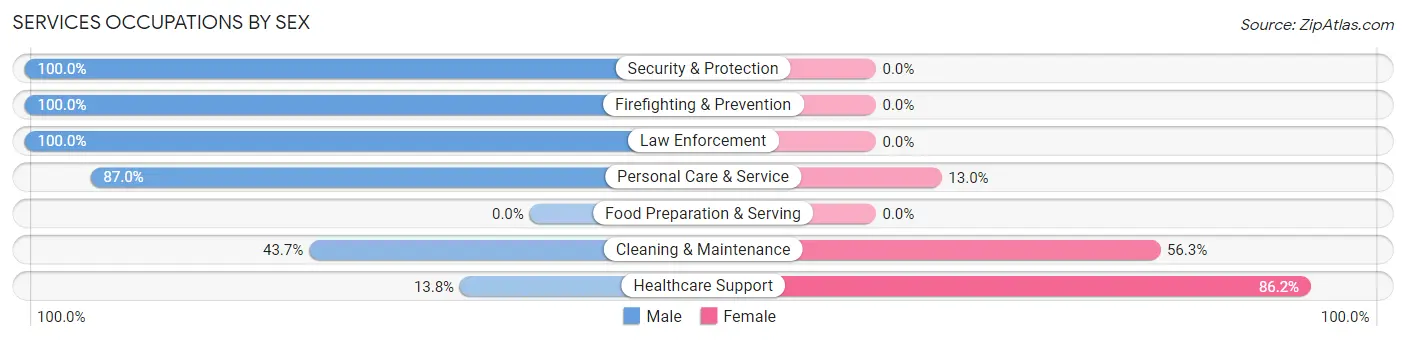
| Occupation | Male | Female |
| Healthcare Support | 16 (13.8%) | 100 (86.2%) |
| Security & Protection | 82 (100.0%) | 0 (0.0%) |
| Firefighting & Prevention | 30 (100.0%) | 0 (0.0%) |
| Law Enforcement | 52 (100.0%) | 0 (0.0%) |
| Food Preparation & Serving | 0 (0.0%) | 0 (0.0%) |
| Cleaning & Maintenance | 38 (43.7%) | 49 (56.3%) |
| Personal Care & Service | 40 (87.0%) | 6 (13.0%) |
| Total (Category) | 176 (53.2%) | 155 (46.8%) |
| Total (Overall) | 1,335 (54.6%) | 1,110 (45.4%) |
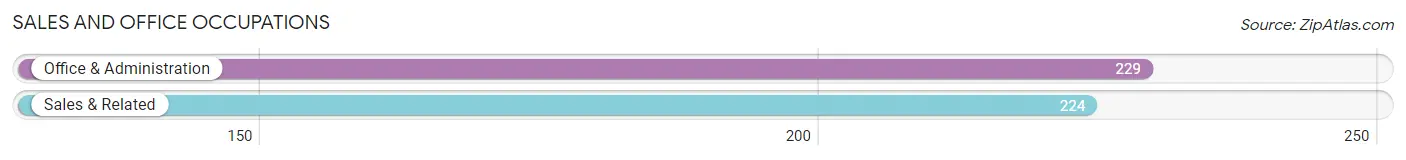
Sales and Office Occupations
The most common Sales and Office occupations in Helena Valley Northeast are Office & Administration (229 | 9.4%), and Sales & Related (224 | 9.2%).
Sales and Office Occupations by Sex
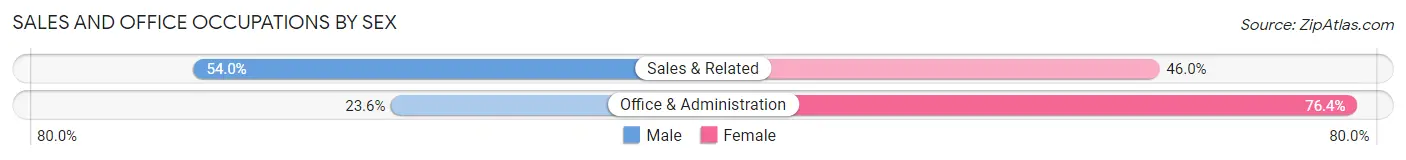
| Occupation | Male | Female |
| Sales & Related | 121 (54.0%) | 103 (46.0%) |
| Office & Administration | 54 (23.6%) | 175 (76.4%) |
| Total (Category) | 175 (38.6%) | 278 (61.4%) |
| Total (Overall) | 1,335 (54.6%) | 1,110 (45.4%) |
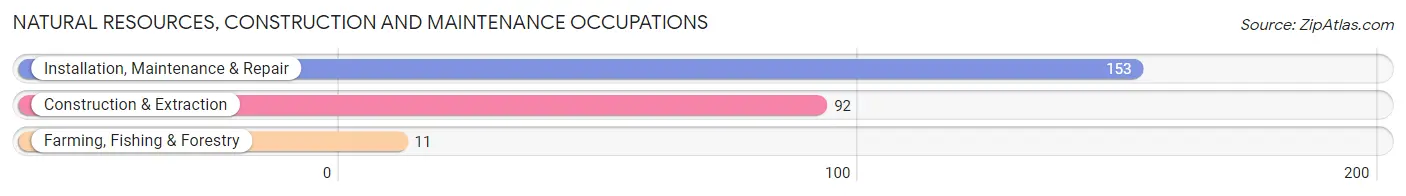
Natural Resources, Construction and Maintenance Occupations
The most common Natural Resources, Construction and Maintenance occupations in Helena Valley Northeast are Installation, Maintenance & Repair (153 | 6.3%), Construction & Extraction (92 | 3.8%), and Farming, Fishing & Forestry (11 | 0.4%).
Natural Resources, Construction and Maintenance Occupations by Sex
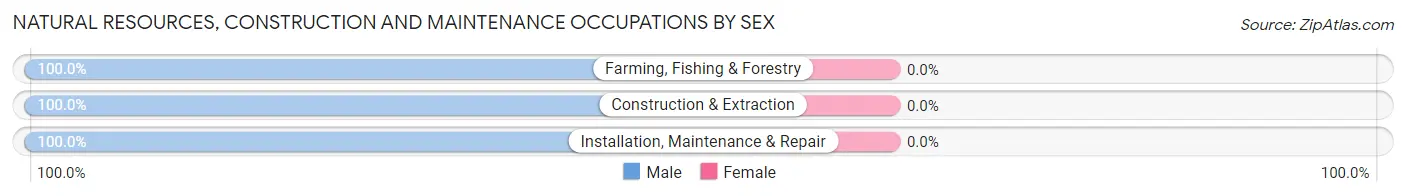
| Occupation | Male | Female |
| Farming, Fishing & Forestry | 11 (100.0%) | 0 (0.0%) |
| Construction & Extraction | 92 (100.0%) | 0 (0.0%) |
| Installation, Maintenance & Repair | 153 (100.0%) | 0 (0.0%) |
| Total (Category) | 256 (100.0%) | 0 (0.0%) |
| Total (Overall) | 1,335 (54.6%) | 1,110 (45.4%) |
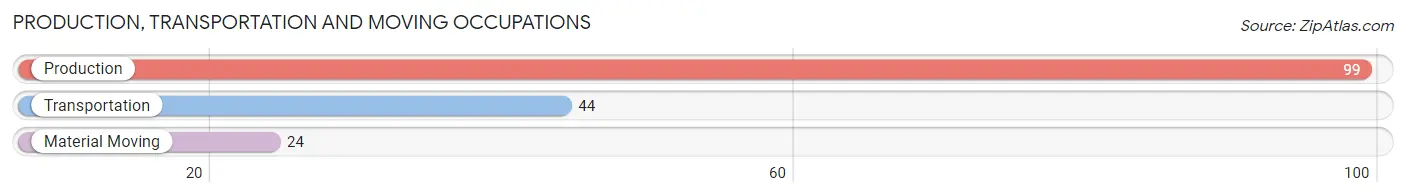
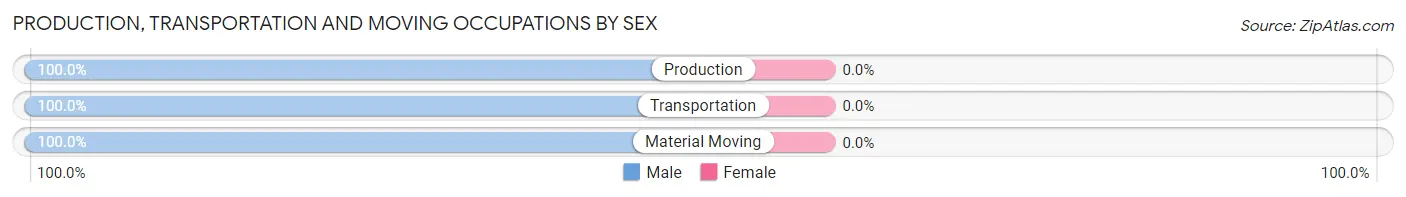
Production, Transportation and Moving Occupations
The most common Production, Transportation and Moving occupations in Helena Valley Northeast are Production (99 | 4.1%), Transportation (44 | 1.8%), and Material Moving (24 | 1.0%).
Production, Transportation and Moving Occupations by Sex
| Occupation | Male | Female |
| Production | 99 (100.0%) | 0 (0.0%) |
| Transportation | 44 (100.0%) | 0 (0.0%) |
| Material Moving | 24 (100.0%) | 0 (0.0%) |
| Total (Category) | 167 (100.0%) | 0 (0.0%) |
| Total (Overall) | 1,335 (54.6%) | 1,110 (45.4%) |
Employment Industries by Sex in Helena Valley Northeast
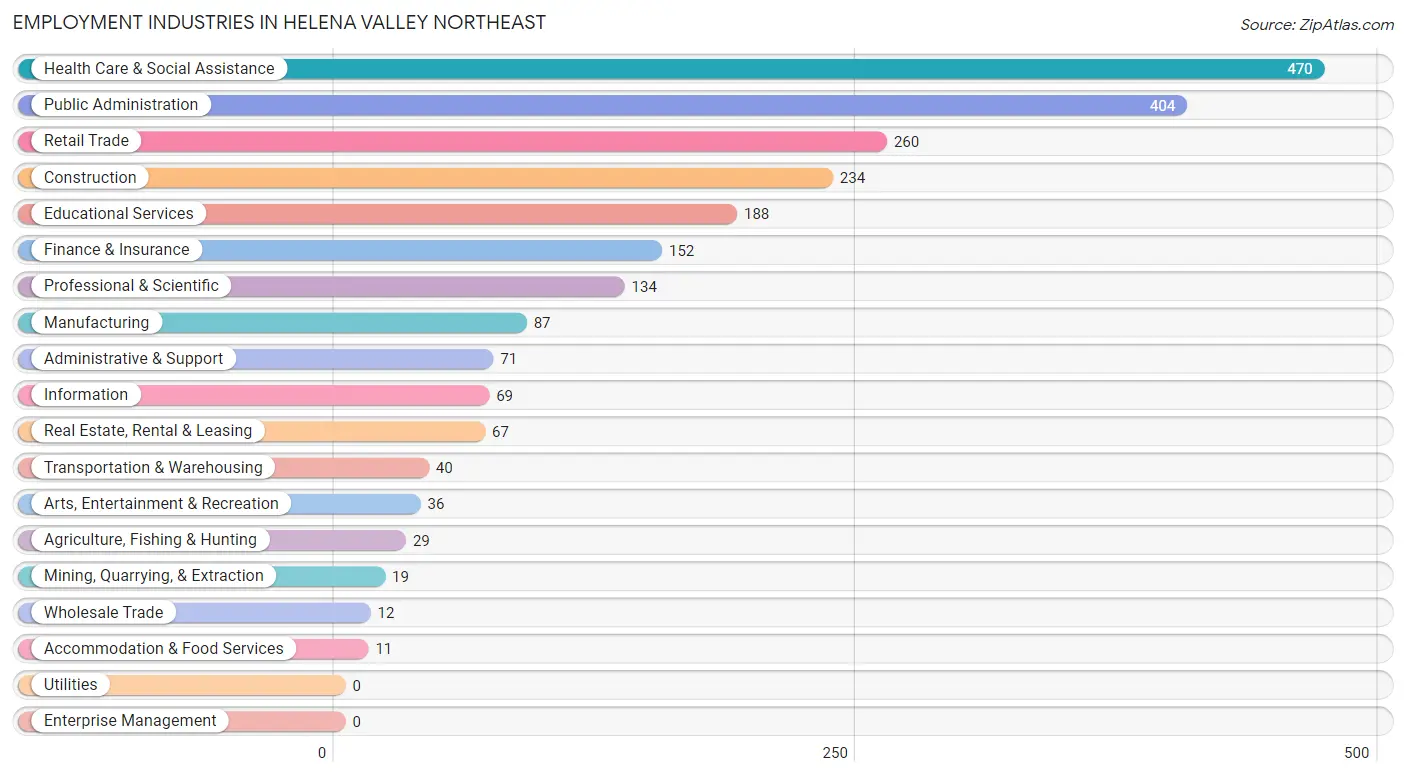
Employment Industries in Helena Valley Northeast
The major employment industries in Helena Valley Northeast include Health Care & Social Assistance (470 | 19.2%), Public Administration (404 | 16.5%), Retail Trade (260 | 10.6%), Construction (234 | 9.6%), and Educational Services (188 | 7.7%).
Employment Industries by Sex in Helena Valley Northeast
The Helena Valley Northeast industries that see more men than women are Agriculture, Fishing & Hunting (100.0%), Manufacturing (100.0%), and Wholesale Trade (100.0%), whereas the industries that tend to have a higher number of women are Health Care & Social Assistance (83.4%), Real Estate, Rental & Leasing (82.1%), and Educational Services (69.2%).
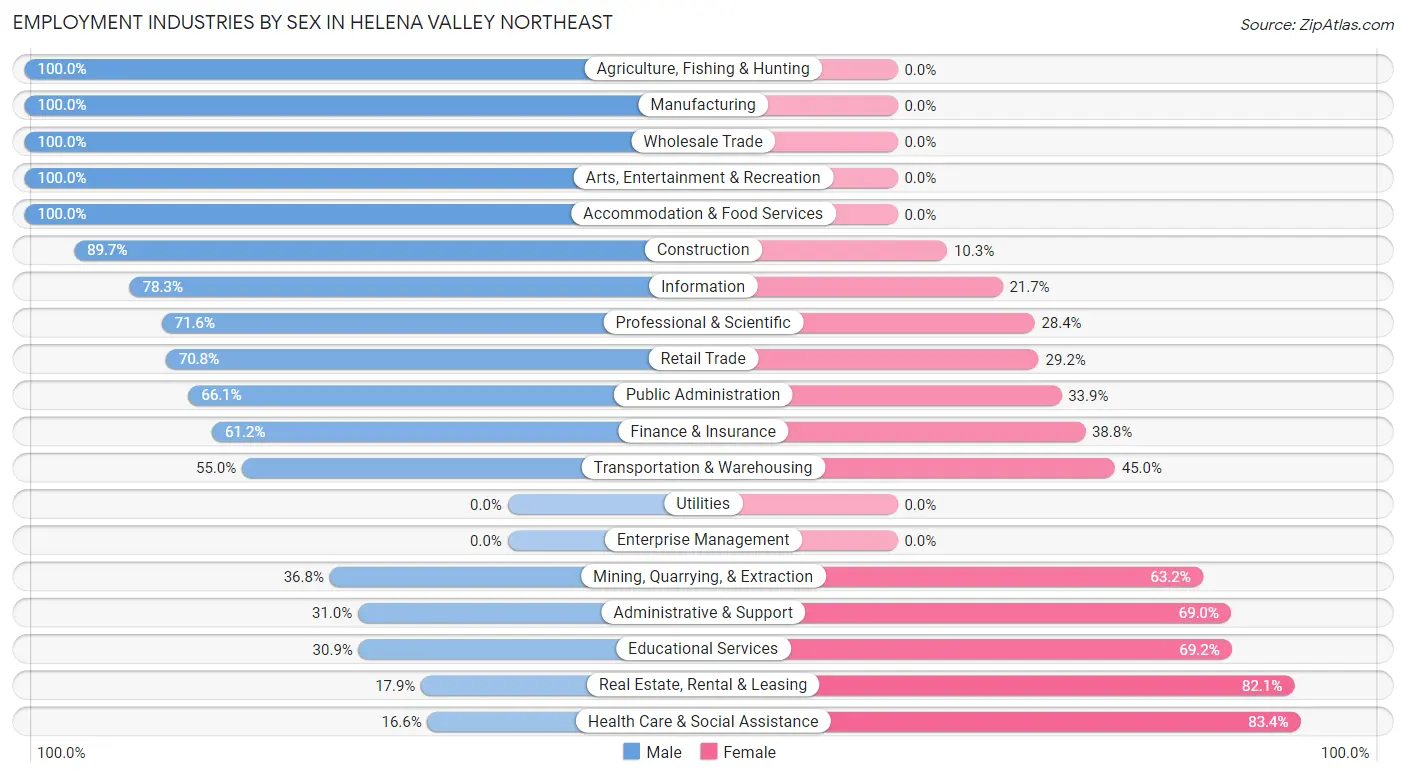
| Industry | Male | Female |
| Agriculture, Fishing & Hunting | 29 (100.0%) | 0 (0.0%) |
| Mining, Quarrying, & Extraction | 7 (36.8%) | 12 (63.2%) |
| Construction | 210 (89.7%) | 24 (10.3%) |
| Manufacturing | 87 (100.0%) | 0 (0.0%) |
| Wholesale Trade | 12 (100.0%) | 0 (0.0%) |
| Retail Trade | 184 (70.8%) | 76 (29.2%) |
| Transportation & Warehousing | 22 (55.0%) | 18 (45.0%) |
| Utilities | 0 (0.0%) | 0 (0.0%) |
| Information | 54 (78.3%) | 15 (21.7%) |
| Finance & Insurance | 93 (61.2%) | 59 (38.8%) |
| Real Estate, Rental & Leasing | 12 (17.9%) | 55 (82.1%) |
| Professional & Scientific | 96 (71.6%) | 38 (28.4%) |
| Enterprise Management | 0 (0.0%) | 0 (0.0%) |
| Administrative & Support | 22 (31.0%) | 49 (69.0%) |
| Educational Services | 58 (30.8%) | 130 (69.2%) |
| Health Care & Social Assistance | 78 (16.6%) | 392 (83.4%) |
| Arts, Entertainment & Recreation | 36 (100.0%) | 0 (0.0%) |
| Accommodation & Food Services | 11 (100.0%) | 0 (0.0%) |
| Public Administration | 267 (66.1%) | 137 (33.9%) |
| Total | 1,335 (54.6%) | 1,110 (45.4%) |
Education in Helena Valley Northeast
School Enrollment in Helena Valley Northeast
The most common levels of schooling among the 744 students in Helena Valley Northeast are high school (226 | 30.4%), college / undergraduate (197 | 26.5%), and middle school (112 | 15.0%).
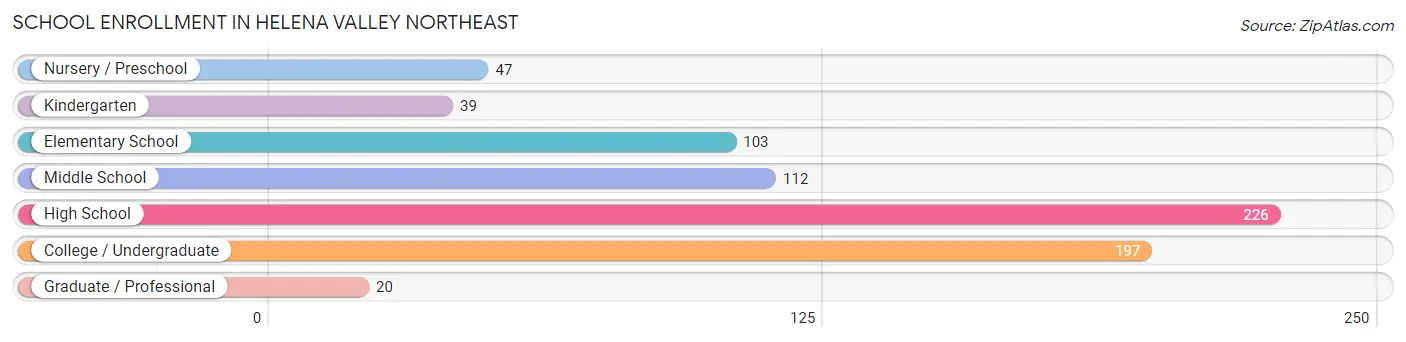
| School Level | # Students | % Students |
| Nursery / Preschool | 47 | 6.3% |
| Kindergarten | 39 | 5.2% |
| Elementary School | 103 | 13.8% |
| Middle School | 112 | 15.0% |
| High School | 226 | 30.4% |
| College / Undergraduate | 197 | 26.5% |
| Graduate / Professional | 20 | 2.7% |
| Total | 744 | 100.0% |
School Enrollment by Age by Funding Source in Helena Valley Northeast
Out of a total of 744 students who are enrolled in schools in Helena Valley Northeast, 113 (15.2%) attend a private institution, while the remaining 631 (84.8%) are enrolled in public schools. The age group of 3 to 4 year olds has the highest likelihood of being enrolled in private schools, with 8 (100.0% in the age bracket) enrolled. Conversely, the age group of 10 to 14 year olds has the lowest likelihood of being enrolled in a private school, with 140 (100.0% in the age bracket) attending a public institution.
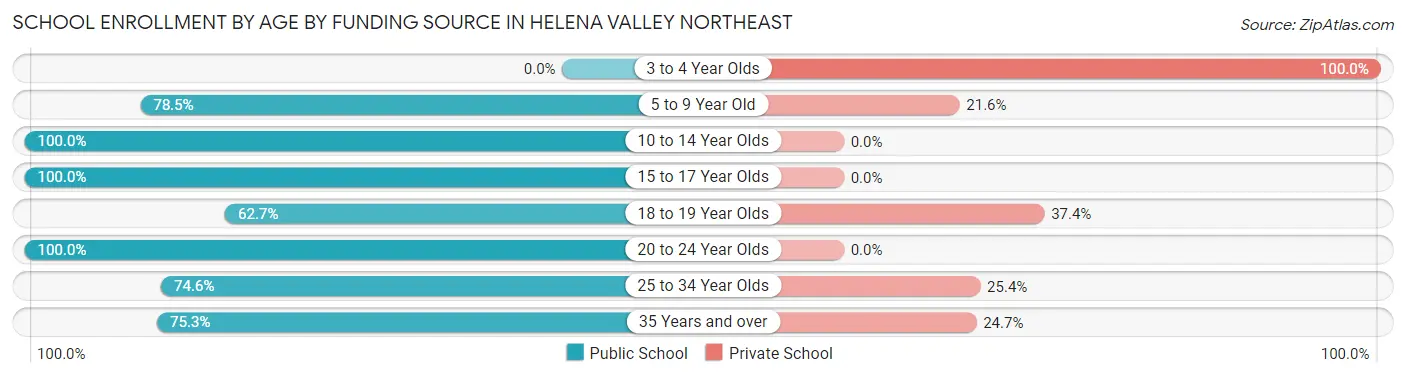
| Age Bracket | Public School | Private School |
| 3 to 4 Year Olds | 0 (0.0%) | 8 (100.0%) |
| 5 to 9 Year Old | 142 (78.4%) | 39 (21.5%) |
| 10 to 14 Year Olds | 140 (100.0%) | 0 (0.0%) |
| 15 to 17 Year Olds | 172 (100.0%) | 0 (0.0%) |
| 18 to 19 Year Olds | 52 (62.6%) | 31 (37.3%) |
| 20 to 24 Year Olds | 20 (100.0%) | 0 (0.0%) |
| 25 to 34 Year Olds | 44 (74.6%) | 15 (25.4%) |
| 35 Years and over | 61 (75.3%) | 20 (24.7%) |
| Total | 631 (84.8%) | 113 (15.2%) |
Educational Attainment by Field of Study in Helena Valley Northeast
Business (412 | 28.0%), arts & humanities (177 | 12.0%), science & technology (169 | 11.5%), education (152 | 10.3%), and engineering (117 | 8.0%) are the most common fields of study among 1,470 individuals in Helena Valley Northeast who have obtained a bachelor's degree or higher.
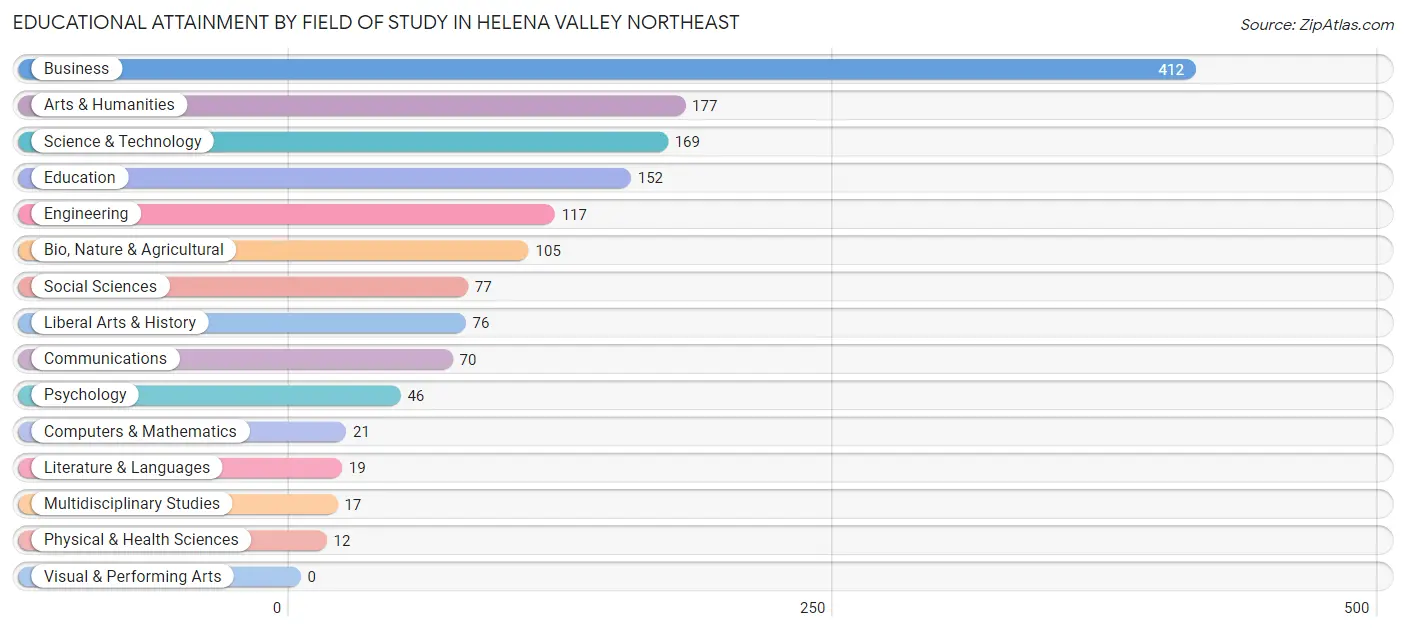
| Field of Study | # Graduates | % Graduates |
| Computers & Mathematics | 21 | 1.4% |
| Bio, Nature & Agricultural | 105 | 7.1% |
| Physical & Health Sciences | 12 | 0.8% |
| Psychology | 46 | 3.1% |
| Social Sciences | 77 | 5.2% |
| Engineering | 117 | 8.0% |
| Multidisciplinary Studies | 17 | 1.2% |
| Science & Technology | 169 | 11.5% |
| Business | 412 | 28.0% |
| Education | 152 | 10.3% |
| Literature & Languages | 19 | 1.3% |
| Liberal Arts & History | 76 | 5.2% |
| Visual & Performing Arts | 0 | 0.0% |
| Communications | 70 | 4.8% |
| Arts & Humanities | 177 | 12.0% |
| Total | 1,470 | 100.0% |
Transportation & Commute in Helena Valley Northeast
Vehicle Availability by Sex in Helena Valley Northeast
The most prevalent vehicle ownership categories in Helena Valley Northeast are males with 2 vehicles (515, accounting for 39.7%) and females with 2 vehicles (385, making up 46.9%).
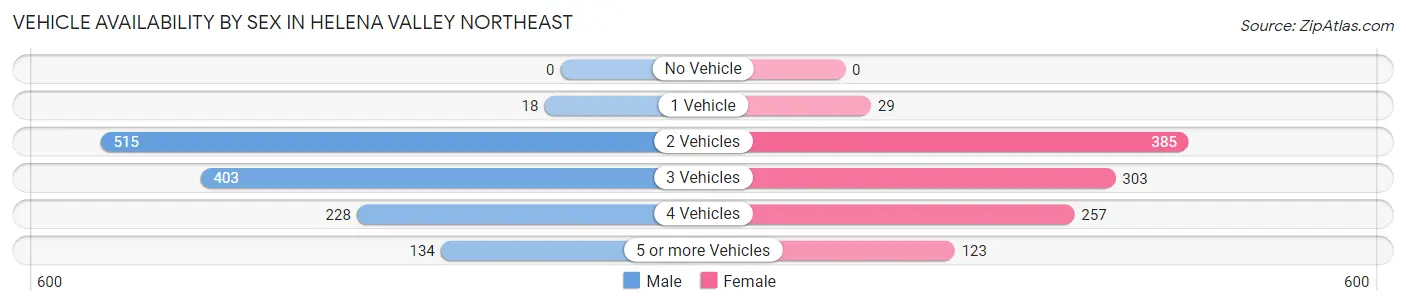
| Vehicles Available | Male | Female |
| No Vehicle | 0 (0.0%) | 0 (0.0%) |
| 1 Vehicle | 18 (1.4%) | 29 (2.6%) |
| 2 Vehicles | 515 (39.7%) | 385 (35.1%) |
| 3 Vehicles | 403 (31.0%) | 303 (27.6%) |
| 4 Vehicles | 228 (17.6%) | 257 (23.4%) |
| 5 or more Vehicles | 134 (10.3%) | 123 (11.2%) |
| Total | 1,298 (100.0%) | 1,097 (100.0%) |
Commute Time in Helena Valley Northeast
The most frequently occuring commute durations in Helena Valley Northeast are 20 to 24 minutes (541 commuters, 26.0%), 15 to 19 minutes (490 commuters, 23.5%), and 30 to 34 minutes (311 commuters, 14.9%).
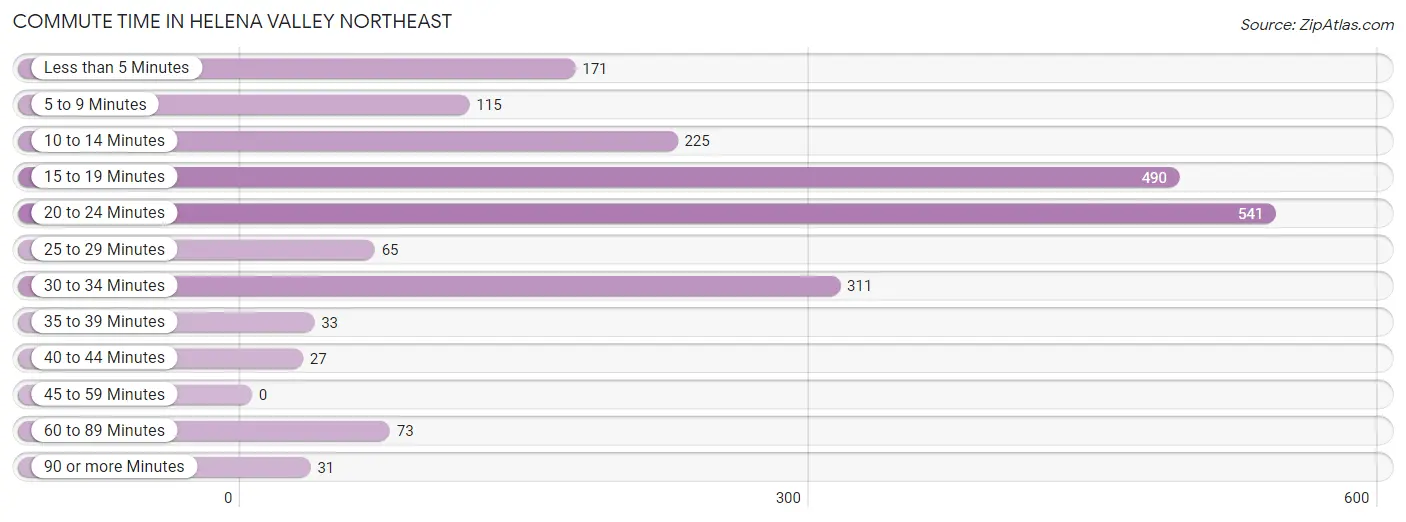
| Commute Time | # Commuters | % Commuters |
| Less than 5 Minutes | 171 | 8.2% |
| 5 to 9 Minutes | 115 | 5.5% |
| 10 to 14 Minutes | 225 | 10.8% |
| 15 to 19 Minutes | 490 | 23.5% |
| 20 to 24 Minutes | 541 | 26.0% |
| 25 to 29 Minutes | 65 | 3.1% |
| 30 to 34 Minutes | 311 | 14.9% |
| 35 to 39 Minutes | 33 | 1.6% |
| 40 to 44 Minutes | 27 | 1.3% |
| 45 to 59 Minutes | 0 | 0.0% |
| 60 to 89 Minutes | 73 | 3.5% |
| 90 or more Minutes | 31 | 1.5% |
Commute Time by Sex in Helena Valley Northeast
The most common commute times in Helena Valley Northeast are 20 to 24 minutes (325 commuters, 29.9%) for males and 20 to 24 minutes (216 commuters, 21.7%) for females.
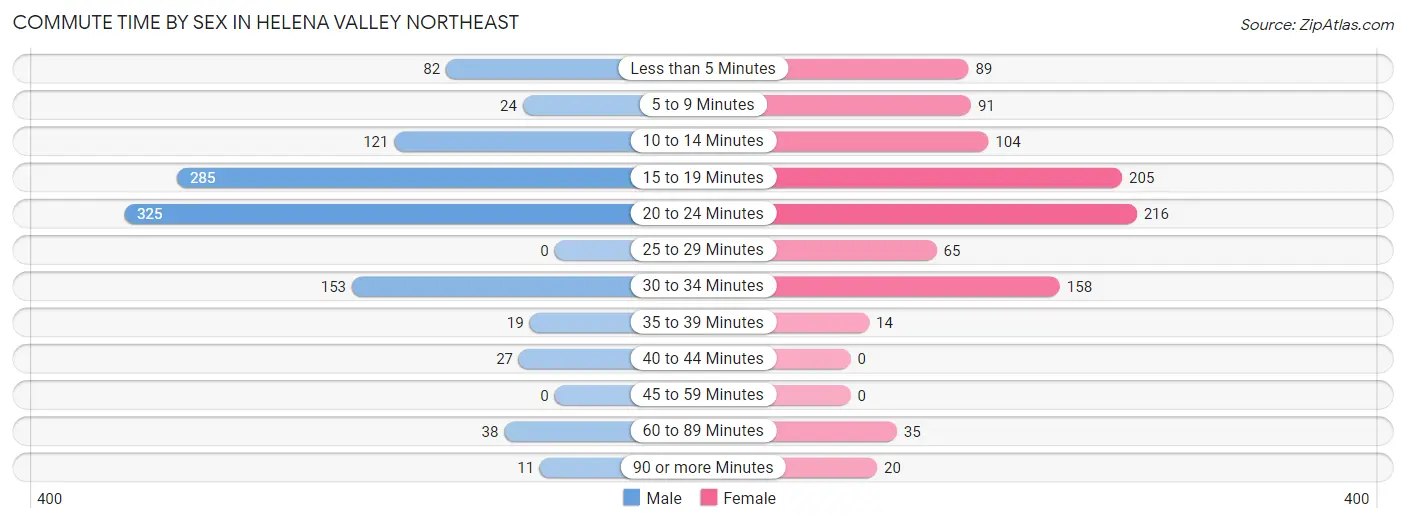
| Commute Time | Male | Female |
| Less than 5 Minutes | 82 (7.6%) | 89 (8.9%) |
| 5 to 9 Minutes | 24 (2.2%) | 91 (9.1%) |
| 10 to 14 Minutes | 121 (11.2%) | 104 (10.4%) |
| 15 to 19 Minutes | 285 (26.3%) | 205 (20.6%) |
| 20 to 24 Minutes | 325 (29.9%) | 216 (21.7%) |
| 25 to 29 Minutes | 0 (0.0%) | 65 (6.5%) |
| 30 to 34 Minutes | 153 (14.1%) | 158 (15.9%) |
| 35 to 39 Minutes | 19 (1.8%) | 14 (1.4%) |
| 40 to 44 Minutes | 27 (2.5%) | 0 (0.0%) |
| 45 to 59 Minutes | 0 (0.0%) | 0 (0.0%) |
| 60 to 89 Minutes | 38 (3.5%) | 35 (3.5%) |
| 90 or more Minutes | 11 (1.0%) | 20 (2.0%) |
Time of Departure to Work by Sex in Helena Valley Northeast
The most frequent times of departure to work in Helena Valley Northeast are 7:00 AM to 7:29 AM (251, 23.1%) for males and 7:30 AM to 7:59 AM (346, 34.7%) for females.
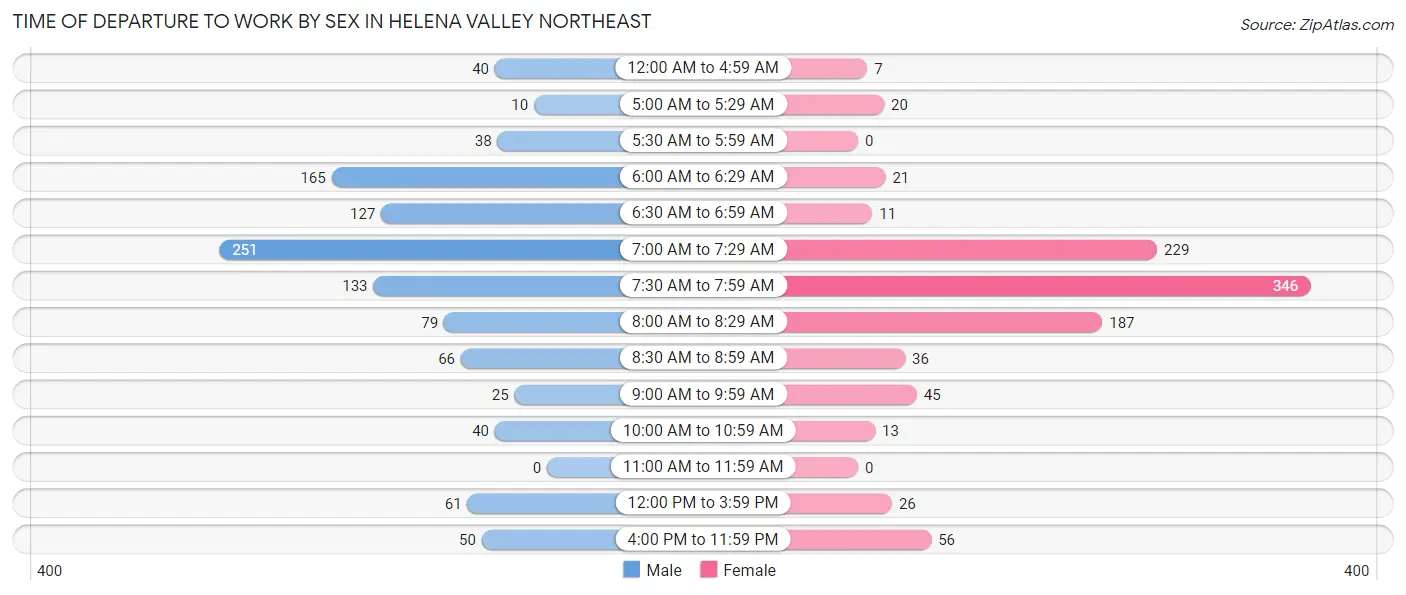
| Time of Departure | Male | Female |
| 12:00 AM to 4:59 AM | 40 (3.7%) | 7 (0.7%) |
| 5:00 AM to 5:29 AM | 10 (0.9%) | 20 (2.0%) |
| 5:30 AM to 5:59 AM | 38 (3.5%) | 0 (0.0%) |
| 6:00 AM to 6:29 AM | 165 (15.2%) | 21 (2.1%) |
| 6:30 AM to 6:59 AM | 127 (11.7%) | 11 (1.1%) |
| 7:00 AM to 7:29 AM | 251 (23.1%) | 229 (23.0%) |
| 7:30 AM to 7:59 AM | 133 (12.3%) | 346 (34.7%) |
| 8:00 AM to 8:29 AM | 79 (7.3%) | 187 (18.8%) |
| 8:30 AM to 8:59 AM | 66 (6.1%) | 36 (3.6%) |
| 9:00 AM to 9:59 AM | 25 (2.3%) | 45 (4.5%) |
| 10:00 AM to 10:59 AM | 40 (3.7%) | 13 (1.3%) |
| 11:00 AM to 11:59 AM | 0 (0.0%) | 0 (0.0%) |
| 12:00 PM to 3:59 PM | 61 (5.6%) | 26 (2.6%) |
| 4:00 PM to 11:59 PM | 50 (4.6%) | 56 (5.6%) |
| Total | 1,085 (100.0%) | 997 (100.0%) |
Housing Occupancy in Helena Valley Northeast
Occupancy by Ownership in Helena Valley Northeast
Of the total 1,528 dwellings in Helena Valley Northeast, owner-occupied units account for 1,456 (95.3%), while renter-occupied units make up 72 (4.7%).
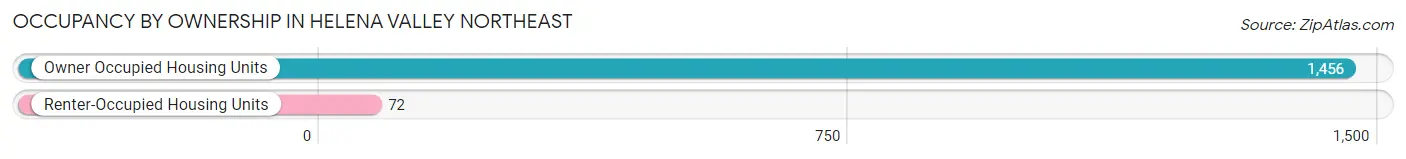
| Occupancy | # Housing Units | % Housing Units |
| Owner Occupied Housing Units | 1,456 | 95.3% |
| Renter-Occupied Housing Units | 72 | 4.7% |
| Total Occupied Housing Units | 1,528 | 100.0% |
Occupancy by Household Size in Helena Valley Northeast
| Household Size | # Housing Units | % Housing Units |
| 1-Person Household | 82 | 5.4% |
| 2-Person Household | 830 | 54.3% |
| 3-Person Household | 277 | 18.1% |
| 4+ Person Household | 339 | 22.2% |
| Total Housing Units | 1,528 | 100.0% |
Occupancy by Ownership by Household Size in Helena Valley Northeast
| Household Size | Owner-occupied | Renter-occupied |
| 1-Person Household | 73 (89.0%) | 9 (11.0%) |
| 2-Person Household | 796 (95.9%) | 34 (4.1%) |
| 3-Person Household | 268 (96.8%) | 9 (3.3%) |
| 4+ Person Household | 319 (94.1%) | 20 (5.9%) |
| Total Housing Units | 1,456 (95.3%) | 72 (4.7%) |
Occupancy by Educational Attainment in Helena Valley Northeast
| Household Size | Owner-occupied | Renter-occupied |
| Less than High School | 11 (45.8%) | 13 (54.2%) |
| High School Diploma | 334 (98.0%) | 7 (2.1%) |
| College/Associate Degree | 371 (94.2%) | 23 (5.8%) |
| Bachelor's Degree or higher | 740 (96.2%) | 29 (3.8%) |
Occupancy by Age of Householder in Helena Valley Northeast
| Age Bracket | # Households | % Households |
| Under 35 Years | 225 | 14.7% |
| 35 to 44 Years | 223 | 14.6% |
| 45 to 54 Years | 504 | 33.0% |
| 55 to 64 Years | 295 | 19.3% |
| 65 to 74 Years | 167 | 10.9% |
| 75 to 84 Years | 106 | 6.9% |
| 85 Years and Over | 8 | 0.5% |
| Total | 1,528 | 100.0% |
Housing Finances in Helena Valley Northeast
Median Income by Occupancy in Helena Valley Northeast
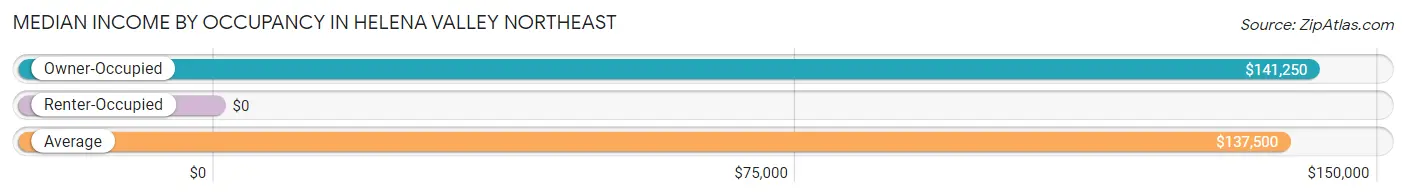
| Occupancy Type | # Households | Median Income |
| Owner-Occupied | 1,456 (95.3%) | $141,250 |
| Renter-Occupied | 72 (4.7%) | $0 |
| Average | 1,528 (100.0%) | $137,500 |
Occupancy by Householder Income Bracket in Helena Valley Northeast
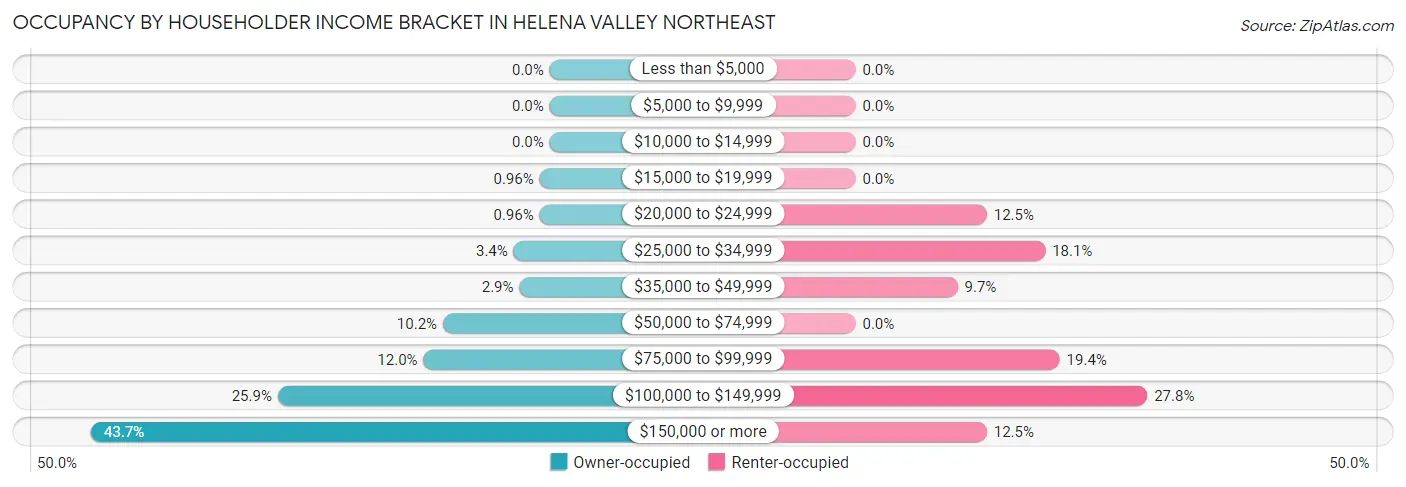
| Income Bracket | Owner-occupied | Renter-occupied |
| Less than $5,000 | 0 (0.0%) | 0 (0.0%) |
| $5,000 to $9,999 | 0 (0.0%) | 0 (0.0%) |
| $10,000 to $14,999 | 0 (0.0%) | 0 (0.0%) |
| $15,000 to $19,999 | 14 (1.0%) | 0 (0.0%) |
| $20,000 to $24,999 | 14 (1.0%) | 9 (12.5%) |
| $25,000 to $34,999 | 50 (3.4%) | 13 (18.1%) |
| $35,000 to $49,999 | 42 (2.9%) | 7 (9.7%) |
| $50,000 to $74,999 | 148 (10.2%) | 0 (0.0%) |
| $75,000 to $99,999 | 175 (12.0%) | 14 (19.4%) |
| $100,000 to $149,999 | 377 (25.9%) | 20 (27.8%) |
| $150,000 or more | 636 (43.7%) | 9 (12.5%) |
| Total | 1,456 (100.0%) | 72 (100.0%) |
Monthly Housing Cost Tiers in Helena Valley Northeast
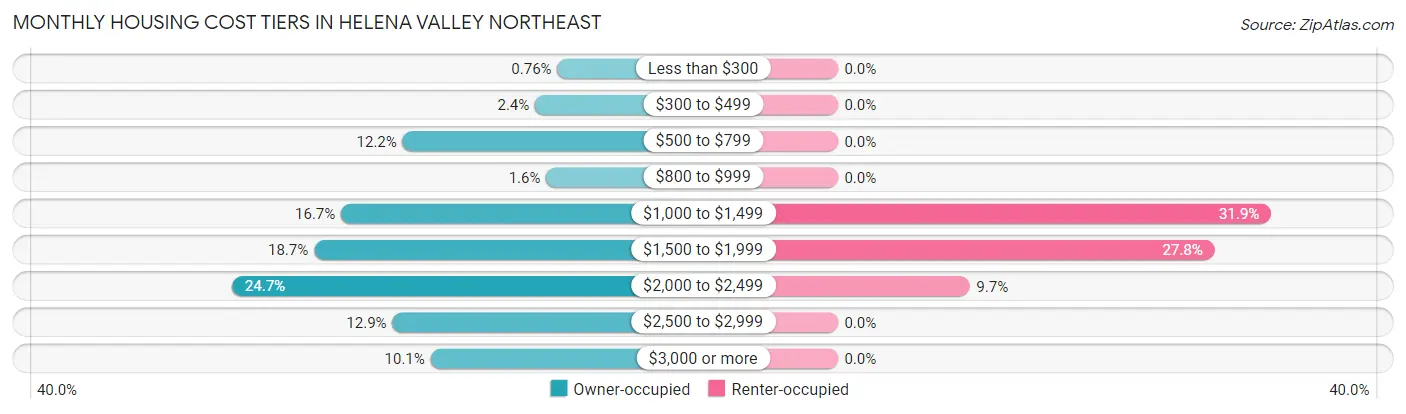
| Monthly Cost | Owner-occupied | Renter-occupied |
| Less than $300 | 11 (0.8%) | 0 (0.0%) |
| $300 to $499 | 35 (2.4%) | 0 (0.0%) |
| $500 to $799 | 177 (12.2%) | 0 (0.0%) |
| $800 to $999 | 23 (1.6%) | 0 (0.0%) |
| $1,000 to $1,499 | 243 (16.7%) | 23 (31.9%) |
| $1,500 to $1,999 | 272 (18.7%) | 20 (27.8%) |
| $2,000 to $2,499 | 360 (24.7%) | 7 (9.7%) |
| $2,500 to $2,999 | 188 (12.9%) | 0 (0.0%) |
| $3,000 or more | 147 (10.1%) | 0 (0.0%) |
| Total | 1,456 (100.0%) | 72 (100.0%) |
Physical Housing Characteristics in Helena Valley Northeast
Housing Structures in Helena Valley Northeast
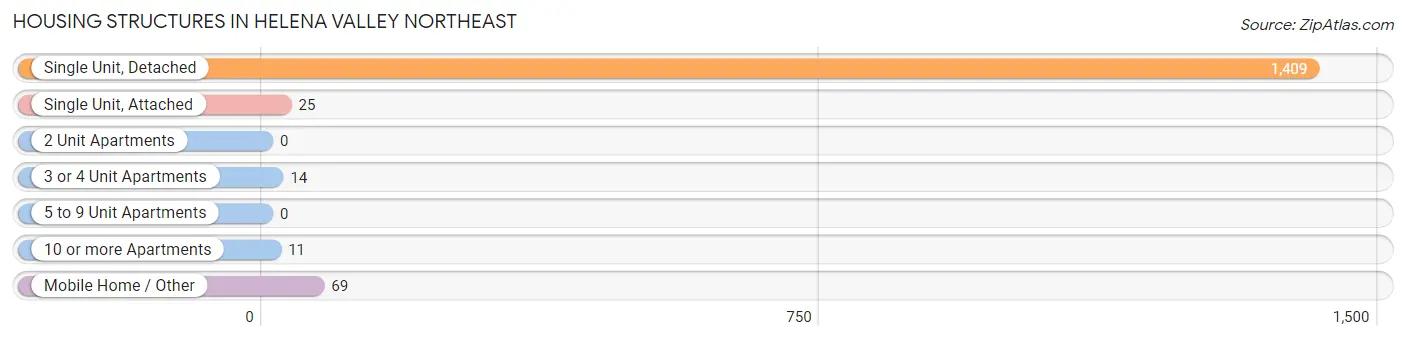
| Structure Type | # Housing Units | % Housing Units |
| Single Unit, Detached | 1,409 | 92.2% |
| Single Unit, Attached | 25 | 1.6% |
| 2 Unit Apartments | 0 | 0.0% |
| 3 or 4 Unit Apartments | 14 | 0.9% |
| 5 to 9 Unit Apartments | 0 | 0.0% |
| 10 or more Apartments | 11 | 0.7% |
| Mobile Home / Other | 69 | 4.5% |
| Total | 1,528 | 100.0% |
Housing Structures by Occupancy in Helena Valley Northeast
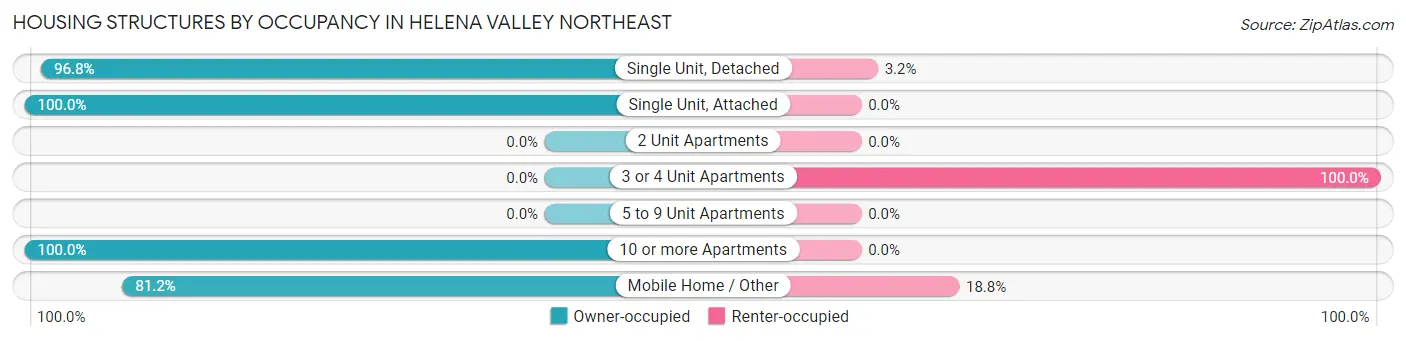
| Structure Type | Owner-occupied | Renter-occupied |
| Single Unit, Detached | 1,364 (96.8%) | 45 (3.2%) |
| Single Unit, Attached | 25 (100.0%) | 0 (0.0%) |
| 2 Unit Apartments | 0 (0.0%) | 0 (0.0%) |
| 3 or 4 Unit Apartments | 0 (0.0%) | 14 (100.0%) |
| 5 to 9 Unit Apartments | 0 (0.0%) | 0 (0.0%) |
| 10 or more Apartments | 11 (100.0%) | 0 (0.0%) |
| Mobile Home / Other | 56 (81.2%) | 13 (18.8%) |
| Total | 1,456 (95.3%) | 72 (4.7%) |
Housing Structures by Number of Rooms in Helena Valley Northeast
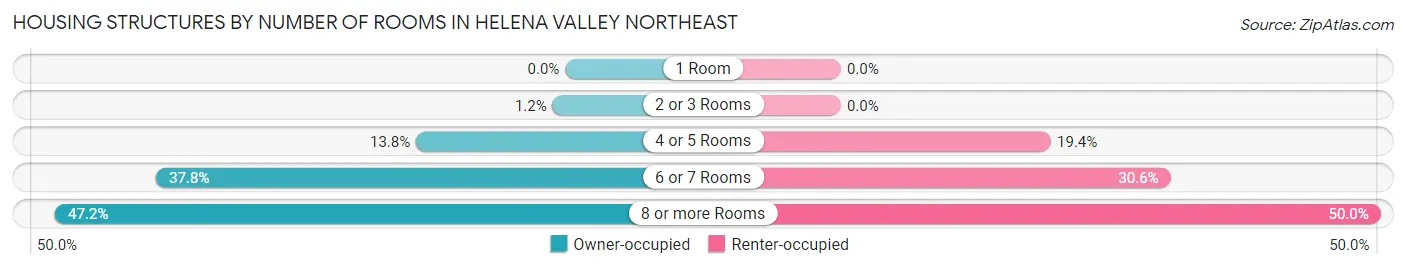
| Number of Rooms | Owner-occupied | Renter-occupied |
| 1 Room | 0 (0.0%) | 0 (0.0%) |
| 2 or 3 Rooms | 17 (1.2%) | 0 (0.0%) |
| 4 or 5 Rooms | 201 (13.8%) | 14 (19.4%) |
| 6 or 7 Rooms | 551 (37.8%) | 22 (30.6%) |
| 8 or more Rooms | 687 (47.2%) | 36 (50.0%) |
| Total | 1,456 (100.0%) | 72 (100.0%) |
Housing Structure by Heating Type in Helena Valley Northeast
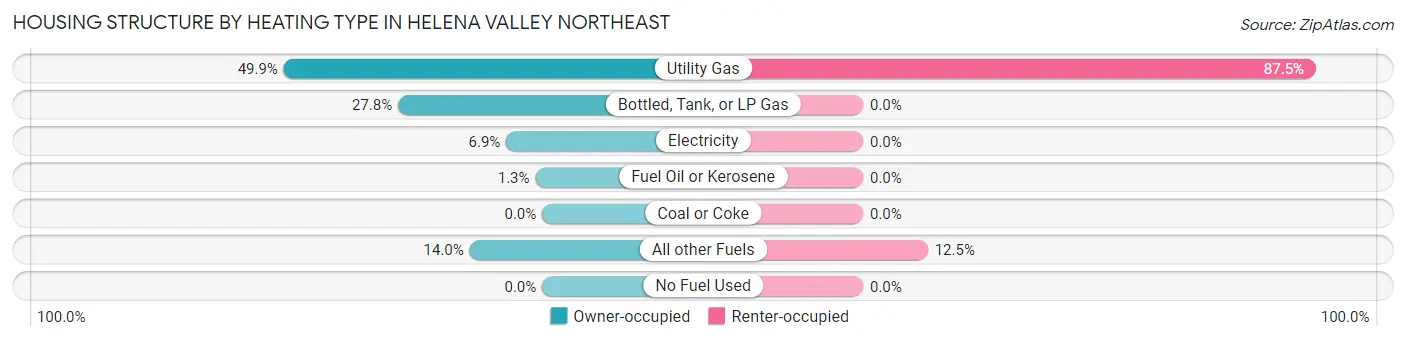
| Heating Type | Owner-occupied | Renter-occupied |
| Utility Gas | 727 (49.9%) | 63 (87.5%) |
| Bottled, Tank, or LP Gas | 405 (27.8%) | 0 (0.0%) |
| Electricity | 101 (6.9%) | 0 (0.0%) |
| Fuel Oil or Kerosene | 19 (1.3%) | 0 (0.0%) |
| Coal or Coke | 0 (0.0%) | 0 (0.0%) |
| All other Fuels | 204 (14.0%) | 9 (12.5%) |
| No Fuel Used | 0 (0.0%) | 0 (0.0%) |
| Total | 1,456 (100.0%) | 72 (100.0%) |
Household Vehicle Usage in Helena Valley Northeast
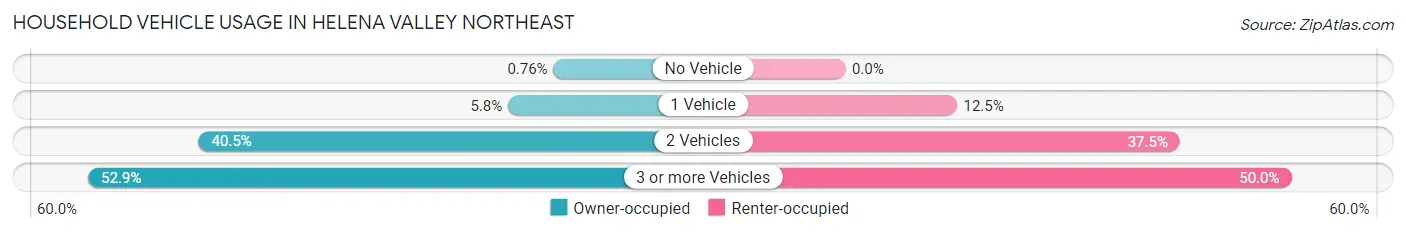
| Vehicles per Household | Owner-occupied | Renter-occupied |
| No Vehicle | 11 (0.8%) | 0 (0.0%) |
| 1 Vehicle | 85 (5.8%) | 9 (12.5%) |
| 2 Vehicles | 590 (40.5%) | 27 (37.5%) |
| 3 or more Vehicles | 770 (52.9%) | 36 (50.0%) |
| Total | 1,456 (100.0%) | 72 (100.0%) |
Real Estate & Mortgages in Helena Valley Northeast
Real Estate and Mortgage Overview in Helena Valley Northeast
| Characteristic | Without Mortgage | With Mortgage |
| Housing Units | 307 | 1,149 |
| Median Property Value | $480,600 | $454,600 |
| Median Household Income | - | - |
| Monthly Housing Costs | $598 | $147 |
| Real Estate Taxes | $3,831 | $0 |
Property Value by Mortgage Status in Helena Valley Northeast
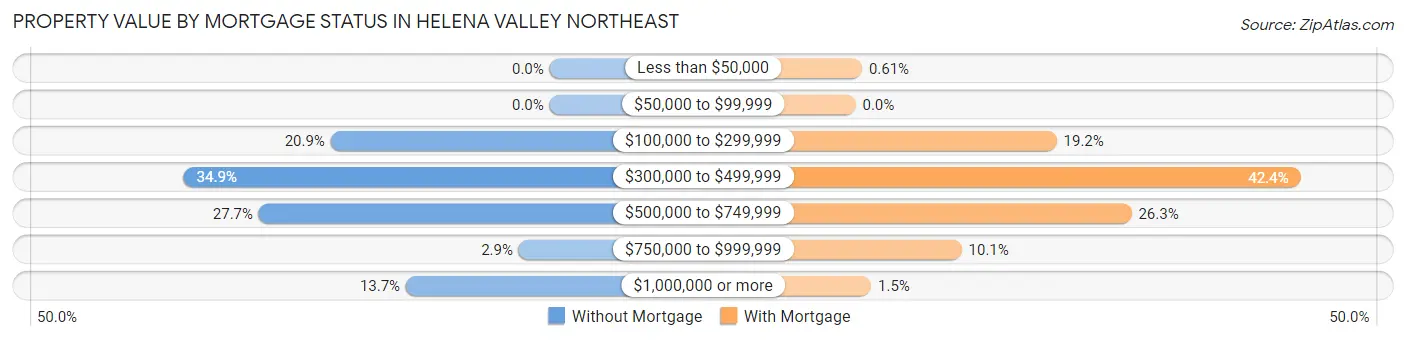
| Property Value | Without Mortgage | With Mortgage |
| Less than $50,000 | 0 (0.0%) | 7 (0.6%) |
| $50,000 to $99,999 | 0 (0.0%) | 0 (0.0%) |
| $100,000 to $299,999 | 64 (20.8%) | 220 (19.2%) |
| $300,000 to $499,999 | 107 (34.8%) | 487 (42.4%) |
| $500,000 to $749,999 | 85 (27.7%) | 302 (26.3%) |
| $750,000 to $999,999 | 9 (2.9%) | 116 (10.1%) |
| $1,000,000 or more | 42 (13.7%) | 17 (1.5%) |
| Total | 307 (100.0%) | 1,149 (100.0%) |
Household Income by Mortgage Status in Helena Valley Northeast
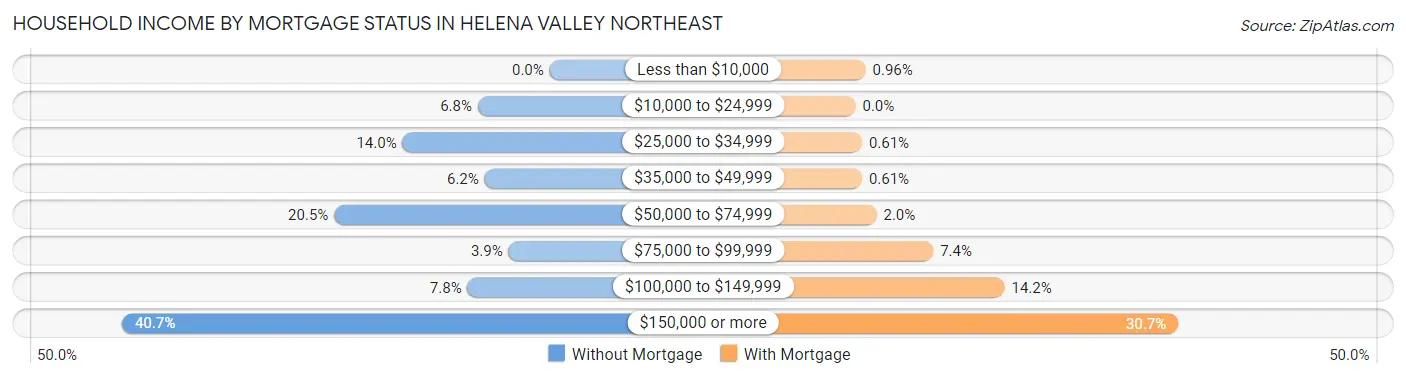
| Household Income | Without Mortgage | With Mortgage |
| Less than $10,000 | 0 (0.0%) | 11 (1.0%) |
| $10,000 to $24,999 | 21 (6.8%) | 0 (0.0%) |
| $25,000 to $34,999 | 43 (14.0%) | 7 (0.6%) |
| $35,000 to $49,999 | 19 (6.2%) | 7 (0.6%) |
| $50,000 to $74,999 | 63 (20.5%) | 23 (2.0%) |
| $75,000 to $99,999 | 12 (3.9%) | 85 (7.4%) |
| $100,000 to $149,999 | 24 (7.8%) | 163 (14.2%) |
| $150,000 or more | 125 (40.7%) | 353 (30.7%) |
| Total | 307 (100.0%) | 1,149 (100.0%) |
Property Value to Household Income Ratio in Helena Valley Northeast
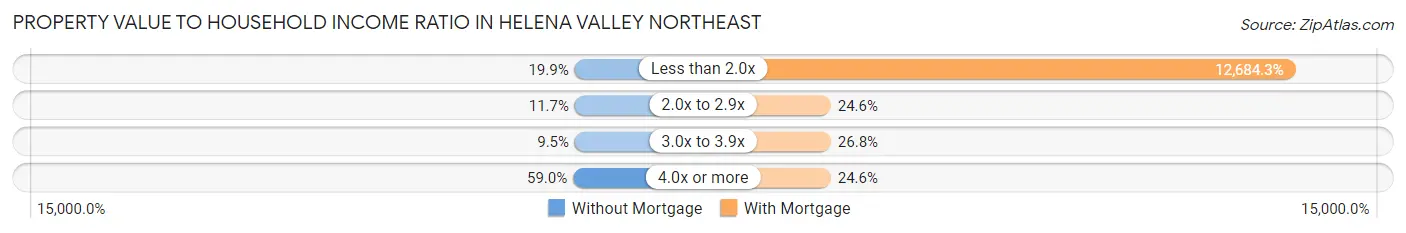
| Value-to-Income Ratio | Without Mortgage | With Mortgage |
| Less than 2.0x | 61 (19.9%) | 145,742 (12,684.3%) |
| 2.0x to 2.9x | 36 (11.7%) | 283 (24.6%) |
| 3.0x to 3.9x | 29 (9.5%) | 308 (26.8%) |
| 4.0x or more | 181 (59.0%) | 283 (24.6%) |
| Total | 307 (100.0%) | 1,149 (100.0%) |
Real Estate Taxes by Mortgage Status in Helena Valley Northeast
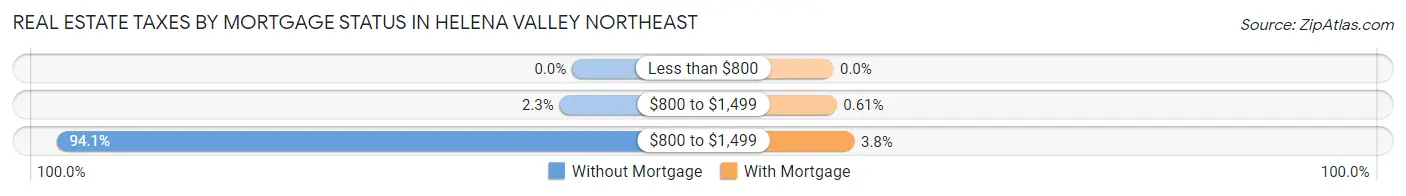
| Property Taxes | Without Mortgage | With Mortgage |
| Less than $800 | 0 (0.0%) | 0 (0.0%) |
| $800 to $1,499 | 7 (2.3%) | 7 (0.6%) |
| $800 to $1,499 | 289 (94.1%) | 44 (3.8%) |
| Total | 307 (100.0%) | 1,149 (100.0%) |
Health & Disability in Helena Valley Northeast
Health Insurance Coverage by Age in Helena Valley Northeast
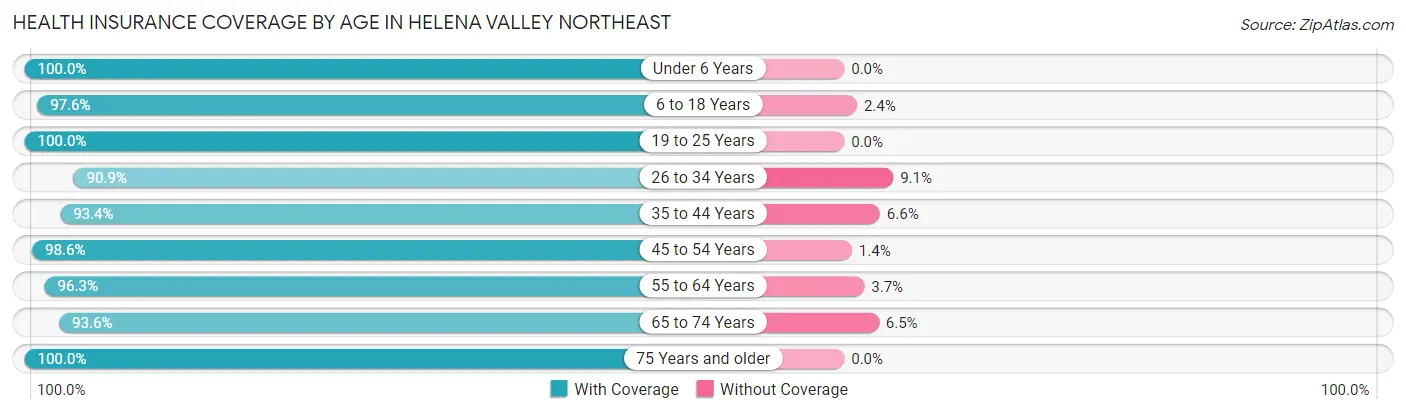
| Age Bracket | With Coverage | Without Coverage |
| Under 6 Years | 239 (100.0%) | 0 (0.0%) |
| 6 to 18 Years | 456 (97.6%) | 11 (2.4%) |
| 19 to 25 Years | 295 (100.0%) | 0 (0.0%) |
| 26 to 34 Years | 378 (90.9%) | 38 (9.1%) |
| 35 to 44 Years | 492 (93.4%) | 35 (6.6%) |
| 45 to 54 Years | 832 (98.6%) | 12 (1.4%) |
| 55 to 64 Years | 643 (96.3%) | 25 (3.7%) |
| 65 to 74 Years | 406 (93.5%) | 28 (6.5%) |
| 75 Years and older | 355 (100.0%) | 0 (0.0%) |
| Total | 4,096 (96.5%) | 149 (3.5%) |
Health Insurance Coverage by Citizenship Status in Helena Valley Northeast
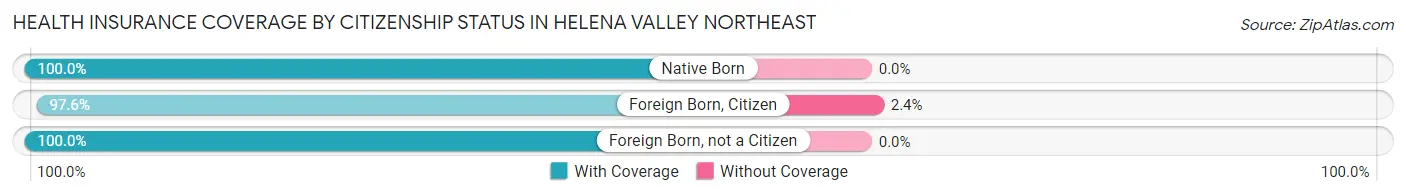
| Citizenship Status | With Coverage | Without Coverage |
| Native Born | 239 (100.0%) | 0 (0.0%) |
| Foreign Born, Citizen | 456 (97.6%) | 11 (2.4%) |
| Foreign Born, not a Citizen | 295 (100.0%) | 0 (0.0%) |
Health Insurance Coverage by Household Income in Helena Valley Northeast
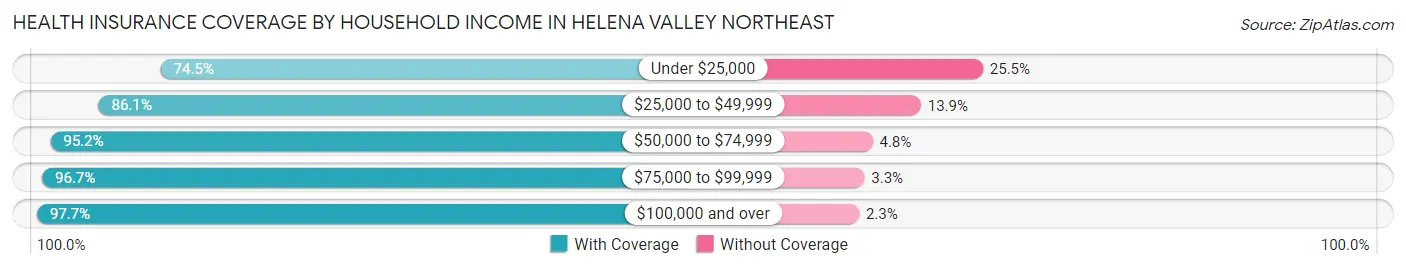
| Household Income | With Coverage | Without Coverage |
| Under $25,000 | 38 (74.5%) | 13 (25.5%) |
| $25,000 to $49,999 | 174 (86.1%) | 28 (13.9%) |
| $50,000 to $74,999 | 474 (95.2%) | 24 (4.8%) |
| $75,000 to $99,999 | 412 (96.7%) | 14 (3.3%) |
| $100,000 and over | 2,986 (97.7%) | 70 (2.3%) |
Public vs Private Health Insurance Coverage by Age in Helena Valley Northeast
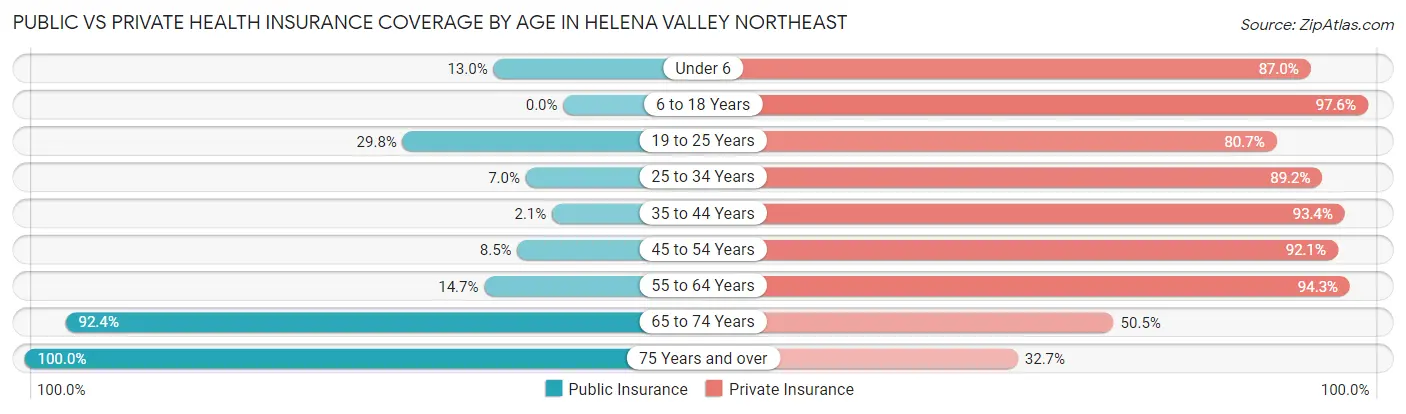
| Age Bracket | Public Insurance | Private Insurance |
| Under 6 | 31 (13.0%) | 208 (87.0%) |
| 6 to 18 Years | 0 (0.0%) | 456 (97.6%) |
| 19 to 25 Years | 88 (29.8%) | 238 (80.7%) |
| 25 to 34 Years | 29 (7.0%) | 371 (89.2%) |
| 35 to 44 Years | 11 (2.1%) | 492 (93.4%) |
| 45 to 54 Years | 72 (8.5%) | 777 (92.1%) |
| 55 to 64 Years | 98 (14.7%) | 630 (94.3%) |
| 65 to 74 Years | 401 (92.4%) | 219 (50.5%) |
| 75 Years and over | 355 (100.0%) | 116 (32.7%) |
| Total | 1,085 (25.6%) | 3,507 (82.6%) |
Disability Status by Sex by Age in Helena Valley Northeast
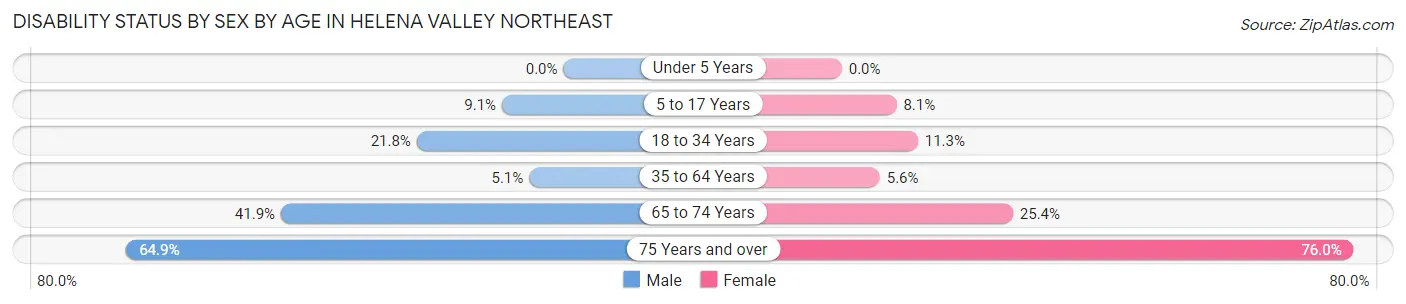
| Age Bracket | Male | Female |
| Under 5 Years | 0 (0.0%) | 0 (0.0%) |
| 5 to 17 Years | 27 (9.1%) | 16 (8.1%) |
| 18 to 34 Years | 93 (21.8%) | 35 (11.3%) |
| 35 to 64 Years | 55 (5.1%) | 54 (5.6%) |
| 65 to 74 Years | 78 (41.9%) | 63 (25.4%) |
| 75 Years and over | 98 (64.9%) | 155 (76.0%) |
Disability Class by Sex by Age in Helena Valley Northeast
Disability Class: Hearing Difficulty
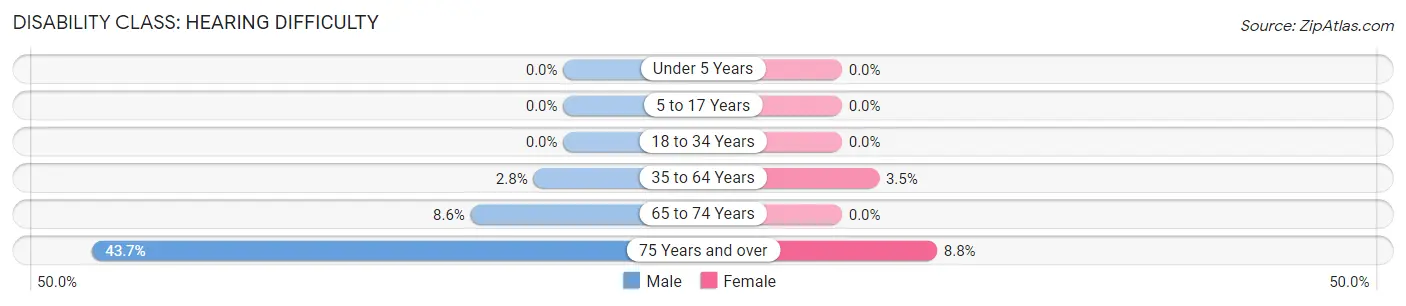
| Age Bracket | Male | Female |
| Under 5 Years | 0 (0.0%) | 0 (0.0%) |
| 5 to 17 Years | 0 (0.0%) | 0 (0.0%) |
| 18 to 34 Years | 0 (0.0%) | 0 (0.0%) |
| 35 to 64 Years | 30 (2.8%) | 33 (3.5%) |
| 65 to 74 Years | 16 (8.6%) | 0 (0.0%) |
| 75 Years and over | 66 (43.7%) | 18 (8.8%) |
Disability Class: Vision Difficulty
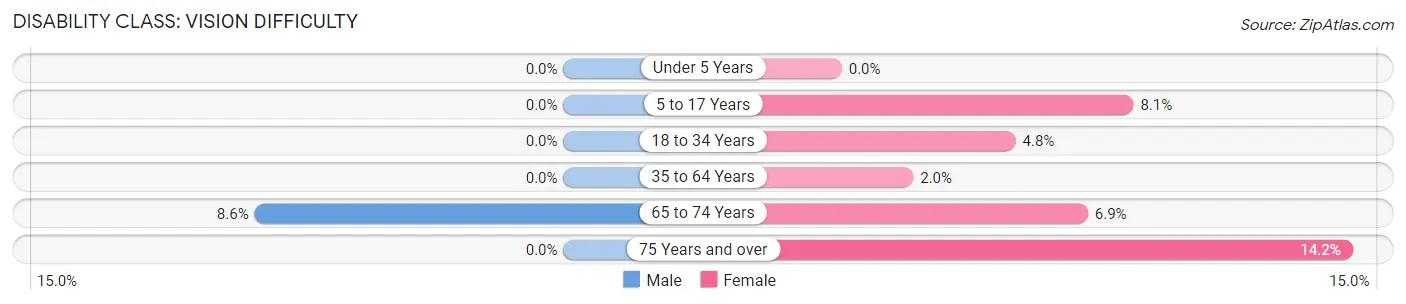
| Age Bracket | Male | Female |
| Under 5 Years | 0 (0.0%) | 0 (0.0%) |
| 5 to 17 Years | 0 (0.0%) | 16 (8.1%) |
| 18 to 34 Years | 0 (0.0%) | 15 (4.8%) |
| 35 to 64 Years | 0 (0.0%) | 19 (2.0%) |
| 65 to 74 Years | 16 (8.6%) | 17 (6.9%) |
| 75 Years and over | 0 (0.0%) | 29 (14.2%) |
Disability Class: Cognitive Difficulty
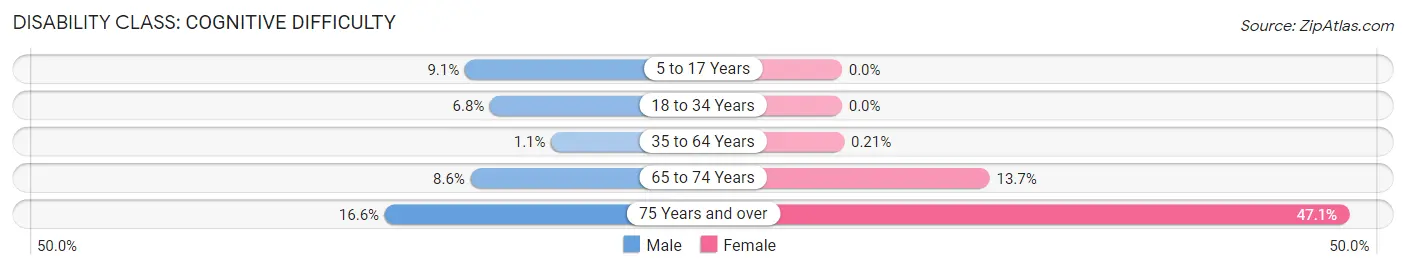
| Age Bracket | Male | Female |
| 5 to 17 Years | 27 (9.1%) | 0 (0.0%) |
| 18 to 34 Years | 29 (6.8%) | 0 (0.0%) |
| 35 to 64 Years | 12 (1.1%) | 2 (0.2%) |
| 65 to 74 Years | 16 (8.6%) | 34 (13.7%) |
| 75 Years and over | 25 (16.6%) | 96 (47.1%) |
Disability Class: Ambulatory Difficulty
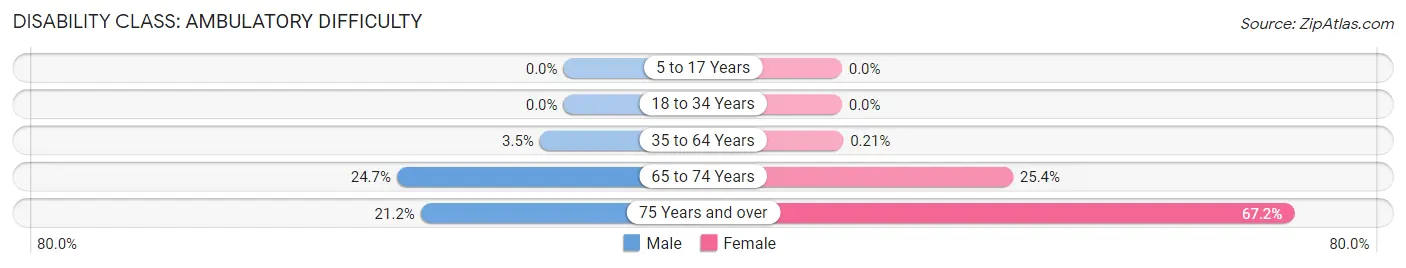
| Age Bracket | Male | Female |
| 5 to 17 Years | 0 (0.0%) | 0 (0.0%) |
| 18 to 34 Years | 0 (0.0%) | 0 (0.0%) |
| 35 to 64 Years | 38 (3.5%) | 2 (0.2%) |
| 65 to 74 Years | 46 (24.7%) | 63 (25.4%) |
| 75 Years and over | 32 (21.2%) | 137 (67.2%) |
Disability Class: Self-Care Difficulty
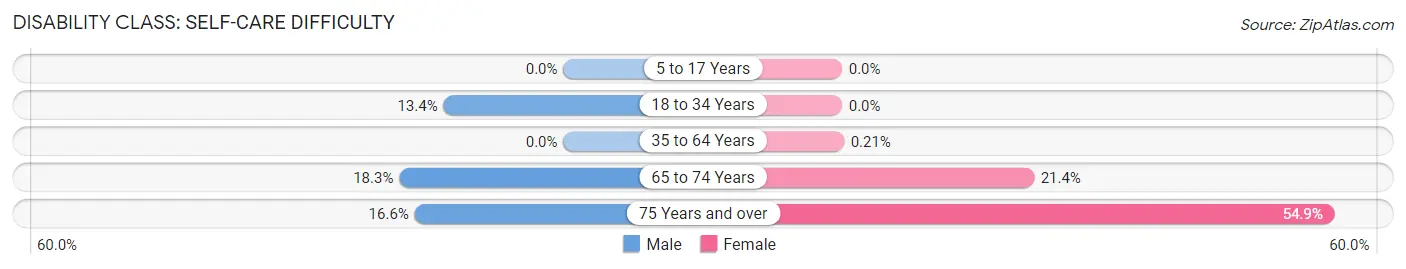
| Age Bracket | Male | Female |
| 5 to 17 Years | 0 (0.0%) | 0 (0.0%) |
| 18 to 34 Years | 57 (13.4%) | 0 (0.0%) |
| 35 to 64 Years | 0 (0.0%) | 2 (0.2%) |
| 65 to 74 Years | 34 (18.3%) | 53 (21.4%) |
| 75 Years and over | 25 (16.6%) | 112 (54.9%) |
Technology Access in Helena Valley Northeast
Computing Device Access in Helena Valley Northeast
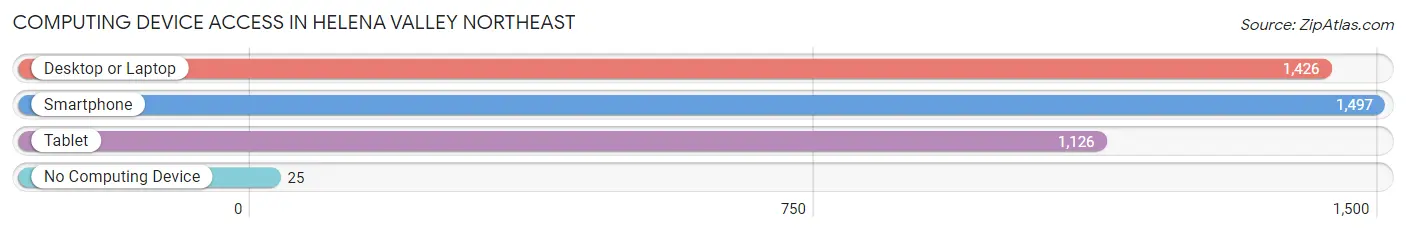
| Device Type | # Households | % Households |
| Desktop or Laptop | 1,426 | 93.3% |
| Smartphone | 1,497 | 98.0% |
| Tablet | 1,126 | 73.7% |
| No Computing Device | 25 | 1.6% |
| Total | 1,528 | 100.0% |
Internet Access in Helena Valley Northeast
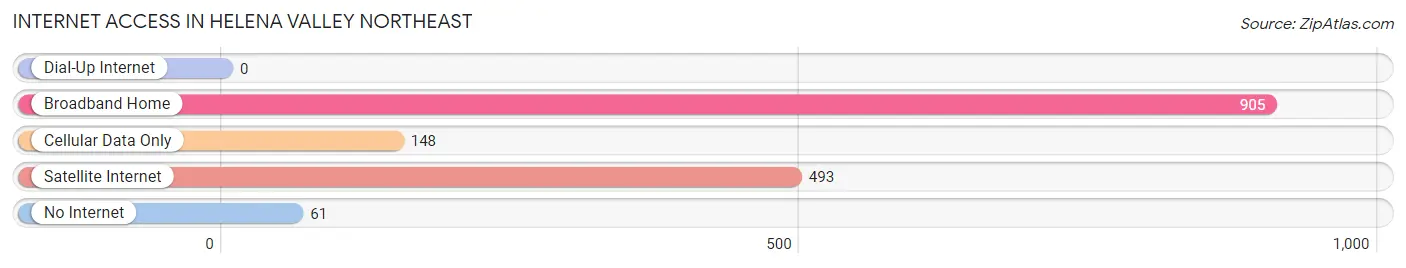
| Internet Type | # Households | % Households |
| Dial-Up Internet | 0 | 0.0% |
| Broadband Home | 905 | 59.2% |
| Cellular Data Only | 148 | 9.7% |
| Satellite Internet | 493 | 32.3% |
| No Internet | 61 | 4.0% |
| Total | 1,528 | 100.0% |
Helena Valley Northeast Summary
Helena Valley Northeast is a census-designated place (CDP) located in Lewis and Clark County, Montana. It is situated in the Helena Valley, which is located in the western part of the state. The CDP has a total area of 8.3 square miles, all of which is land. As of the 2010 census, the population of Helena Valley Northeast was 1,845.
Geography
Helena Valley Northeast is located in the Helena Valley, which is situated in the western part of Montana. The CDP is bordered by the city of Helena to the south, the city of East Helena to the east, and the city of Clancy to the north. The CDP is situated at an elevation of 3,845 feet above sea level. The terrain of the CDP is mostly flat, with some rolling hills. The CDP is located in the Rocky Mountain Front, which is a region of the Rocky Mountains that extends from the Canadian border to the Wyoming border.
Climate
Helena Valley Northeast has a semi-arid climate, with hot summers and cold winters. The average annual temperature is 44.3°F, with an average high of 68.2°F in July and an average low of 20.4°F in January. The average annual precipitation is 13.3 inches, with an average of 1.7 inches of snowfall per year.
Demographics
As of the 2010 census, there were 1,845 people, 745 households, and 486 families residing in the CDP. The population density was 222.3 people per square mile. The racial makeup of the CDP was 94.2% White, 0.7% African American, 1.2% Native American, 0.4% Asian, 0.1% Pacific Islander, 1.2% from other races, and 2.2% from two or more races. Hispanic or Latino of any race were 3.3% of the population.
The median age in the CDP was 41.2 years, with 24.2% of the population under the age of 18, 6.2% between the ages of 18 and 24, 25.2% between the ages of 25 and 44, 28.2% between the ages of 45 and 64, and 16.2% 65 years of age or older. The median household income was $45,938, and the median family income was $51,964.
Economy
The economy of Helena Valley Northeast is largely based on agriculture and tourism. The CDP is home to several farms and ranches, which produce a variety of crops and livestock. The CDP is also home to several tourist attractions, including the Lewis and Clark Caverns State Park, the Helena National Forest, and the Gates of the Mountains Wilderness Area.
The CDP is also home to several businesses, including restaurants, retail stores, and service providers. The largest employers in the CDP are the Helena School District, the Lewis and Clark County government, and the Helena Regional Medical Center.
Conclusion
Helena Valley Northeast is a census-designated place located in Lewis and Clark County, Montana. It is situated in the Helena Valley, which is located in the western part of the state. The CDP has a total area of 8.3 square miles, all of which is land. As of the 2010 census, the population of Helena Valley Northeast was 1,845. The CDP has a semi-arid climate, with hot summers and cold winters. The economy of Helena Valley Northeast is largely based on agriculture and tourism. The CDP is home to several farms and ranches, as well as several tourist attractions. The largest employers in the CDP are the Helena School District, the Lewis and Clark County government, and the Helena Regional Medical Center.
Common Questions
What is Per Capita Income in Helena Valley Northeast?
Per Capita income in Helena Valley Northeast is $61,957.
What is the Median Family Income in Helena Valley Northeast?
Median Family Income in Helena Valley Northeast is $146,641.
What is the Median Household income in Helena Valley Northeast?
Median Household Income in Helena Valley Northeast is $137,500.
What is Income or Wage Gap in Helena Valley Northeast?
Income or Wage Gap in Helena Valley Northeast is 40.5%.
Women in Helena Valley Northeast earn 59.5 cents for every dollar earned by a man.
What is Inequality or Gini Index in Helena Valley Northeast?
Inequality or Gini Index in Helena Valley Northeast is 0.40.
What is the Total Population of Helena Valley Northeast?
Total Population of Helena Valley Northeast is 4,245.
What is the Total Male Population of Helena Valley Northeast?
Total Male Population of Helena Valley Northeast is 2,217.
What is the Total Female Population of Helena Valley Northeast?
Total Female Population of Helena Valley Northeast is 2,028.
What is the Ratio of Males per 100 Females in Helena Valley Northeast?
There are 109.32 Males per 100 Females in Helena Valley Northeast.
What is the Ratio of Females per 100 Males in Helena Valley Northeast?
There are 91.47 Females per 100 Males in Helena Valley Northeast.
What is the Median Population Age in Helena Valley Northeast?
Median Population Age in Helena Valley Northeast is 47.4 Years.
What is the Average Family Size in Helena Valley Northeast
Average Family Size in Helena Valley Northeast is 2.8 People.
What is the Average Household Size in Helena Valley Northeast
Average Household Size in Helena Valley Northeast is 2.8 People.
How Large is the Labor Force in Helena Valley Northeast?
There are 2,481 People in the Labor Forcein in Helena Valley Northeast.
What is the Percentage of People in the Labor Force in Helena Valley Northeast?
67.2% of People are in the Labor Force in Helena Valley Northeast.
What is the Unemployment Rate in Helena Valley Northeast?
Unemployment Rate in Helena Valley Northeast is 1.5%.