Montana City, MT Map & Demographics
Montana City Map
Montana City Overview
$49,475
PER CAPITA INCOME
$120,500
AVG FAMILY INCOME
$113,679
AVG HOUSEHOLD INCOME
27.1%
WAGE / INCOME GAP [ % ]
72.9¢/ $1
WAGE / INCOME GAP [ $ ]
0.35
INEQUALITY / GINI INDEX
2,716
TOTAL POPULATION
1,335
MALE POPULATION
1,381
FEMALE POPULATION
96.67
MALES / 100 FEMALES
103.45
FEMALES / 100 MALES
44.4
MEDIAN AGE
2.9
AVG FAMILY SIZE
2.8
AVG HOUSEHOLD SIZE
1,475
LABOR FORCE [ PEOPLE ]
67.9%
PERCENT IN LABOR FORCE
2.2%
UNEMPLOYMENT RATE
Montana City Area Codes
Income in Montana City
Income Overview in Montana City
Per Capita Income in Montana City is $49,475, while median incomes of families and households are $120,500 and $113,679 respectively.
| Characteristic | Number | Measure |
| Per Capita Income | 2,716 | $49,475 |
| Median Family Income | 840 | $120,500 |
| Mean Family Income | 840 | $140,977 |
| Median Household Income | 966 | $113,679 |
| Mean Household Income | 966 | $136,438 |
| Income Deficit | 840 | $0 |
| Wage / Income Gap (%) | 2,716 | 27.07% |
| Wage / Income Gap ($) | 2,716 | 72.93¢ per $1 |
| Gini / Inequality Index | 2,716 | 0.35 |
Earnings by Sex in Montana City
Average Earnings in Montana City are $53,594, $65,556 for men and $47,813 for women, a difference of 27.1%.
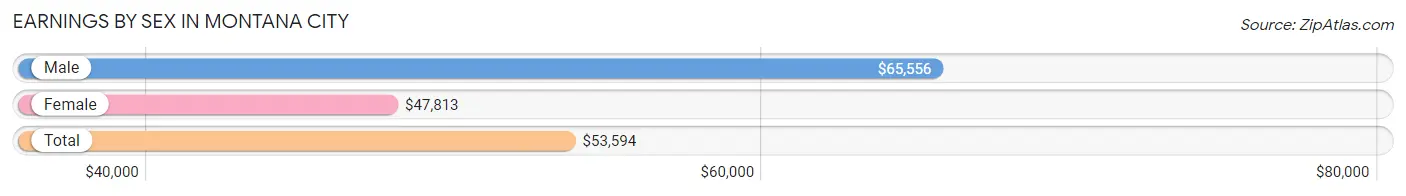
| Sex | Number | Average Earnings |
| Male | 754 (47.2%) | $65,556 |
| Female | 842 (52.8%) | $47,813 |
| Total | 1,596 (100.0%) | $53,594 |
Earnings by Sex by Income Bracket in Montana City
The most common earnings brackets in Montana City are $100,000+ for men (169 | 22.4%) and $55,000 to $64,999 for women (122 | 14.5%).
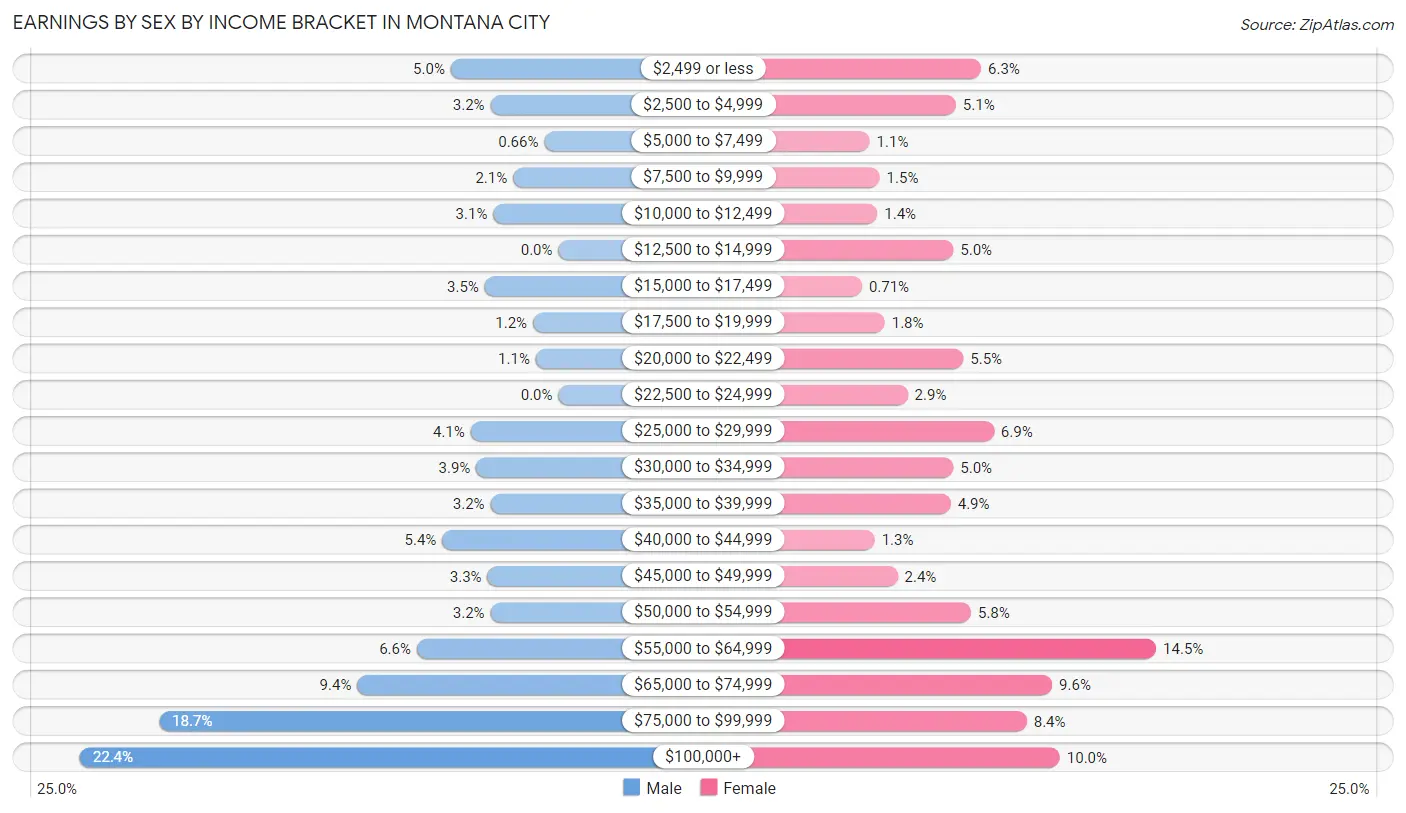
| Income | Male | Female |
| $2,499 or less | 38 (5.0%) | 53 (6.3%) |
| $2,500 to $4,999 | 24 (3.2%) | 43 (5.1%) |
| $5,000 to $7,499 | 5 (0.7%) | 9 (1.1%) |
| $7,500 to $9,999 | 16 (2.1%) | 13 (1.5%) |
| $10,000 to $12,499 | 23 (3.0%) | 12 (1.4%) |
| $12,500 to $14,999 | 0 (0.0%) | 42 (5.0%) |
| $15,000 to $17,499 | 26 (3.5%) | 6 (0.7%) |
| $17,500 to $19,999 | 9 (1.2%) | 15 (1.8%) |
| $20,000 to $22,499 | 8 (1.1%) | 46 (5.5%) |
| $22,500 to $24,999 | 0 (0.0%) | 24 (2.9%) |
| $25,000 to $29,999 | 31 (4.1%) | 58 (6.9%) |
| $30,000 to $34,999 | 29 (3.8%) | 42 (5.0%) |
| $35,000 to $39,999 | 24 (3.2%) | 41 (4.9%) |
| $40,000 to $44,999 | 41 (5.4%) | 11 (1.3%) |
| $45,000 to $49,999 | 25 (3.3%) | 20 (2.4%) |
| $50,000 to $54,999 | 24 (3.2%) | 49 (5.8%) |
| $55,000 to $64,999 | 50 (6.6%) | 122 (14.5%) |
| $65,000 to $74,999 | 71 (9.4%) | 81 (9.6%) |
| $75,000 to $99,999 | 141 (18.7%) | 71 (8.4%) |
| $100,000+ | 169 (22.4%) | 84 (10.0%) |
| Total | 754 (100.0%) | 842 (100.0%) |
Earnings by Sex by Educational Attainment in Montana City
Average earnings in Montana City are $71,136 for men and $51,515 for women, a difference of 27.6%. Men with an educational attainment of graduate degree enjoy the highest average annual earnings of $140,536, while those with high school diploma education earn the least with $42,287. Women with an educational attainment of graduate degree earn the most with the average annual earnings of $67,663, while those with college or associate's degree education have the smallest earnings of $49,063.
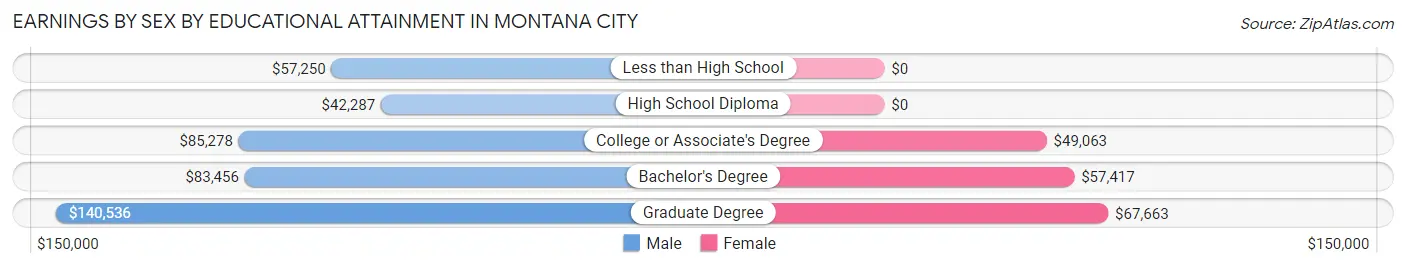
| Educational Attainment | Male Income | Female Income |
| Less than High School | $57,250 | $0 |
| High School Diploma | $42,287 | $0 |
| College or Associate's Degree | $85,278 | $49,063 |
| Bachelor's Degree | $83,456 | $57,417 |
| Graduate Degree | $140,536 | $67,663 |
| Total | $71,136 | $51,515 |
Family Income in Montana City
Family Income Brackets in Montana City
According to the Montana City family income data, there are 180 families falling into the $100,000 to $149,999 income range, which is the most common income bracket and makes up 21.4% of all families.
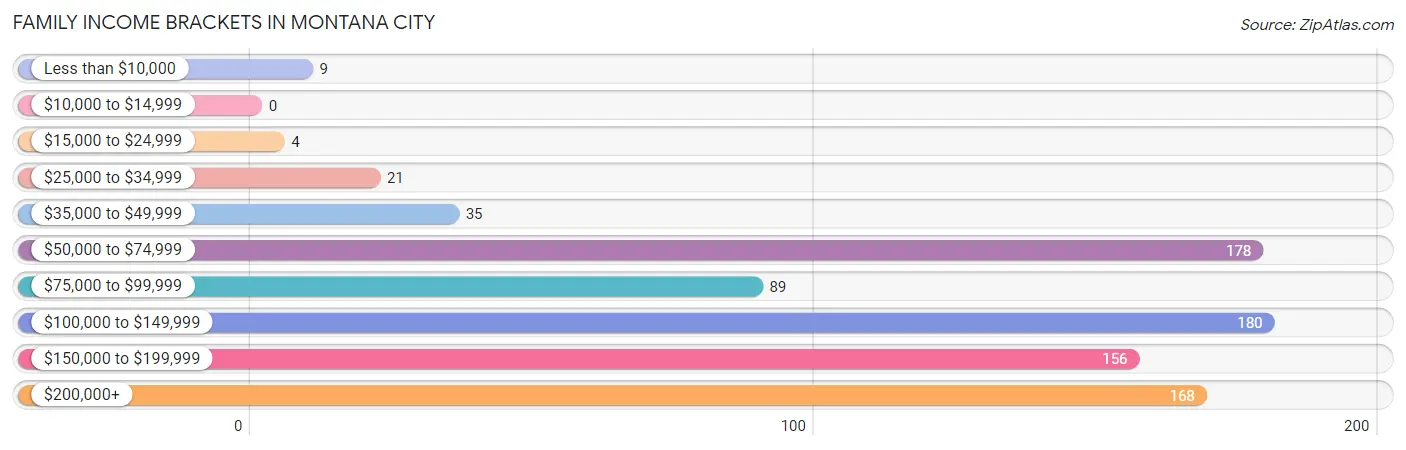
| Income Bracket | # Families | % Families |
| Less than $10,000 | 9 | 1.1% |
| $10,000 to $14,999 | 0 | 0.0% |
| $15,000 to $24,999 | 4 | 0.5% |
| $25,000 to $34,999 | 21 | 2.5% |
| $35,000 to $49,999 | 35 | 4.2% |
| $50,000 to $74,999 | 178 | 21.2% |
| $75,000 to $99,999 | 89 | 10.6% |
| $100,000 to $149,999 | 180 | 21.4% |
| $150,000 to $199,999 | 156 | 18.6% |
| $200,000+ | 168 | 20.0% |
Family Income by Famaliy Size in Montana City
5-person families (37 | 4.4%) account for the highest median family income in Montana City with $187,750 per family, while 2-person families (395 | 47.0%) have the highest median income of $50,856 per family member.
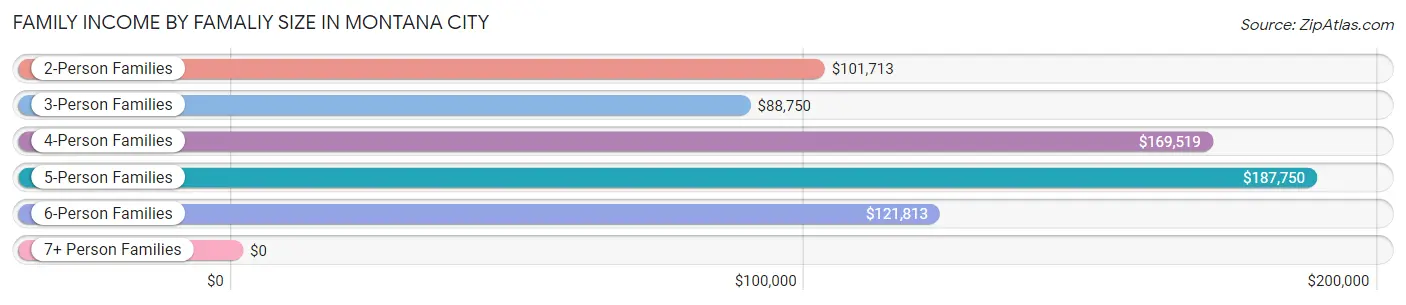
| Income Bracket | # Families | Median Income |
| 2-Person Families | 395 (47.0%) | $101,713 |
| 3-Person Families | 206 (24.5%) | $88,750 |
| 4-Person Families | 163 (19.4%) | $169,519 |
| 5-Person Families | 37 (4.4%) | $187,750 |
| 6-Person Families | 39 (4.6%) | $121,813 |
| 7+ Person Families | 0 (0.0%) | $0 |
| Total | 840 (100.0%) | $120,500 |
Family Income by Number of Earners in Montana City
The median family income in Montana City is $120,500, with families comprising 3+ earners (95) having the highest median family income of $169,519, while families with no earners (123) have the lowest median family income of $61,442, accounting for 11.3% and 14.6% of families, respectively.
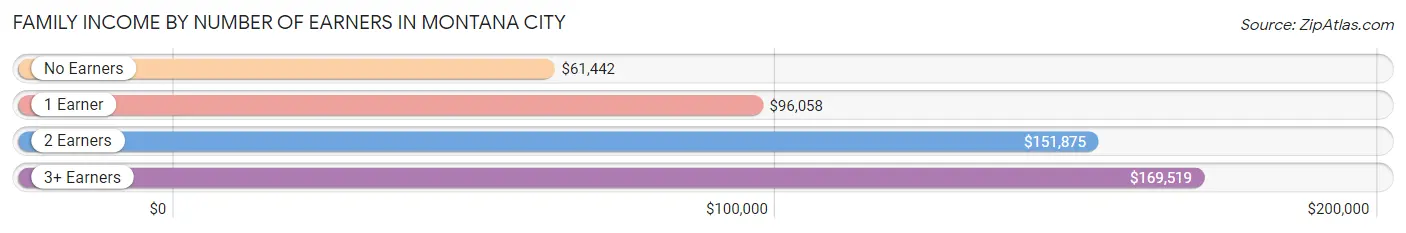
| Number of Earners | # Families | Median Income |
| No Earners | 123 (14.6%) | $61,442 |
| 1 Earner | 231 (27.5%) | $96,058 |
| 2 Earners | 391 (46.6%) | $151,875 |
| 3+ Earners | 95 (11.3%) | $169,519 |
| Total | 840 (100.0%) | $120,500 |
Household Income in Montana City
Household Income Brackets in Montana City
With 230 households falling in the category, the $100,000 to $149,999 income range is the most frequent in Montana City, accounting for 23.8% of all households.
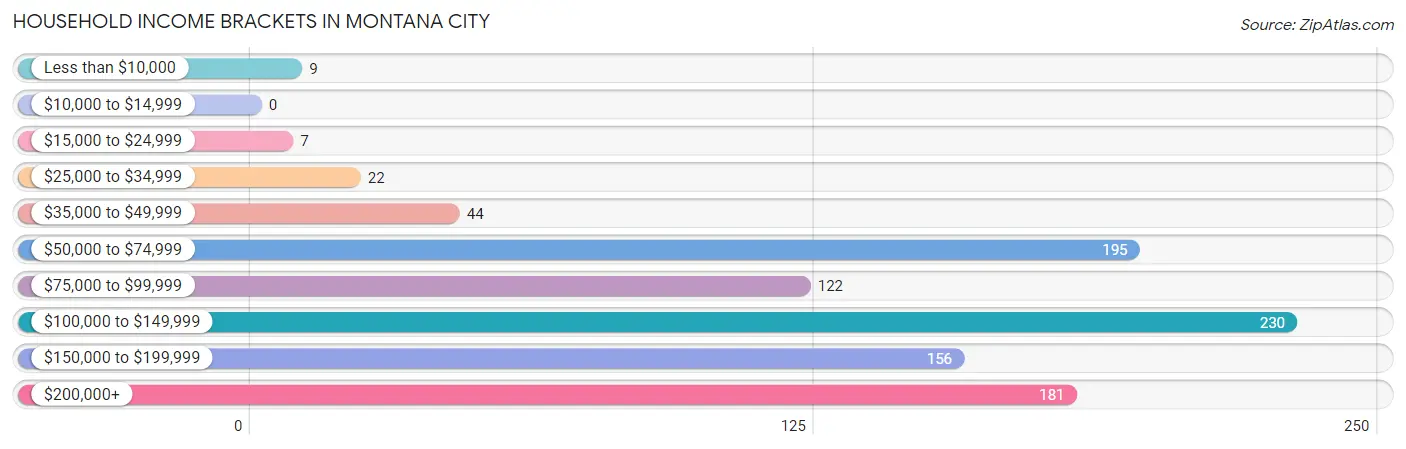
| Income Bracket | # Households | % Households |
| Less than $10,000 | 9 | 0.9% |
| $10,000 to $14,999 | 0 | 0.0% |
| $15,000 to $24,999 | 7 | 0.7% |
| $25,000 to $34,999 | 22 | 2.3% |
| $35,000 to $49,999 | 44 | 4.6% |
| $50,000 to $74,999 | 195 | 20.2% |
| $75,000 to $99,999 | 122 | 12.6% |
| $100,000 to $149,999 | 230 | 23.8% |
| $150,000 to $199,999 | 156 | 16.1% |
| $200,000+ | 181 | 18.7% |
Household Income by Householder Age in Montana City
The median household income in Montana City is $113,679, with the highest median household income of $143,036 found in the 45 to 64 years age bracket for the primary householder. A total of 384 households (39.8%) fall into this category. Meanwhile, the 15 to 24 years age bracket for the primary householder has the lowest median household income of $0, with 7 households (0.7%) in this group.
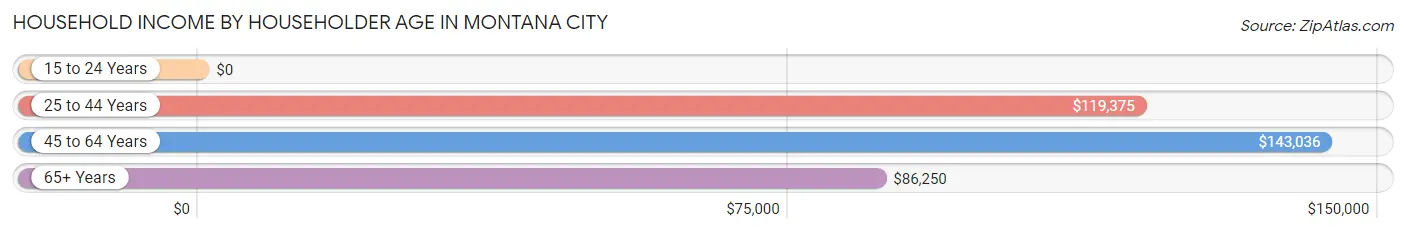
| Income Bracket | # Households | Median Income |
| 15 to 24 Years | 7 (0.7%) | $0 |
| 25 to 44 Years | 308 (31.9%) | $119,375 |
| 45 to 64 Years | 384 (39.8%) | $143,036 |
| 65+ Years | 267 (27.6%) | $86,250 |
| Total | 966 (100.0%) | $113,679 |
Poverty in Montana City
Income Below Poverty by Sex and Age in Montana City
With 1.0% poverty level for males and 5.0% for females among the residents of Montana City, 16 and 17 year old males and 12 to 14 year old females are the most vulnerable to poverty, with 8 males (14.3%) and 6 females (24.0%) in their respective age groups living below the poverty level.
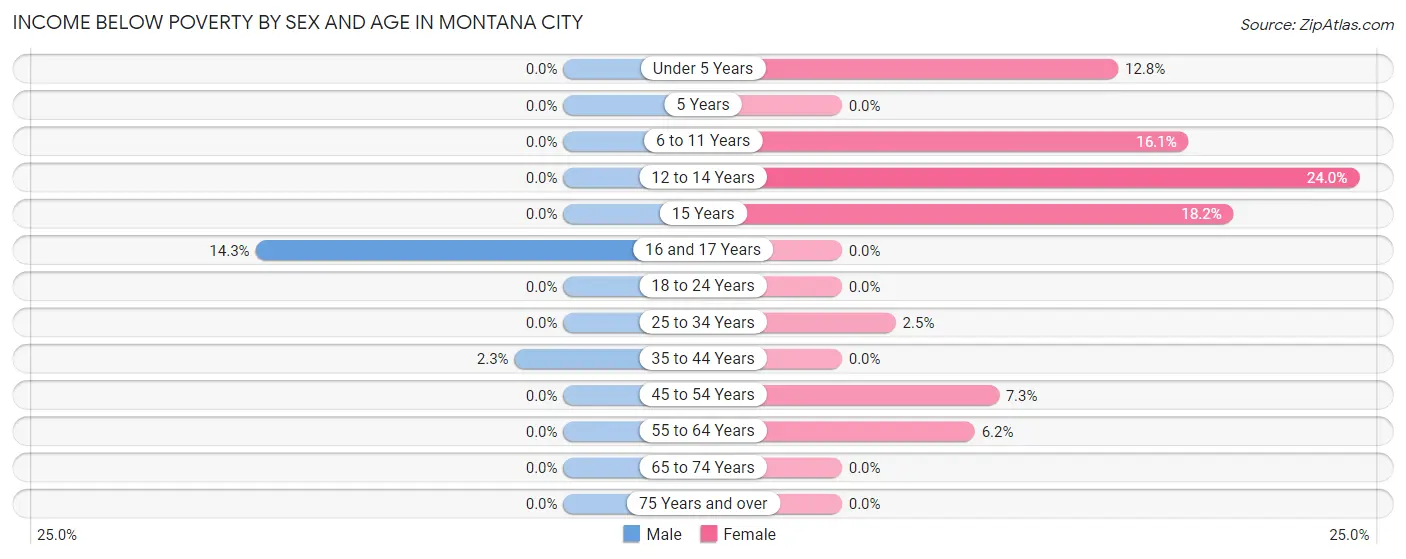
| Age Bracket | Male | Female |
| Under 5 Years | 0 (0.0%) | 5 (12.8%) |
| 5 Years | 0 (0.0%) | 0 (0.0%) |
| 6 to 11 Years | 0 (0.0%) | 14 (16.1%) |
| 12 to 14 Years | 0 (0.0%) | 6 (24.0%) |
| 15 Years | 0 (0.0%) | 8 (18.2%) |
| 16 and 17 Years | 8 (14.3%) | 0 (0.0%) |
| 18 to 24 Years | 0 (0.0%) | 0 (0.0%) |
| 25 to 34 Years | 0 (0.0%) | 4 (2.5%) |
| 35 to 44 Years | 5 (2.3%) | 0 (0.0%) |
| 45 to 54 Years | 0 (0.0%) | 15 (7.3%) |
| 55 to 64 Years | 0 (0.0%) | 15 (6.2%) |
| 65 to 74 Years | 0 (0.0%) | 0 (0.0%) |
| 75 Years and over | 0 (0.0%) | 0 (0.0%) |
| Total | 13 (1.0%) | 67 (5.0%) |
Income Above Poverty by Sex and Age in Montana City
According to the poverty statistics in Montana City, males aged under 5 years and females aged 5 years are the age groups that are most secure financially, with 100.0% of males and 100.0% of females in these age groups living above the poverty line.
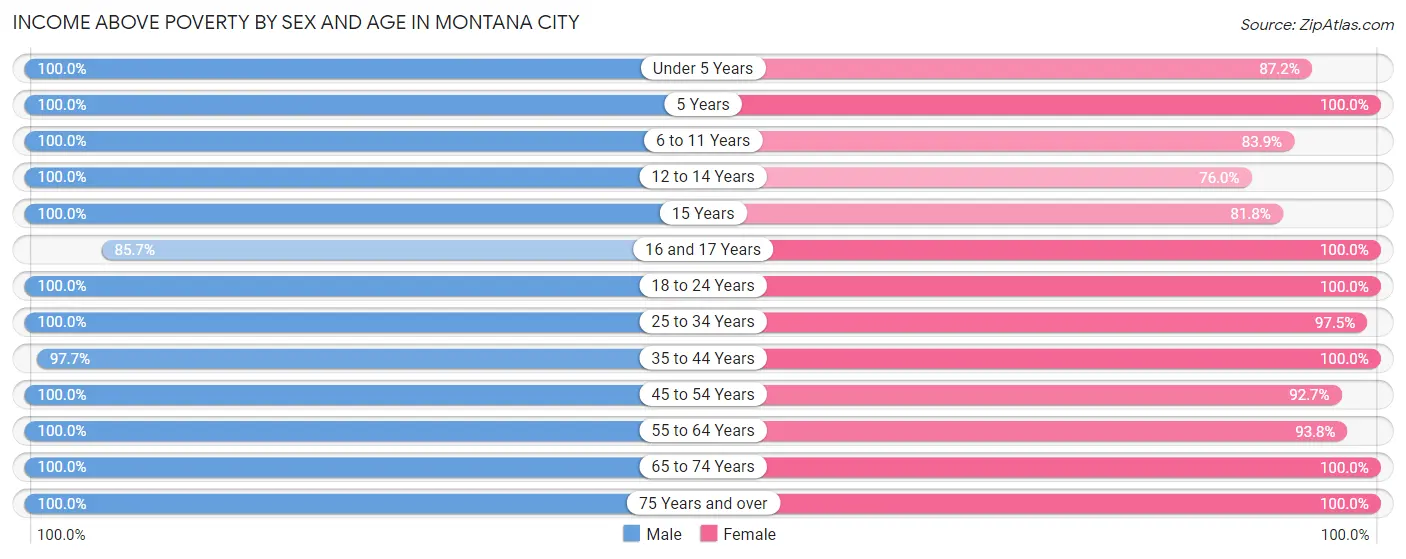
| Age Bracket | Male | Female |
| Under 5 Years | 80 (100.0%) | 34 (87.2%) |
| 5 Years | 26 (100.0%) | 14 (100.0%) |
| 6 to 11 Years | 111 (100.0%) | 73 (83.9%) |
| 12 to 14 Years | 75 (100.0%) | 19 (76.0%) |
| 15 Years | 6 (100.0%) | 36 (81.8%) |
| 16 and 17 Years | 48 (85.7%) | 55 (100.0%) |
| 18 to 24 Years | 57 (100.0%) | 34 (100.0%) |
| 25 to 34 Years | 77 (100.0%) | 156 (97.5%) |
| 35 to 44 Years | 215 (97.7%) | 202 (100.0%) |
| 45 to 54 Years | 184 (100.0%) | 191 (92.7%) |
| 55 to 64 Years | 188 (100.0%) | 228 (93.8%) |
| 65 to 74 Years | 170 (100.0%) | 152 (100.0%) |
| 75 Years and over | 81 (100.0%) | 88 (100.0%) |
| Total | 1,318 (99.0%) | 1,282 (95.0%) |
Income Below Poverty Among Married-Couple Families in Montana City
The poverty statistics for married-couple families in Montana City show that 0.7% or 5 of the total 756 families live below the poverty line. Families with 3 or 4 children have the highest poverty rate of 8.1%, comprising of 5 families. On the other hand, families with no children have the lowest poverty rate of 0.0%, which includes 0 families.
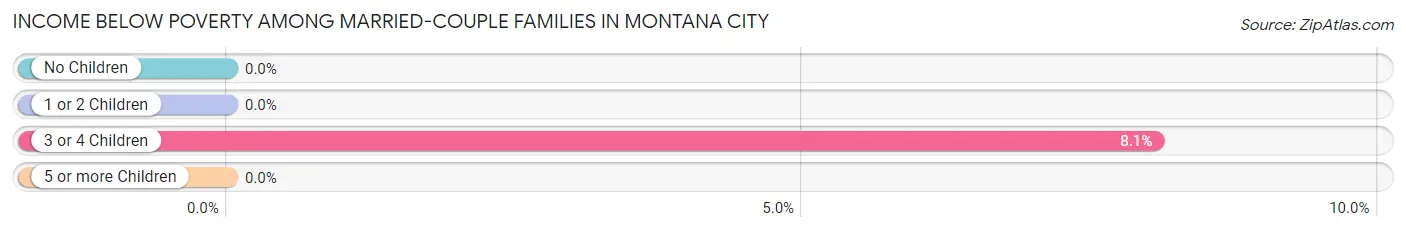
| Children | Above Poverty | Below Poverty |
| No Children | 462 (100.0%) | 0 (0.0%) |
| 1 or 2 Children | 232 (100.0%) | 0 (0.0%) |
| 3 or 4 Children | 57 (91.9%) | 5 (8.1%) |
| 5 or more Children | 0 (0.0%) | 0 (0.0%) |
| Total | 751 (99.3%) | 5 (0.7%) |
Income Below Poverty Among Single-Parent Households in Montana City
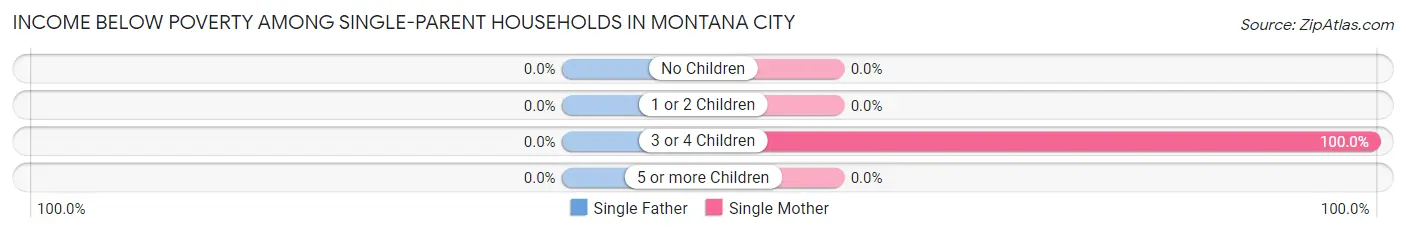
| Children | Single Father | Single Mother |
| No Children | 0 (0.0%) | 0 (0.0%) |
| 1 or 2 Children | 0 (0.0%) | 0 (0.0%) |
| 3 or 4 Children | 0 (0.0%) | 9 (100.0%) |
| 5 or more Children | 0 (0.0%) | 0 (0.0%) |
| Total | 0 (0.0%) | 9 (14.1%) |
Income Below Poverty Among Married-Couple vs Single-Parent Households in Montana City
The poverty data for Montana City shows that 5 of the married-couple family households (0.7%) and 9 of the single-parent households (10.7%) are living below the poverty level. Within the married-couple family households, those with 3 or 4 children have the highest poverty rate, with 5 households (8.1%) falling below the poverty line. Among the single-parent households, those with 3 or 4 children have the highest poverty rate, with 9 household (100.0%) living below poverty.
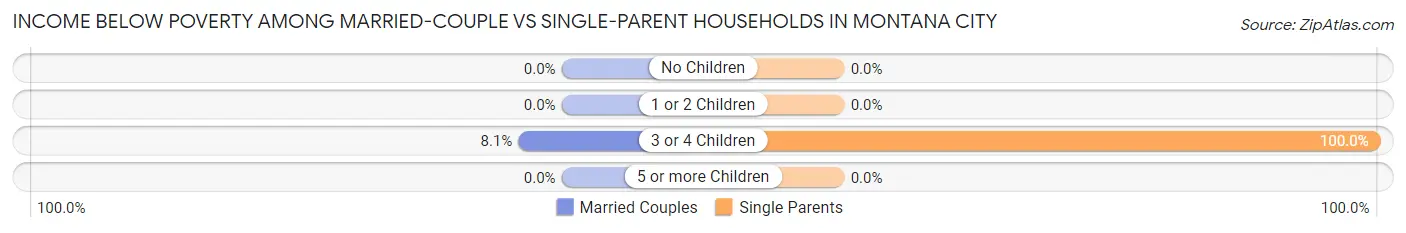
| Children | Married-Couple Families | Single-Parent Households |
| No Children | 0 (0.0%) | 0 (0.0%) |
| 1 or 2 Children | 0 (0.0%) | 0 (0.0%) |
| 3 or 4 Children | 5 (8.1%) | 9 (100.0%) |
| 5 or more Children | 0 (0.0%) | 0 (0.0%) |
| Total | 5 (0.7%) | 9 (10.7%) |
Race in Montana City
The most populous races in Montana City are White / Caucasian (2,565 | 94.4%), Two or more Races (76 | 2.8%), and Hispanic or Latino (53 | 1.9%).
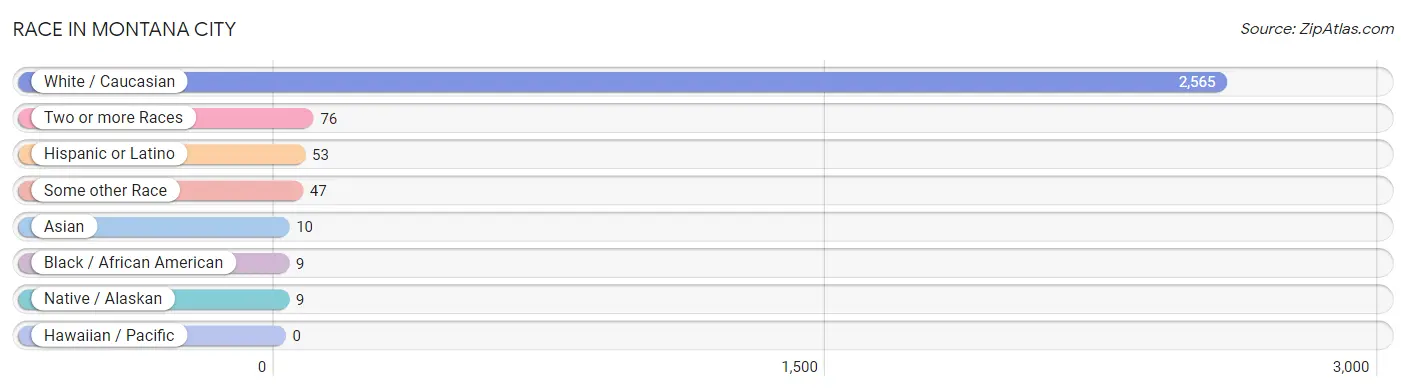
| Race | # Population | % Population |
| Asian | 10 | 0.4% |
| Black / African American | 9 | 0.3% |
| Hawaiian / Pacific | 0 | 0.0% |
| Hispanic or Latino | 53 | 1.9% |
| Native / Alaskan | 9 | 0.3% |
| White / Caucasian | 2,565 | 94.4% |
| Two or more Races | 76 | 2.8% |
| Some other Race | 47 | 1.7% |
| Total | 2,716 | 100.0% |
Ancestry in Montana City
The most populous ancestries reported in Montana City are German (689 | 25.4%), English (513 | 18.9%), Norwegian (333 | 12.3%), Irish (285 | 10.5%), and Italian (100 | 3.7%), together accounting for 70.7% of all Montana City residents.
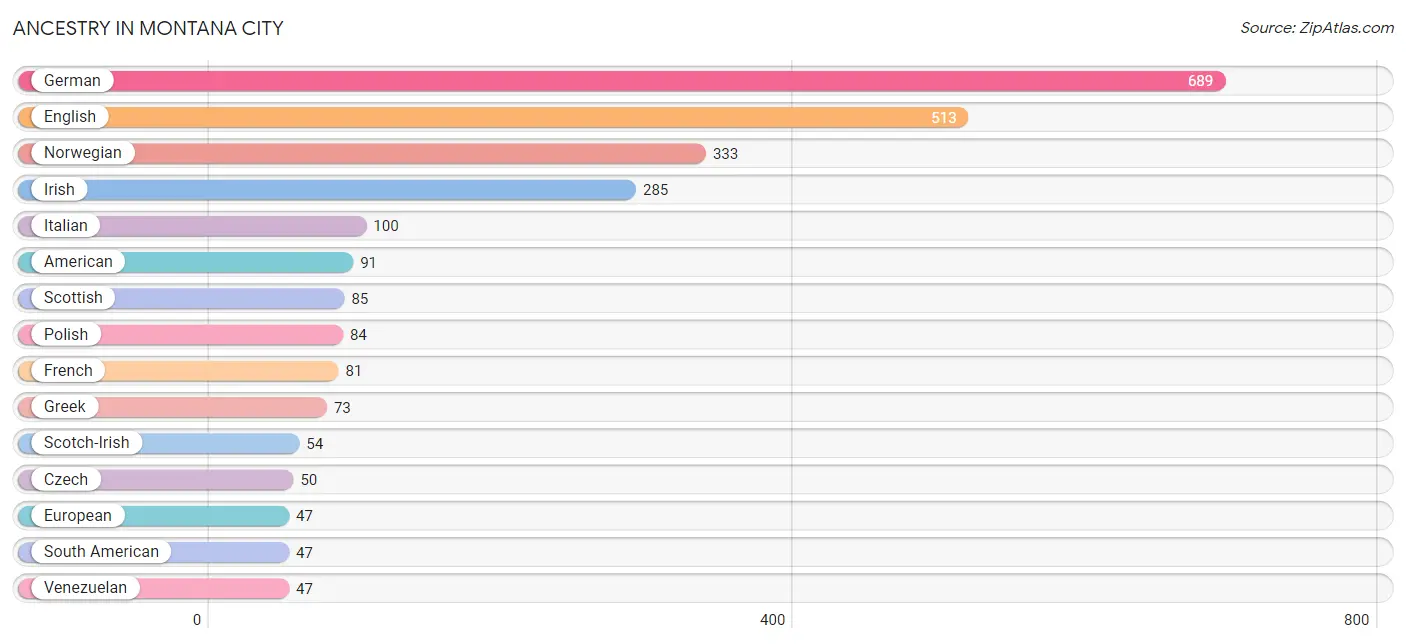
| Ancestry | # Population | % Population |
| American | 91 | 3.4% |
| Apache | 6 | 0.2% |
| Bhutanese | 18 | 0.7% |
| Blackfeet | 3 | 0.1% |
| British | 7 | 0.3% |
| Burmese | 11 | 0.4% |
| Cherokee | 9 | 0.3% |
| Cheyenne | 9 | 0.3% |
| Chippewa | 9 | 0.3% |
| Croatian | 13 | 0.5% |
| Czech | 50 | 1.8% |
| Danish | 42 | 1.5% |
| Dutch | 43 | 1.6% |
| Eastern European | 5 | 0.2% |
| English | 513 | 18.9% |
| Ethiopian | 9 | 0.3% |
| European | 47 | 1.7% |
| Finnish | 17 | 0.6% |
| French | 81 | 3.0% |
| French American Indian | 2 | 0.1% |
| French Canadian | 8 | 0.3% |
| German | 689 | 25.4% |
| Greek | 73 | 2.7% |
| Hungarian | 13 | 0.5% |
| Indian (Asian) | 4 | 0.2% |
| Irish | 285 | 10.5% |
| Italian | 100 | 3.7% |
| Lithuanian | 3 | 0.1% |
| Native Hawaiian | 4 | 0.2% |
| Northern European | 8 | 0.3% |
| Norwegian | 333 | 12.3% |
| Polish | 84 | 3.1% |
| Romanian | 6 | 0.2% |
| Russian | 5 | 0.2% |
| Scandinavian | 27 | 1.0% |
| Scotch-Irish | 54 | 2.0% |
| Scottish | 85 | 3.1% |
| Slavic | 1 | 0.0% |
| Slovene | 17 | 0.6% |
| South American | 47 | 1.7% |
| Spanish | 6 | 0.2% |
| Subsaharan African | 9 | 0.3% |
| Swedish | 45 | 1.7% |
| Swiss | 11 | 0.4% |
| Venezuelan | 47 | 1.7% |
| Welsh | 8 | 0.3% | View All 46 Rows |
Immigrants in Montana City
The most numerous immigrant groups reported in Montana City came from Canada (70 | 2.6%), Europe (25 | 0.9%), England (15 | 0.5%), Northern Europe (15 | 0.5%), and Latin America (10 | 0.4%), together accounting for 5.0% of all Montana City residents.
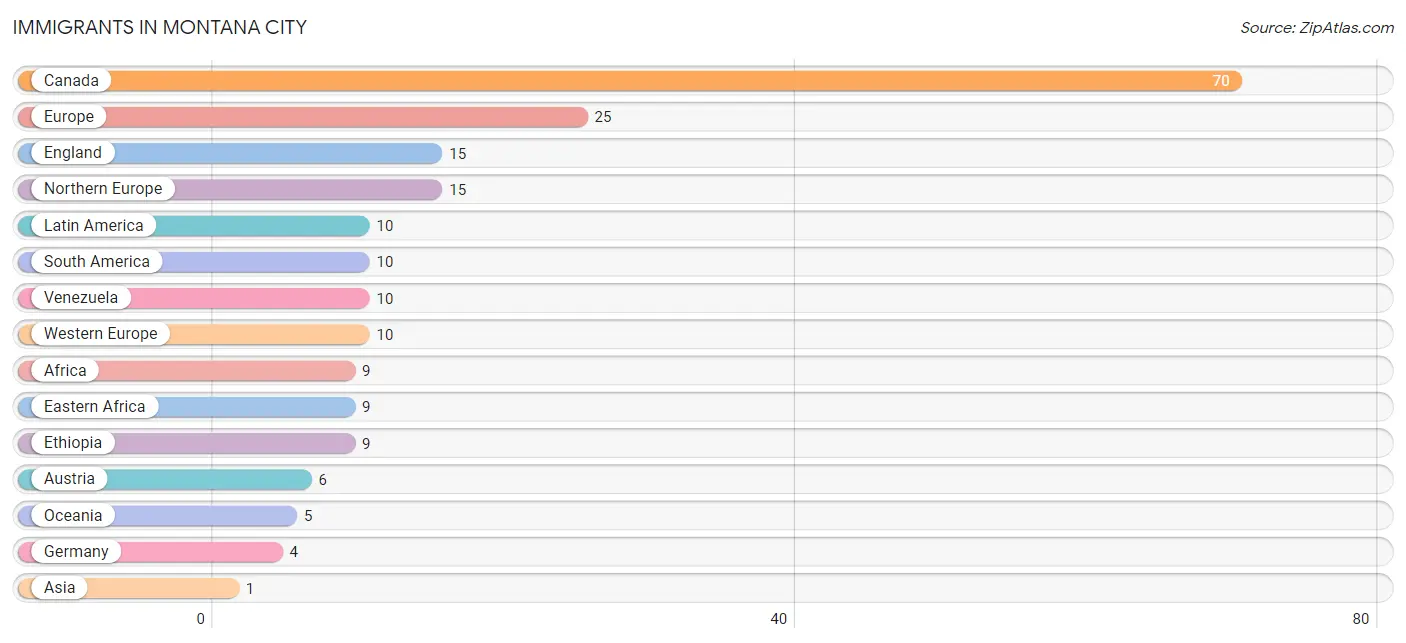
| Immigration Origin | # Population | % Population |
| Africa | 9 | 0.3% |
| Asia | 1 | 0.0% |
| Austria | 6 | 0.2% |
| Canada | 70 | 2.6% |
| Eastern Africa | 9 | 0.3% |
| Eastern Asia | 1 | 0.0% |
| England | 15 | 0.5% |
| Ethiopia | 9 | 0.3% |
| Europe | 25 | 0.9% |
| Germany | 4 | 0.2% |
| Japan | 1 | 0.0% |
| Latin America | 10 | 0.4% |
| Northern Europe | 15 | 0.5% |
| Oceania | 5 | 0.2% |
| South America | 10 | 0.4% |
| Venezuela | 10 | 0.4% |
| Western Europe | 10 | 0.4% | View All 17 Rows |
Sex and Age in Montana City
Sex and Age in Montana City
The most populous age groups in Montana City are 10 to 14 Years (145 | 10.9%) for men and 40 to 44 Years (133 | 9.6%) for women.
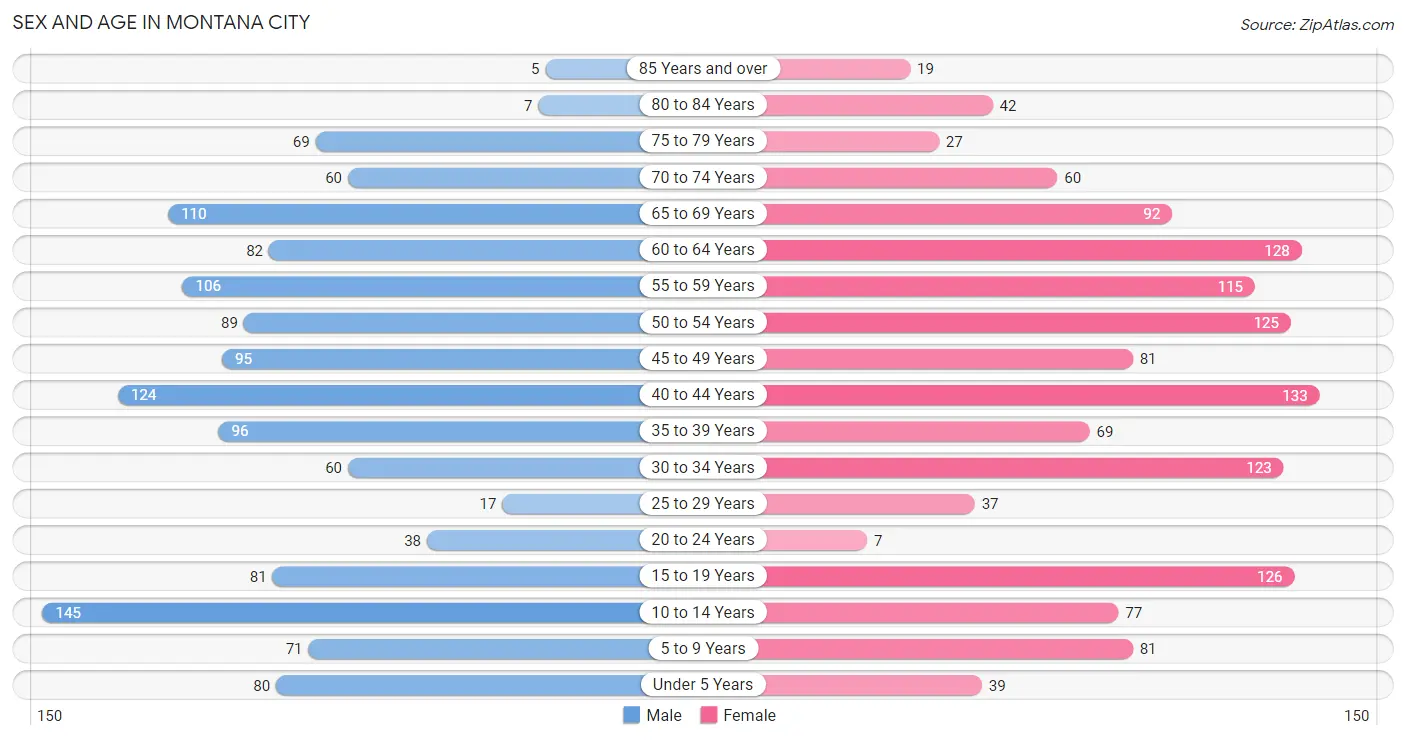
| Age Bracket | Male | Female |
| Under 5 Years | 80 (6.0%) | 39 (2.8%) |
| 5 to 9 Years | 71 (5.3%) | 81 (5.9%) |
| 10 to 14 Years | 145 (10.9%) | 77 (5.6%) |
| 15 to 19 Years | 81 (6.1%) | 126 (9.1%) |
| 20 to 24 Years | 38 (2.9%) | 7 (0.5%) |
| 25 to 29 Years | 17 (1.3%) | 37 (2.7%) |
| 30 to 34 Years | 60 (4.5%) | 123 (8.9%) |
| 35 to 39 Years | 96 (7.2%) | 69 (5.0%) |
| 40 to 44 Years | 124 (9.3%) | 133 (9.6%) |
| 45 to 49 Years | 95 (7.1%) | 81 (5.9%) |
| 50 to 54 Years | 89 (6.7%) | 125 (9.0%) |
| 55 to 59 Years | 106 (7.9%) | 115 (8.3%) |
| 60 to 64 Years | 82 (6.1%) | 128 (9.3%) |
| 65 to 69 Years | 110 (8.2%) | 92 (6.7%) |
| 70 to 74 Years | 60 (4.5%) | 60 (4.3%) |
| 75 to 79 Years | 69 (5.2%) | 27 (2.0%) |
| 80 to 84 Years | 7 (0.5%) | 42 (3.0%) |
| 85 Years and over | 5 (0.4%) | 19 (1.4%) |
| Total | 1,335 (100.0%) | 1,381 (100.0%) |
Families and Households in Montana City
Median Family Size in Montana City
The median family size in Montana City is 2.92 persons per family, with single female/mother families (64 | 7.6%) accounting for the largest median family size of 3.47 persons per family. On the other hand, single male/father families (20 | 2.4%) represent the smallest median family size with 2.60 persons per family.
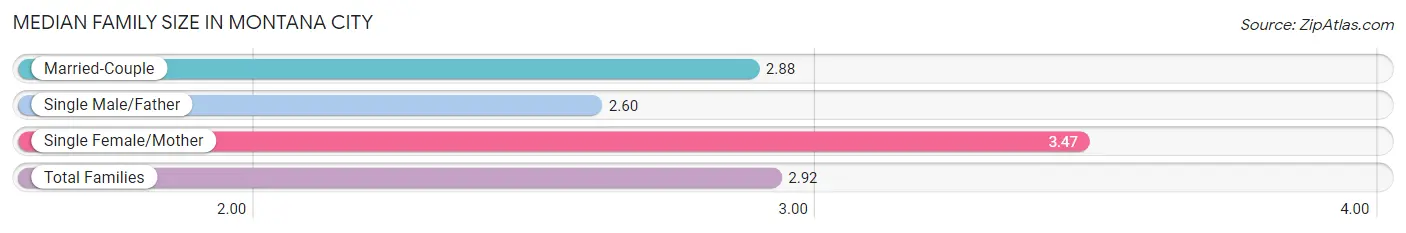
| Family Type | # Families | Family Size |
| Married-Couple | 756 (90.0%) | 2.88 |
| Single Male/Father | 20 (2.4%) | 2.60 |
| Single Female/Mother | 64 (7.6%) | 3.47 |
| Total Families | 840 (100.0%) | 2.92 |
Median Household Size in Montana City
The median household size in Montana City is 2.81 persons per household, with single female/mother households (64 | 6.6%) accounting for the largest median household size of 3.61 persons per household. non-family households (126 | 13.0%) represent the smallest median household size with 1.77 persons per household.
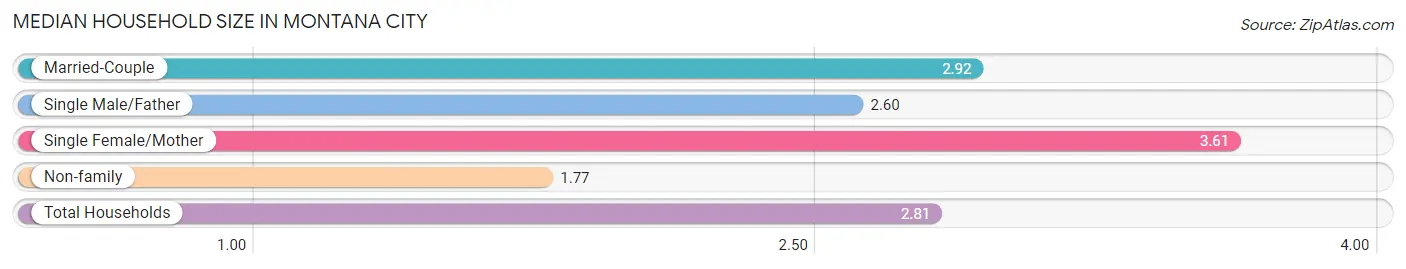
| Household Type | # Households | Household Size |
| Married-Couple | 756 (78.3%) | 2.92 |
| Single Male/Father | 20 (2.1%) | 2.60 |
| Single Female/Mother | 64 (6.6%) | 3.61 |
| Non-family | 126 (13.0%) | 1.77 |
| Total Households | 966 (100.0%) | 2.81 |
Household Size by Marriage Status in Montana City
Out of a total of 966 households in Montana City, 840 (87.0%) are family households, while 126 (13.0%) are nonfamily households. The most numerous type of family households are 2-person households, comprising 387, and the most common type of nonfamily households are 1-person households, comprising 61.
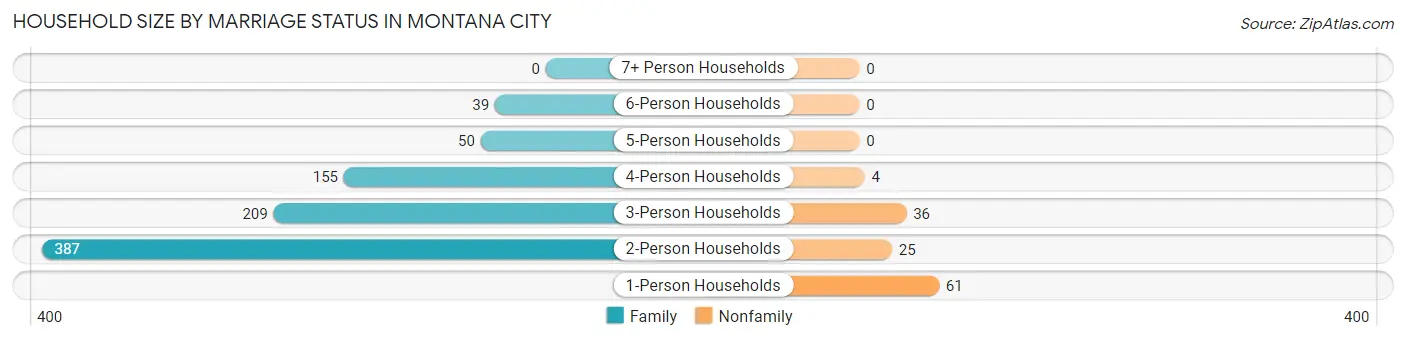
| Household Size | Family Households | Nonfamily Households |
| 1-Person Households | - | 61 (6.3%) |
| 2-Person Households | 387 (40.1%) | 25 (2.6%) |
| 3-Person Households | 209 (21.6%) | 36 (3.7%) |
| 4-Person Households | 155 (16.1%) | 4 (0.4%) |
| 5-Person Households | 50 (5.2%) | 0 (0.0%) |
| 6-Person Households | 39 (4.0%) | 0 (0.0%) |
| 7+ Person Households | 0 (0.0%) | 0 (0.0%) |
| Total | 840 (87.0%) | 126 (13.0%) |
Female Fertility in Montana City
Fertility by Age in Montana City
Average fertility rate in Montana City is 24.0 births per 1,000 women. Women in the age bracket of 20 to 34 years have the highest fertility rate with 90.0 births per 1,000 women. Women in the age bracket of 20 to 34 years acount for 100.0% of all women with births.
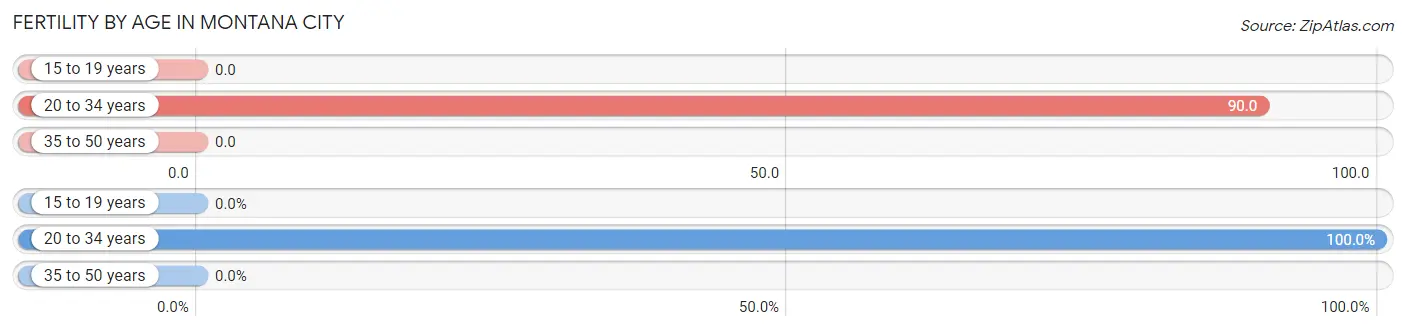
| Age Bracket | Women with Births | Births / 1,000 Women |
| 15 to 19 years | 0 (0.0%) | 0.0 |
| 20 to 34 years | 15 (100.0%) | 90.0 |
| 35 to 50 years | 0 (0.0%) | 0.0 |
| Total | 15 (100.0%) | 24.0 |
Fertility by Age by Marriage Status in Montana City
20.0% of women with births (15) in Montana City are married. The highest percentage of unmarried women with births falls into 20 to 34 years age bracket with 80.0% of them unmarried at the time of birth, while the lowest percentage of unmarried women with births belong to 20 to 34 years age bracket with 80.0% of them unmarried.
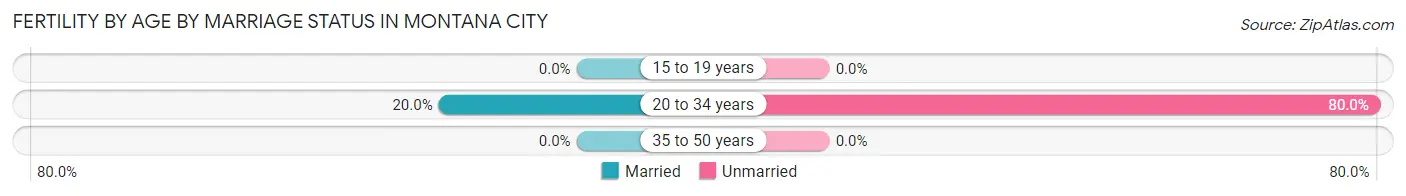
| Age Bracket | Married | Unmarried |
| 15 to 19 years | 0 (0.0%) | 0 (0.0%) |
| 20 to 34 years | 3 (20.0%) | 12 (80.0%) |
| 35 to 50 years | 0 (0.0%) | 0 (0.0%) |
| Total | 3 (20.0%) | 12 (80.0%) |
Fertility by Education in Montana City
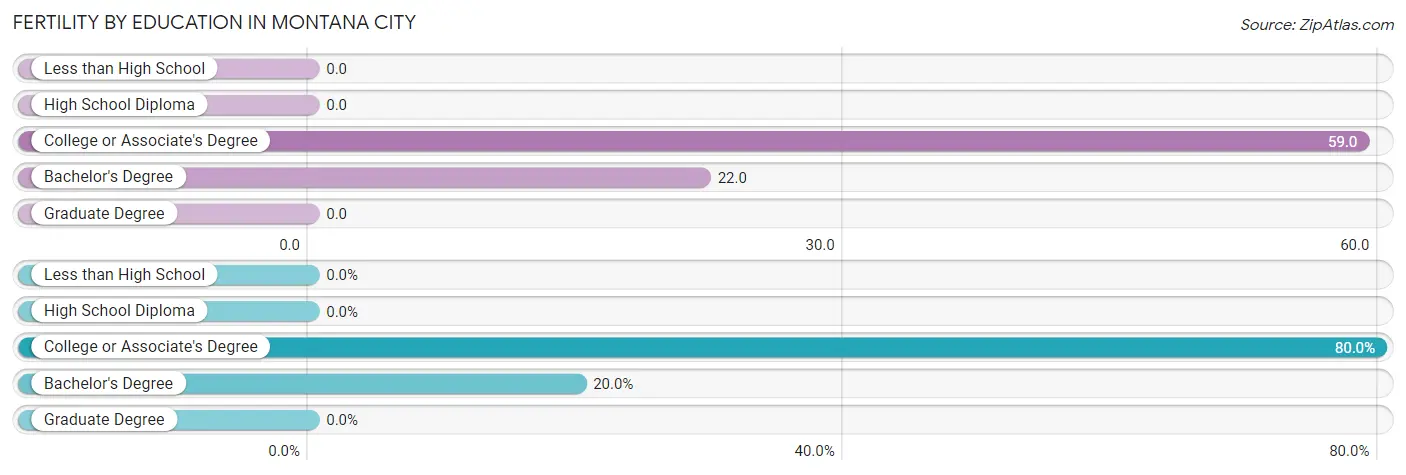
| Educational Attainment | Women with Births | Births / 1,000 Women |
| Less than High School | 0 (0.0%) | 0.0 |
| High School Diploma | 0 (0.0%) | 0.0 |
| College or Associate's Degree | 12 (80.0%) | 59.0 |
| Bachelor's Degree | 3 (20.0%) | 22.0 |
| Graduate Degree | 0 (0.0%) | 0.0 |
| Total | 15 (100.0%) | 24.0 |
Fertility by Education by Marriage Status in Montana City
80.0% of women with births in Montana City are unmarried. Women with the educational attainment of bachelor's degree are most likely to be married with 100.0% of them married at childbirth, while women with the educational attainment of college or associate's degree are least likely to be married with 100.0% of them unmarried at childbirth.
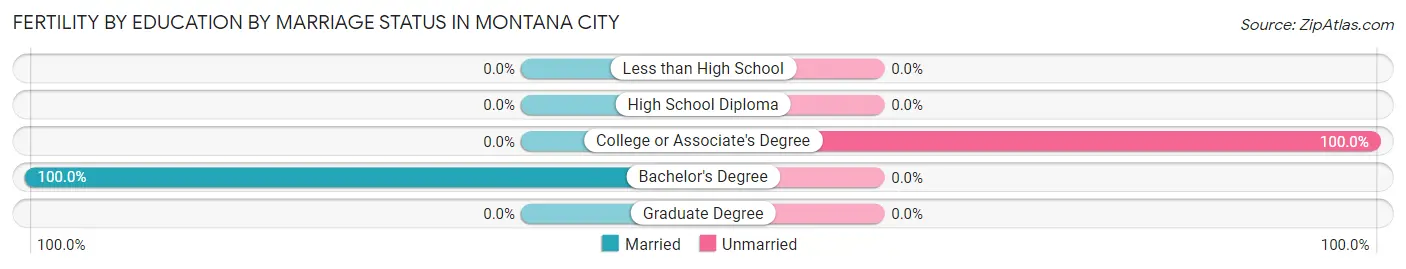
| Educational Attainment | Married | Unmarried |
| Less than High School | 0 (0.0%) | 0 (0.0%) |
| High School Diploma | 0 (0.0%) | 0 (0.0%) |
| College or Associate's Degree | 0 (0.0%) | 12 (100.0%) |
| Bachelor's Degree | 3 (100.0%) | 0 (0.0%) |
| Graduate Degree | 0 (0.0%) | 0 (0.0%) |
| Total | 3 (20.0%) | 12 (80.0%) |
Employment Characteristics in Montana City
Employment by Class of Employer in Montana City
Among the 1,398 employed individuals in Montana City, private company employees (594 | 42.5%), state government employees (239 | 17.1%), and not-for-profit organizations (172 | 12.3%) make up the most common classes of employment.
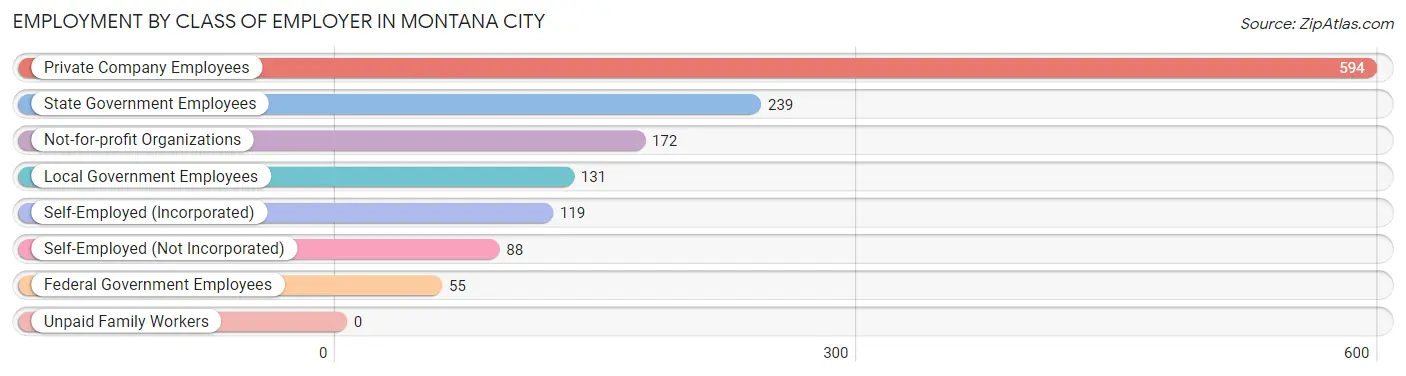
| Employer Class | # Employees | % Employees |
| Private Company Employees | 594 | 42.5% |
| Self-Employed (Incorporated) | 119 | 8.5% |
| Self-Employed (Not Incorporated) | 88 | 6.3% |
| Not-for-profit Organizations | 172 | 12.3% |
| Local Government Employees | 131 | 9.4% |
| State Government Employees | 239 | 17.1% |
| Federal Government Employees | 55 | 3.9% |
| Unpaid Family Workers | 0 | 0.0% |
| Total | 1,398 | 100.0% |
Employment Status by Age in Montana City
According to the labor force statistics for Montana City, out of the total population over 16 years of age (2,173), 67.9% or 1,475 individuals are in the labor force, with 2.2% or 32 of them unemployed. The age group with the highest labor force participation rate is 30 to 34 years, with 100.0% or 183 individuals in the labor force. Within the labor force, the 25 to 29 years age range has the highest percentage of unemployed individuals, with 10.0% or 5 of them being unemployed.
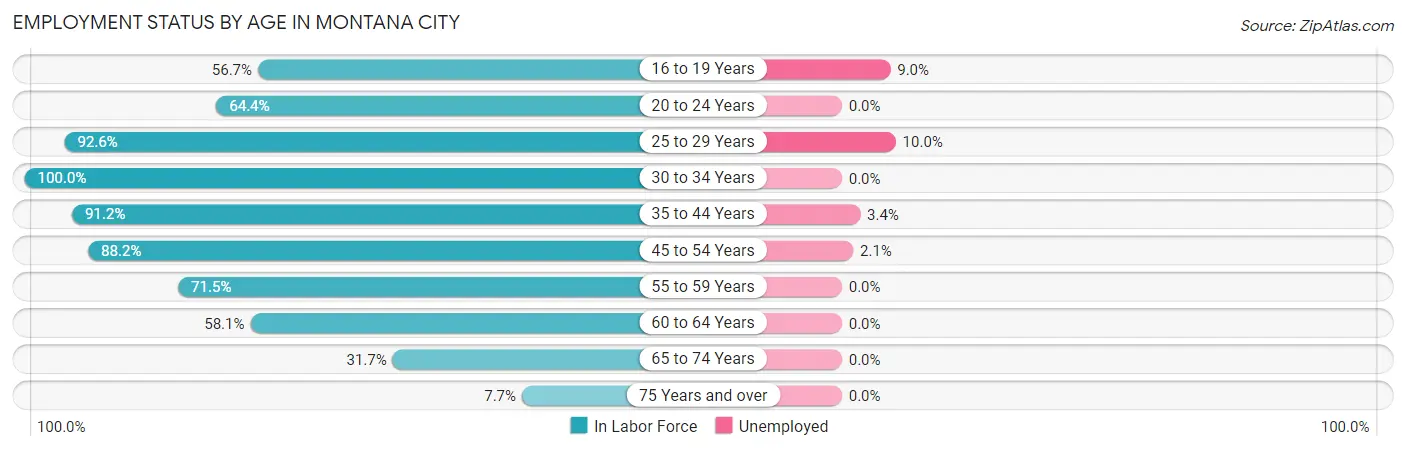
| Age Bracket | In Labor Force | Unemployed |
| 16 to 19 Years | 89 (56.7%) | 8 (9.0%) |
| 20 to 24 Years | 29 (64.4%) | 0 (0.0%) |
| 25 to 29 Years | 50 (92.6%) | 5 (10.0%) |
| 30 to 34 Years | 183 (100.0%) | 0 (0.0%) |
| 35 to 44 Years | 385 (91.2%) | 13 (3.4%) |
| 45 to 54 Years | 344 (88.2%) | 7 (2.1%) |
| 55 to 59 Years | 158 (71.5%) | 0 (0.0%) |
| 60 to 64 Years | 122 (58.1%) | 0 (0.0%) |
| 65 to 74 Years | 102 (31.7%) | 0 (0.0%) |
| 75 Years and over | 13 (7.7%) | 0 (0.0%) |
| Total | 1,475 (67.9%) | 32 (2.2%) |
Employment Status by Educational Attainment in Montana City
According to labor force statistics for Montana City, 83.9% of individuals (1,242) out of the total population between 25 and 64 years of age (1,480) are in the labor force, with 2.0% or 25 of them being unemployed. The group with the highest labor force participation rate are those with the educational attainment of bachelor's degree or higher, with 86.6% or 601 individuals in the labor force. Within the labor force, individuals with college / associate degree education have the highest percentage of unemployment, with 4.6% or 18 of them being unemployed.
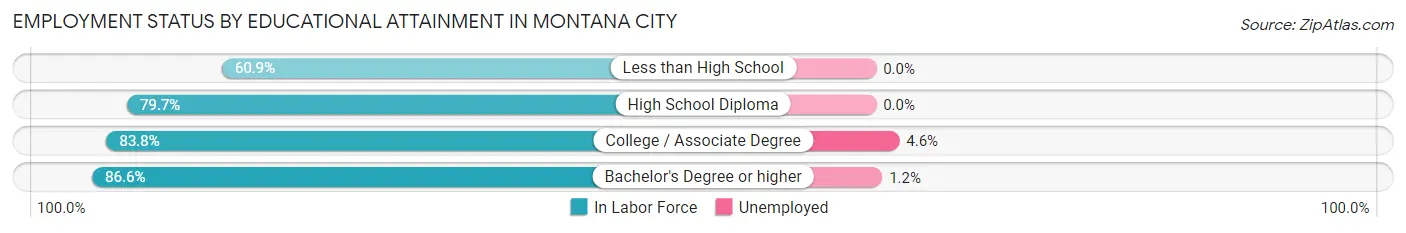
| Educational Attainment | In Labor Force | Unemployed |
| Less than High School | 14 (60.9%) | 0 (0.0%) |
| High School Diploma | 235 (79.7%) | 0 (0.0%) |
| College / Associate Degree | 392 (83.8%) | 22 (4.6%) |
| Bachelor's Degree or higher | 601 (86.6%) | 8 (1.2%) |
| Total | 1,242 (83.9%) | 30 (2.0%) |
Employment Occupations by Sex in Montana City
Management, Business, Science and Arts Occupations
The most common Management, Business, Science and Arts occupations in Montana City are Community & Social Service (194 | 13.5%), Management (184 | 12.8%), Health Diagnosing & Treating (178 | 12.4%), Computers, Engineering & Science (117 | 8.1%), and Education Instruction & Library (117 | 8.1%).
Management, Business, Science and Arts Occupations by Sex
Within the Management, Business, Science and Arts occupations in Montana City, the most male-oriented occupations are Life, Physical & Social Science (100.0%), Computers & Mathematics (84.3%), and Computers, Engineering & Science (82.9%), while the most female-oriented occupations are Education Instruction & Library (100.0%), Arts, Media & Entertainment (100.0%), and Community & Social Service (84.0%).
| Occupation | Male | Female |
| Management | 71 (38.6%) | 113 (61.4%) |
| Business & Financial | 44 (46.8%) | 50 (53.2%) |
| Computers, Engineering & Science | 97 (82.9%) | 20 (17.1%) |
| Computers & Mathematics | 59 (84.3%) | 11 (15.7%) |
| Architecture & Engineering | 23 (71.9%) | 9 (28.1%) |
| Life, Physical & Social Science | 15 (100.0%) | 0 (0.0%) |
| Community & Social Service | 31 (16.0%) | 163 (84.0%) |
| Education, Arts & Media | 4 (19.1%) | 17 (80.9%) |
| Legal Services & Support | 27 (69.2%) | 12 (30.8%) |
| Education Instruction & Library | 0 (0.0%) | 117 (100.0%) |
| Arts, Media & Entertainment | 0 (0.0%) | 17 (100.0%) |
| Health Diagnosing & Treating | 43 (24.2%) | 135 (75.8%) |
| Health Technologists | 37 (35.9%) | 66 (64.1%) |
| Total (Category) | 286 (37.3%) | 481 (62.7%) |
| Total (Overall) | 691 (48.1%) | 746 (51.9%) |
Services Occupations
The most common Services occupations in Montana City are Food Preparation & Serving (51 | 3.5%), Personal Care & Service (44 | 3.1%), Security & Protection (23 | 1.6%), Cleaning & Maintenance (20 | 1.4%), and Healthcare Support (18 | 1.3%).
Services Occupations by Sex
Within the Services occupations in Montana City, the most male-oriented occupations are Security & Protection (100.0%), Firefighting & Prevention (100.0%), and Law Enforcement (100.0%), while the most female-oriented occupations are Food Preparation & Serving (100.0%), Personal Care & Service (56.8%), and Healthcare Support (55.6%).
| Occupation | Male | Female |
| Healthcare Support | 8 (44.4%) | 10 (55.6%) |
| Security & Protection | 23 (100.0%) | 0 (0.0%) |
| Firefighting & Prevention | 6 (100.0%) | 0 (0.0%) |
| Law Enforcement | 17 (100.0%) | 0 (0.0%) |
| Food Preparation & Serving | 0 (0.0%) | 51 (100.0%) |
| Cleaning & Maintenance | 12 (60.0%) | 8 (40.0%) |
| Personal Care & Service | 19 (43.2%) | 25 (56.8%) |
| Total (Category) | 62 (39.7%) | 94 (60.3%) |
| Total (Overall) | 691 (48.1%) | 746 (51.9%) |
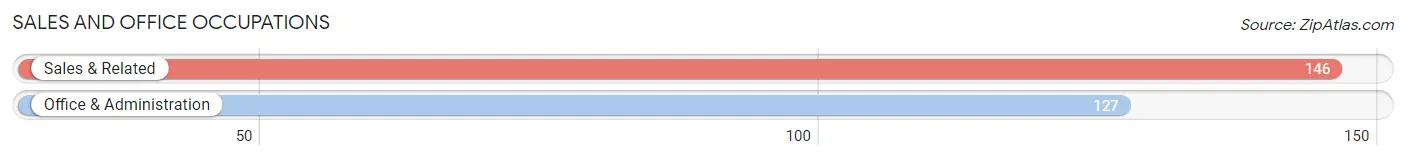
Sales and Office Occupations
The most common Sales and Office occupations in Montana City are Sales & Related (146 | 10.2%), and Office & Administration (127 | 8.8%).
Sales and Office Occupations by Sex
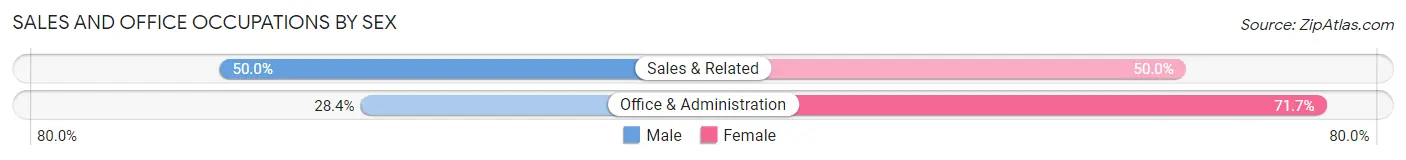
| Occupation | Male | Female |
| Sales & Related | 73 (50.0%) | 73 (50.0%) |
| Office & Administration | 36 (28.3%) | 91 (71.7%) |
| Total (Category) | 109 (39.9%) | 164 (60.1%) |
| Total (Overall) | 691 (48.1%) | 746 (51.9%) |
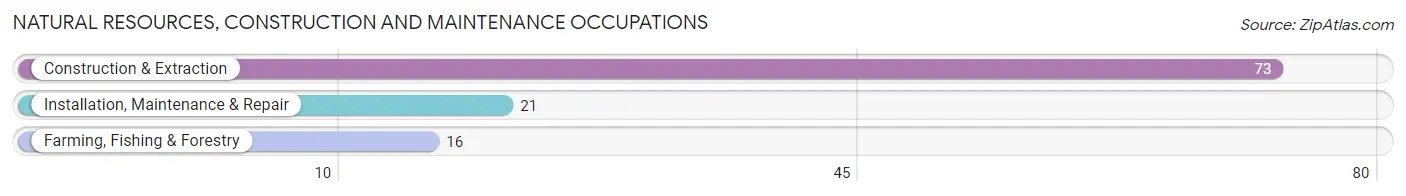
Natural Resources, Construction and Maintenance Occupations
The most common Natural Resources, Construction and Maintenance occupations in Montana City are Construction & Extraction (73 | 5.1%), Installation, Maintenance & Repair (21 | 1.5%), and Farming, Fishing & Forestry (16 | 1.1%).
Natural Resources, Construction and Maintenance Occupations by Sex
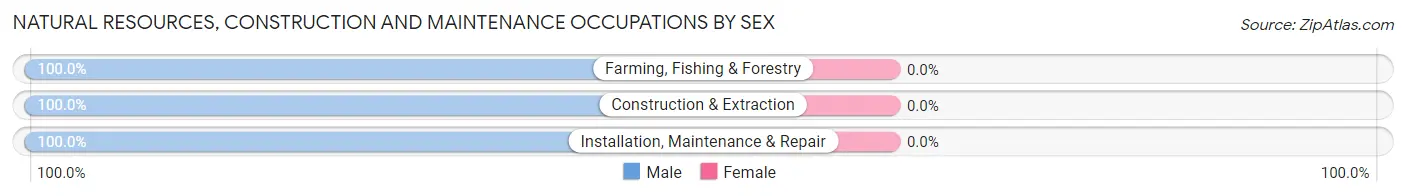
| Occupation | Male | Female |
| Farming, Fishing & Forestry | 16 (100.0%) | 0 (0.0%) |
| Construction & Extraction | 73 (100.0%) | 0 (0.0%) |
| Installation, Maintenance & Repair | 21 (100.0%) | 0 (0.0%) |
| Total (Category) | 110 (100.0%) | 0 (0.0%) |
| Total (Overall) | 691 (48.1%) | 746 (51.9%) |
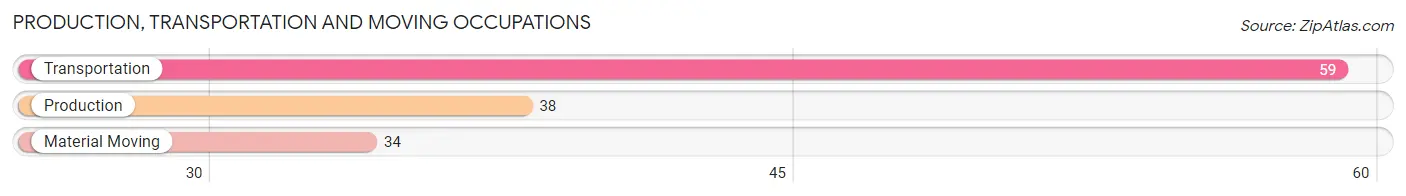
Production, Transportation and Moving Occupations
The most common Production, Transportation and Moving occupations in Montana City are Transportation (59 | 4.1%), Production (38 | 2.6%), and Material Moving (34 | 2.4%).
Production, Transportation and Moving Occupations by Sex
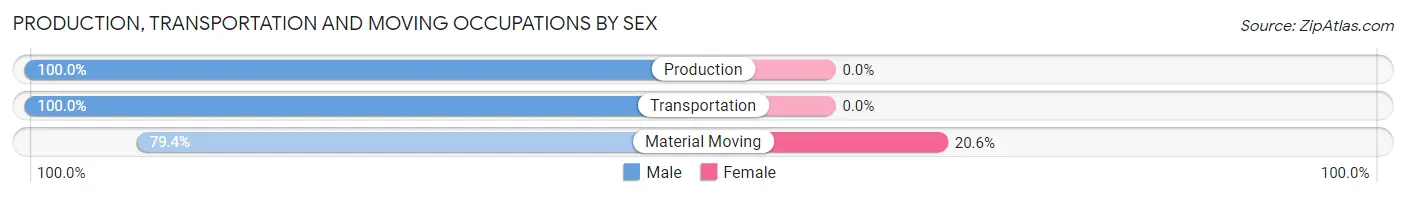
| Occupation | Male | Female |
| Production | 38 (100.0%) | 0 (0.0%) |
| Transportation | 59 (100.0%) | 0 (0.0%) |
| Material Moving | 27 (79.4%) | 7 (20.6%) |
| Total (Category) | 124 (94.7%) | 7 (5.3%) |
| Total (Overall) | 691 (48.1%) | 746 (51.9%) |
Employment Industries by Sex in Montana City
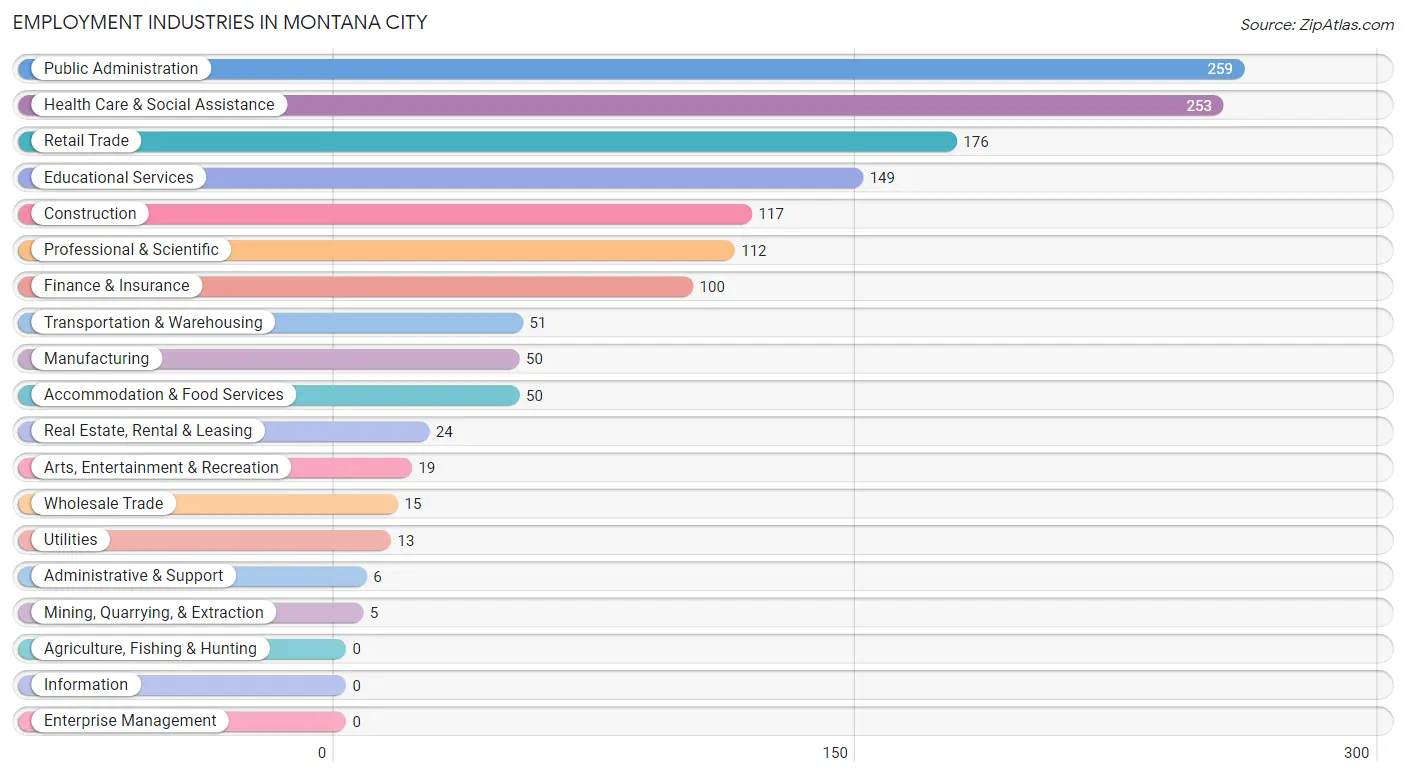
Employment Industries in Montana City
The major employment industries in Montana City include Public Administration (259 | 18.0%), Health Care & Social Assistance (253 | 17.6%), Retail Trade (176 | 12.2%), Educational Services (149 | 10.4%), and Construction (117 | 8.1%).
Employment Industries by Sex in Montana City
The Montana City industries that see more men than women are Mining, Quarrying, & Extraction (100.0%), Wholesale Trade (100.0%), and Transportation & Warehousing (100.0%), whereas the industries that tend to have a higher number of women are Administrative & Support (100.0%), Accommodation & Food Services (100.0%), and Finance & Insurance (92.0%).
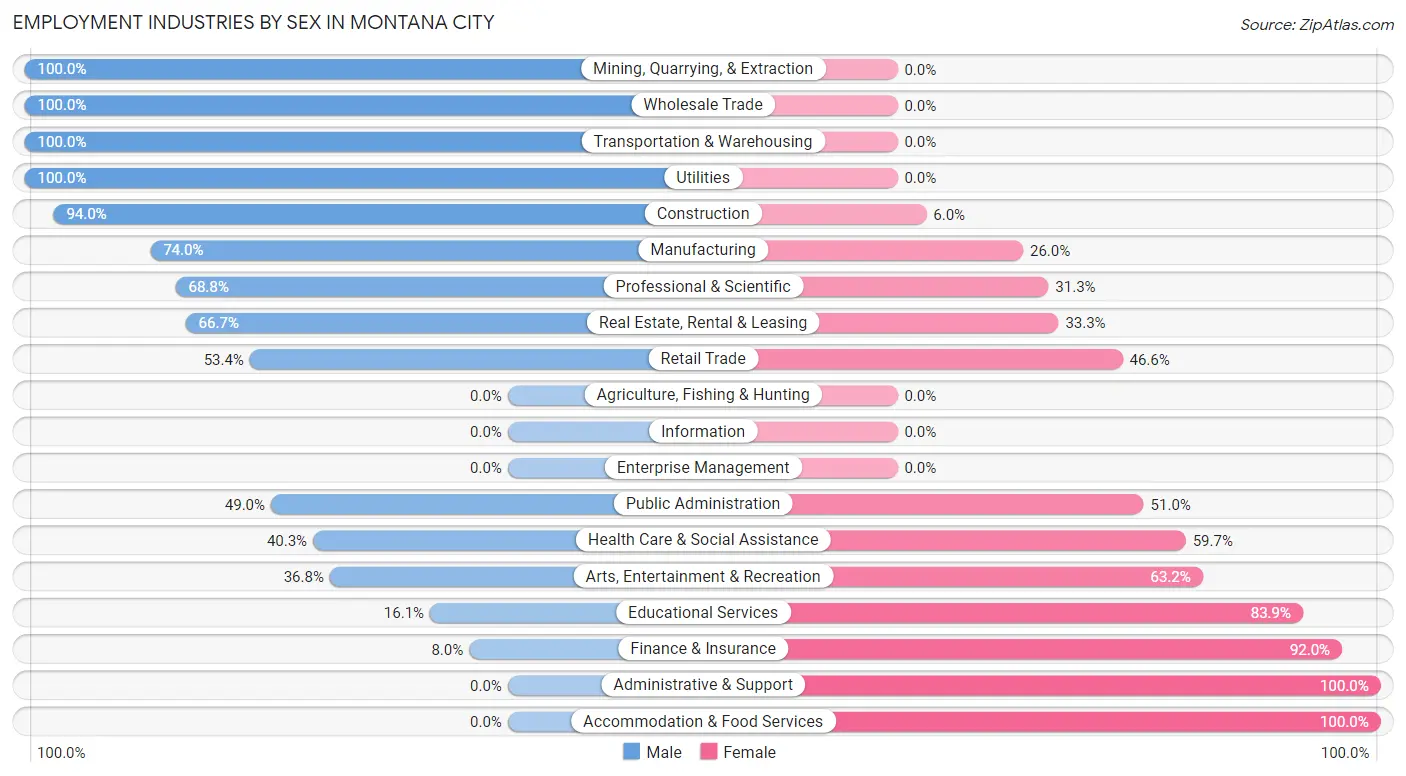
| Industry | Male | Female |
| Agriculture, Fishing & Hunting | 0 (0.0%) | 0 (0.0%) |
| Mining, Quarrying, & Extraction | 5 (100.0%) | 0 (0.0%) |
| Construction | 110 (94.0%) | 7 (6.0%) |
| Manufacturing | 37 (74.0%) | 13 (26.0%) |
| Wholesale Trade | 15 (100.0%) | 0 (0.0%) |
| Retail Trade | 94 (53.4%) | 82 (46.6%) |
| Transportation & Warehousing | 51 (100.0%) | 0 (0.0%) |
| Utilities | 13 (100.0%) | 0 (0.0%) |
| Information | 0 (0.0%) | 0 (0.0%) |
| Finance & Insurance | 8 (8.0%) | 92 (92.0%) |
| Real Estate, Rental & Leasing | 16 (66.7%) | 8 (33.3%) |
| Professional & Scientific | 77 (68.8%) | 35 (31.2%) |
| Enterprise Management | 0 (0.0%) | 0 (0.0%) |
| Administrative & Support | 0 (0.0%) | 6 (100.0%) |
| Educational Services | 24 (16.1%) | 125 (83.9%) |
| Health Care & Social Assistance | 102 (40.3%) | 151 (59.7%) |
| Arts, Entertainment & Recreation | 7 (36.8%) | 12 (63.2%) |
| Accommodation & Food Services | 0 (0.0%) | 50 (100.0%) |
| Public Administration | 127 (49.0%) | 132 (51.0%) |
| Total | 691 (48.1%) | 746 (51.9%) |
Education in Montana City
School Enrollment in Montana City
The most common levels of schooling among the 665 students in Montana City are high school (239 | 35.9%), middle school (138 | 20.7%), and elementary school (137 | 20.6%).
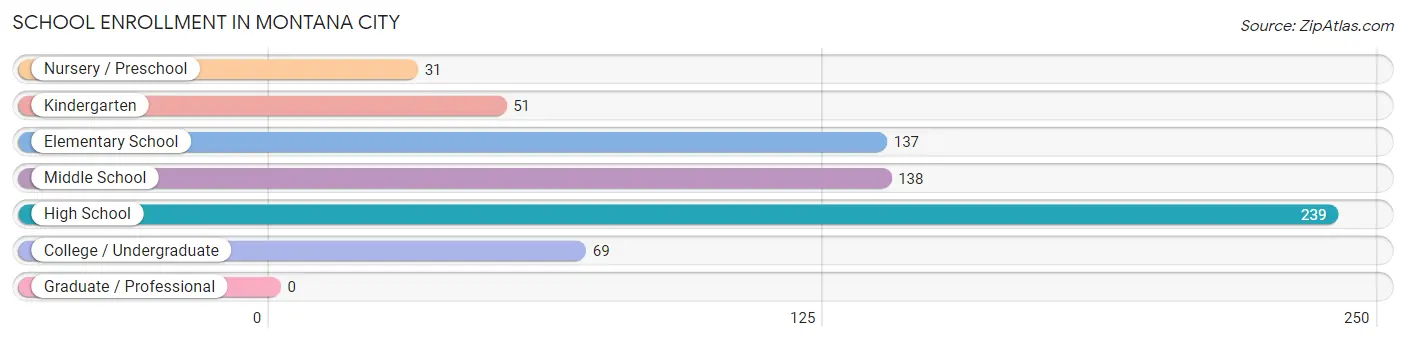
| School Level | # Students | % Students |
| Nursery / Preschool | 31 | 4.7% |
| Kindergarten | 51 | 7.7% |
| Elementary School | 137 | 20.6% |
| Middle School | 138 | 20.7% |
| High School | 239 | 35.9% |
| College / Undergraduate | 69 | 10.4% |
| Graduate / Professional | 0 | 0.0% |
| Total | 665 | 100.0% |
School Enrollment by Age by Funding Source in Montana City
Out of a total of 665 students who are enrolled in schools in Montana City, 72 (10.8%) attend a private institution, while the remaining 593 (89.2%) are enrolled in public schools. The age group of 20 to 24 year olds has the highest likelihood of being enrolled in private schools, with 23 (100.0% in the age bracket) enrolled. Conversely, the age group of 15 to 17 year olds has the lowest likelihood of being enrolled in a private school, with 161 (100.0% in the age bracket) attending a public institution.
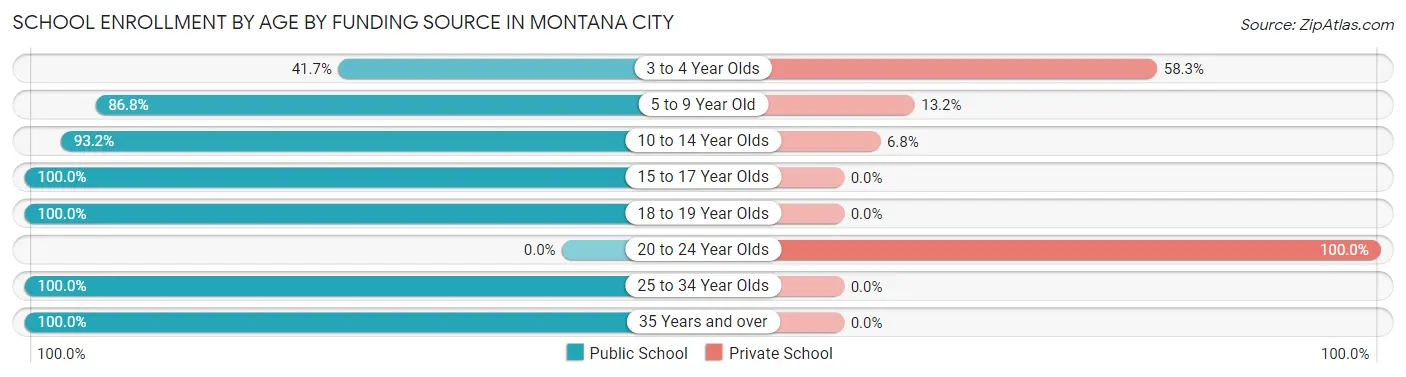
| Age Bracket | Public School | Private School |
| 3 to 4 Year Olds | 10 (41.7%) | 14 (58.3%) |
| 5 to 9 Year Old | 132 (86.8%) | 20 (13.2%) |
| 10 to 14 Year Olds | 207 (93.2%) | 15 (6.8%) |
| 15 to 17 Year Olds | 161 (100.0%) | 0 (0.0%) |
| 18 to 19 Year Olds | 46 (100.0%) | 0 (0.0%) |
| 20 to 24 Year Olds | 0 (0.0%) | 23 (100.0%) |
| 25 to 34 Year Olds | 32 (100.0%) | 0 (0.0%) |
| 35 Years and over | 5 (100.0%) | 0 (0.0%) |
| Total | 593 (89.2%) | 72 (10.8%) |
Educational Attainment by Field of Study in Montana City
Education (191 | 19.5%), science & technology (150 | 15.3%), business (132 | 13.4%), social sciences (97 | 9.9%), and arts & humanities (87 | 8.9%) are the most common fields of study among 982 individuals in Montana City who have obtained a bachelor's degree or higher.
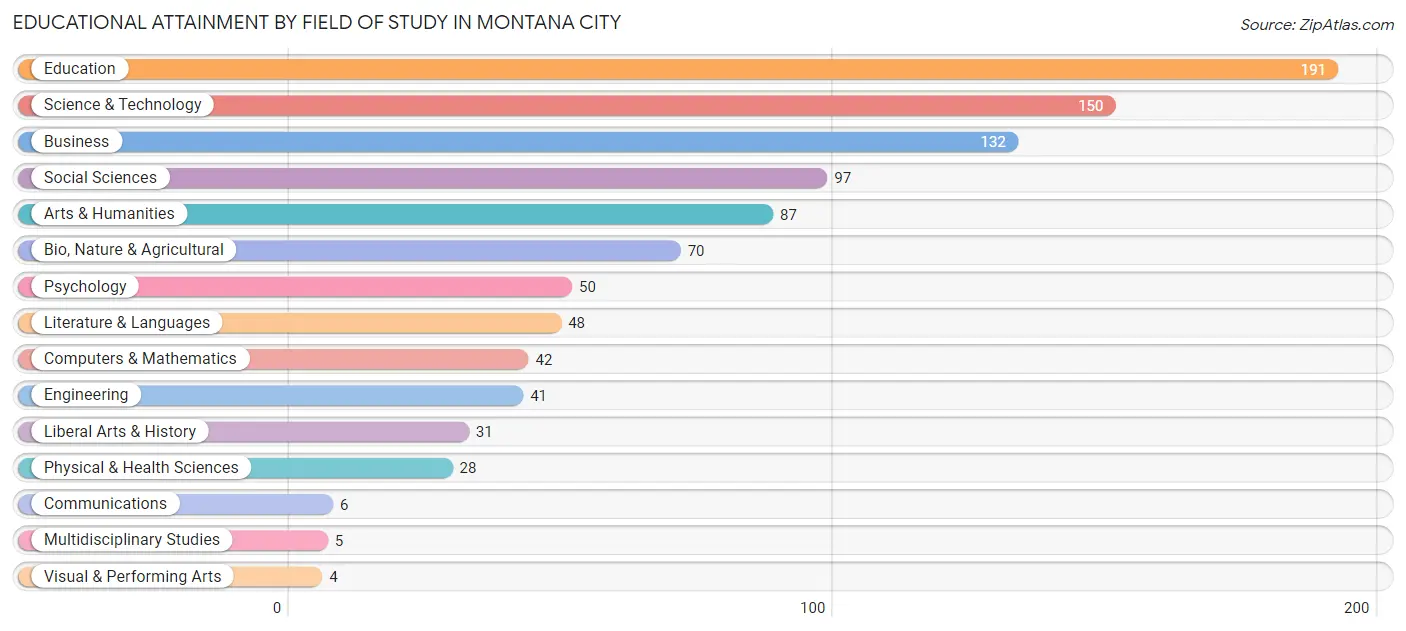
| Field of Study | # Graduates | % Graduates |
| Computers & Mathematics | 42 | 4.3% |
| Bio, Nature & Agricultural | 70 | 7.1% |
| Physical & Health Sciences | 28 | 2.9% |
| Psychology | 50 | 5.1% |
| Social Sciences | 97 | 9.9% |
| Engineering | 41 | 4.2% |
| Multidisciplinary Studies | 5 | 0.5% |
| Science & Technology | 150 | 15.3% |
| Business | 132 | 13.4% |
| Education | 191 | 19.5% |
| Literature & Languages | 48 | 4.9% |
| Liberal Arts & History | 31 | 3.2% |
| Visual & Performing Arts | 4 | 0.4% |
| Communications | 6 | 0.6% |
| Arts & Humanities | 87 | 8.9% |
| Total | 982 | 100.0% |
Transportation & Commute in Montana City
Vehicle Availability by Sex in Montana City
The most prevalent vehicle ownership categories in Montana City are males with 3 vehicles (188, accounting for 28.1%) and females with 3 vehicles (171, making up 25.8%).
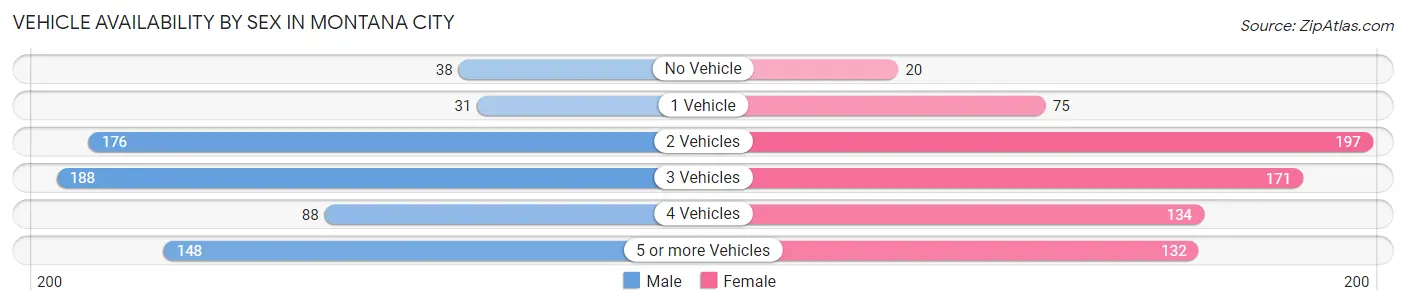
| Vehicles Available | Male | Female |
| No Vehicle | 38 (5.7%) | 20 (2.7%) |
| 1 Vehicle | 31 (4.6%) | 75 (10.3%) |
| 2 Vehicles | 176 (26.3%) | 197 (27.0%) |
| 3 Vehicles | 188 (28.1%) | 171 (23.5%) |
| 4 Vehicles | 88 (13.2%) | 134 (18.4%) |
| 5 or more Vehicles | 148 (22.1%) | 132 (18.1%) |
| Total | 669 (100.0%) | 729 (100.0%) |
Commute Time in Montana City
The most frequently occuring commute durations in Montana City are 15 to 19 minutes (557 commuters, 41.8%), 10 to 14 minutes (361 commuters, 27.1%), and 20 to 24 minutes (173 commuters, 13.0%).
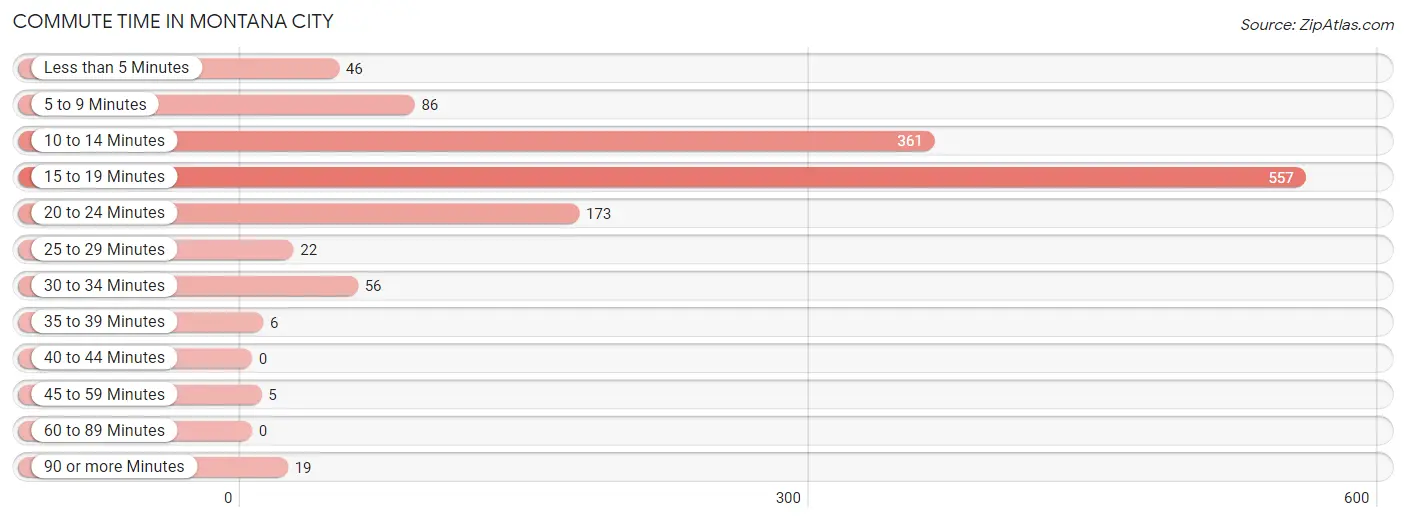
| Commute Time | # Commuters | % Commuters |
| Less than 5 Minutes | 46 | 3.5% |
| 5 to 9 Minutes | 86 | 6.5% |
| 10 to 14 Minutes | 361 | 27.1% |
| 15 to 19 Minutes | 557 | 41.8% |
| 20 to 24 Minutes | 173 | 13.0% |
| 25 to 29 Minutes | 22 | 1.7% |
| 30 to 34 Minutes | 56 | 4.2% |
| 35 to 39 Minutes | 6 | 0.4% |
| 40 to 44 Minutes | 0 | 0.0% |
| 45 to 59 Minutes | 5 | 0.4% |
| 60 to 89 Minutes | 0 | 0.0% |
| 90 or more Minutes | 19 | 1.4% |
Commute Time by Sex in Montana City
The most common commute times in Montana City are 15 to 19 minutes (210 commuters, 33.3%) for males and 15 to 19 minutes (347 commuters, 49.5%) for females.
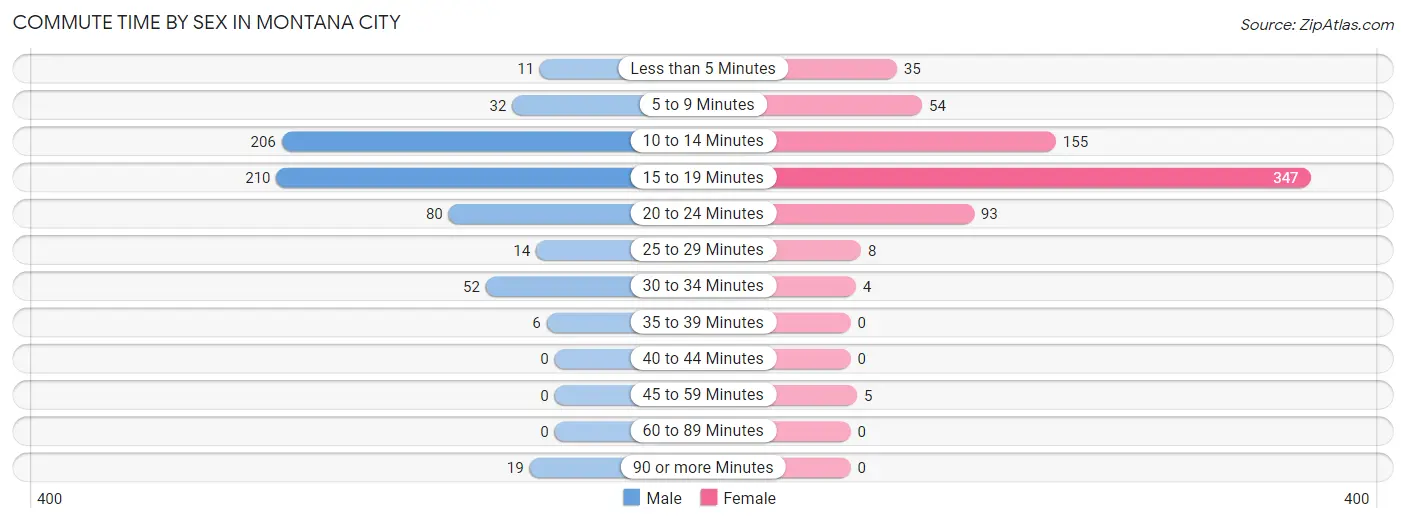
| Commute Time | Male | Female |
| Less than 5 Minutes | 11 (1.8%) | 35 (5.0%) |
| 5 to 9 Minutes | 32 (5.1%) | 54 (7.7%) |
| 10 to 14 Minutes | 206 (32.7%) | 155 (22.1%) |
| 15 to 19 Minutes | 210 (33.3%) | 347 (49.5%) |
| 20 to 24 Minutes | 80 (12.7%) | 93 (13.3%) |
| 25 to 29 Minutes | 14 (2.2%) | 8 (1.1%) |
| 30 to 34 Minutes | 52 (8.3%) | 4 (0.6%) |
| 35 to 39 Minutes | 6 (0.9%) | 0 (0.0%) |
| 40 to 44 Minutes | 0 (0.0%) | 0 (0.0%) |
| 45 to 59 Minutes | 0 (0.0%) | 5 (0.7%) |
| 60 to 89 Minutes | 0 (0.0%) | 0 (0.0%) |
| 90 or more Minutes | 19 (3.0%) | 0 (0.0%) |
Time of Departure to Work by Sex in Montana City
The most frequent times of departure to work in Montana City are 7:30 AM to 7:59 AM (156, 24.8%) for males and 7:30 AM to 7:59 AM (193, 27.5%) for females.
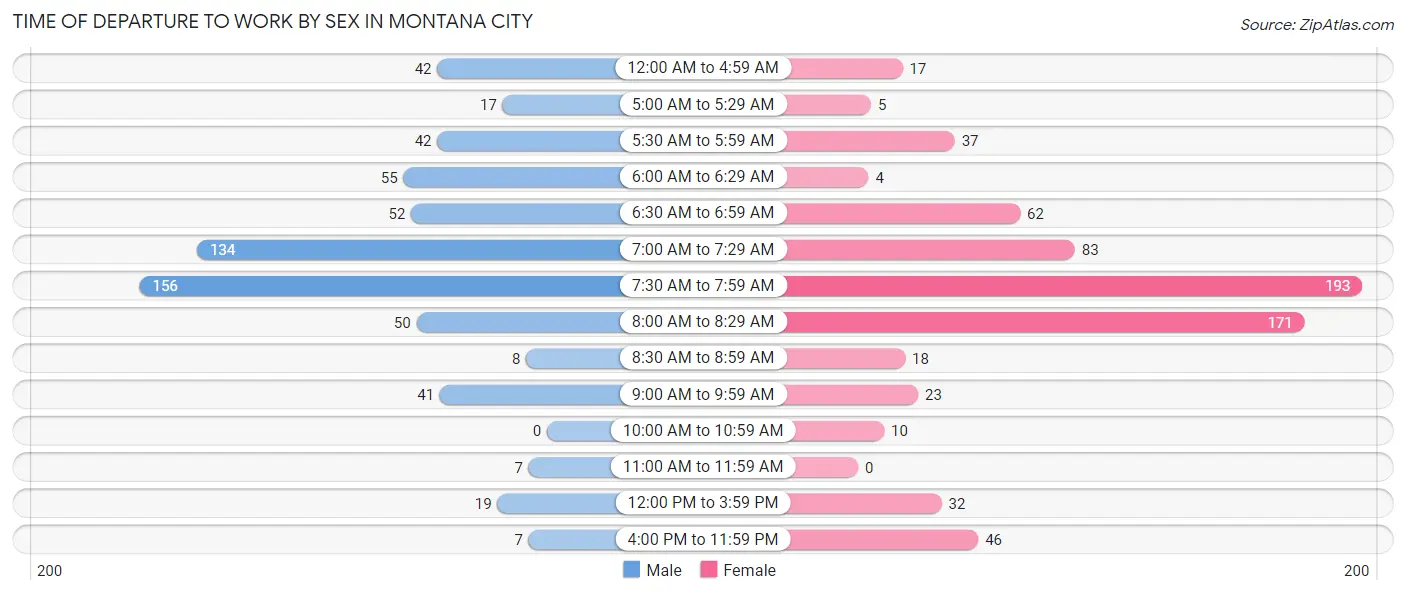
| Time of Departure | Male | Female |
| 12:00 AM to 4:59 AM | 42 (6.7%) | 17 (2.4%) |
| 5:00 AM to 5:29 AM | 17 (2.7%) | 5 (0.7%) |
| 5:30 AM to 5:59 AM | 42 (6.7%) | 37 (5.3%) |
| 6:00 AM to 6:29 AM | 55 (8.7%) | 4 (0.6%) |
| 6:30 AM to 6:59 AM | 52 (8.3%) | 62 (8.8%) |
| 7:00 AM to 7:29 AM | 134 (21.3%) | 83 (11.8%) |
| 7:30 AM to 7:59 AM | 156 (24.8%) | 193 (27.5%) |
| 8:00 AM to 8:29 AM | 50 (7.9%) | 171 (24.4%) |
| 8:30 AM to 8:59 AM | 8 (1.3%) | 18 (2.6%) |
| 9:00 AM to 9:59 AM | 41 (6.5%) | 23 (3.3%) |
| 10:00 AM to 10:59 AM | 0 (0.0%) | 10 (1.4%) |
| 11:00 AM to 11:59 AM | 7 (1.1%) | 0 (0.0%) |
| 12:00 PM to 3:59 PM | 19 (3.0%) | 32 (4.6%) |
| 4:00 PM to 11:59 PM | 7 (1.1%) | 46 (6.6%) |
| Total | 630 (100.0%) | 701 (100.0%) |
Housing Occupancy in Montana City
Occupancy by Ownership in Montana City
Of the total 966 dwellings in Montana City, owner-occupied units account for 899 (93.1%), while renter-occupied units make up 67 (6.9%).
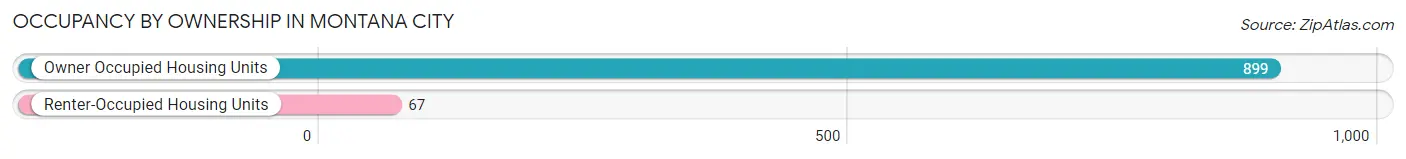
| Occupancy | # Housing Units | % Housing Units |
| Owner Occupied Housing Units | 899 | 93.1% |
| Renter-Occupied Housing Units | 67 | 6.9% |
| Total Occupied Housing Units | 966 | 100.0% |
Occupancy by Household Size in Montana City
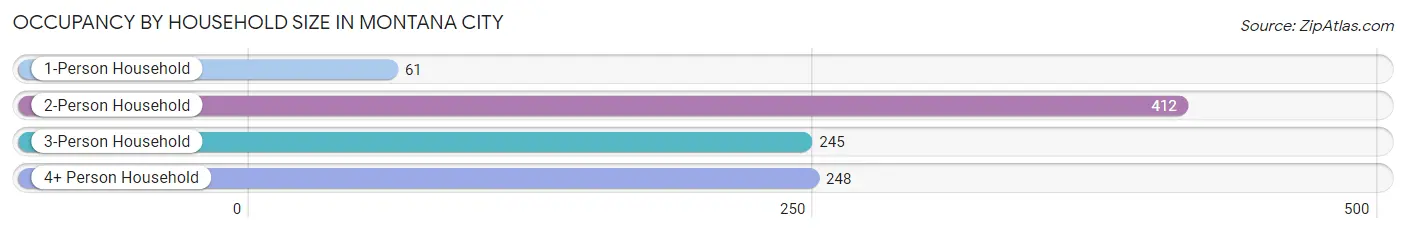
| Household Size | # Housing Units | % Housing Units |
| 1-Person Household | 61 | 6.3% |
| 2-Person Household | 412 | 42.6% |
| 3-Person Household | 245 | 25.4% |
| 4+ Person Household | 248 | 25.7% |
| Total Housing Units | 966 | 100.0% |
Occupancy by Ownership by Household Size in Montana City
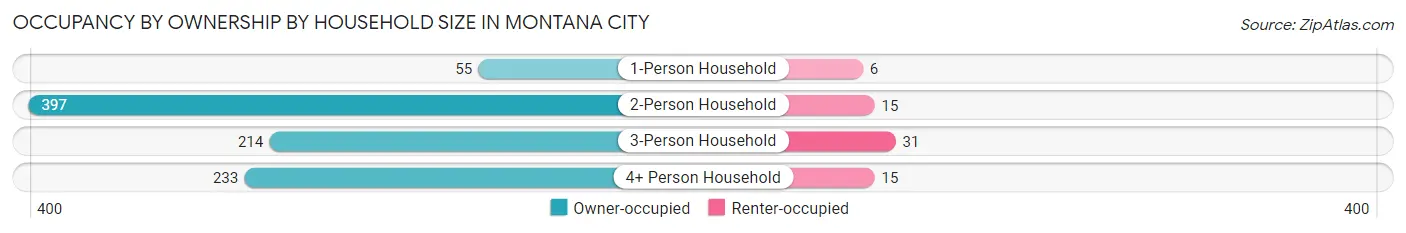
| Household Size | Owner-occupied | Renter-occupied |
| 1-Person Household | 55 (90.2%) | 6 (9.8%) |
| 2-Person Household | 397 (96.4%) | 15 (3.6%) |
| 3-Person Household | 214 (87.4%) | 31 (12.7%) |
| 4+ Person Household | 233 (94.0%) | 15 (6.0%) |
| Total Housing Units | 899 (93.1%) | 67 (6.9%) |
Occupancy by Educational Attainment in Montana City
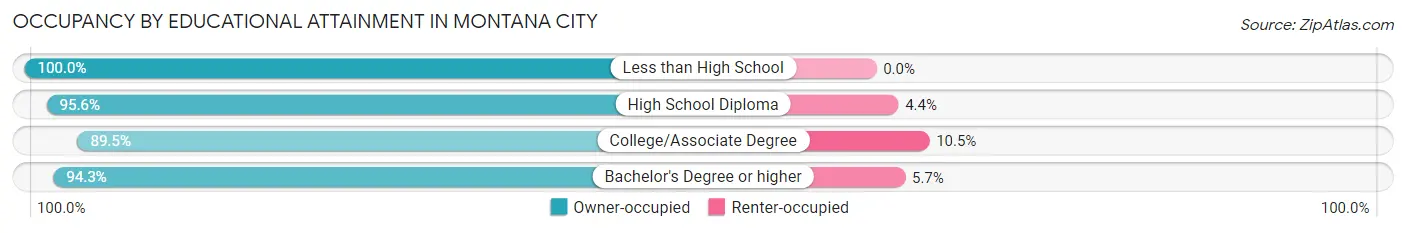
| Household Size | Owner-occupied | Renter-occupied |
| Less than High School | 25 (100.0%) | 0 (0.0%) |
| High School Diploma | 197 (95.6%) | 9 (4.4%) |
| College/Associate Degree | 298 (89.5%) | 35 (10.5%) |
| Bachelor's Degree or higher | 379 (94.3%) | 23 (5.7%) |
Occupancy by Age of Householder in Montana City
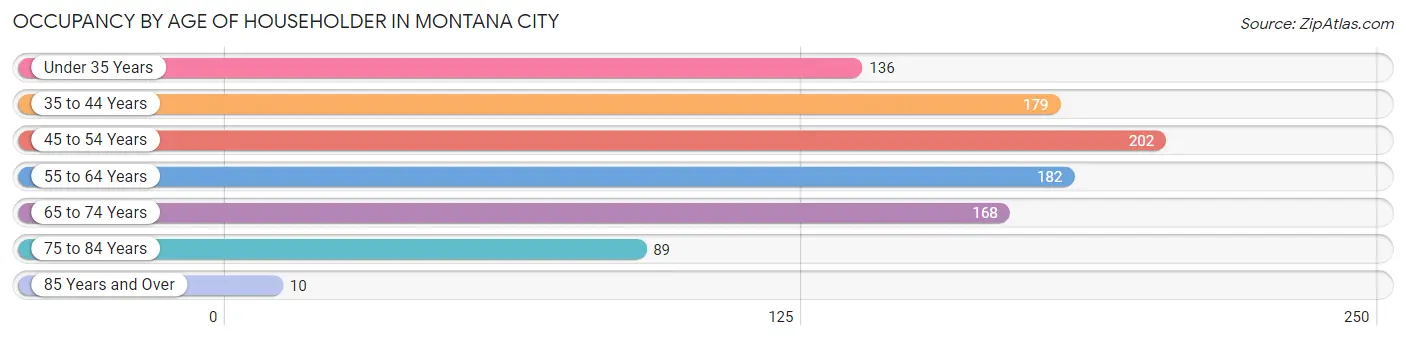
| Age Bracket | # Households | % Households |
| Under 35 Years | 136 | 14.1% |
| 35 to 44 Years | 179 | 18.5% |
| 45 to 54 Years | 202 | 20.9% |
| 55 to 64 Years | 182 | 18.8% |
| 65 to 74 Years | 168 | 17.4% |
| 75 to 84 Years | 89 | 9.2% |
| 85 Years and Over | 10 | 1.0% |
| Total | 966 | 100.0% |
Housing Finances in Montana City
Median Income by Occupancy in Montana City
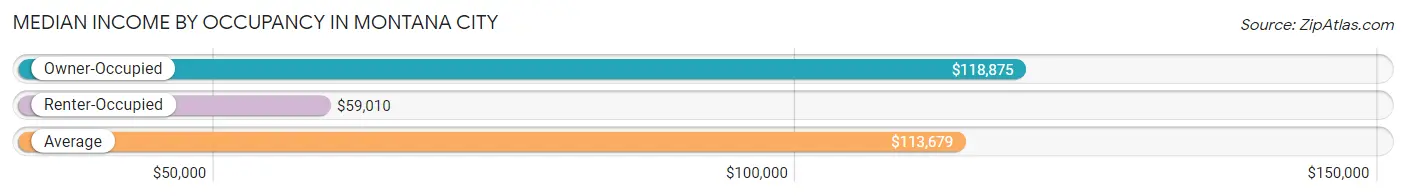
| Occupancy Type | # Households | Median Income |
| Owner-Occupied | 899 (93.1%) | $118,875 |
| Renter-Occupied | 67 (6.9%) | $59,010 |
| Average | 966 (100.0%) | $113,679 |
Occupancy by Householder Income Bracket in Montana City
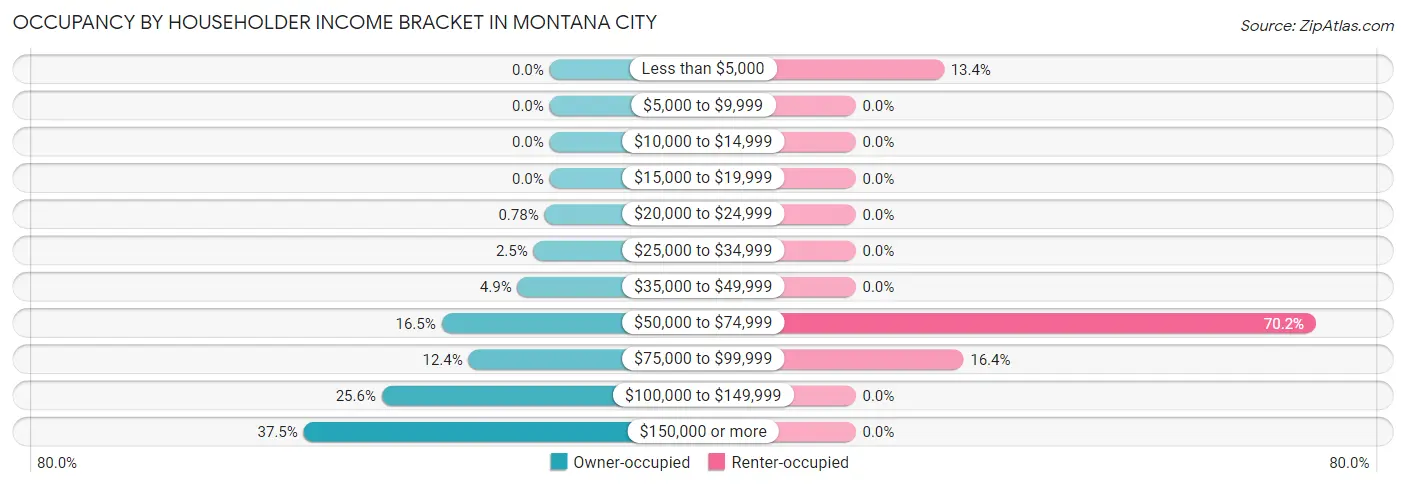
| Income Bracket | Owner-occupied | Renter-occupied |
| Less than $5,000 | 0 (0.0%) | 9 (13.4%) |
| $5,000 to $9,999 | 0 (0.0%) | 0 (0.0%) |
| $10,000 to $14,999 | 0 (0.0%) | 0 (0.0%) |
| $15,000 to $19,999 | 0 (0.0%) | 0 (0.0%) |
| $20,000 to $24,999 | 7 (0.8%) | 0 (0.0%) |
| $25,000 to $34,999 | 22 (2.5%) | 0 (0.0%) |
| $35,000 to $49,999 | 44 (4.9%) | 0 (0.0%) |
| $50,000 to $74,999 | 148 (16.5%) | 47 (70.2%) |
| $75,000 to $99,999 | 111 (12.3%) | 11 (16.4%) |
| $100,000 to $149,999 | 230 (25.6%) | 0 (0.0%) |
| $150,000 or more | 337 (37.5%) | 0 (0.0%) |
| Total | 899 (100.0%) | 67 (100.0%) |
Monthly Housing Cost Tiers in Montana City
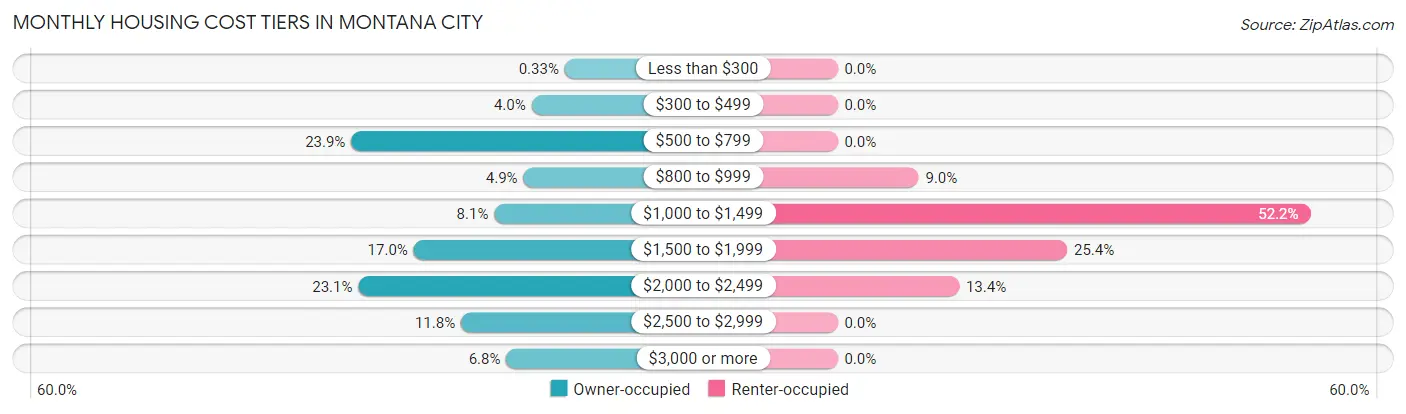
| Monthly Cost | Owner-occupied | Renter-occupied |
| Less than $300 | 3 (0.3%) | 0 (0.0%) |
| $300 to $499 | 36 (4.0%) | 0 (0.0%) |
| $500 to $799 | 215 (23.9%) | 0 (0.0%) |
| $800 to $999 | 44 (4.9%) | 6 (9.0%) |
| $1,000 to $1,499 | 73 (8.1%) | 35 (52.2%) |
| $1,500 to $1,999 | 153 (17.0%) | 17 (25.4%) |
| $2,000 to $2,499 | 208 (23.1%) | 9 (13.4%) |
| $2,500 to $2,999 | 106 (11.8%) | 0 (0.0%) |
| $3,000 or more | 61 (6.8%) | 0 (0.0%) |
| Total | 899 (100.0%) | 67 (100.0%) |
Physical Housing Characteristics in Montana City
Housing Structures in Montana City
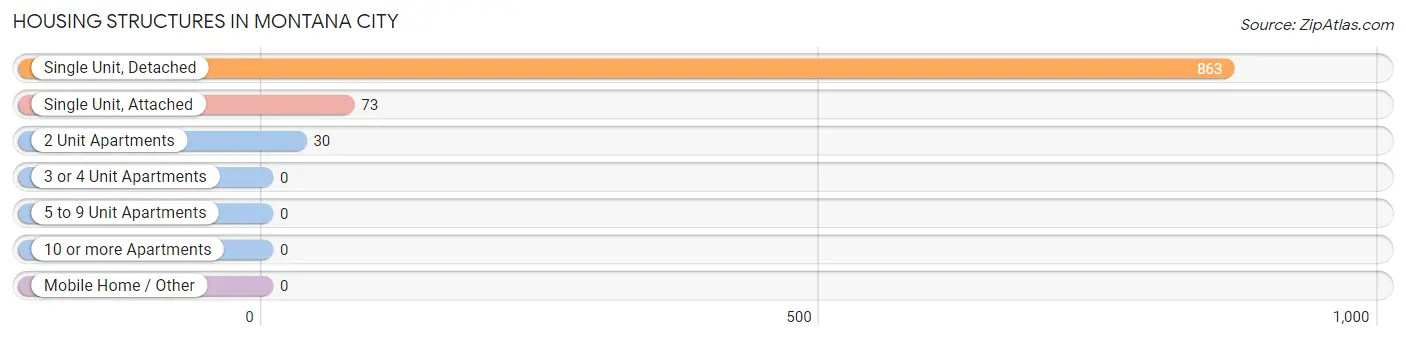
| Structure Type | # Housing Units | % Housing Units |
| Single Unit, Detached | 863 | 89.3% |
| Single Unit, Attached | 73 | 7.6% |
| 2 Unit Apartments | 30 | 3.1% |
| 3 or 4 Unit Apartments | 0 | 0.0% |
| 5 to 9 Unit Apartments | 0 | 0.0% |
| 10 or more Apartments | 0 | 0.0% |
| Mobile Home / Other | 0 | 0.0% |
| Total | 966 | 100.0% |
Housing Structures by Occupancy in Montana City
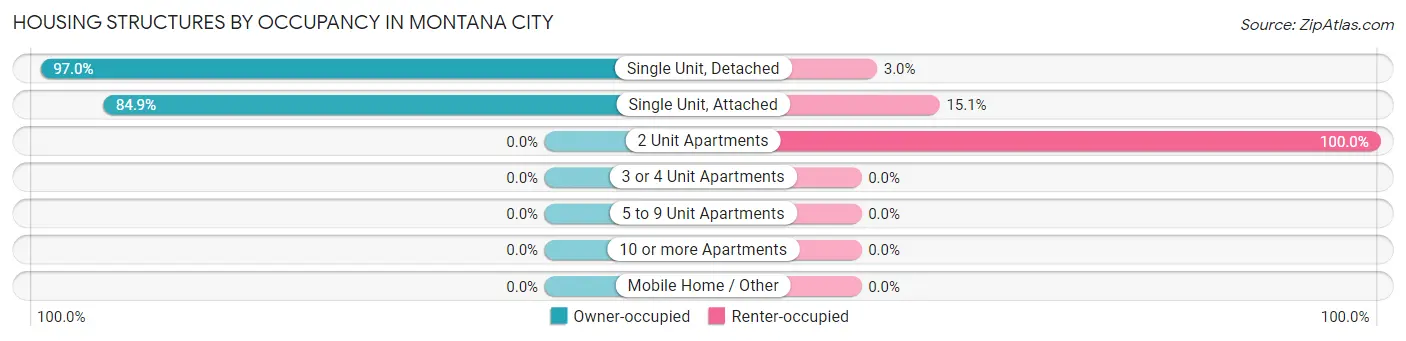
| Structure Type | Owner-occupied | Renter-occupied |
| Single Unit, Detached | 837 (97.0%) | 26 (3.0%) |
| Single Unit, Attached | 62 (84.9%) | 11 (15.1%) |
| 2 Unit Apartments | 0 (0.0%) | 30 (100.0%) |
| 3 or 4 Unit Apartments | 0 (0.0%) | 0 (0.0%) |
| 5 to 9 Unit Apartments | 0 (0.0%) | 0 (0.0%) |
| 10 or more Apartments | 0 (0.0%) | 0 (0.0%) |
| Mobile Home / Other | 0 (0.0%) | 0 (0.0%) |
| Total | 899 (93.1%) | 67 (6.9%) |
Housing Structures by Number of Rooms in Montana City
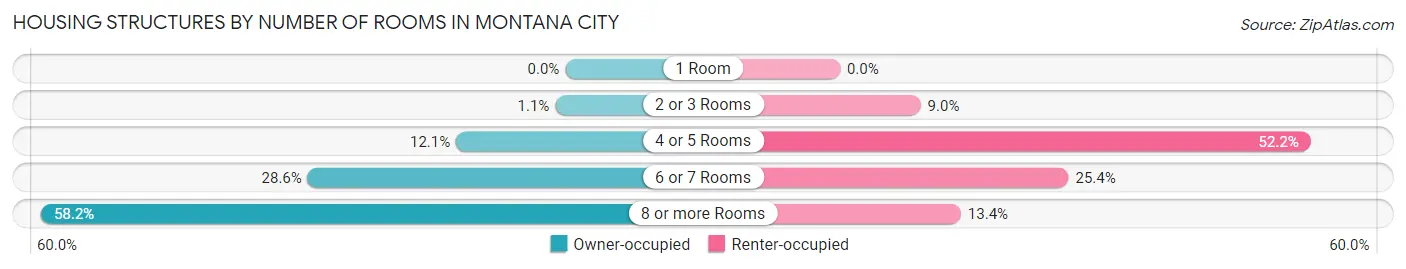
| Number of Rooms | Owner-occupied | Renter-occupied |
| 1 Room | 0 (0.0%) | 0 (0.0%) |
| 2 or 3 Rooms | 10 (1.1%) | 6 (9.0%) |
| 4 or 5 Rooms | 109 (12.1%) | 35 (52.2%) |
| 6 or 7 Rooms | 257 (28.6%) | 17 (25.4%) |
| 8 or more Rooms | 523 (58.2%) | 9 (13.4%) |
| Total | 899 (100.0%) | 67 (100.0%) |
Housing Structure by Heating Type in Montana City
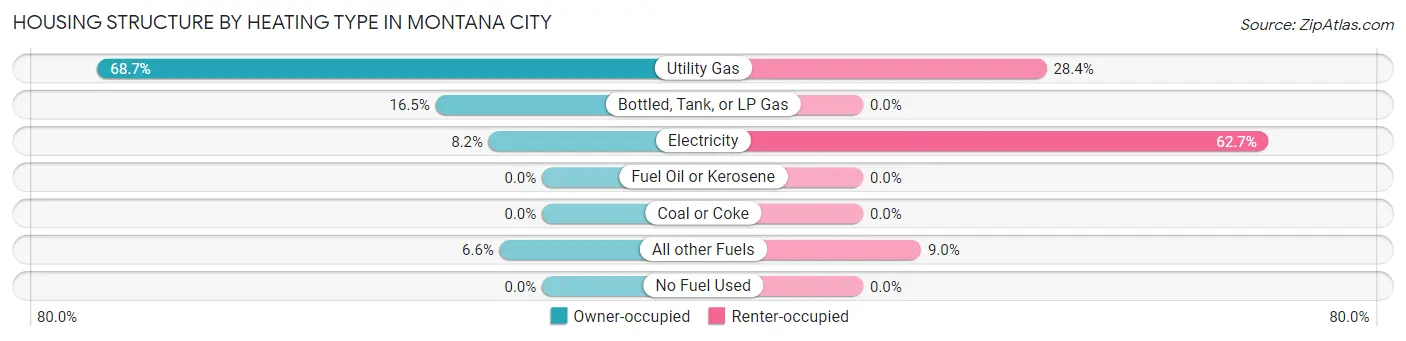
| Heating Type | Owner-occupied | Renter-occupied |
| Utility Gas | 618 (68.7%) | 19 (28.4%) |
| Bottled, Tank, or LP Gas | 148 (16.5%) | 0 (0.0%) |
| Electricity | 74 (8.2%) | 42 (62.7%) |
| Fuel Oil or Kerosene | 0 (0.0%) | 0 (0.0%) |
| Coal or Coke | 0 (0.0%) | 0 (0.0%) |
| All other Fuels | 59 (6.6%) | 6 (9.0%) |
| No Fuel Used | 0 (0.0%) | 0 (0.0%) |
| Total | 899 (100.0%) | 67 (100.0%) |
Household Vehicle Usage in Montana City
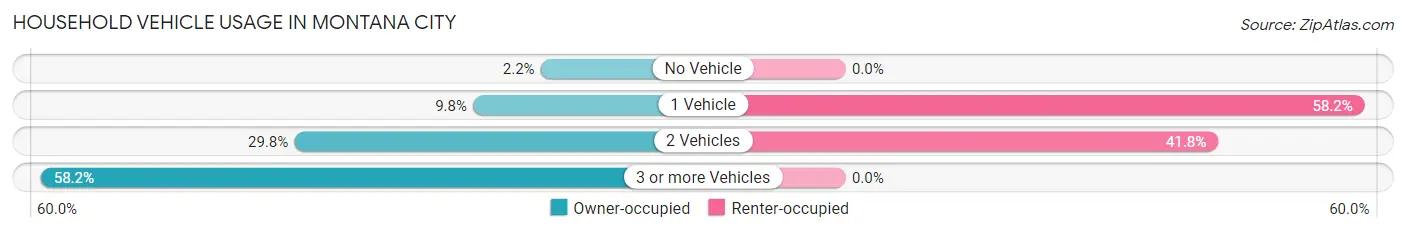
| Vehicles per Household | Owner-occupied | Renter-occupied |
| No Vehicle | 20 (2.2%) | 0 (0.0%) |
| 1 Vehicle | 88 (9.8%) | 39 (58.2%) |
| 2 Vehicles | 268 (29.8%) | 28 (41.8%) |
| 3 or more Vehicles | 523 (58.2%) | 0 (0.0%) |
| Total | 899 (100.0%) | 67 (100.0%) |
Real Estate & Mortgages in Montana City
Real Estate and Mortgage Overview in Montana City
| Characteristic | Without Mortgage | With Mortgage |
| Housing Units | 288 | 611 |
| Median Property Value | $440,000 | $469,200 |
| Median Household Income | $98,500 | $283 |
| Monthly Housing Costs | $635 | $61 |
| Real Estate Taxes | $3,372 | $0 |
Property Value by Mortgage Status in Montana City
| Property Value | Without Mortgage | With Mortgage |
| Less than $50,000 | 3 (1.0%) | 0 (0.0%) |
| $50,000 to $99,999 | 4 (1.4%) | 0 (0.0%) |
| $100,000 to $299,999 | 57 (19.8%) | 60 (9.8%) |
| $300,000 to $499,999 | 143 (49.6%) | 309 (50.6%) |
| $500,000 to $749,999 | 27 (9.4%) | 216 (35.3%) |
| $750,000 to $999,999 | 46 (16.0%) | 26 (4.3%) |
| $1,000,000 or more | 8 (2.8%) | 0 (0.0%) |
| Total | 288 (100.0%) | 611 (100.0%) |
Household Income by Mortgage Status in Montana City
| Household Income | Without Mortgage | With Mortgage |
| Less than $10,000 | 0 (0.0%) | 0 (0.0%) |
| $10,000 to $24,999 | 7 (2.4%) | 0 (0.0%) |
| $25,000 to $34,999 | 22 (7.6%) | 0 (0.0%) |
| $35,000 to $49,999 | 17 (5.9%) | 0 (0.0%) |
| $50,000 to $74,999 | 49 (17.0%) | 27 (4.4%) |
| $75,000 to $99,999 | 52 (18.1%) | 99 (16.2%) |
| $100,000 to $149,999 | 87 (30.2%) | 59 (9.7%) |
| $150,000 or more | 54 (18.8%) | 143 (23.4%) |
| Total | 288 (100.0%) | 611 (100.0%) |
Property Value to Household Income Ratio in Montana City
| Value-to-Income Ratio | Without Mortgage | With Mortgage |
| Less than 2.0x | 59 (20.5%) | 143,348 (23,461.2%) |
| 2.0x to 2.9x | 17 (5.9%) | 94 (15.4%) |
| 3.0x to 3.9x | 54 (18.8%) | 169 (27.7%) |
| 4.0x or more | 158 (54.9%) | 111 (18.2%) |
| Total | 288 (100.0%) | 611 (100.0%) |
Real Estate Taxes by Mortgage Status in Montana City
| Property Taxes | Without Mortgage | With Mortgage |
| Less than $800 | 3 (1.0%) | 0 (0.0%) |
| $800 to $1,499 | 9 (3.1%) | 4 (0.6%) |
| $800 to $1,499 | 267 (92.7%) | 18 (2.9%) |
| Total | 288 (100.0%) | 611 (100.0%) |
Health & Disability in Montana City
Health Insurance Coverage by Age in Montana City
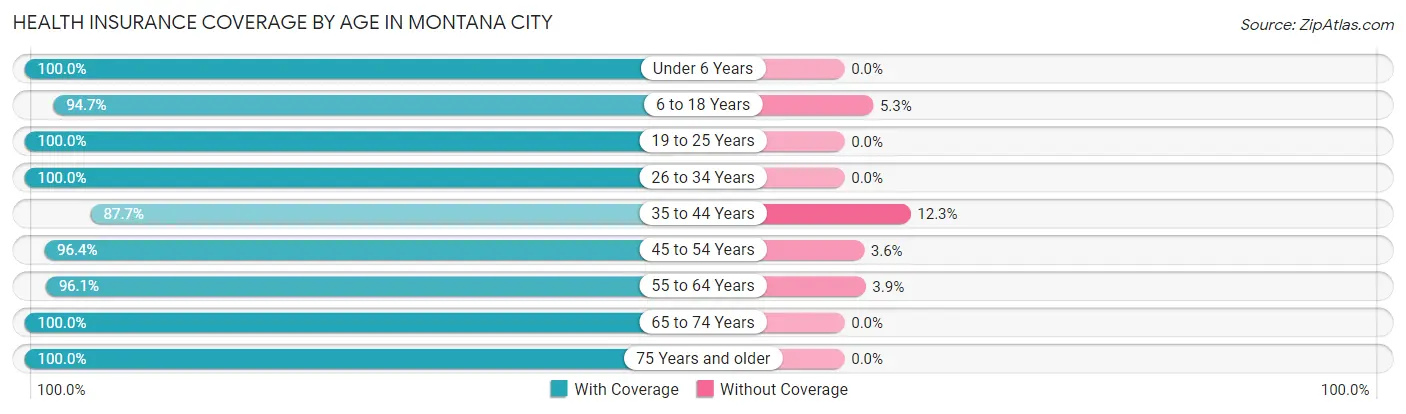
| Age Bracket | With Coverage | Without Coverage |
| Under 6 Years | 159 (100.0%) | 0 (0.0%) |
| 6 to 18 Years | 496 (94.7%) | 28 (5.3%) |
| 19 to 25 Years | 88 (100.0%) | 0 (0.0%) |
| 26 to 34 Years | 211 (100.0%) | 0 (0.0%) |
| 35 to 44 Years | 370 (87.7%) | 52 (12.3%) |
| 45 to 54 Years | 371 (96.4%) | 14 (3.6%) |
| 55 to 64 Years | 414 (96.1%) | 17 (3.9%) |
| 65 to 74 Years | 322 (100.0%) | 0 (0.0%) |
| 75 Years and older | 169 (100.0%) | 0 (0.0%) |
| Total | 2,600 (95.9%) | 111 (4.1%) |
Health Insurance Coverage by Citizenship Status in Montana City
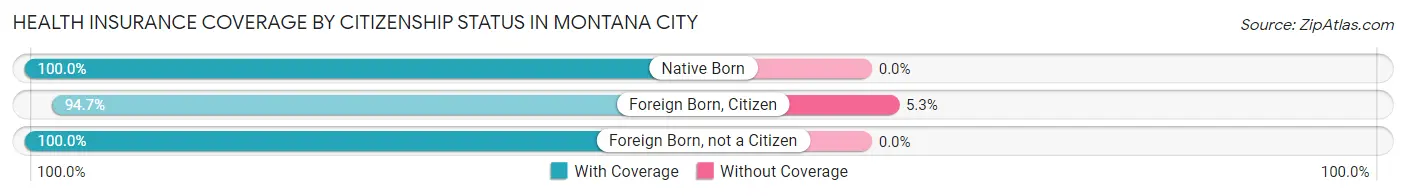
| Citizenship Status | With Coverage | Without Coverage |
| Native Born | 159 (100.0%) | 0 (0.0%) |
| Foreign Born, Citizen | 496 (94.7%) | 28 (5.3%) |
| Foreign Born, not a Citizen | 88 (100.0%) | 0 (0.0%) |
Health Insurance Coverage by Household Income in Montana City
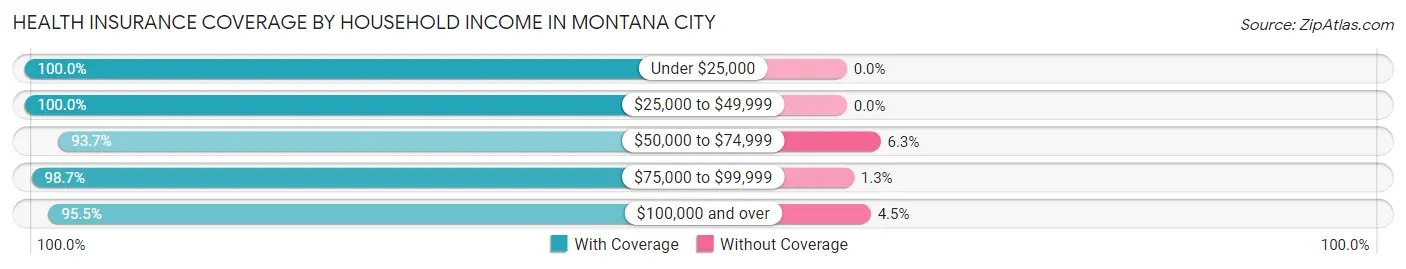
| Household Income | With Coverage | Without Coverage |
| Under $25,000 | 40 (100.0%) | 0 (0.0%) |
| $25,000 to $49,999 | 166 (100.0%) | 0 (0.0%) |
| $50,000 to $74,999 | 430 (93.7%) | 29 (6.3%) |
| $75,000 to $99,999 | 298 (98.7%) | 4 (1.3%) |
| $100,000 and over | 1,662 (95.5%) | 78 (4.5%) |
Public vs Private Health Insurance Coverage by Age in Montana City
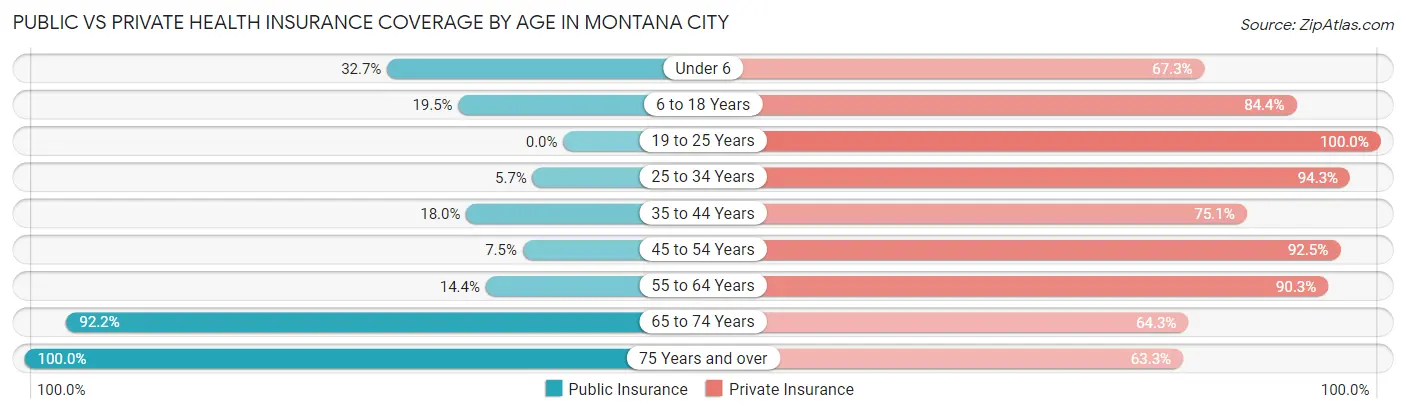
| Age Bracket | Public Insurance | Private Insurance |
| Under 6 | 52 (32.7%) | 107 (67.3%) |
| 6 to 18 Years | 102 (19.5%) | 442 (84.4%) |
| 19 to 25 Years | 0 (0.0%) | 88 (100.0%) |
| 25 to 34 Years | 12 (5.7%) | 199 (94.3%) |
| 35 to 44 Years | 76 (18.0%) | 317 (75.1%) |
| 45 to 54 Years | 29 (7.5%) | 356 (92.5%) |
| 55 to 64 Years | 62 (14.4%) | 389 (90.3%) |
| 65 to 74 Years | 297 (92.2%) | 207 (64.3%) |
| 75 Years and over | 169 (100.0%) | 107 (63.3%) |
| Total | 799 (29.5%) | 2,212 (81.6%) |
Disability Status by Sex by Age in Montana City
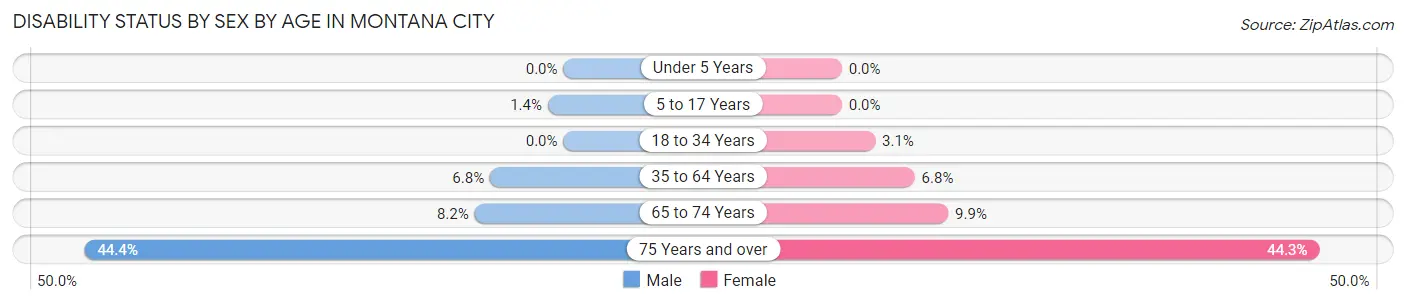
| Age Bracket | Male | Female |
| Under 5 Years | 0 (0.0%) | 0 (0.0%) |
| 5 to 17 Years | 4 (1.4%) | 0 (0.0%) |
| 18 to 34 Years | 0 (0.0%) | 6 (3.1%) |
| 35 to 64 Years | 40 (6.8%) | 44 (6.8%) |
| 65 to 74 Years | 14 (8.2%) | 15 (9.9%) |
| 75 Years and over | 36 (44.4%) | 39 (44.3%) |
Disability Class by Sex by Age in Montana City
Disability Class: Hearing Difficulty
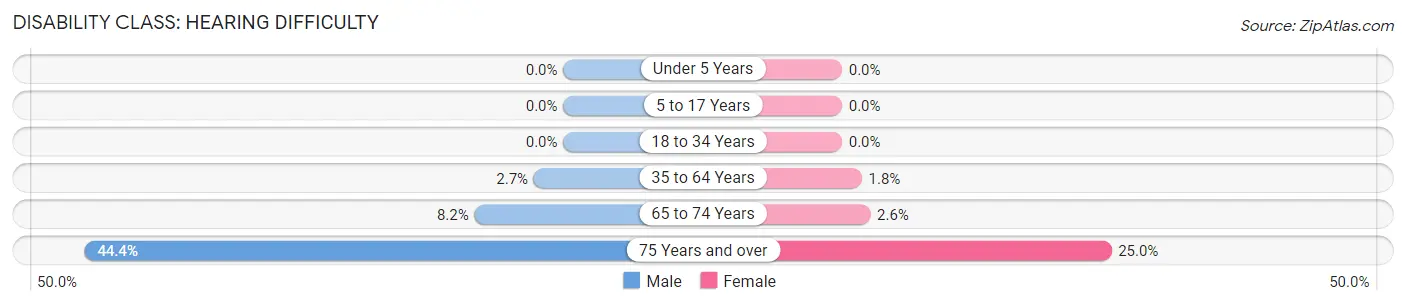
| Age Bracket | Male | Female |
| Under 5 Years | 0 (0.0%) | 0 (0.0%) |
| 5 to 17 Years | 0 (0.0%) | 0 (0.0%) |
| 18 to 34 Years | 0 (0.0%) | 0 (0.0%) |
| 35 to 64 Years | 16 (2.7%) | 12 (1.8%) |
| 65 to 74 Years | 14 (8.2%) | 4 (2.6%) |
| 75 Years and over | 36 (44.4%) | 22 (25.0%) |
Disability Class: Vision Difficulty
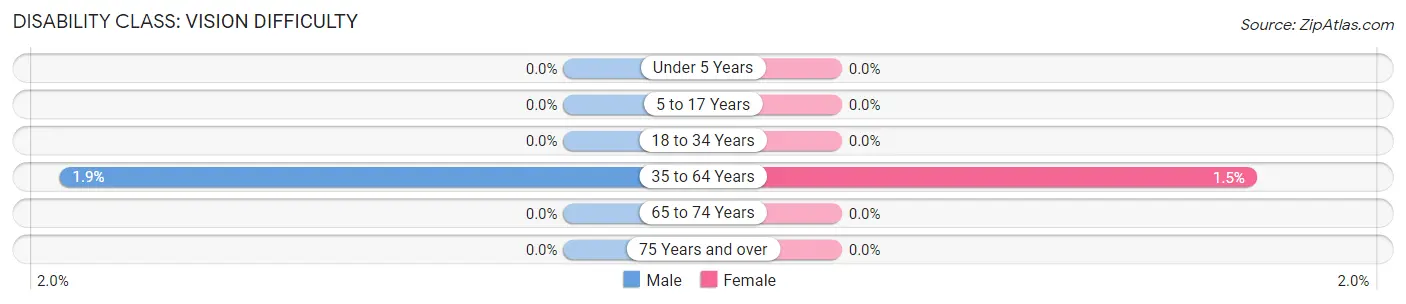
| Age Bracket | Male | Female |
| Under 5 Years | 0 (0.0%) | 0 (0.0%) |
| 5 to 17 Years | 0 (0.0%) | 0 (0.0%) |
| 18 to 34 Years | 0 (0.0%) | 0 (0.0%) |
| 35 to 64 Years | 11 (1.9%) | 10 (1.5%) |
| 65 to 74 Years | 0 (0.0%) | 0 (0.0%) |
| 75 Years and over | 0 (0.0%) | 0 (0.0%) |
Disability Class: Cognitive Difficulty
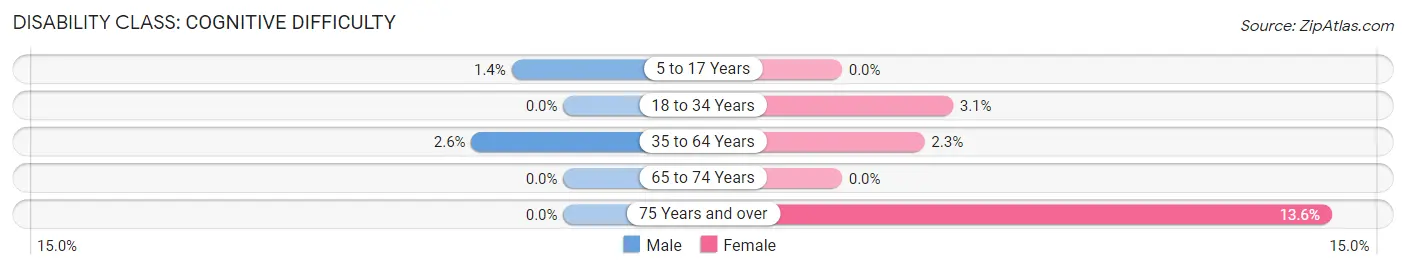
| Age Bracket | Male | Female |
| 5 to 17 Years | 4 (1.4%) | 0 (0.0%) |
| 18 to 34 Years | 0 (0.0%) | 6 (3.1%) |
| 35 to 64 Years | 15 (2.6%) | 15 (2.3%) |
| 65 to 74 Years | 0 (0.0%) | 0 (0.0%) |
| 75 Years and over | 0 (0.0%) | 12 (13.6%) |
Disability Class: Ambulatory Difficulty
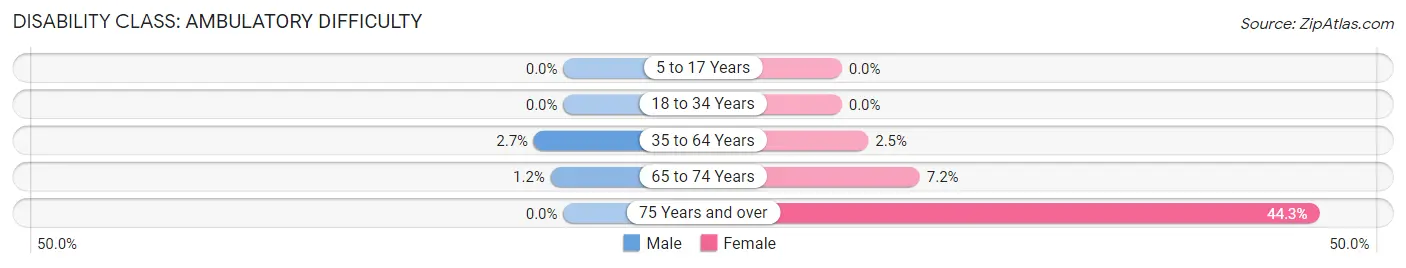
| Age Bracket | Male | Female |
| 5 to 17 Years | 0 (0.0%) | 0 (0.0%) |
| 18 to 34 Years | 0 (0.0%) | 0 (0.0%) |
| 35 to 64 Years | 16 (2.7%) | 16 (2.5%) |
| 65 to 74 Years | 2 (1.2%) | 11 (7.2%) |
| 75 Years and over | 0 (0.0%) | 39 (44.3%) |
Disability Class: Self-Care Difficulty
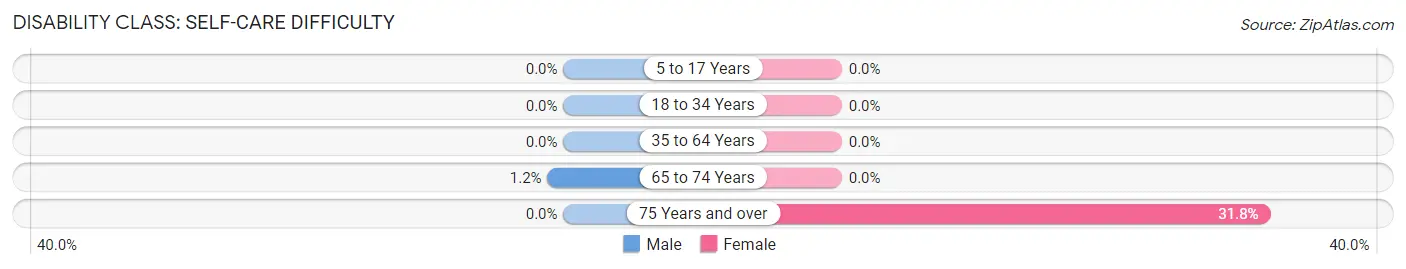
| Age Bracket | Male | Female |
| 5 to 17 Years | 0 (0.0%) | 0 (0.0%) |
| 18 to 34 Years | 0 (0.0%) | 0 (0.0%) |
| 35 to 64 Years | 0 (0.0%) | 0 (0.0%) |
| 65 to 74 Years | 2 (1.2%) | 0 (0.0%) |
| 75 Years and over | 0 (0.0%) | 28 (31.8%) |
Technology Access in Montana City
Computing Device Access in Montana City
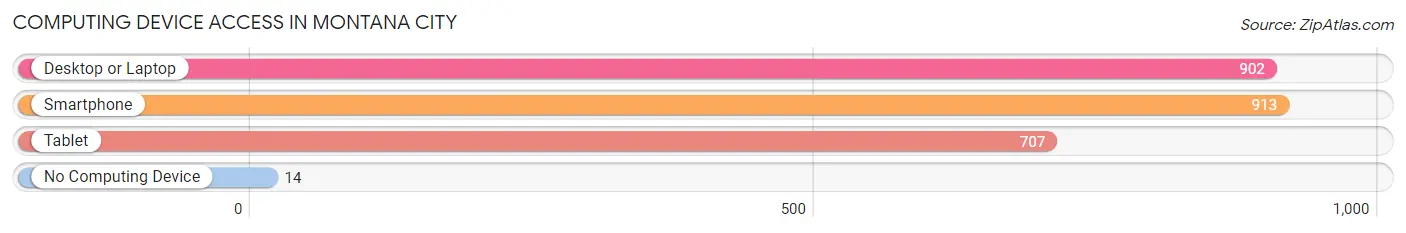
| Device Type | # Households | % Households |
| Desktop or Laptop | 902 | 93.4% |
| Smartphone | 913 | 94.5% |
| Tablet | 707 | 73.2% |
| No Computing Device | 14 | 1.5% |
| Total | 966 | 100.0% |
Internet Access in Montana City
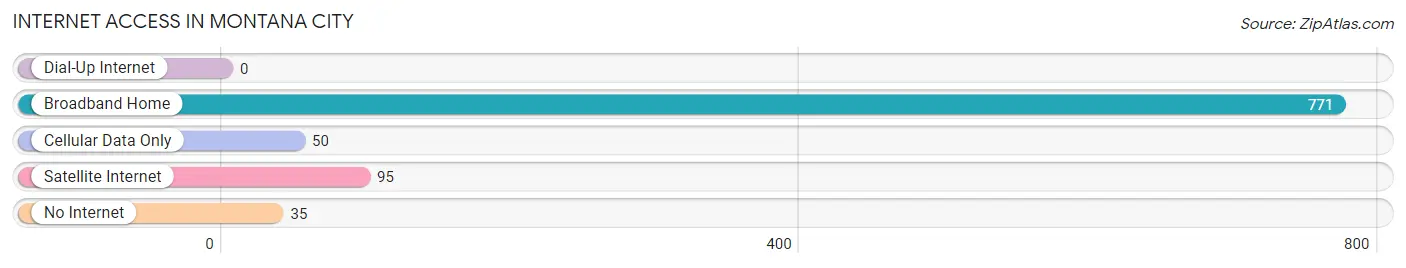
| Internet Type | # Households | % Households |
| Dial-Up Internet | 0 | 0.0% |
| Broadband Home | 771 | 79.8% |
| Cellular Data Only | 50 | 5.2% |
| Satellite Internet | 95 | 9.8% |
| No Internet | 35 | 3.6% |
| Total | 966 | 100.0% |
Montana City Summary
Montana City is a small town located in the western part of Montana, United States. It is situated in the foothills of the Rocky Mountains, about 20 miles east of Helena, the state capital. The town was founded in 1864 and has a population of about 1,000 people.
History
Montana City was founded in 1864 by a group of miners who were looking for gold in the area. The town was originally called "Gold Creek" but was later changed to Montana City. The town was a major hub for the mining industry in the area and was home to many saloons, stores, and other businesses.
In the late 1800s, Montana City was a bustling town with a population of over 1,000 people. The town was home to many saloons, stores, and other businesses. The town was also home to a number of churches, including the First Presbyterian Church, which was founded in 1868.
In the early 1900s, the mining industry in the area began to decline and the population of Montana City began to decrease. By the 1950s, the population had dropped to just over 500 people.
Geography
Montana City is located in the western part of Montana, in the foothills of the Rocky Mountains. The town is situated about 20 miles east of Helena, the state capital. The town is located at an elevation of 4,500 feet and has a total area of 1.2 square miles.
The town is surrounded by mountains and is home to a number of creeks and streams. The town is also home to a number of parks, including the Montana City State Park, which is located just outside of town.
Economy
The economy of Montana City is largely based on tourism and agriculture. The town is home to a number of tourist attractions, including the Montana City State Park, which is located just outside of town. The park is home to a number of hiking trails, camping sites, and other outdoor activities.
The town is also home to a number of farms and ranches, which produce a variety of crops and livestock. The town is also home to a number of small businesses, including restaurants, stores, and other services.
Demographics
As of the 2010 census, the population of Montana City was 1,000 people. The town is predominantly white, with about 95% of the population being white. The town is also home to a small Hispanic population, with about 4% of the population being Hispanic. The median household income in the town is $41,000, and the median home value is $150,000.
Common Questions
What is Per Capita Income in Montana City?
Per Capita income in Montana City is $49,475.
What is the Median Family Income in Montana City?
Median Family Income in Montana City is $120,500.
What is the Median Household income in Montana City?
Median Household Income in Montana City is $113,679.
What is Income or Wage Gap in Montana City?
Income or Wage Gap in Montana City is 27.1%.
Women in Montana City earn 72.9 cents for every dollar earned by a man.
What is Inequality or Gini Index in Montana City?
Inequality or Gini Index in Montana City is 0.35.
What is the Total Population of Montana City?
Total Population of Montana City is 2,716.
What is the Total Male Population of Montana City?
Total Male Population of Montana City is 1,335.
What is the Total Female Population of Montana City?
Total Female Population of Montana City is 1,381.
What is the Ratio of Males per 100 Females in Montana City?
There are 96.67 Males per 100 Females in Montana City.
What is the Ratio of Females per 100 Males in Montana City?
There are 103.45 Females per 100 Males in Montana City.
What is the Median Population Age in Montana City?
Median Population Age in Montana City is 44.4 Years.
What is the Average Family Size in Montana City
Average Family Size in Montana City is 2.9 People.
What is the Average Household Size in Montana City
Average Household Size in Montana City is 2.8 People.
How Large is the Labor Force in Montana City?
There are 1,475 People in the Labor Forcein in Montana City.
What is the Percentage of People in the Labor Force in Montana City?
67.9% of People are in the Labor Force in Montana City.
What is the Unemployment Rate in Montana City?
Unemployment Rate in Montana City is 2.2%.