Wolf Point, MT Map & Demographics
Wolf Point Map
Wolf Point Overview
$18,714
PER CAPITA INCOME
$55,000
AVG FAMILY INCOME
$46,389
AVG HOUSEHOLD INCOME
11.6%
WAGE / INCOME GAP [ % ]
88.4¢/ $1
WAGE / INCOME GAP [ $ ]
0.41
INEQUALITY / GINI INDEX
2,634
TOTAL POPULATION
1,327
MALE POPULATION
1,307
FEMALE POPULATION
101.53
MALES / 100 FEMALES
98.49
FEMALES / 100 MALES
30.3
MEDIAN AGE
4.3
AVG FAMILY SIZE
3.2
AVG HOUSEHOLD SIZE
1,118
LABOR FORCE [ PEOPLE ]
56.1%
PERCENT IN LABOR FORCE
16.6%
UNEMPLOYMENT RATE
Wolf Point Zip Codes
Wolf Point Area Codes
Income in Wolf Point
Income Overview in Wolf Point
Per Capita Income in Wolf Point is $18,714, while median incomes of families and households are $55,000 and $46,389 respectively.
| Characteristic | Number | Measure |
| Per Capita Income | 2,634 | $18,714 |
| Median Family Income | 464 | $55,000 |
| Mean Family Income | 464 | $59,533 |
| Median Household Income | 772 | $46,389 |
| Mean Household Income | 772 | $53,522 |
| Income Deficit | 464 | $0 |
| Wage / Income Gap (%) | 2,634 | 11.64% |
| Wage / Income Gap ($) | 2,634 | 88.36¢ per $1 |
| Gini / Inequality Index | 2,634 | 0.41 |
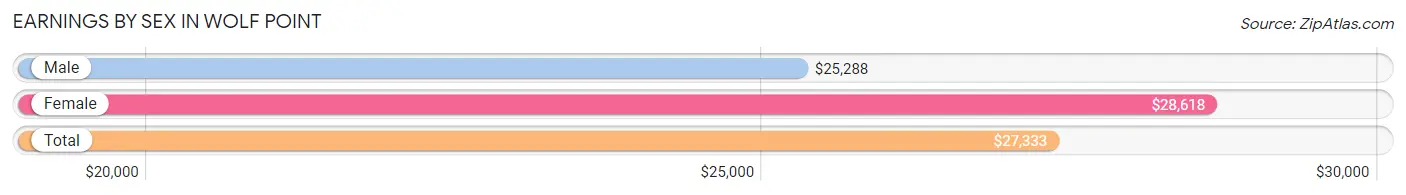
Earnings by Sex in Wolf Point
Average Earnings in Wolf Point are $27,333, $25,288 for men and $28,618 for women, a difference of 11.6%.
| Sex | Number | Average Earnings |
| Male | 581 (52.6%) | $25,288 |
| Female | 523 (47.4%) | $28,618 |
| Total | 1,104 (100.0%) | $27,333 |
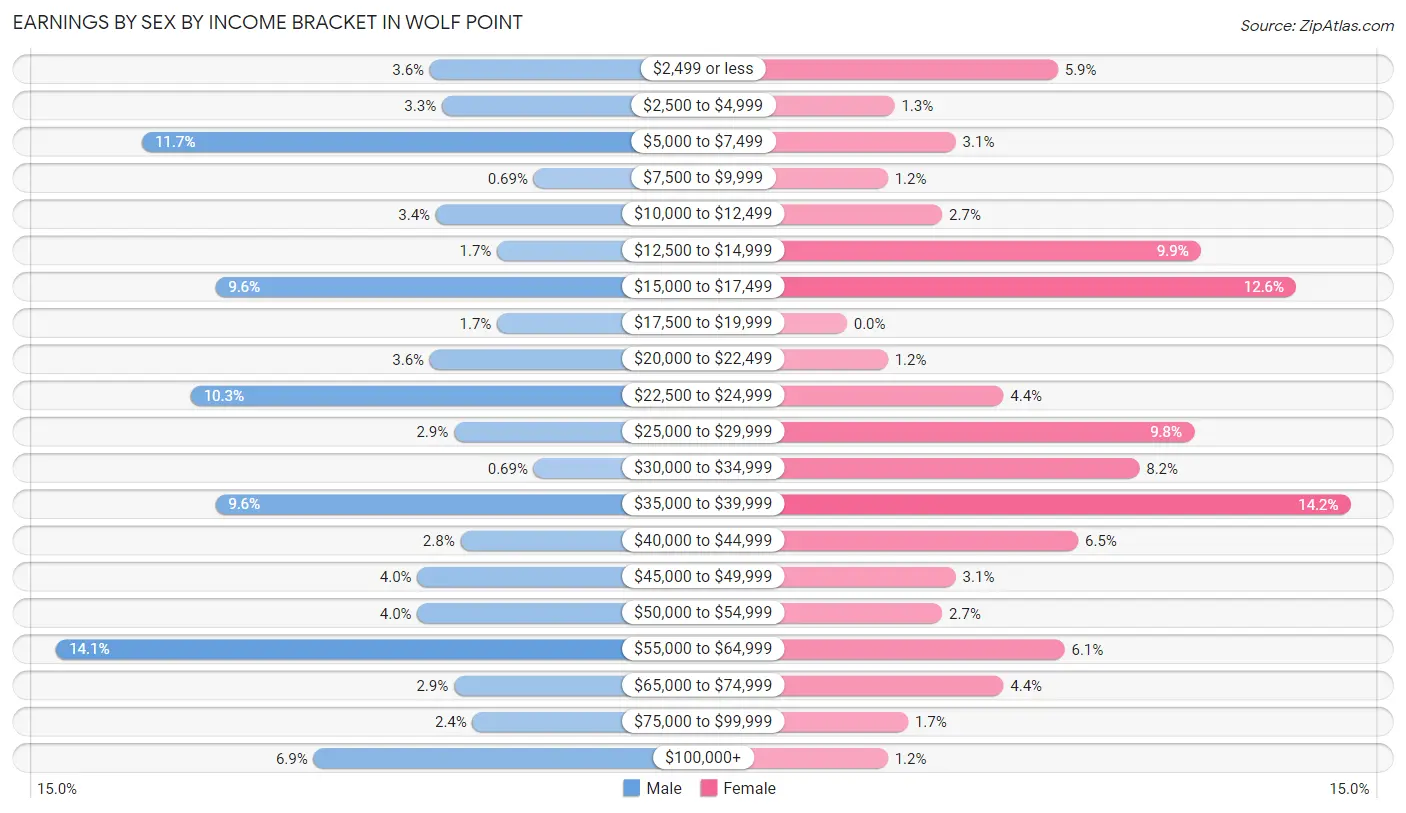
Earnings by Sex by Income Bracket in Wolf Point
The most common earnings brackets in Wolf Point are $55,000 to $64,999 for men (82 | 14.1%) and $35,000 to $39,999 for women (74 | 14.1%).
| Income | Male | Female |
| $2,499 or less | 21 (3.6%) | 31 (5.9%) |
| $2,500 to $4,999 | 19 (3.3%) | 7 (1.3%) |
| $5,000 to $7,499 | 68 (11.7%) | 16 (3.1%) |
| $7,500 to $9,999 | 4 (0.7%) | 6 (1.1%) |
| $10,000 to $12,499 | 20 (3.4%) | 14 (2.7%) |
| $12,500 to $14,999 | 10 (1.7%) | 52 (9.9%) |
| $15,000 to $17,499 | 56 (9.6%) | 66 (12.6%) |
| $17,500 to $19,999 | 10 (1.7%) | 0 (0.0%) |
| $20,000 to $22,499 | 21 (3.6%) | 6 (1.1%) |
| $22,500 to $24,999 | 60 (10.3%) | 23 (4.4%) |
| $25,000 to $29,999 | 17 (2.9%) | 51 (9.8%) |
| $30,000 to $34,999 | 4 (0.7%) | 43 (8.2%) |
| $35,000 to $39,999 | 56 (9.6%) | 74 (14.1%) |
| $40,000 to $44,999 | 16 (2.8%) | 34 (6.5%) |
| $45,000 to $49,999 | 23 (4.0%) | 16 (3.1%) |
| $50,000 to $54,999 | 23 (4.0%) | 14 (2.7%) |
| $55,000 to $64,999 | 82 (14.1%) | 32 (6.1%) |
| $65,000 to $74,999 | 17 (2.9%) | 23 (4.4%) |
| $75,000 to $99,999 | 14 (2.4%) | 9 (1.7%) |
| $100,000+ | 40 (6.9%) | 6 (1.1%) |
| Total | 581 (100.0%) | 523 (100.0%) |
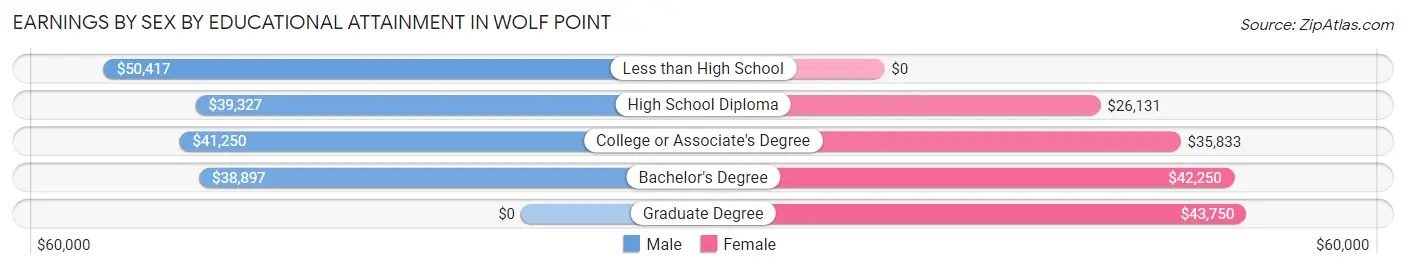
Earnings by Sex by Educational Attainment in Wolf Point
Average earnings in Wolf Point are $39,393 for men and $34,597 for women, a difference of 12.2%. Men with an educational attainment of less than high school enjoy the highest average annual earnings of $50,417, while those with bachelor's degree education earn the least with $38,897. Women with an educational attainment of graduate degree earn the most with the average annual earnings of $43,750, while those with high school diploma education have the smallest earnings of $26,131.
| Educational Attainment | Male Income | Female Income |
| Less than High School | $50,417 | $0 |
| High School Diploma | $39,327 | $26,131 |
| College or Associate's Degree | $41,250 | $35,833 |
| Bachelor's Degree | $38,897 | $42,250 |
| Graduate Degree | - | - |
| Total | $39,393 | $34,597 |
Family Income in Wolf Point
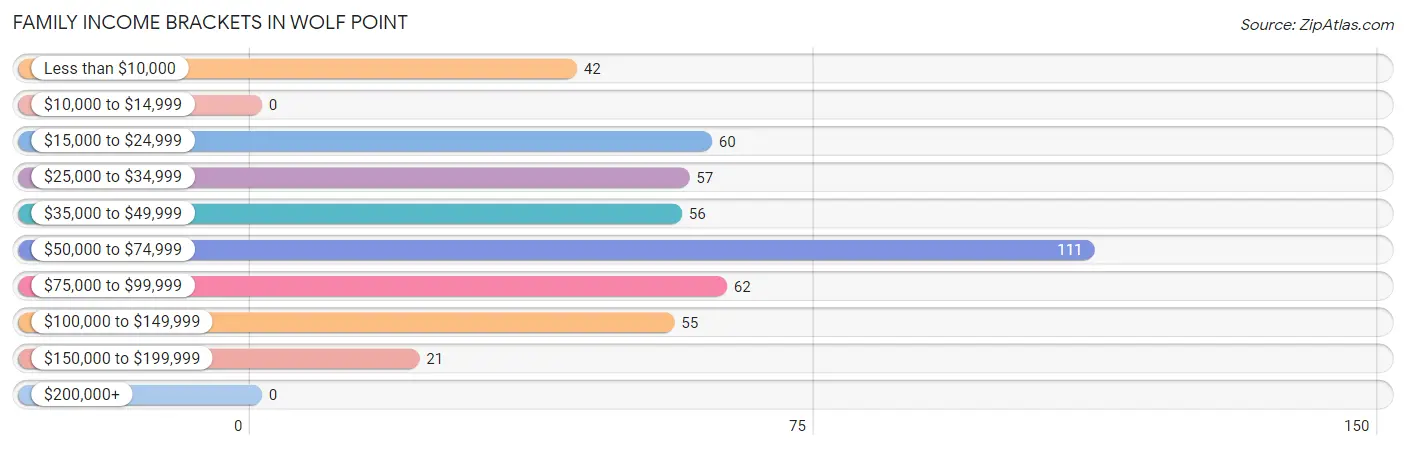
Family Income Brackets in Wolf Point
According to the Wolf Point family income data, there are 111 families falling into the $50,000 to $74,999 income range, which is the most common income bracket and makes up 23.9% of all families.
| Income Bracket | # Families | % Families |
| Less than $10,000 | 42 | 9.1% |
| $10,000 to $14,999 | 0 | 0.0% |
| $15,000 to $24,999 | 60 | 12.9% |
| $25,000 to $34,999 | 57 | 12.3% |
| $35,000 to $49,999 | 56 | 12.1% |
| $50,000 to $74,999 | 111 | 23.9% |
| $75,000 to $99,999 | 62 | 13.4% |
| $100,000 to $149,999 | 55 | 11.9% |
| $150,000 to $199,999 | 21 | 4.5% |
| $200,000+ | 0 | 0.0% |
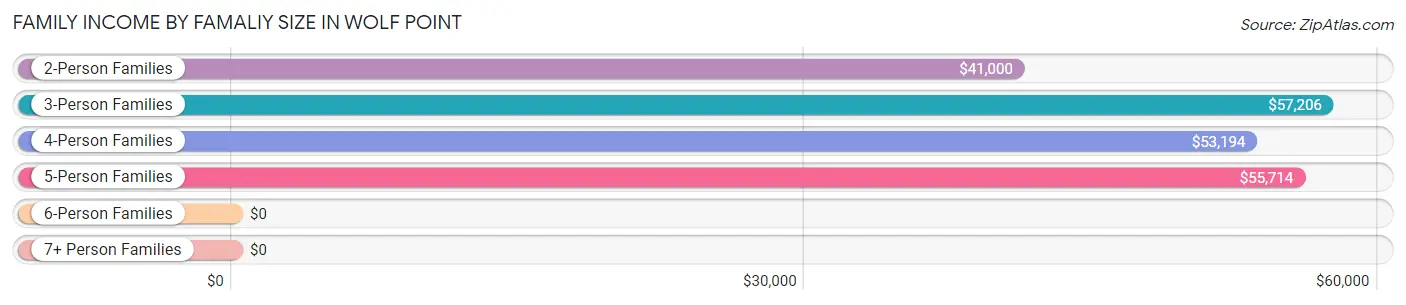
Family Income by Famaliy Size in Wolf Point
3-person families (96 | 20.7%) account for the highest median family income in Wolf Point with $57,206 per family, while 2-person families (230 | 49.6%) have the highest median income of $20,500 per family member.
| Income Bracket | # Families | Median Income |
| 2-Person Families | 230 (49.6%) | $41,000 |
| 3-Person Families | 96 (20.7%) | $57,206 |
| 4-Person Families | 65 (14.0%) | $53,194 |
| 5-Person Families | 54 (11.6%) | $55,714 |
| 6-Person Families | 14 (3.0%) | $0 |
| 7+ Person Families | 5 (1.1%) | $0 |
| Total | 464 (100.0%) | $55,000 |
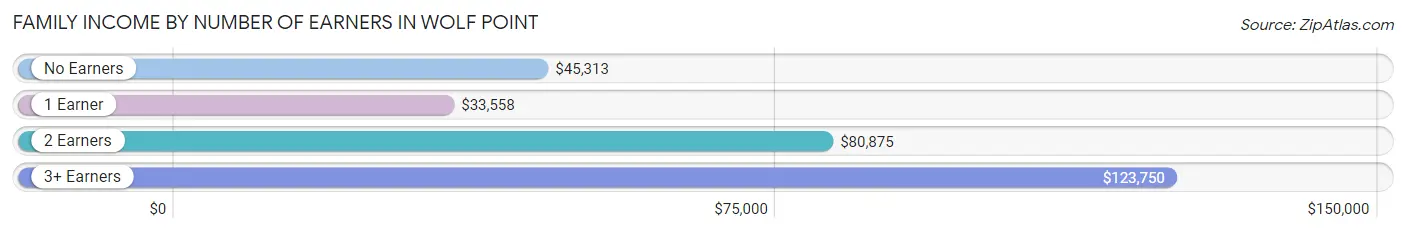
Family Income by Number of Earners in Wolf Point
The median family income in Wolf Point is $55,000, with families comprising 3+ earners (27) having the highest median family income of $123,750, while families with 1 earner (247) have the lowest median family income of $33,558, accounting for 5.8% and 53.2% of families, respectively.
| Number of Earners | # Families | Median Income |
| No Earners | 39 (8.4%) | $45,313 |
| 1 Earner | 247 (53.2%) | $33,558 |
| 2 Earners | 151 (32.5%) | $80,875 |
| 3+ Earners | 27 (5.8%) | $123,750 |
| Total | 464 (100.0%) | $55,000 |
Household Income in Wolf Point
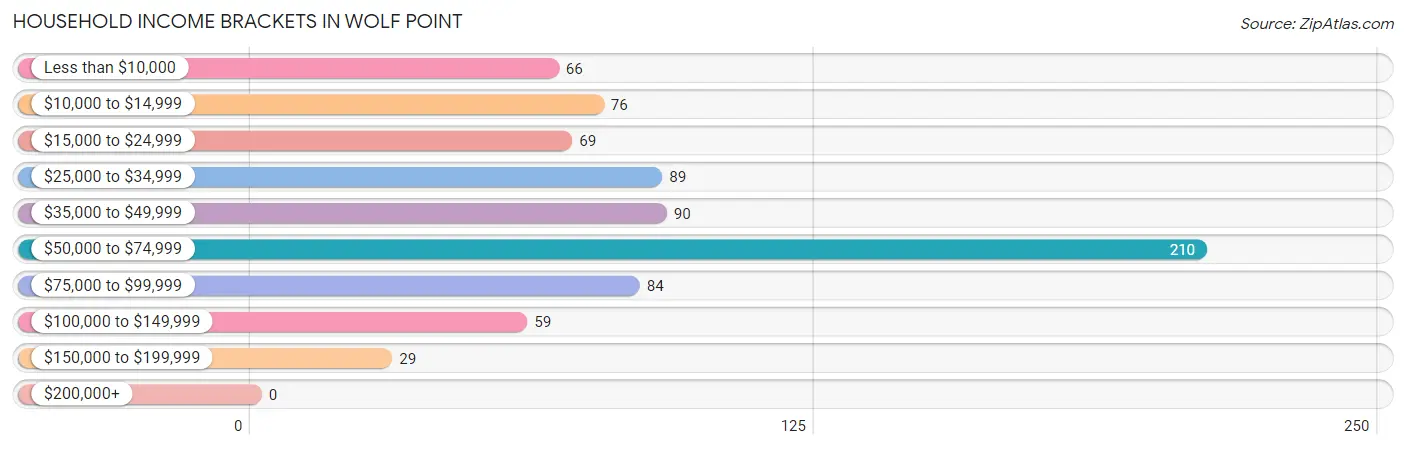
Household Income Brackets in Wolf Point
With 210 households falling in the category, the $50,000 to $74,999 income range is the most frequent in Wolf Point, accounting for 27.2% of all households.
| Income Bracket | # Households | % Households |
| Less than $10,000 | 66 | 8.5% |
| $10,000 to $14,999 | 76 | 9.8% |
| $15,000 to $24,999 | 69 | 8.9% |
| $25,000 to $34,999 | 89 | 11.5% |
| $35,000 to $49,999 | 90 | 11.7% |
| $50,000 to $74,999 | 210 | 27.2% |
| $75,000 to $99,999 | 84 | 10.9% |
| $100,000 to $149,999 | 59 | 7.6% |
| $150,000 to $199,999 | 29 | 3.8% |
| $200,000+ | 0 | 0.0% |
Household Income by Householder Age in Wolf Point
The median household income in Wolf Point is $46,389, with the highest median household income of $55,357 found in the 25 to 44 years age bracket for the primary householder. A total of 352 households (45.6%) fall into this category. Meanwhile, the 15 to 24 years age bracket for the primary householder has the lowest median household income of $33,750, with 39 households (5.1%) in this group.
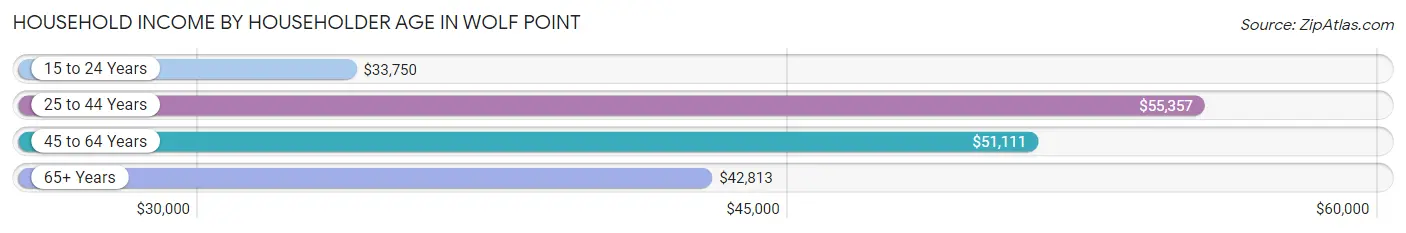
| Income Bracket | # Households | Median Income |
| 15 to 24 Years | 39 (5.1%) | $33,750 |
| 25 to 44 Years | 352 (45.6%) | $55,357 |
| 45 to 64 Years | 206 (26.7%) | $51,111 |
| 65+ Years | 175 (22.7%) | $42,813 |
| Total | 772 (100.0%) | $46,389 |
Poverty in Wolf Point
Income Below Poverty by Sex and Age in Wolf Point
With 24.6% poverty level for males and 32.9% for females among the residents of Wolf Point, 16 and 17 year old males and 18 to 24 year old females are the most vulnerable to poverty, with 28 males (73.7%) and 115 females (68.9%) in their respective age groups living below the poverty level.
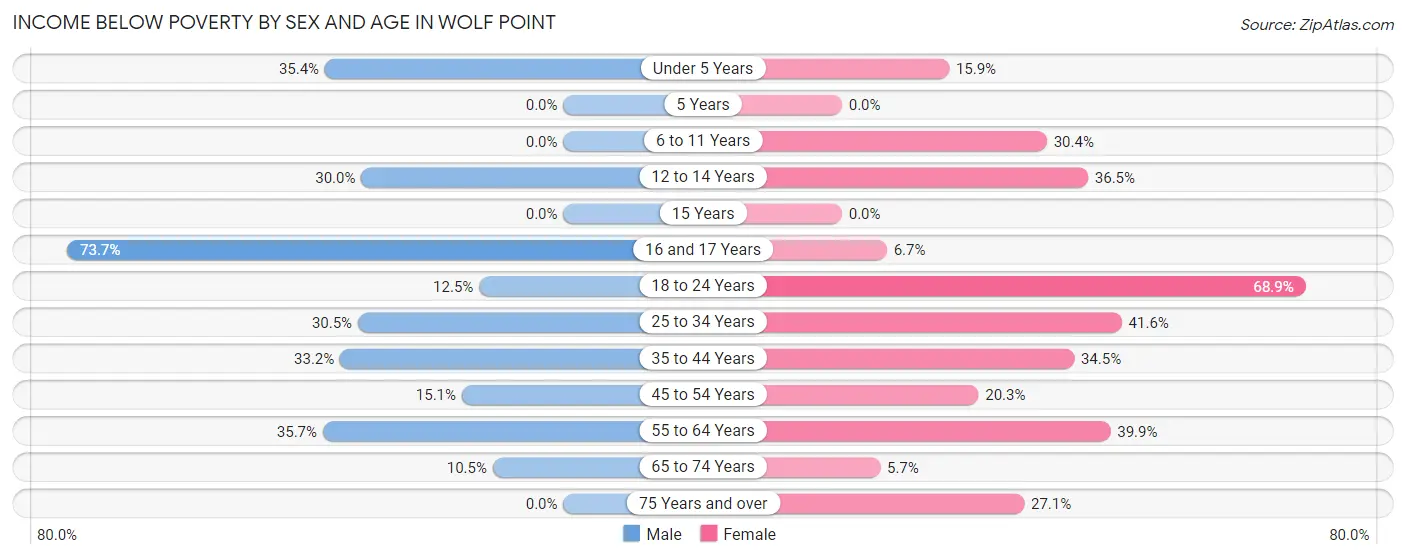
| Age Bracket | Male | Female |
| Under 5 Years | 57 (35.4%) | 14 (15.9%) |
| 5 Years | 0 (0.0%) | 0 (0.0%) |
| 6 to 11 Years | 0 (0.0%) | 28 (30.4%) |
| 12 to 14 Years | 24 (30.0%) | 19 (36.5%) |
| 15 Years | 0 (0.0%) | 0 (0.0%) |
| 16 and 17 Years | 28 (73.7%) | 8 (6.7%) |
| 18 to 24 Years | 20 (12.5%) | 115 (68.9%) |
| 25 to 34 Years | 61 (30.5%) | 64 (41.6%) |
| 35 to 44 Years | 59 (33.2%) | 50 (34.5%) |
| 45 to 54 Years | 11 (15.1%) | 15 (20.3%) |
| 55 to 64 Years | 35 (35.7%) | 63 (39.9%) |
| 65 to 74 Years | 11 (10.5%) | 5 (5.7%) |
| 75 Years and over | 0 (0.0%) | 23 (27.1%) |
| Total | 306 (24.6%) | 404 (32.9%) |
Income Above Poverty by Sex and Age in Wolf Point
According to the poverty statistics in Wolf Point, males aged 5 years and females aged 5 years are the age groups that are most secure financially, with 100.0% of males and 100.0% of females in these age groups living above the poverty line.
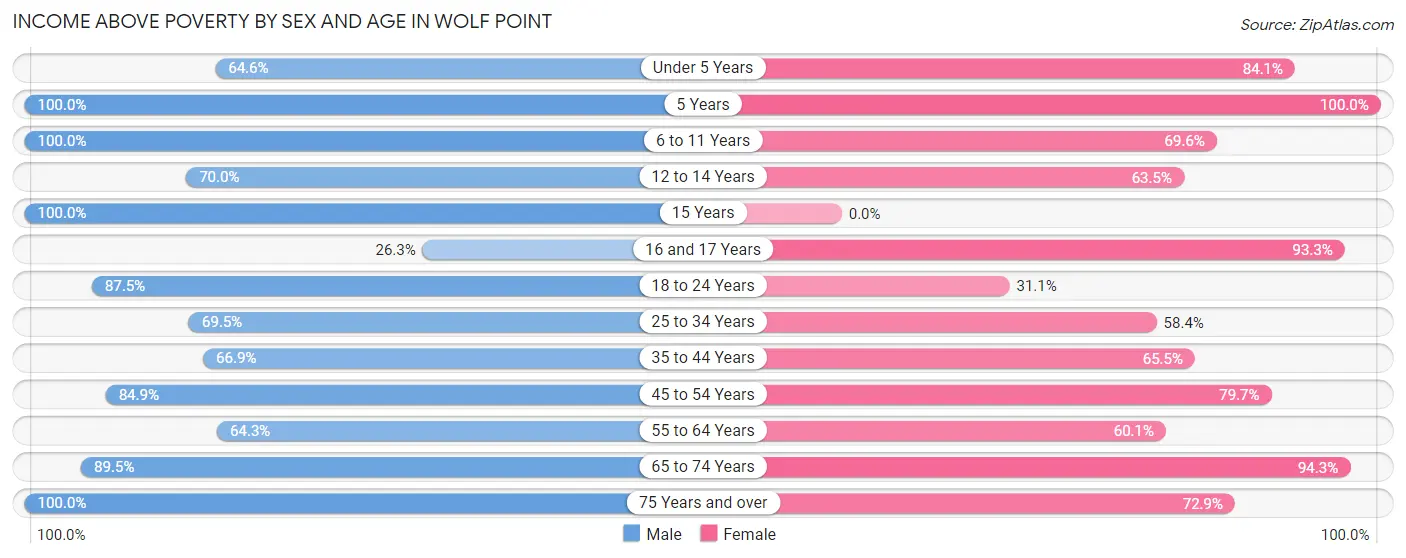
| Age Bracket | Male | Female |
| Under 5 Years | 104 (64.6%) | 74 (84.1%) |
| 5 Years | 17 (100.0%) | 7 (100.0%) |
| 6 to 11 Years | 75 (100.0%) | 64 (69.6%) |
| 12 to 14 Years | 56 (70.0%) | 33 (63.5%) |
| 15 Years | 39 (100.0%) | 0 (0.0%) |
| 16 and 17 Years | 10 (26.3%) | 112 (93.3%) |
| 18 to 24 Years | 140 (87.5%) | 52 (31.1%) |
| 25 to 34 Years | 139 (69.5%) | 90 (58.4%) |
| 35 to 44 Years | 119 (66.8%) | 95 (65.5%) |
| 45 to 54 Years | 62 (84.9%) | 59 (79.7%) |
| 55 to 64 Years | 63 (64.3%) | 95 (60.1%) |
| 65 to 74 Years | 94 (89.5%) | 83 (94.3%) |
| 75 Years and over | 21 (100.0%) | 62 (72.9%) |
| Total | 939 (75.4%) | 826 (67.1%) |
Income Below Poverty Among Married-Couple Families in Wolf Point
The poverty statistics for married-couple families in Wolf Point show that 10.4% or 26 of the total 250 families live below the poverty line. Families with 1 or 2 children have the highest poverty rate of 24.7%, comprising of 21 families. On the other hand, families with 3 or 4 children have the lowest poverty rate of 0.0%, which includes 0 families.
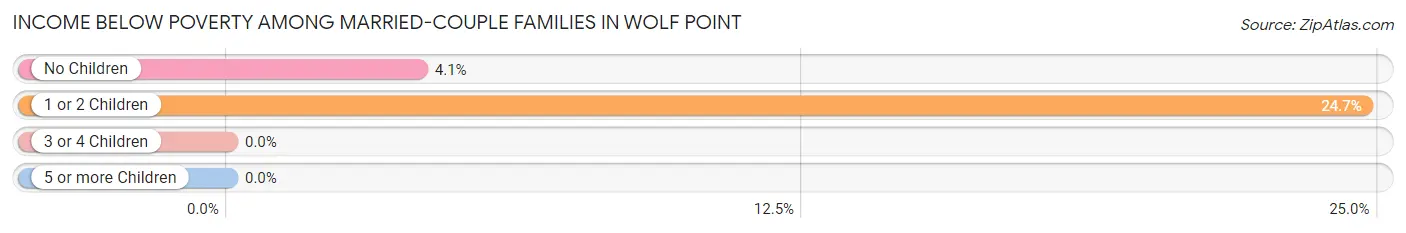
| Children | Above Poverty | Below Poverty |
| No Children | 116 (95.9%) | 5 (4.1%) |
| 1 or 2 Children | 64 (75.3%) | 21 (24.7%) |
| 3 or 4 Children | 44 (100.0%) | 0 (0.0%) |
| 5 or more Children | 0 (0.0%) | 0 (0.0%) |
| Total | 224 (89.6%) | 26 (10.4%) |
Income Below Poverty Among Single-Parent Households in Wolf Point
According to the poverty data in Wolf Point, 54.0% or 40 single-father households and 42.9% or 60 single-mother households are living below the poverty line. Among single-father households, those with 3 or 4 children have the highest poverty rate, with 9 households (100.0%) experiencing poverty. Likewise, among single-mother households, those with no children have the highest poverty rate, with 39 households (70.9%) falling below the poverty line.
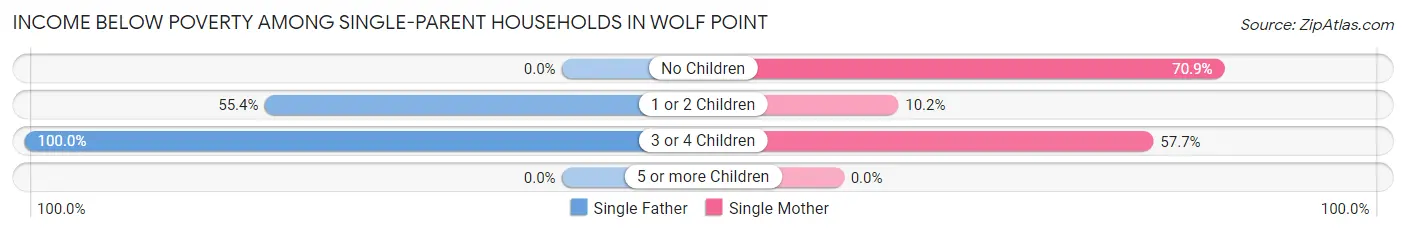
| Children | Single Father | Single Mother |
| No Children | 0 (0.0%) | 39 (70.9%) |
| 1 or 2 Children | 31 (55.4%) | 6 (10.2%) |
| 3 or 4 Children | 9 (100.0%) | 15 (57.7%) |
| 5 or more Children | 0 (0.0%) | 0 (0.0%) |
| Total | 40 (54.0%) | 60 (42.9%) |
Income Below Poverty Among Married-Couple vs Single-Parent Households in Wolf Point
The poverty data for Wolf Point shows that 26 of the married-couple family households (10.4%) and 100 of the single-parent households (46.7%) are living below the poverty level. Within the married-couple family households, those with 1 or 2 children have the highest poverty rate, with 21 households (24.7%) falling below the poverty line. Among the single-parent households, those with 3 or 4 children have the highest poverty rate, with 24 household (68.6%) living below poverty.
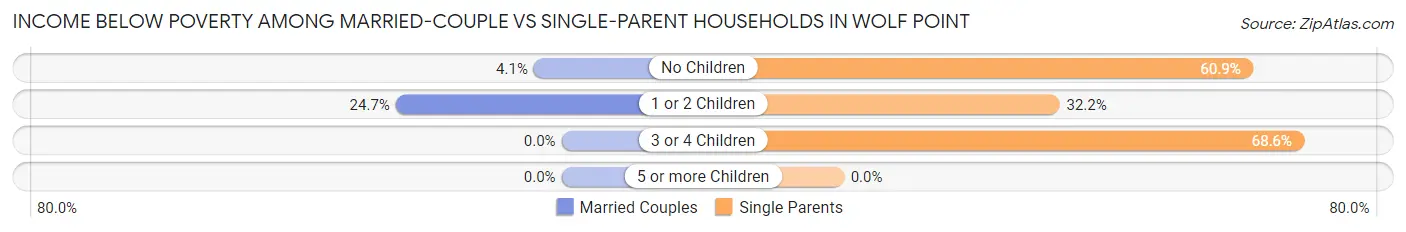
| Children | Married-Couple Families | Single-Parent Households |
| No Children | 5 (4.1%) | 39 (60.9%) |
| 1 or 2 Children | 21 (24.7%) | 37 (32.2%) |
| 3 or 4 Children | 0 (0.0%) | 24 (68.6%) |
| 5 or more Children | 0 (0.0%) | 0 (0.0%) |
| Total | 26 (10.4%) | 100 (46.7%) |
Race in Wolf Point
The most populous races in Wolf Point are Native / Alaskan (1,360 | 51.6%), White / Caucasian (802 | 30.4%), and Two or more Races (397 | 15.1%).
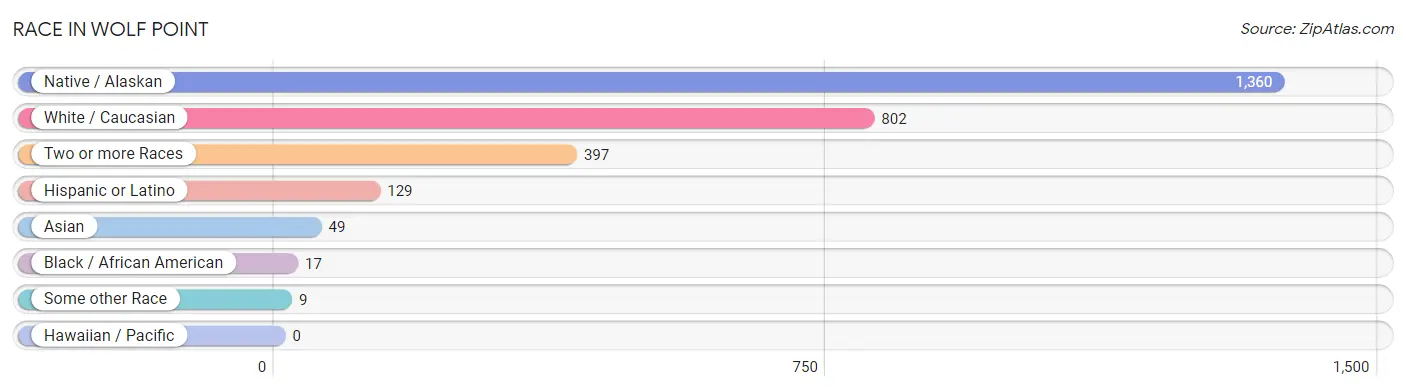
| Race | # Population | % Population |
| Asian | 49 | 1.9% |
| Black / African American | 17 | 0.6% |
| Hawaiian / Pacific | 0 | 0.0% |
| Hispanic or Latino | 129 | 4.9% |
| Native / Alaskan | 1,360 | 51.6% |
| White / Caucasian | 802 | 30.4% |
| Two or more Races | 397 | 15.1% |
| Some other Race | 9 | 0.3% |
| Total | 2,634 | 100.0% |
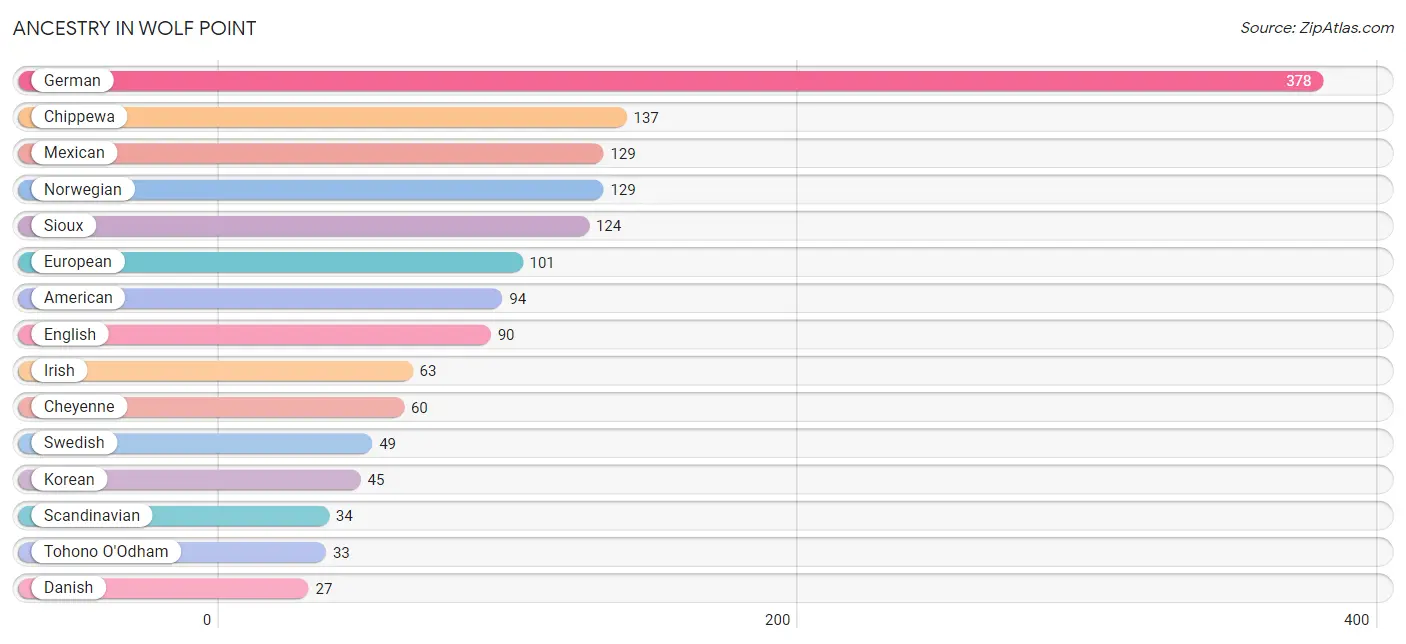
Ancestry in Wolf Point
The most populous ancestries reported in Wolf Point are German (378 | 14.3%), Chippewa (137 | 5.2%), Mexican (129 | 4.9%), Norwegian (129 | 4.9%), and Sioux (124 | 4.7%), together accounting for 34.1% of all Wolf Point residents.
| Ancestry | # Population | % Population |
| American | 94 | 3.6% |
| Australian | 3 | 0.1% |
| Austrian | 4 | 0.2% |
| Belgian | 5 | 0.2% |
| Bhutanese | 9 | 0.3% |
| Blackfeet | 4 | 0.2% |
| Brazilian | 6 | 0.2% |
| Burmese | 6 | 0.2% |
| Cheyenne | 60 | 2.3% |
| Chippewa | 137 | 5.2% |
| Choctaw | 5 | 0.2% |
| Crow | 12 | 0.5% |
| Czechoslovakian | 4 | 0.2% |
| Danish | 27 | 1.0% |
| Dutch | 13 | 0.5% |
| English | 90 | 3.4% |
| European | 101 | 3.8% |
| French | 21 | 0.8% |
| French Canadian | 24 | 0.9% |
| German | 378 | 14.3% |
| Hungarian | 5 | 0.2% |
| Irish | 63 | 2.4% |
| Italian | 9 | 0.3% |
| Korean | 45 | 1.7% |
| Mexican | 129 | 4.9% |
| Navajo | 6 | 0.2% |
| Northern European | 5 | 0.2% |
| Norwegian | 129 | 4.9% |
| Polish | 5 | 0.2% |
| Russian | 10 | 0.4% |
| Scandinavian | 34 | 1.3% |
| Scottish | 17 | 0.6% |
| Sioux | 124 | 4.7% |
| Swedish | 49 | 1.9% |
| Swiss | 4 | 0.2% |
| Tohono O'Odham | 33 | 1.3% |
| Ukrainian | 3 | 0.1% |
| Welsh | 5 | 0.2% | View All 38 Rows |
Immigrants in Wolf Point
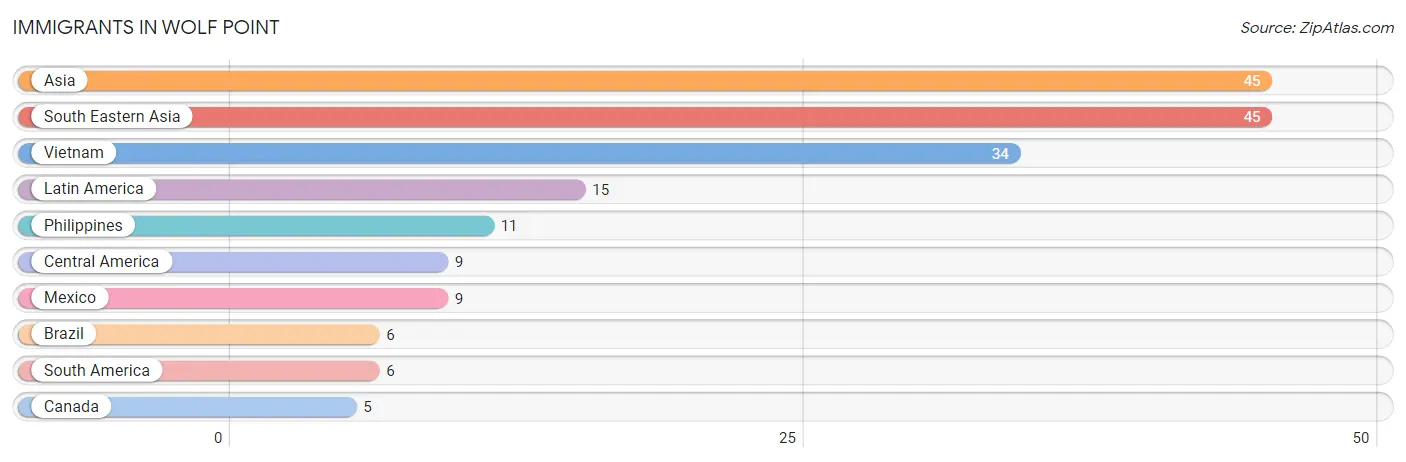
The most numerous immigrant groups reported in Wolf Point came from Asia (45 | 1.7%), South Eastern Asia (45 | 1.7%), Vietnam (34 | 1.3%), Latin America (15 | 0.6%), and Philippines (11 | 0.4%), together accounting for 5.7% of all Wolf Point residents.
| Immigration Origin | # Population | % Population |
| Asia | 45 | 1.7% |
| Brazil | 6 | 0.2% |
| Canada | 5 | 0.2% |
| Central America | 9 | 0.3% |
| Latin America | 15 | 0.6% |
| Mexico | 9 | 0.3% |
| Philippines | 11 | 0.4% |
| South America | 6 | 0.2% |
| South Eastern Asia | 45 | 1.7% |
| Vietnam | 34 | 1.3% | View All 10 Rows |
Sex and Age in Wolf Point
Sex and Age in Wolf Point
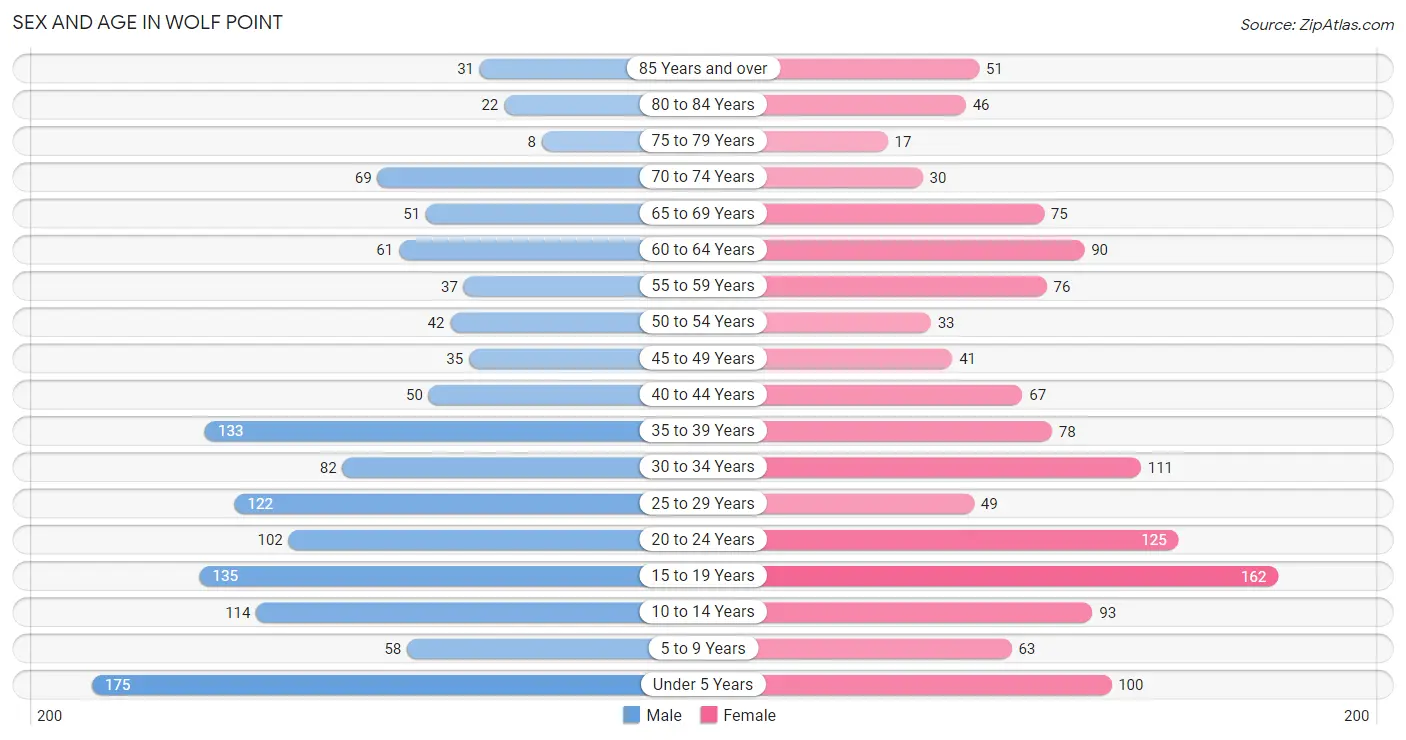
The most populous age groups in Wolf Point are Under 5 Years (175 | 13.2%) for men and 15 to 19 Years (162 | 12.4%) for women.
| Age Bracket | Male | Female |
| Under 5 Years | 175 (13.2%) | 100 (7.6%) |
| 5 to 9 Years | 58 (4.4%) | 63 (4.8%) |
| 10 to 14 Years | 114 (8.6%) | 93 (7.1%) |
| 15 to 19 Years | 135 (10.2%) | 162 (12.4%) |
| 20 to 24 Years | 102 (7.7%) | 125 (9.6%) |
| 25 to 29 Years | 122 (9.2%) | 49 (3.7%) |
| 30 to 34 Years | 82 (6.2%) | 111 (8.5%) |
| 35 to 39 Years | 133 (10.0%) | 78 (6.0%) |
| 40 to 44 Years | 50 (3.8%) | 67 (5.1%) |
| 45 to 49 Years | 35 (2.6%) | 41 (3.1%) |
| 50 to 54 Years | 42 (3.2%) | 33 (2.5%) |
| 55 to 59 Years | 37 (2.8%) | 76 (5.8%) |
| 60 to 64 Years | 61 (4.6%) | 90 (6.9%) |
| 65 to 69 Years | 51 (3.8%) | 75 (5.7%) |
| 70 to 74 Years | 69 (5.2%) | 30 (2.3%) |
| 75 to 79 Years | 8 (0.6%) | 17 (1.3%) |
| 80 to 84 Years | 22 (1.7%) | 46 (3.5%) |
| 85 Years and over | 31 (2.3%) | 51 (3.9%) |
| Total | 1,327 (100.0%) | 1,307 (100.0%) |
Families and Households in Wolf Point
Median Family Size in Wolf Point
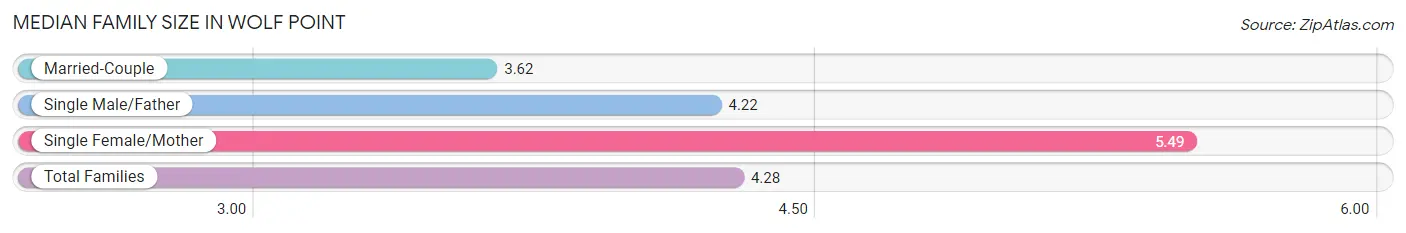
The median family size in Wolf Point is 4.28 persons per family, with single female/mother families (140 | 30.2%) accounting for the largest median family size of 5.49 persons per family. On the other hand, married-couple families (250 | 53.9%) represent the smallest median family size with 3.62 persons per family.
| Family Type | # Families | Family Size |
| Married-Couple | 250 (53.9%) | 3.62 |
| Single Male/Father | 74 (16.0%) | 4.22 |
| Single Female/Mother | 140 (30.2%) | 5.49 |
| Total Families | 464 (100.0%) | 4.28 |
Median Household Size in Wolf Point
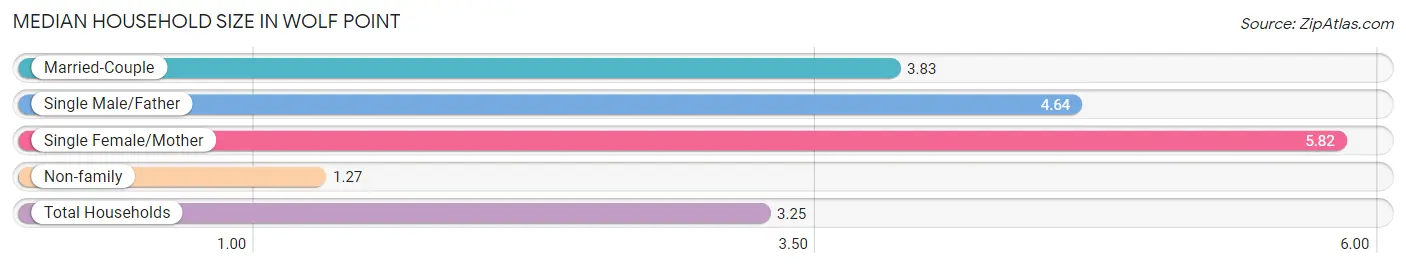
The median household size in Wolf Point is 3.25 persons per household, with single female/mother households (140 | 18.1%) accounting for the largest median household size of 5.82 persons per household. non-family households (308 | 39.9%) represent the smallest median household size with 1.27 persons per household.
| Household Type | # Households | Household Size |
| Married-Couple | 250 (32.4%) | 3.83 |
| Single Male/Father | 74 (9.6%) | 4.64 |
| Single Female/Mother | 140 (18.1%) | 5.82 |
| Non-family | 308 (39.9%) | 1.27 |
| Total Households | 772 (100.0%) | 3.25 |
Household Size by Marriage Status in Wolf Point
Out of a total of 772 households in Wolf Point, 464 (60.1%) are family households, while 308 (39.9%) are nonfamily households. The most numerous type of family households are 2-person households, comprising 178, and the most common type of nonfamily households are 1-person households, comprising 279.
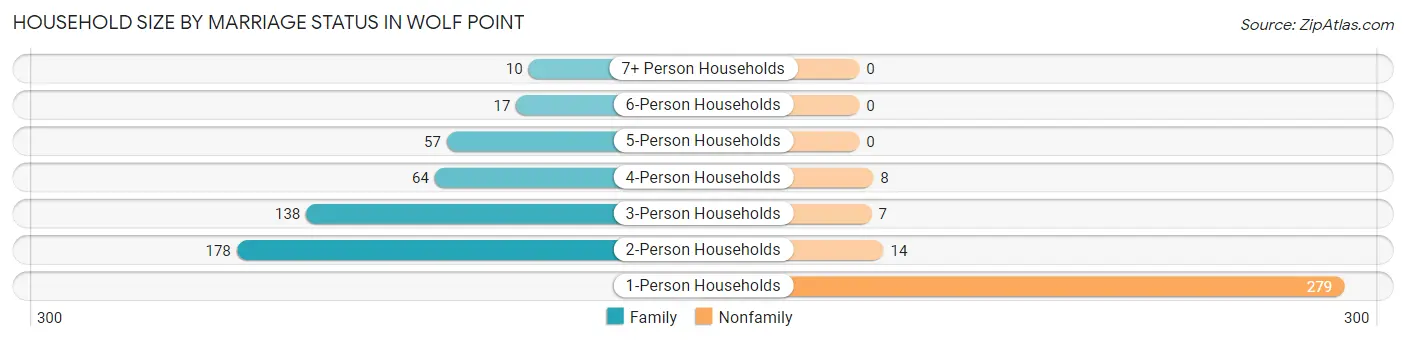
| Household Size | Family Households | Nonfamily Households |
| 1-Person Households | - | 279 (36.1%) |
| 2-Person Households | 178 (23.1%) | 14 (1.8%) |
| 3-Person Households | 138 (17.9%) | 7 (0.9%) |
| 4-Person Households | 64 (8.3%) | 8 (1.0%) |
| 5-Person Households | 57 (7.4%) | 0 (0.0%) |
| 6-Person Households | 17 (2.2%) | 0 (0.0%) |
| 7+ Person Households | 10 (1.3%) | 0 (0.0%) |
| Total | 464 (60.1%) | 308 (39.9%) |
Female Fertility in Wolf Point
Fertility by Age in Wolf Point
Average fertility rate in Wolf Point is 34.0 births per 1,000 women. Women in the age bracket of 35 to 50 years have the highest fertility rate with 54.0 births per 1,000 women. Women in the age bracket of 20 to 34 years acount for 50.0% of all women with births.
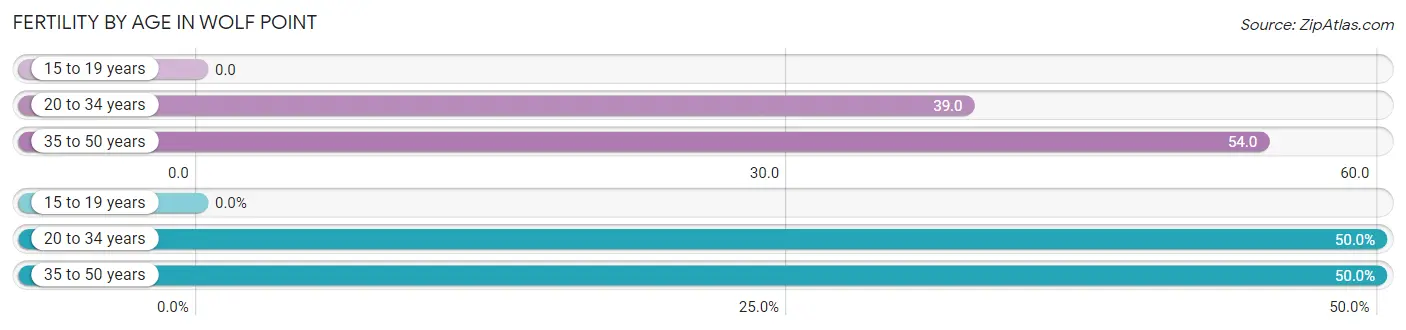
| Age Bracket | Women with Births | Births / 1,000 Women |
| 15 to 19 years | 0 (0.0%) | 0.0 |
| 20 to 34 years | 11 (50.0%) | 39.0 |
| 35 to 50 years | 11 (50.0%) | 54.0 |
| Total | 22 (100.0%) | 34.0 |
Fertility by Age by Marriage Status in Wolf Point
50.0% of women with births (22) in Wolf Point are married. The highest percentage of unmarried women with births falls into 20 to 34 years age bracket with 100.0% of them unmarried at the time of birth, while the lowest percentage of unmarried women with births belong to 35 to 50 years age bracket with 0.0% of them unmarried.
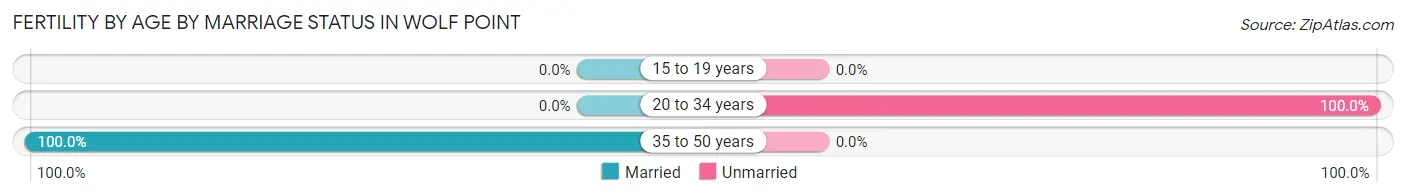
| Age Bracket | Married | Unmarried |
| 15 to 19 years | 0 (0.0%) | 0 (0.0%) |
| 20 to 34 years | 0 (0.0%) | 11 (100.0%) |
| 35 to 50 years | 11 (100.0%) | 0 (0.0%) |
| Total | 11 (50.0%) | 11 (50.0%) |
Fertility by Education in Wolf Point
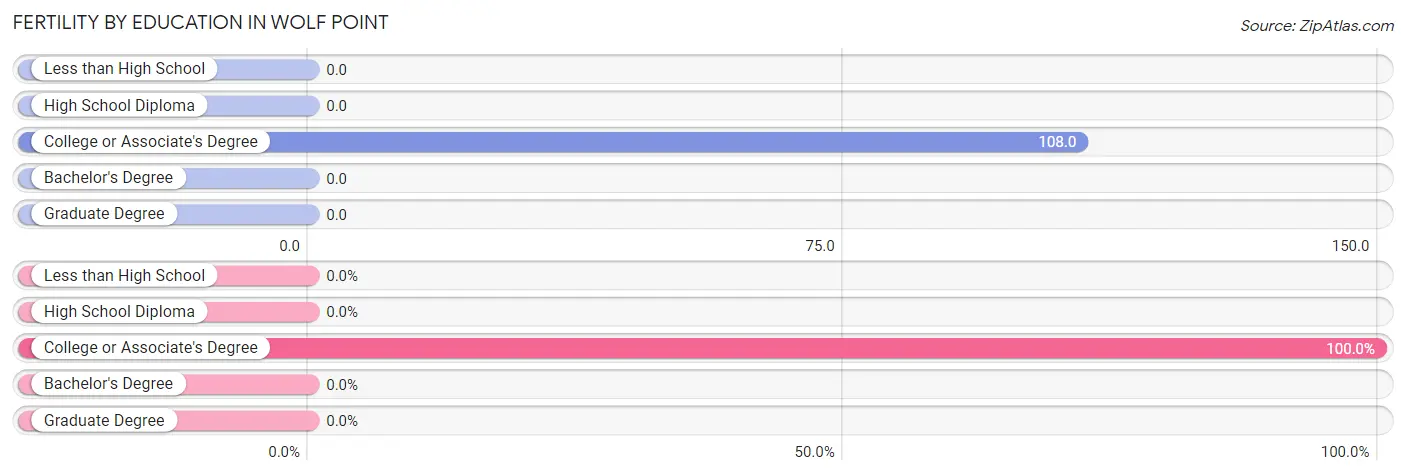
| Educational Attainment | Women with Births | Births / 1,000 Women |
| Less than High School | 0 (0.0%) | 0.0 |
| High School Diploma | 0 (0.0%) | 0.0 |
| College or Associate's Degree | 22 (100.0%) | 108.0 |
| Bachelor's Degree | 0 (0.0%) | 0.0 |
| Graduate Degree | 0 (0.0%) | 0.0 |
| Total | 22 (100.0%) | 34.0 |
Fertility by Education by Marriage Status in Wolf Point
50.0% of women with births in Wolf Point are unmarried. Women with the educational attainment of college or associate's degree are most likely to be married with 50.0% of them married at childbirth, while women with the educational attainment of college or associate's degree are least likely to be married with 50.0% of them unmarried at childbirth.
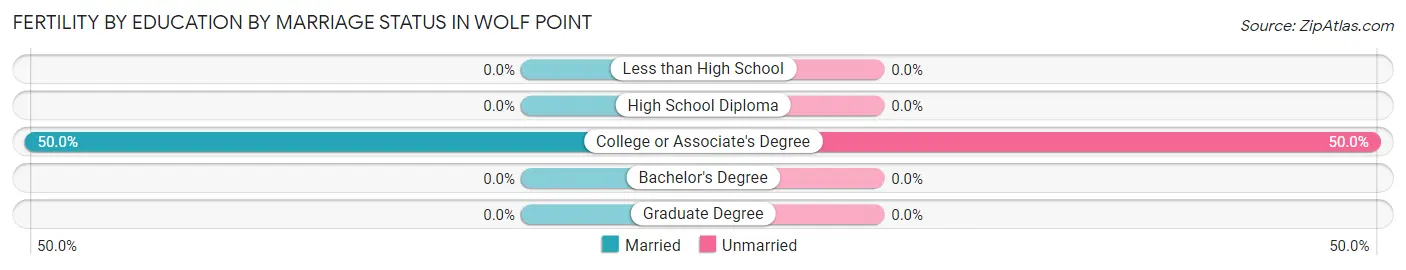
| Educational Attainment | Married | Unmarried |
| Less than High School | 0 (0.0%) | 0 (0.0%) |
| High School Diploma | 0 (0.0%) | 0 (0.0%) |
| College or Associate's Degree | 11 (50.0%) | 11 (50.0%) |
| Bachelor's Degree | 0 (0.0%) | 0 (0.0%) |
| Graduate Degree | 0 (0.0%) | 0 (0.0%) |
| Total | 11 (50.0%) | 11 (50.0%) |
Employment Characteristics in Wolf Point
Employment by Class of Employer in Wolf Point
Among the 912 employed individuals in Wolf Point, private company employees (502 | 55.0%), local government employees (137 | 15.0%), and state government employees (74 | 8.1%) make up the most common classes of employment.
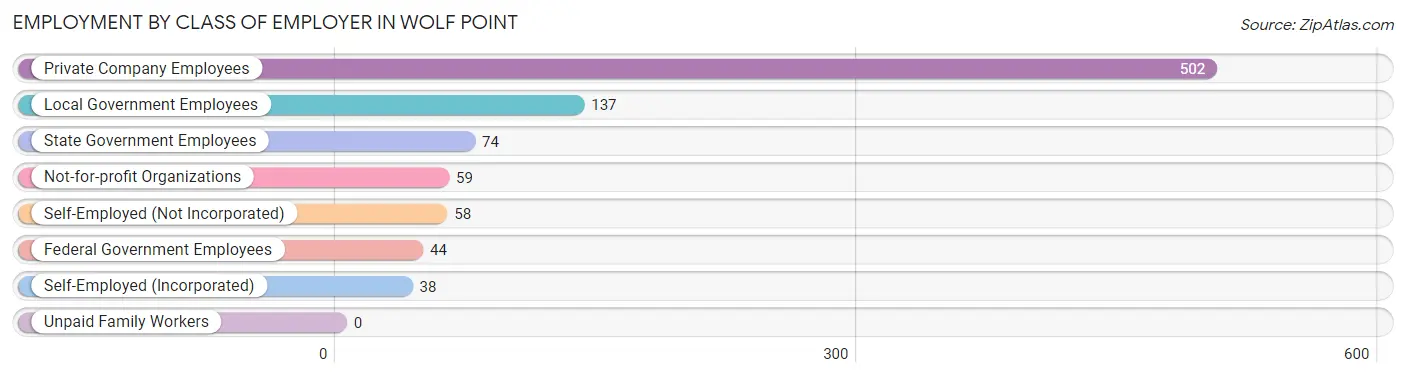
| Employer Class | # Employees | % Employees |
| Private Company Employees | 502 | 55.0% |
| Self-Employed (Incorporated) | 38 | 4.2% |
| Self-Employed (Not Incorporated) | 58 | 6.4% |
| Not-for-profit Organizations | 59 | 6.5% |
| Local Government Employees | 137 | 15.0% |
| State Government Employees | 74 | 8.1% |
| Federal Government Employees | 44 | 4.8% |
| Unpaid Family Workers | 0 | 0.0% |
| Total | 912 | 100.0% |
Employment Status by Age in Wolf Point
According to the labor force statistics for Wolf Point, out of the total population over 16 years of age (1,992), 56.1% or 1,118 individuals are in the labor force, with 16.6% or 186 of them unemployed. The age group with the highest labor force participation rate is 35 to 44 years, with 94.2% or 309 individuals in the labor force. Within the labor force, the 35 to 44 years age range has the highest percentage of unemployed individuals, with 37.9% or 117 of them being unemployed.
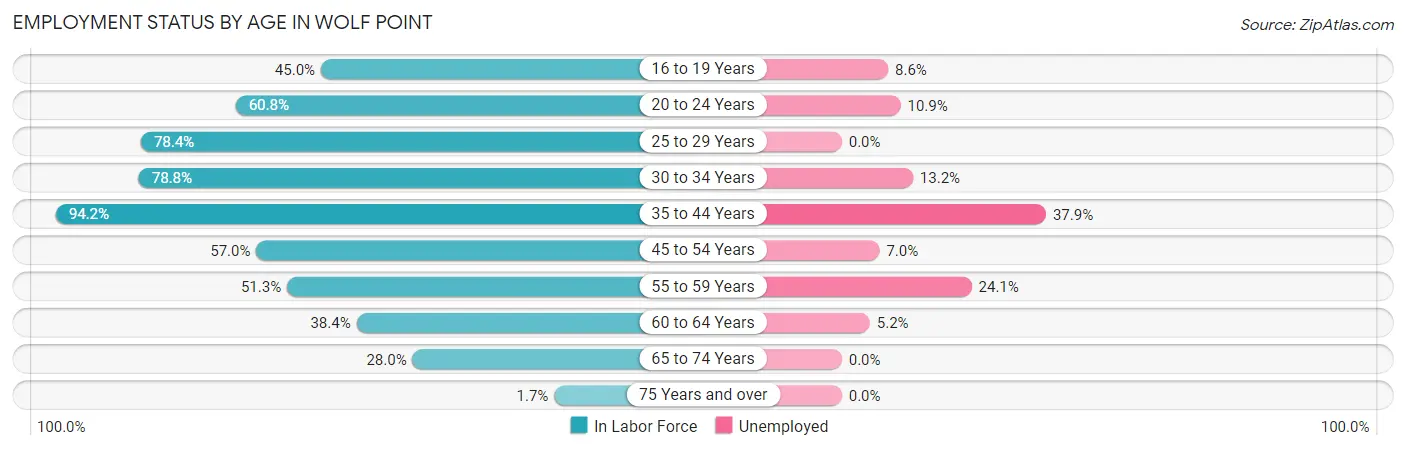
| Age Bracket | In Labor Force | Unemployed |
| 16 to 19 Years | 116 (45.0%) | 10 (8.6%) |
| 20 to 24 Years | 138 (60.8%) | 15 (10.9%) |
| 25 to 29 Years | 134 (78.4%) | 0 (0.0%) |
| 30 to 34 Years | 152 (78.8%) | 20 (13.2%) |
| 35 to 44 Years | 309 (94.2%) | 117 (37.9%) |
| 45 to 54 Years | 86 (57.0%) | 6 (7.0%) |
| 55 to 59 Years | 58 (51.3%) | 14 (24.1%) |
| 60 to 64 Years | 58 (38.4%) | 3 (5.2%) |
| 65 to 74 Years | 63 (28.0%) | 0 (0.0%) |
| 75 Years and over | 3 (1.7%) | 0 (0.0%) |
| Total | 1,118 (56.1%) | 186 (16.6%) |
Employment Status by Educational Attainment in Wolf Point
According to labor force statistics for Wolf Point, 72.0% of individuals (797) out of the total population between 25 and 64 years of age (1,107) are in the labor force, with 20.1% or 160 of them being unemployed. The group with the highest labor force participation rate are those with the educational attainment of bachelor's degree or higher, with 95.8% or 136 individuals in the labor force. Within the labor force, individuals with less than high school education have the highest percentage of unemployment, with 56.3% or 9 of them being unemployed.
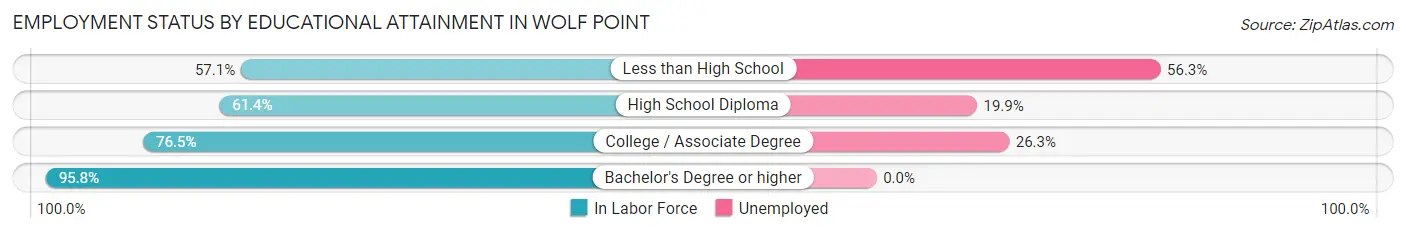
| Educational Attainment | In Labor Force | Unemployed |
| Less than High School | 16 (57.1%) | 16 (56.3%) |
| High School Diploma | 291 (61.4%) | 94 (19.9%) |
| College / Associate Degree | 354 (76.5%) | 122 (26.3%) |
| Bachelor's Degree or higher | 136 (95.8%) | 0 (0.0%) |
| Total | 797 (72.0%) | 223 (20.1%) |
Employment Occupations by Sex in Wolf Point
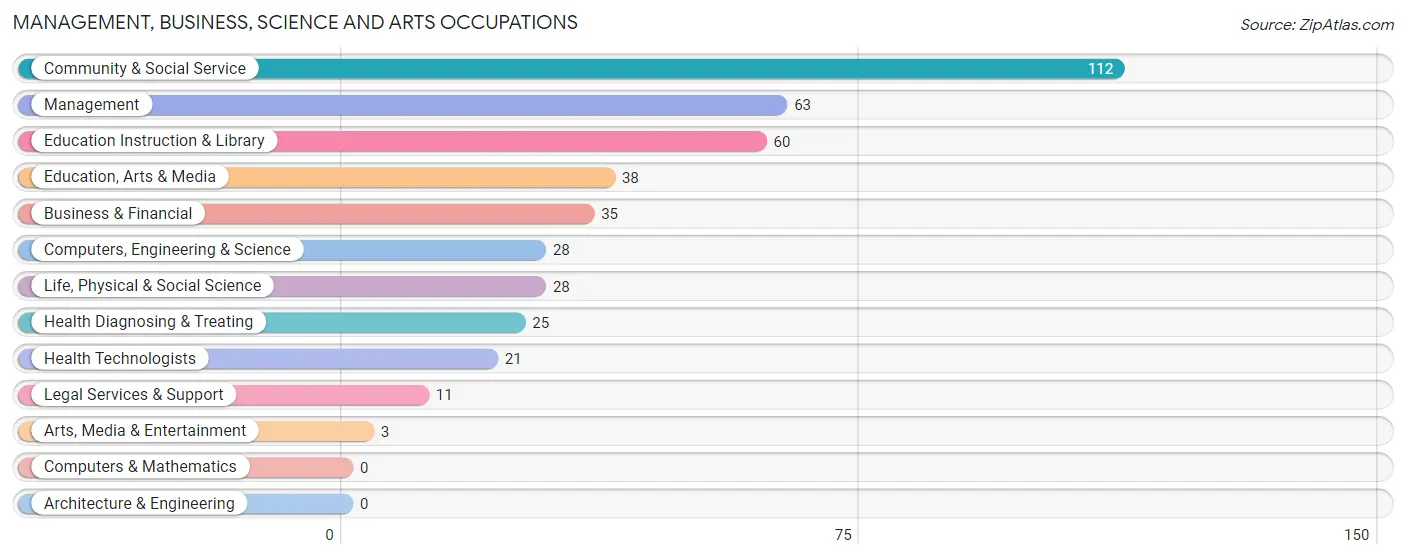
Management, Business, Science and Arts Occupations
The most common Management, Business, Science and Arts occupations in Wolf Point are Community & Social Service (112 | 12.0%), Management (63 | 6.8%), Education Instruction & Library (60 | 6.4%), Education, Arts & Media (38 | 4.1%), and Business & Financial (35 | 3.8%).
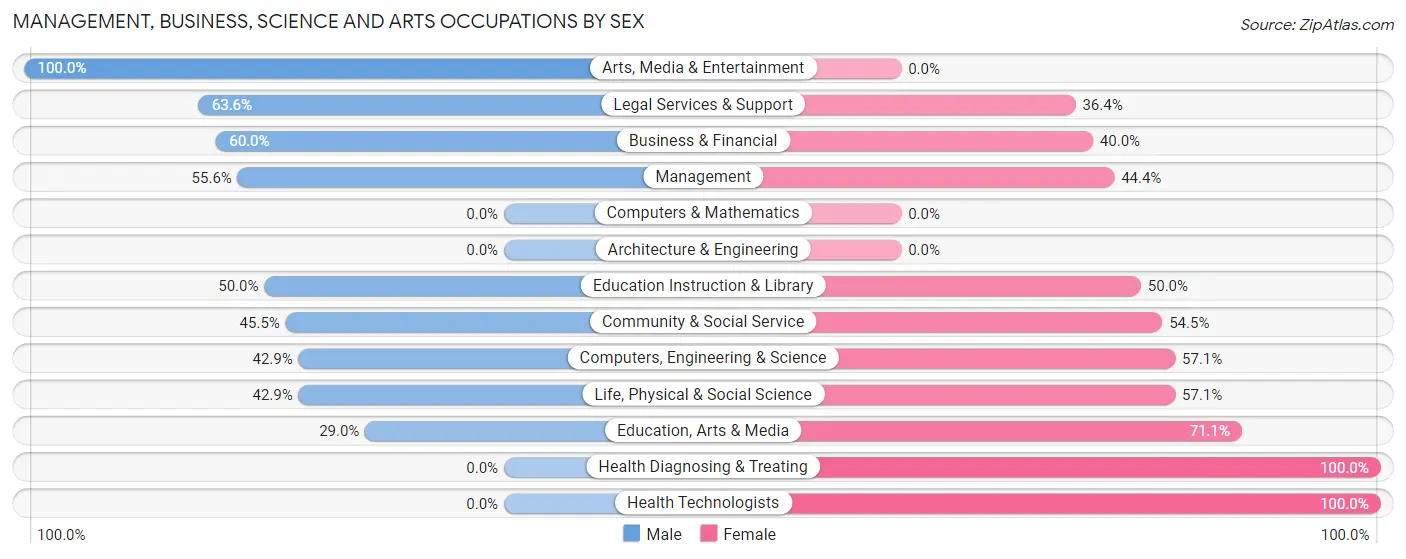
Management, Business, Science and Arts Occupations by Sex
Within the Management, Business, Science and Arts occupations in Wolf Point, the most male-oriented occupations are Arts, Media & Entertainment (100.0%), Legal Services & Support (63.6%), and Business & Financial (60.0%), while the most female-oriented occupations are Health Diagnosing & Treating (100.0%), Health Technologists (100.0%), and Education, Arts & Media (71.1%).
| Occupation | Male | Female |
| Management | 35 (55.6%) | 28 (44.4%) |
| Business & Financial | 21 (60.0%) | 14 (40.0%) |
| Computers, Engineering & Science | 12 (42.9%) | 16 (57.1%) |
| Computers & Mathematics | 0 (0.0%) | 0 (0.0%) |
| Architecture & Engineering | 0 (0.0%) | 0 (0.0%) |
| Life, Physical & Social Science | 12 (42.9%) | 16 (57.1%) |
| Community & Social Service | 51 (45.5%) | 61 (54.5%) |
| Education, Arts & Media | 11 (28.9%) | 27 (71.1%) |
| Legal Services & Support | 7 (63.6%) | 4 (36.4%) |
| Education Instruction & Library | 30 (50.0%) | 30 (50.0%) |
| Arts, Media & Entertainment | 3 (100.0%) | 0 (0.0%) |
| Health Diagnosing & Treating | 0 (0.0%) | 25 (100.0%) |
| Health Technologists | 0 (0.0%) | 21 (100.0%) |
| Total (Category) | 119 (45.3%) | 144 (54.7%) |
| Total (Overall) | 443 (47.5%) | 489 (52.5%) |
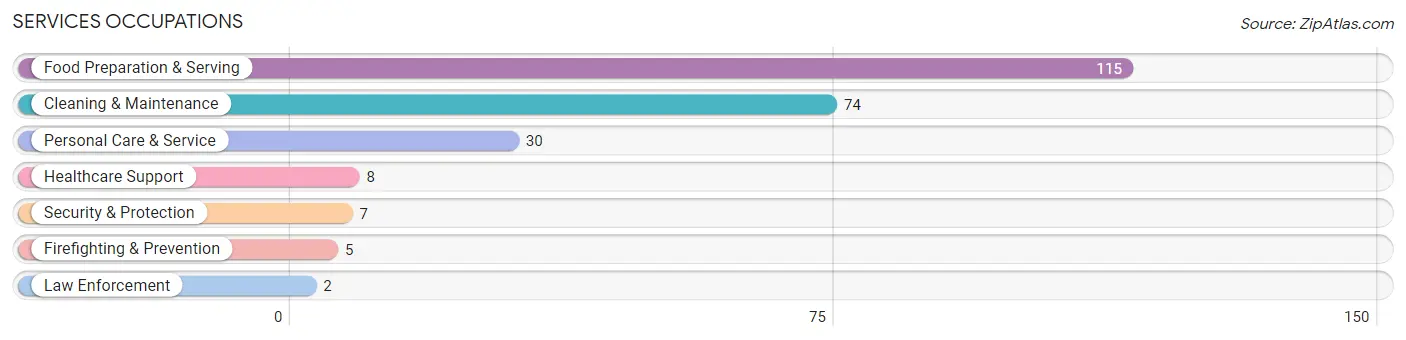
Services Occupations
The most common Services occupations in Wolf Point are Food Preparation & Serving (115 | 12.3%), Cleaning & Maintenance (74 | 7.9%), Personal Care & Service (30 | 3.2%), Healthcare Support (8 | 0.9%), and Security & Protection (7 | 0.7%).
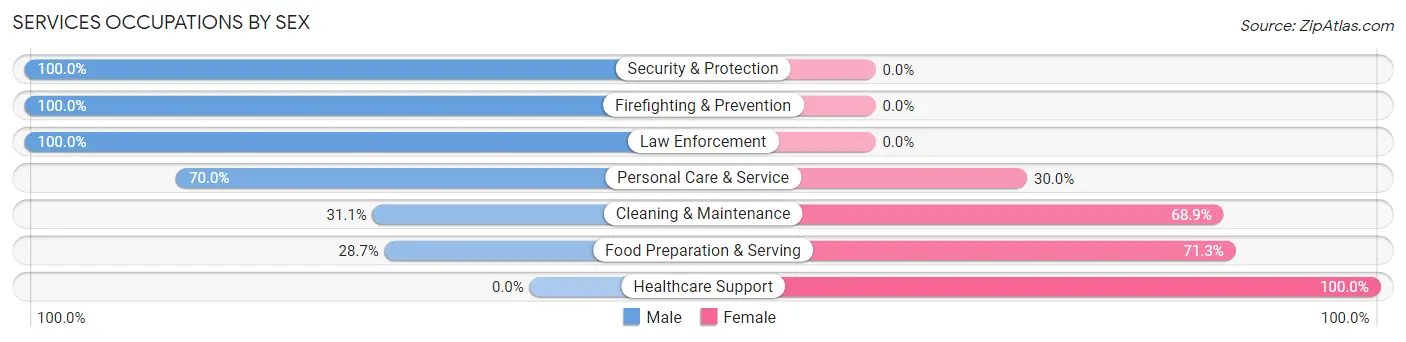
Services Occupations by Sex
Within the Services occupations in Wolf Point, the most male-oriented occupations are Security & Protection (100.0%), Firefighting & Prevention (100.0%), and Law Enforcement (100.0%), while the most female-oriented occupations are Healthcare Support (100.0%), Food Preparation & Serving (71.3%), and Cleaning & Maintenance (68.9%).
| Occupation | Male | Female |
| Healthcare Support | 0 (0.0%) | 8 (100.0%) |
| Security & Protection | 7 (100.0%) | 0 (0.0%) |
| Firefighting & Prevention | 5 (100.0%) | 0 (0.0%) |
| Law Enforcement | 2 (100.0%) | 0 (0.0%) |
| Food Preparation & Serving | 33 (28.7%) | 82 (71.3%) |
| Cleaning & Maintenance | 23 (31.1%) | 51 (68.9%) |
| Personal Care & Service | 21 (70.0%) | 9 (30.0%) |
| Total (Category) | 84 (35.9%) | 150 (64.1%) |
| Total (Overall) | 443 (47.5%) | 489 (52.5%) |
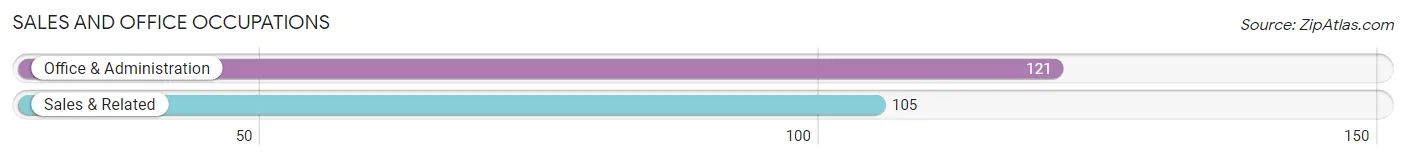
Sales and Office Occupations
The most common Sales and Office occupations in Wolf Point are Office & Administration (121 | 13.0%), and Sales & Related (105 | 11.3%).
Sales and Office Occupations by Sex
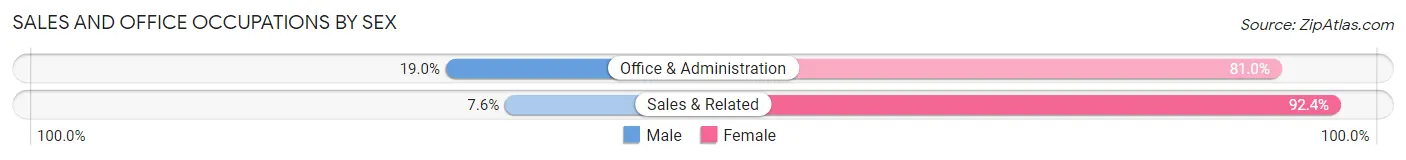
| Occupation | Male | Female |
| Sales & Related | 8 (7.6%) | 97 (92.4%) |
| Office & Administration | 23 (19.0%) | 98 (81.0%) |
| Total (Category) | 31 (13.7%) | 195 (86.3%) |
| Total (Overall) | 443 (47.5%) | 489 (52.5%) |
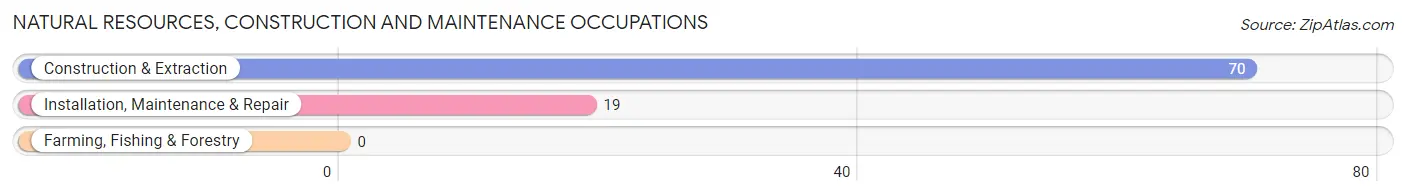
Natural Resources, Construction and Maintenance Occupations
The most common Natural Resources, Construction and Maintenance occupations in Wolf Point are Construction & Extraction (70 | 7.5%), and Installation, Maintenance & Repair (19 | 2.0%).
Natural Resources, Construction and Maintenance Occupations by Sex
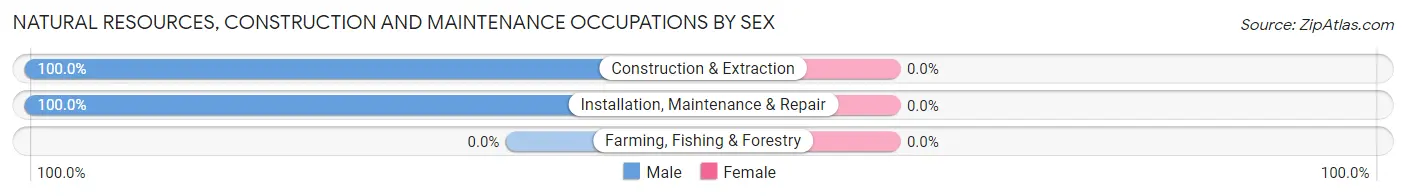
| Occupation | Male | Female |
| Farming, Fishing & Forestry | 0 (0.0%) | 0 (0.0%) |
| Construction & Extraction | 70 (100.0%) | 0 (0.0%) |
| Installation, Maintenance & Repair | 19 (100.0%) | 0 (0.0%) |
| Total (Category) | 89 (100.0%) | 0 (0.0%) |
| Total (Overall) | 443 (47.5%) | 489 (52.5%) |
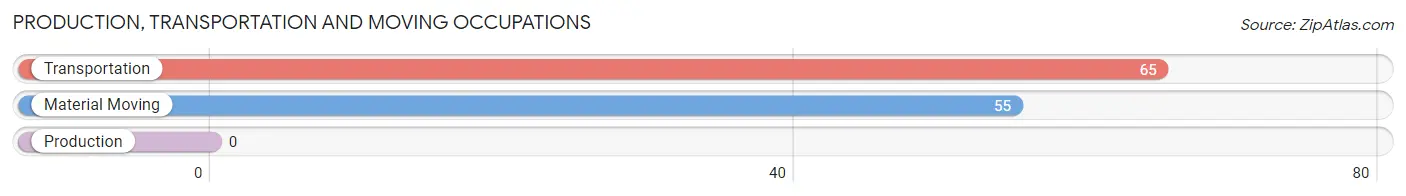
Production, Transportation and Moving Occupations
The most common Production, Transportation and Moving occupations in Wolf Point are Transportation (65 | 7.0%), and Material Moving (55 | 5.9%).
Production, Transportation and Moving Occupations by Sex
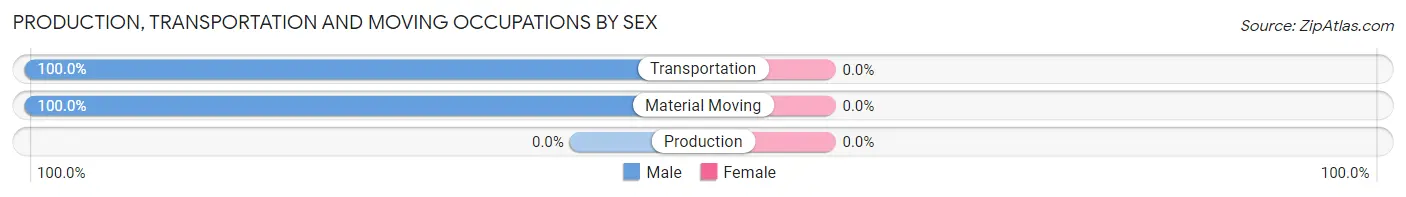
| Occupation | Male | Female |
| Production | 0 (0.0%) | 0 (0.0%) |
| Transportation | 65 (100.0%) | 0 (0.0%) |
| Material Moving | 55 (100.0%) | 0 (0.0%) |
| Total (Category) | 120 (100.0%) | 0 (0.0%) |
| Total (Overall) | 443 (47.5%) | 489 (52.5%) |
Employment Industries by Sex in Wolf Point
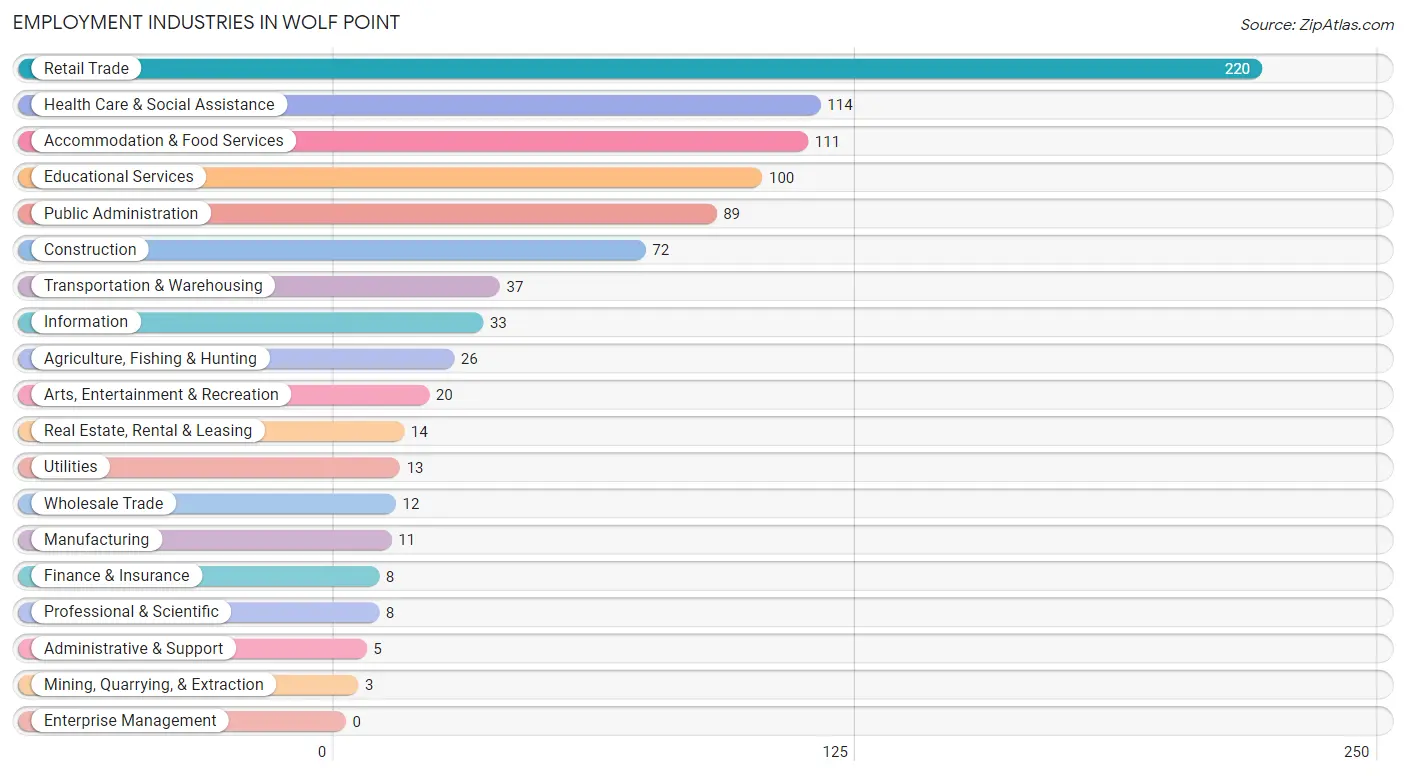
Employment Industries in Wolf Point
The major employment industries in Wolf Point include Retail Trade (220 | 23.6%), Health Care & Social Assistance (114 | 12.2%), Accommodation & Food Services (111 | 11.9%), Educational Services (100 | 10.7%), and Public Administration (89 | 9.6%).
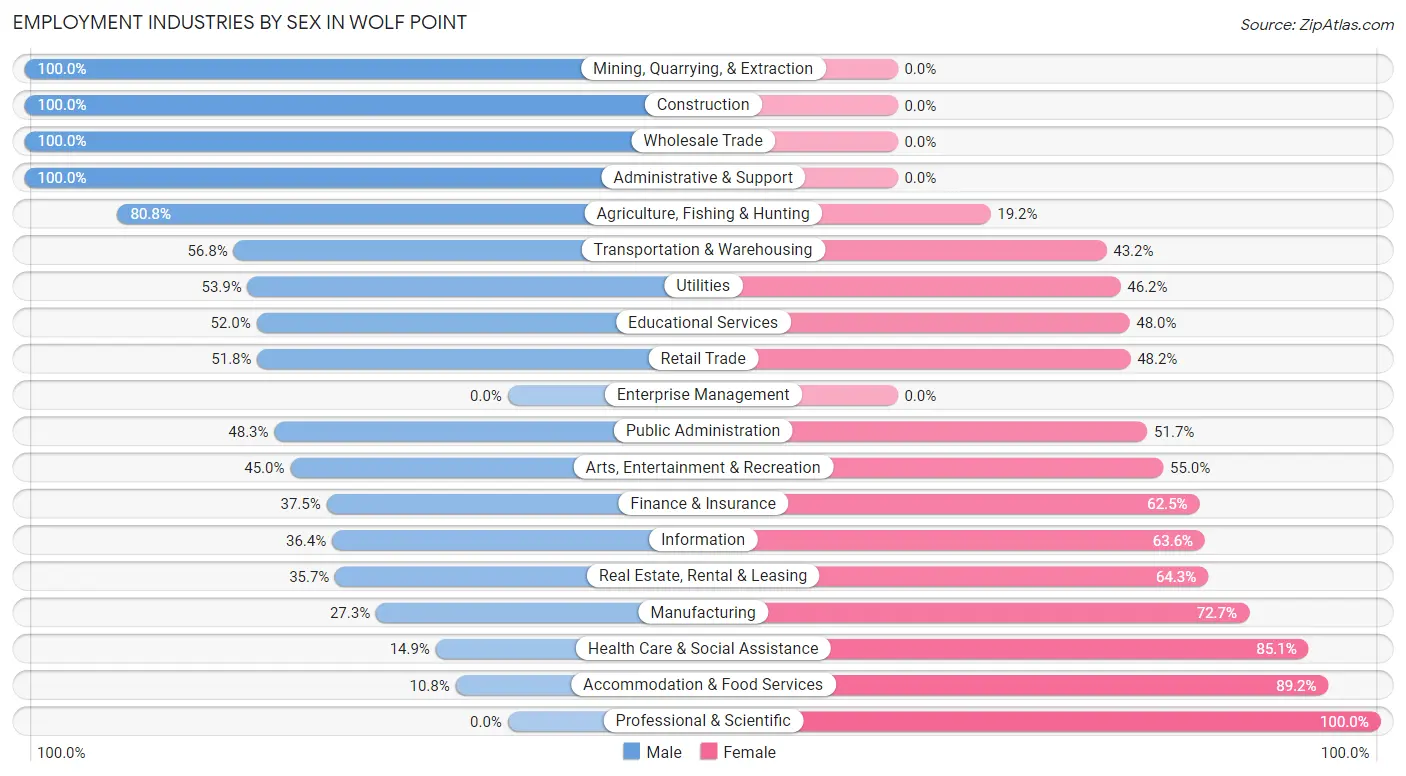
Employment Industries by Sex in Wolf Point
The Wolf Point industries that see more men than women are Mining, Quarrying, & Extraction (100.0%), Construction (100.0%), and Wholesale Trade (100.0%), whereas the industries that tend to have a higher number of women are Professional & Scientific (100.0%), Accommodation & Food Services (89.2%), and Health Care & Social Assistance (85.1%).
| Industry | Male | Female |
| Agriculture, Fishing & Hunting | 21 (80.8%) | 5 (19.2%) |
| Mining, Quarrying, & Extraction | 3 (100.0%) | 0 (0.0%) |
| Construction | 72 (100.0%) | 0 (0.0%) |
| Manufacturing | 3 (27.3%) | 8 (72.7%) |
| Wholesale Trade | 12 (100.0%) | 0 (0.0%) |
| Retail Trade | 114 (51.8%) | 106 (48.2%) |
| Transportation & Warehousing | 21 (56.8%) | 16 (43.2%) |
| Utilities | 7 (53.8%) | 6 (46.2%) |
| Information | 12 (36.4%) | 21 (63.6%) |
| Finance & Insurance | 3 (37.5%) | 5 (62.5%) |
| Real Estate, Rental & Leasing | 5 (35.7%) | 9 (64.3%) |
| Professional & Scientific | 0 (0.0%) | 8 (100.0%) |
| Enterprise Management | 0 (0.0%) | 0 (0.0%) |
| Administrative & Support | 5 (100.0%) | 0 (0.0%) |
| Educational Services | 52 (52.0%) | 48 (48.0%) |
| Health Care & Social Assistance | 17 (14.9%) | 97 (85.1%) |
| Arts, Entertainment & Recreation | 9 (45.0%) | 11 (55.0%) |
| Accommodation & Food Services | 12 (10.8%) | 99 (89.2%) |
| Public Administration | 43 (48.3%) | 46 (51.7%) |
| Total | 443 (47.5%) | 489 (52.5%) |
Education in Wolf Point
School Enrollment in Wolf Point
The most common levels of schooling among the 591 students in Wolf Point are high school (211 | 35.7%), middle school (194 | 32.8%), and elementary school (85 | 14.4%).
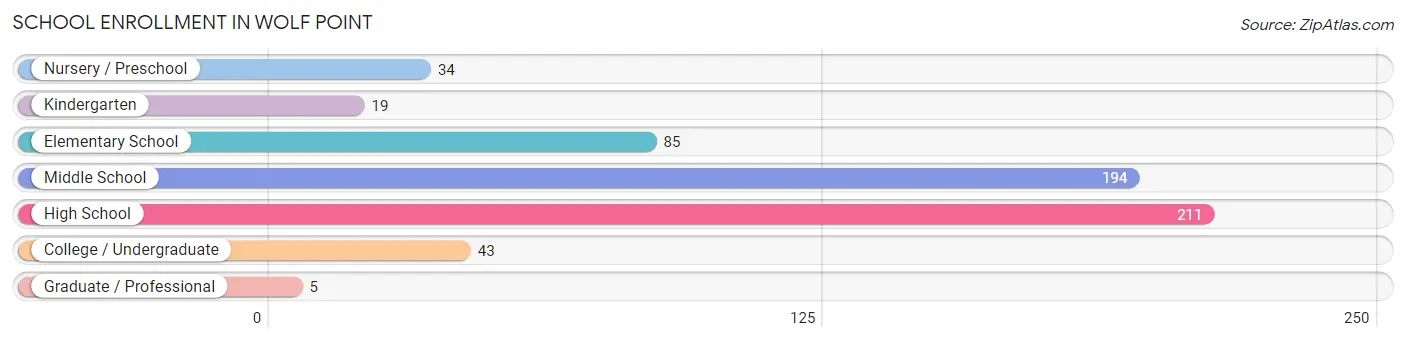
| School Level | # Students | % Students |
| Nursery / Preschool | 34 | 5.8% |
| Kindergarten | 19 | 3.2% |
| Elementary School | 85 | 14.4% |
| Middle School | 194 | 32.8% |
| High School | 211 | 35.7% |
| College / Undergraduate | 43 | 7.3% |
| Graduate / Professional | 5 | 0.9% |
| Total | 591 | 100.0% |
School Enrollment by Age by Funding Source in Wolf Point
Out of a total of 591 students who are enrolled in schools in Wolf Point, 57 (9.6%) attend a private institution, while the remaining 534 (90.4%) are enrolled in public schools. The age group of 18 to 19 year olds has the highest likelihood of being enrolled in private schools, with 30 (42.2% in the age bracket) enrolled. Conversely, the age group of 3 to 4 year olds has the lowest likelihood of being enrolled in a private school, with 19 (100.0% in the age bracket) attending a public institution.
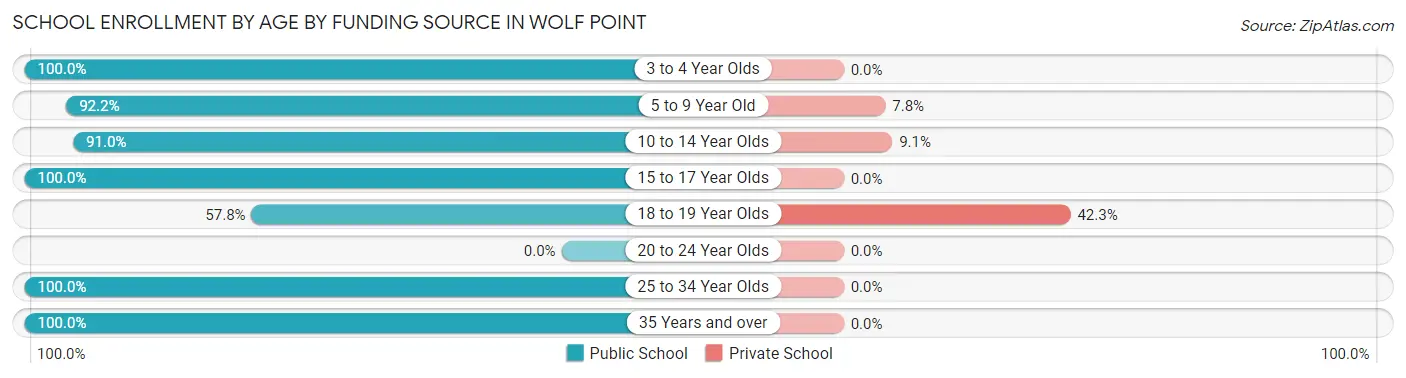
| Age Bracket | Public School | Private School |
| 3 to 4 Year Olds | 19 (100.0%) | 0 (0.0%) |
| 5 to 9 Year Old | 107 (92.2%) | 9 (7.8%) |
| 10 to 14 Year Olds | 181 (90.9%) | 18 (9.0%) |
| 15 to 17 Year Olds | 168 (100.0%) | 0 (0.0%) |
| 18 to 19 Year Olds | 41 (57.8%) | 30 (42.2%) |
| 20 to 24 Year Olds | 0 (0.0%) | 0 (0.0%) |
| 25 to 34 Year Olds | 10 (100.0%) | 0 (0.0%) |
| 35 Years and over | 8 (100.0%) | 0 (0.0%) |
| Total | 534 (90.4%) | 57 (9.6%) |
Educational Attainment by Field of Study in Wolf Point
Education (53 | 24.6%), business (46 | 21.4%), bio, nature & agricultural (25 | 11.6%), psychology (20 | 9.3%), and liberal arts & history (18 | 8.4%) are the most common fields of study among 215 individuals in Wolf Point who have obtained a bachelor's degree or higher.
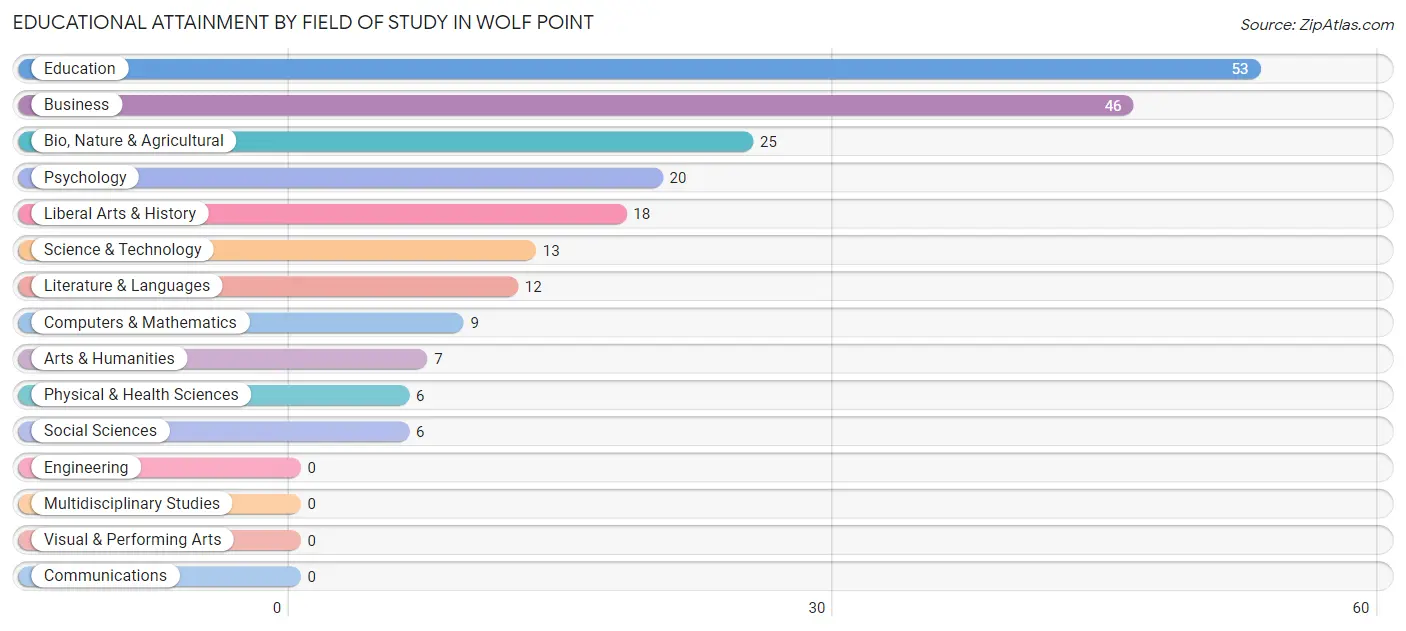
| Field of Study | # Graduates | % Graduates |
| Computers & Mathematics | 9 | 4.2% |
| Bio, Nature & Agricultural | 25 | 11.6% |
| Physical & Health Sciences | 6 | 2.8% |
| Psychology | 20 | 9.3% |
| Social Sciences | 6 | 2.8% |
| Engineering | 0 | 0.0% |
| Multidisciplinary Studies | 0 | 0.0% |
| Science & Technology | 13 | 6.0% |
| Business | 46 | 21.4% |
| Education | 53 | 24.6% |
| Literature & Languages | 12 | 5.6% |
| Liberal Arts & History | 18 | 8.4% |
| Visual & Performing Arts | 0 | 0.0% |
| Communications | 0 | 0.0% |
| Arts & Humanities | 7 | 3.3% |
| Total | 215 | 100.0% |
Transportation & Commute in Wolf Point
Vehicle Availability by Sex in Wolf Point
The most prevalent vehicle ownership categories in Wolf Point are males with 3 vehicles (121, accounting for 27.3%) and females with 3 vehicles (86, making up 25.8%).
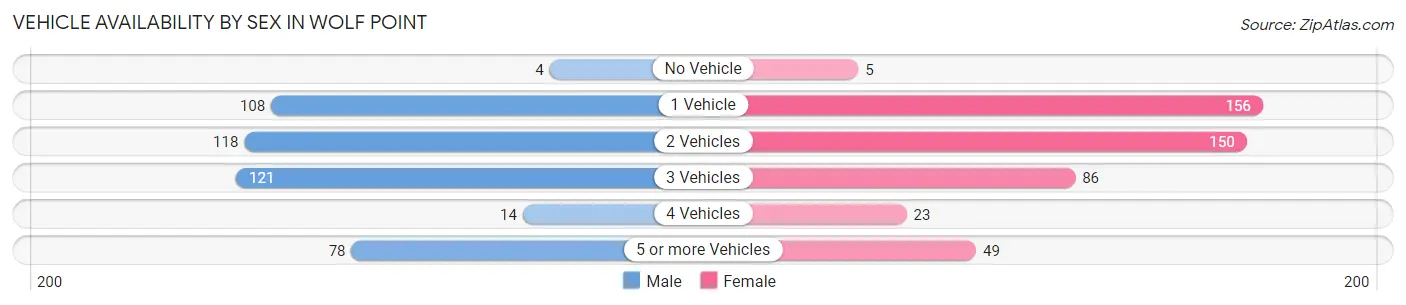
| Vehicles Available | Male | Female |
| No Vehicle | 4 (0.9%) | 5 (1.1%) |
| 1 Vehicle | 108 (24.4%) | 156 (33.3%) |
| 2 Vehicles | 118 (26.6%) | 150 (32.0%) |
| 3 Vehicles | 121 (27.3%) | 86 (18.3%) |
| 4 Vehicles | 14 (3.2%) | 23 (4.9%) |
| 5 or more Vehicles | 78 (17.6%) | 49 (10.4%) |
| Total | 443 (100.0%) | 469 (100.0%) |
Commute Time in Wolf Point
The most frequently occuring commute durations in Wolf Point are 5 to 9 minutes (363 commuters, 39.9%), 10 to 14 minutes (239 commuters, 26.3%), and 15 to 19 minutes (115 commuters, 12.7%).
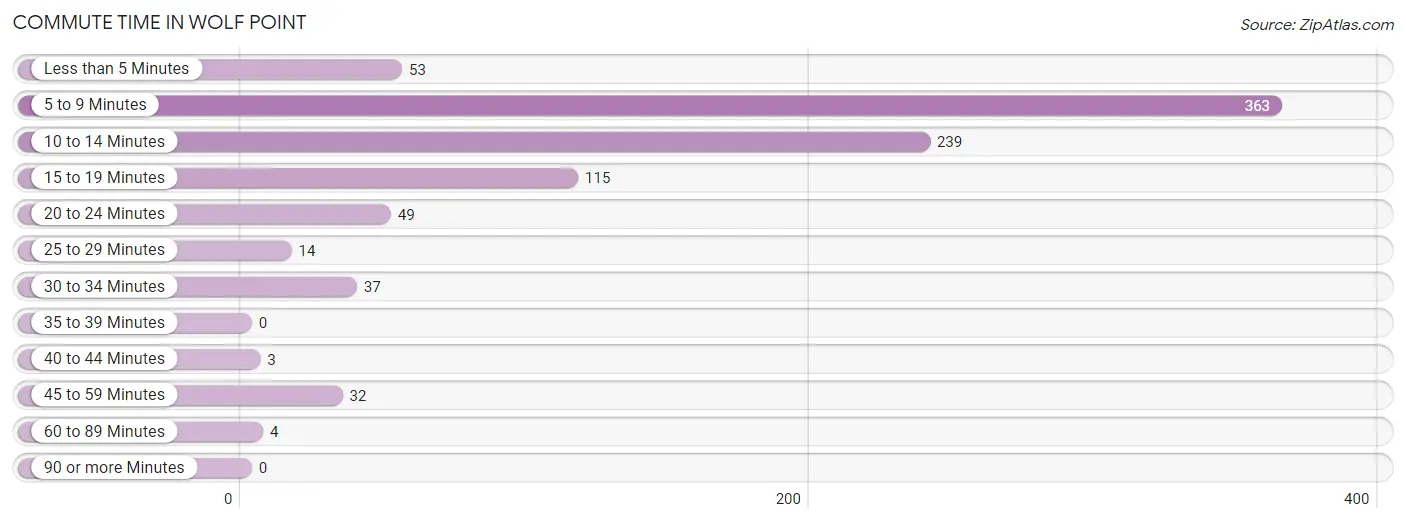
| Commute Time | # Commuters | % Commuters |
| Less than 5 Minutes | 53 | 5.8% |
| 5 to 9 Minutes | 363 | 39.9% |
| 10 to 14 Minutes | 239 | 26.3% |
| 15 to 19 Minutes | 115 | 12.7% |
| 20 to 24 Minutes | 49 | 5.4% |
| 25 to 29 Minutes | 14 | 1.5% |
| 30 to 34 Minutes | 37 | 4.1% |
| 35 to 39 Minutes | 0 | 0.0% |
| 40 to 44 Minutes | 3 | 0.3% |
| 45 to 59 Minutes | 32 | 3.5% |
| 60 to 89 Minutes | 4 | 0.4% |
| 90 or more Minutes | 0 | 0.0% |
Commute Time by Sex in Wolf Point
The most common commute times in Wolf Point are 10 to 14 minutes (185 commuters, 41.8%) for males and 5 to 9 minutes (232 commuters, 49.8%) for females.
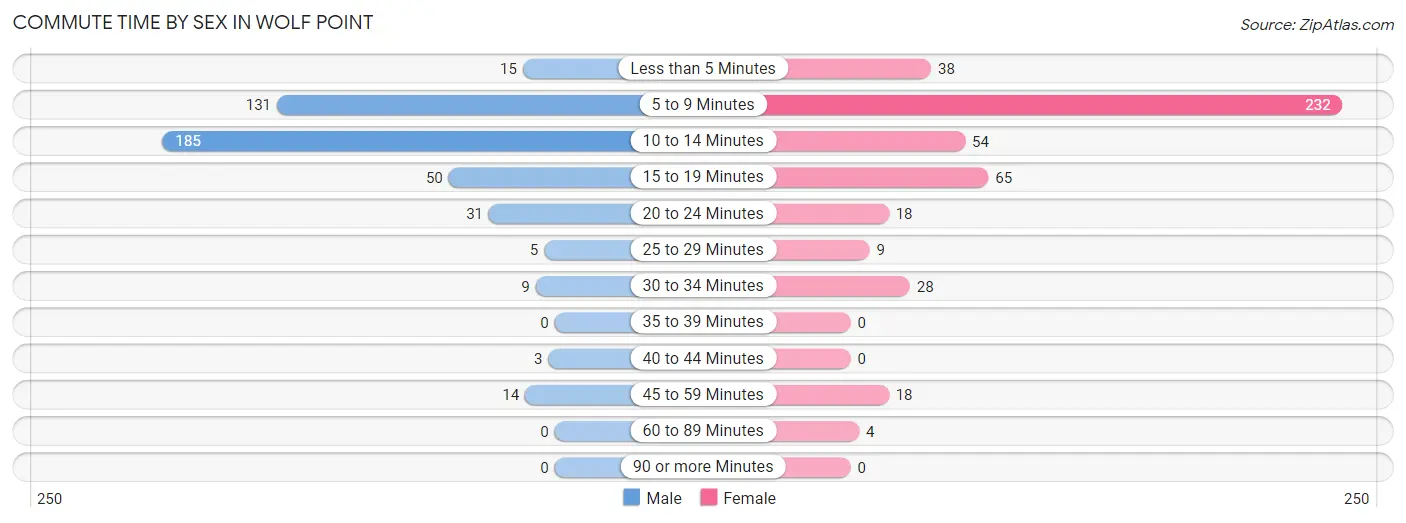
| Commute Time | Male | Female |
| Less than 5 Minutes | 15 (3.4%) | 38 (8.2%) |
| 5 to 9 Minutes | 131 (29.6%) | 232 (49.8%) |
| 10 to 14 Minutes | 185 (41.8%) | 54 (11.6%) |
| 15 to 19 Minutes | 50 (11.3%) | 65 (14.0%) |
| 20 to 24 Minutes | 31 (7.0%) | 18 (3.9%) |
| 25 to 29 Minutes | 5 (1.1%) | 9 (1.9%) |
| 30 to 34 Minutes | 9 (2.0%) | 28 (6.0%) |
| 35 to 39 Minutes | 0 (0.0%) | 0 (0.0%) |
| 40 to 44 Minutes | 3 (0.7%) | 0 (0.0%) |
| 45 to 59 Minutes | 14 (3.2%) | 18 (3.9%) |
| 60 to 89 Minutes | 0 (0.0%) | 4 (0.9%) |
| 90 or more Minutes | 0 (0.0%) | 0 (0.0%) |
Time of Departure to Work by Sex in Wolf Point
The most frequent times of departure to work in Wolf Point are 7:30 AM to 7:59 AM (131, 29.6%) for males and 7:30 AM to 7:59 AM (173, 37.1%) for females.
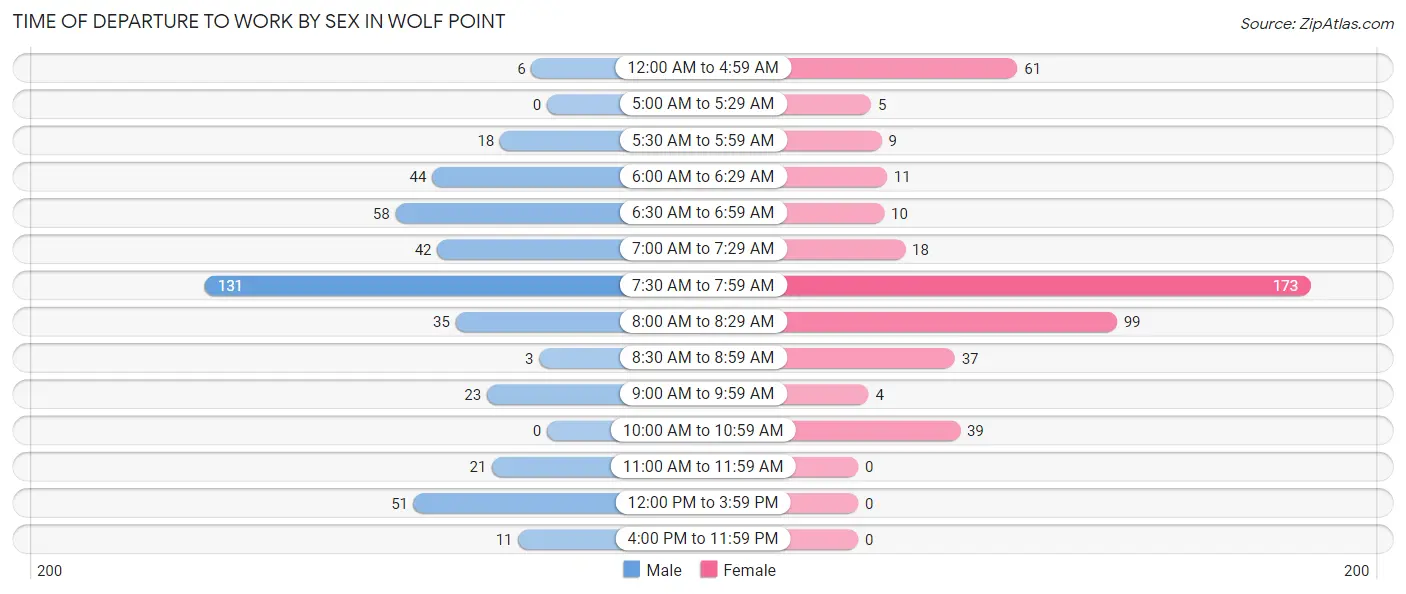
| Time of Departure | Male | Female |
| 12:00 AM to 4:59 AM | 6 (1.3%) | 61 (13.1%) |
| 5:00 AM to 5:29 AM | 0 (0.0%) | 5 (1.1%) |
| 5:30 AM to 5:59 AM | 18 (4.1%) | 9 (1.9%) |
| 6:00 AM to 6:29 AM | 44 (9.9%) | 11 (2.4%) |
| 6:30 AM to 6:59 AM | 58 (13.1%) | 10 (2.1%) |
| 7:00 AM to 7:29 AM | 42 (9.5%) | 18 (3.9%) |
| 7:30 AM to 7:59 AM | 131 (29.6%) | 173 (37.1%) |
| 8:00 AM to 8:29 AM | 35 (7.9%) | 99 (21.2%) |
| 8:30 AM to 8:59 AM | 3 (0.7%) | 37 (7.9%) |
| 9:00 AM to 9:59 AM | 23 (5.2%) | 4 (0.9%) |
| 10:00 AM to 10:59 AM | 0 (0.0%) | 39 (8.4%) |
| 11:00 AM to 11:59 AM | 21 (4.7%) | 0 (0.0%) |
| 12:00 PM to 3:59 PM | 51 (11.5%) | 0 (0.0%) |
| 4:00 PM to 11:59 PM | 11 (2.5%) | 0 (0.0%) |
| Total | 443 (100.0%) | 466 (100.0%) |
Housing Occupancy in Wolf Point
Occupancy by Ownership in Wolf Point
Of the total 772 dwellings in Wolf Point, owner-occupied units account for 400 (51.8%), while renter-occupied units make up 372 (48.2%).
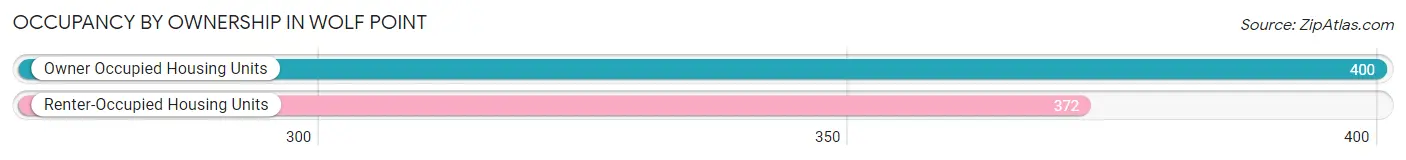
| Occupancy | # Housing Units | % Housing Units |
| Owner Occupied Housing Units | 400 | 51.8% |
| Renter-Occupied Housing Units | 372 | 48.2% |
| Total Occupied Housing Units | 772 | 100.0% |
Occupancy by Household Size in Wolf Point
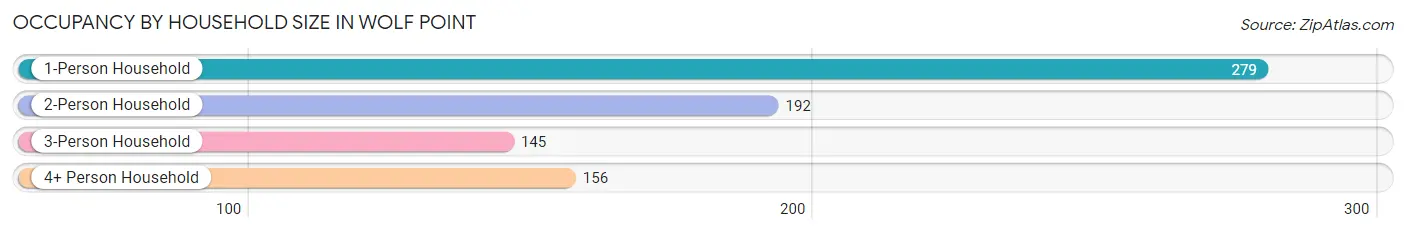
| Household Size | # Housing Units | % Housing Units |
| 1-Person Household | 279 | 36.1% |
| 2-Person Household | 192 | 24.9% |
| 3-Person Household | 145 | 18.8% |
| 4+ Person Household | 156 | 20.2% |
| Total Housing Units | 772 | 100.0% |
Occupancy by Ownership by Household Size in Wolf Point
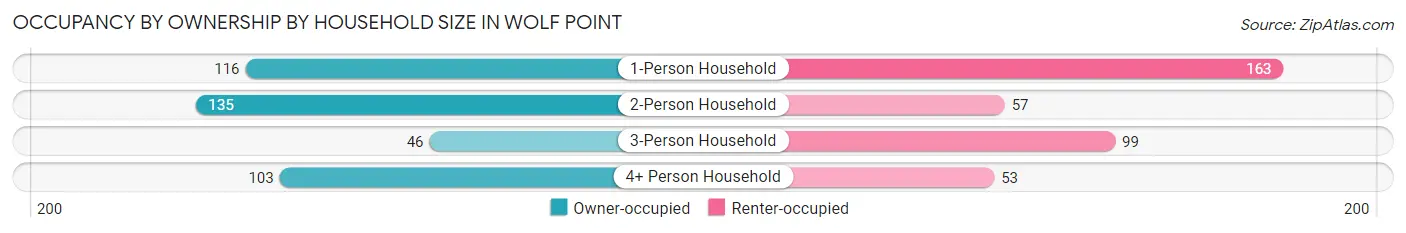
| Household Size | Owner-occupied | Renter-occupied |
| 1-Person Household | 116 (41.6%) | 163 (58.4%) |
| 2-Person Household | 135 (70.3%) | 57 (29.7%) |
| 3-Person Household | 46 (31.7%) | 99 (68.3%) |
| 4+ Person Household | 103 (66.0%) | 53 (34.0%) |
| Total Housing Units | 400 (51.8%) | 372 (48.2%) |
Occupancy by Educational Attainment in Wolf Point
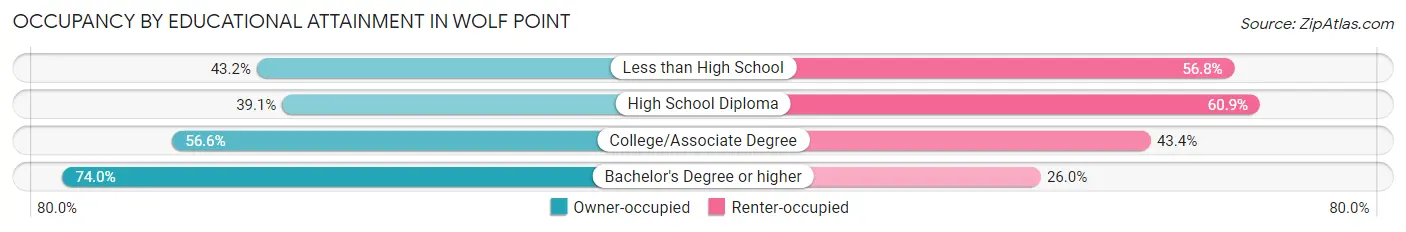
| Household Size | Owner-occupied | Renter-occupied |
| Less than High School | 19 (43.2%) | 25 (56.8%) |
| High School Diploma | 119 (39.1%) | 185 (60.9%) |
| College/Associate Degree | 168 (56.6%) | 129 (43.4%) |
| Bachelor's Degree or higher | 94 (74.0%) | 33 (26.0%) |
Occupancy by Age of Householder in Wolf Point
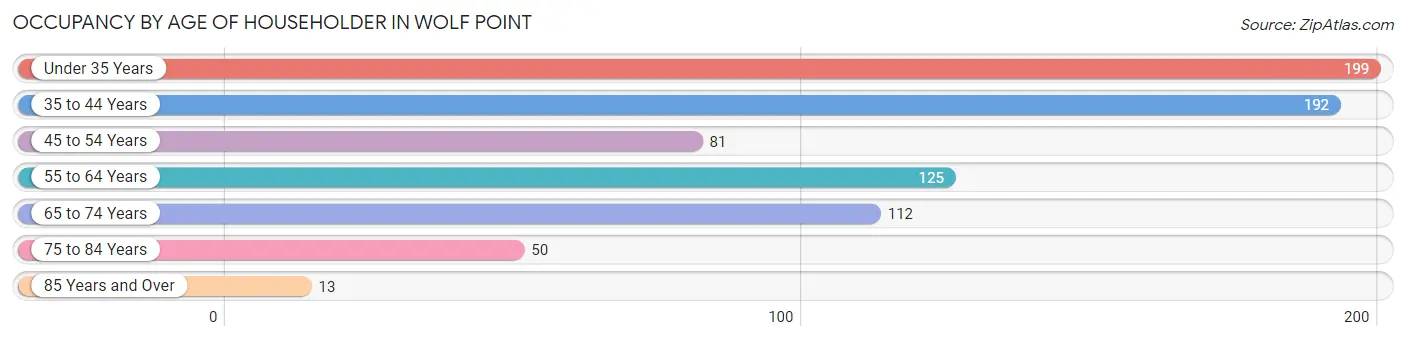
| Age Bracket | # Households | % Households |
| Under 35 Years | 199 | 25.8% |
| 35 to 44 Years | 192 | 24.9% |
| 45 to 54 Years | 81 | 10.5% |
| 55 to 64 Years | 125 | 16.2% |
| 65 to 74 Years | 112 | 14.5% |
| 75 to 84 Years | 50 | 6.5% |
| 85 Years and Over | 13 | 1.7% |
| Total | 772 | 100.0% |
Housing Finances in Wolf Point
Median Income by Occupancy in Wolf Point
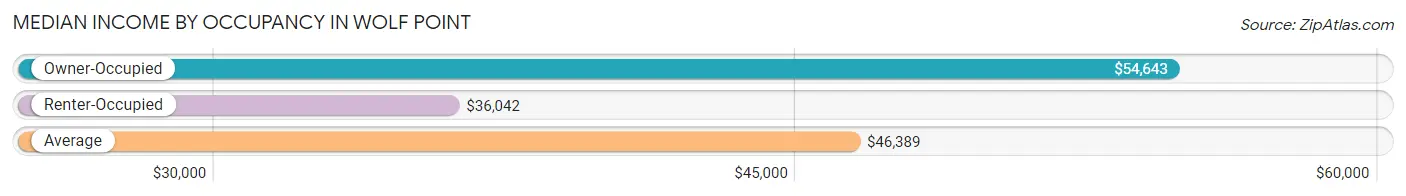
| Occupancy Type | # Households | Median Income |
| Owner-Occupied | 400 (51.8%) | $54,643 |
| Renter-Occupied | 372 (48.2%) | $36,042 |
| Average | 772 (100.0%) | $46,389 |
Occupancy by Householder Income Bracket in Wolf Point
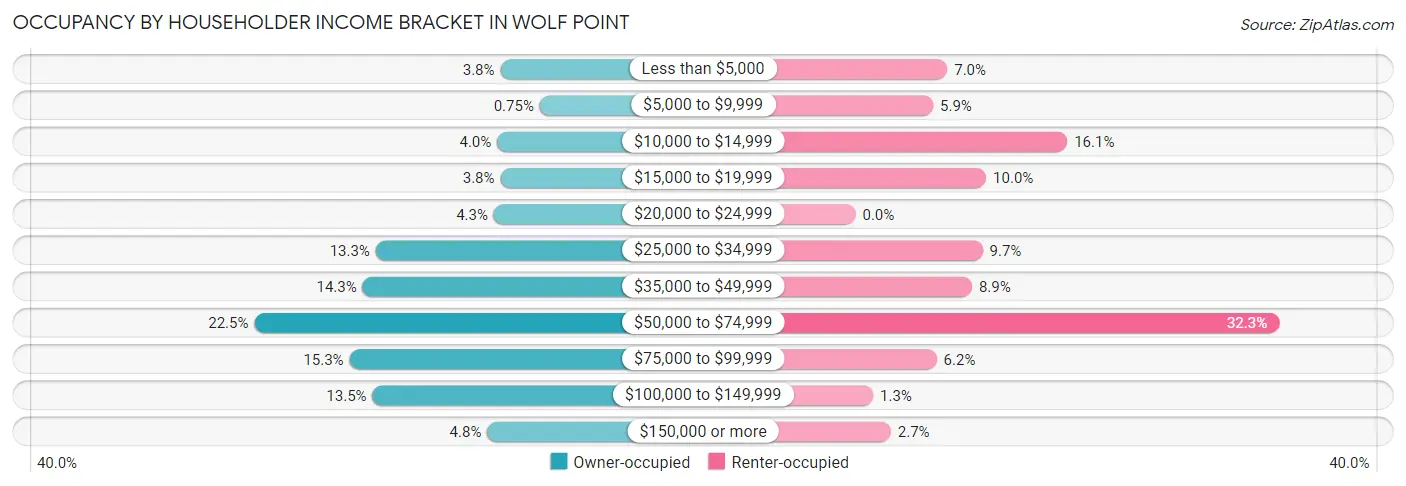
| Income Bracket | Owner-occupied | Renter-occupied |
| Less than $5,000 | 15 (3.7%) | 26 (7.0%) |
| $5,000 to $9,999 | 3 (0.7%) | 22 (5.9%) |
| $10,000 to $14,999 | 16 (4.0%) | 60 (16.1%) |
| $15,000 to $19,999 | 15 (3.7%) | 37 (10.0%) |
| $20,000 to $24,999 | 17 (4.3%) | 0 (0.0%) |
| $25,000 to $34,999 | 53 (13.3%) | 36 (9.7%) |
| $35,000 to $49,999 | 57 (14.2%) | 33 (8.9%) |
| $50,000 to $74,999 | 90 (22.5%) | 120 (32.3%) |
| $75,000 to $99,999 | 61 (15.2%) | 23 (6.2%) |
| $100,000 to $149,999 | 54 (13.5%) | 5 (1.3%) |
| $150,000 or more | 19 (4.8%) | 10 (2.7%) |
| Total | 400 (100.0%) | 372 (100.0%) |
Monthly Housing Cost Tiers in Wolf Point
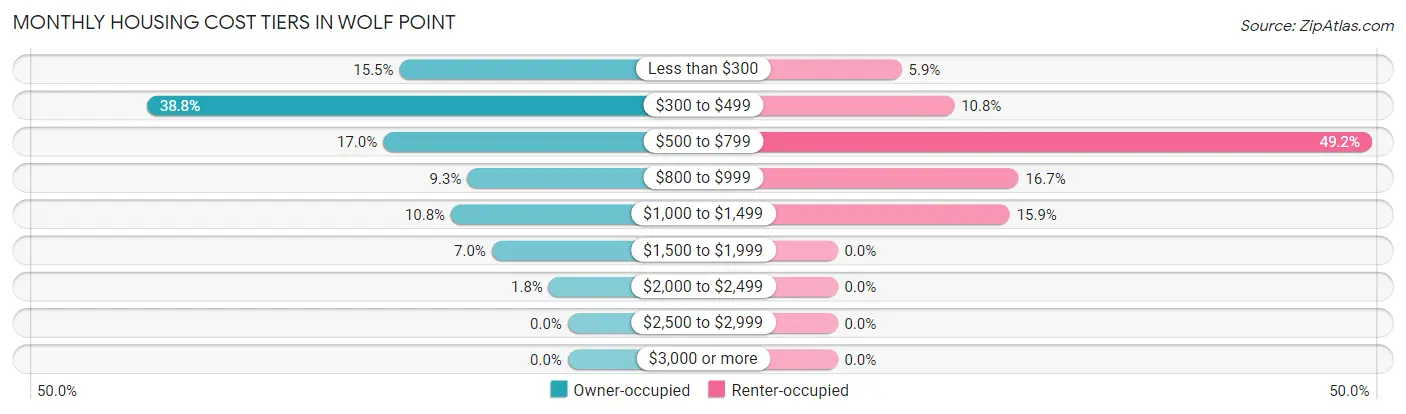
| Monthly Cost | Owner-occupied | Renter-occupied |
| Less than $300 | 62 (15.5%) | 22 (5.9%) |
| $300 to $499 | 155 (38.8%) | 40 (10.7%) |
| $500 to $799 | 68 (17.0%) | 183 (49.2%) |
| $800 to $999 | 37 (9.2%) | 62 (16.7%) |
| $1,000 to $1,499 | 43 (10.7%) | 59 (15.9%) |
| $1,500 to $1,999 | 28 (7.0%) | 0 (0.0%) |
| $2,000 to $2,499 | 7 (1.8%) | 0 (0.0%) |
| $2,500 to $2,999 | 0 (0.0%) | 0 (0.0%) |
| $3,000 or more | 0 (0.0%) | 0 (0.0%) |
| Total | 400 (100.0%) | 372 (100.0%) |
Physical Housing Characteristics in Wolf Point
Housing Structures in Wolf Point
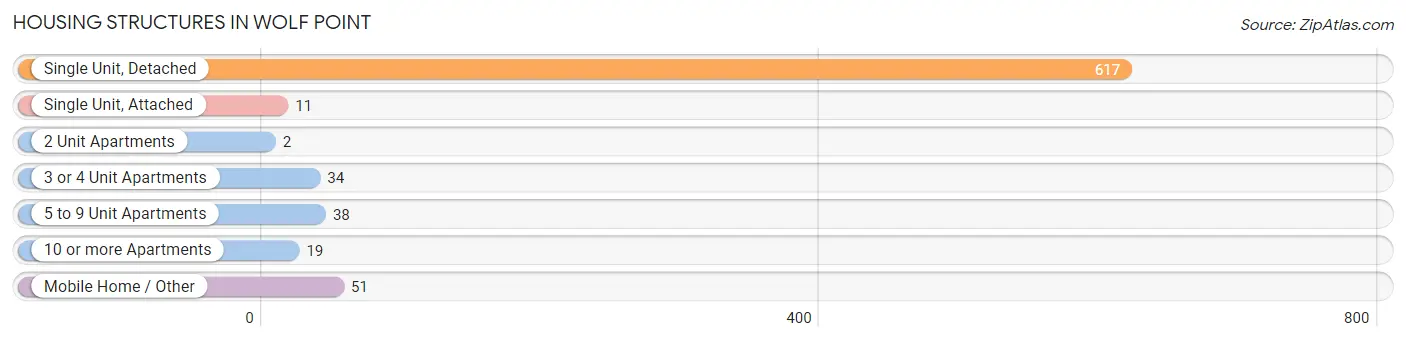
| Structure Type | # Housing Units | % Housing Units |
| Single Unit, Detached | 617 | 79.9% |
| Single Unit, Attached | 11 | 1.4% |
| 2 Unit Apartments | 2 | 0.3% |
| 3 or 4 Unit Apartments | 34 | 4.4% |
| 5 to 9 Unit Apartments | 38 | 4.9% |
| 10 or more Apartments | 19 | 2.5% |
| Mobile Home / Other | 51 | 6.6% |
| Total | 772 | 100.0% |
Housing Structures by Occupancy in Wolf Point
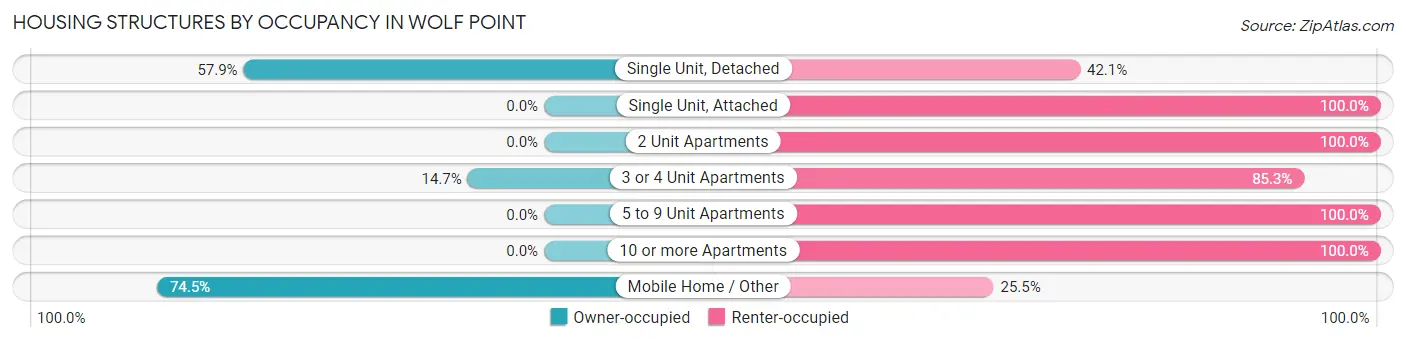
| Structure Type | Owner-occupied | Renter-occupied |
| Single Unit, Detached | 357 (57.9%) | 260 (42.1%) |
| Single Unit, Attached | 0 (0.0%) | 11 (100.0%) |
| 2 Unit Apartments | 0 (0.0%) | 2 (100.0%) |
| 3 or 4 Unit Apartments | 5 (14.7%) | 29 (85.3%) |
| 5 to 9 Unit Apartments | 0 (0.0%) | 38 (100.0%) |
| 10 or more Apartments | 0 (0.0%) | 19 (100.0%) |
| Mobile Home / Other | 38 (74.5%) | 13 (25.5%) |
| Total | 400 (51.8%) | 372 (48.2%) |
Housing Structures by Number of Rooms in Wolf Point
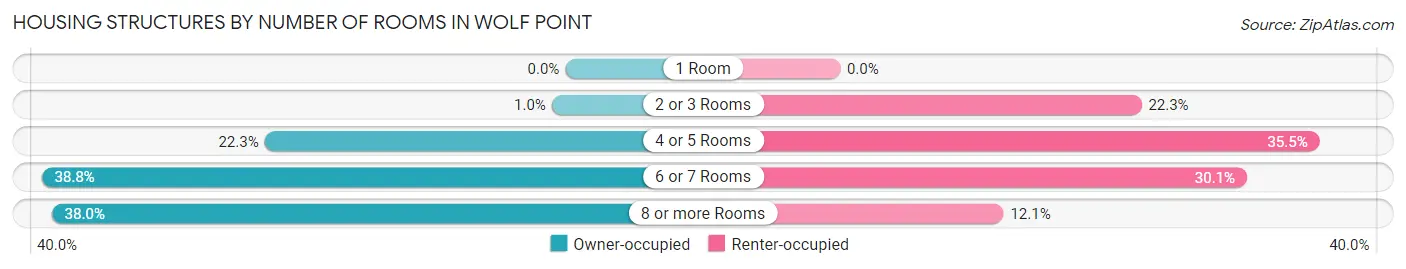
| Number of Rooms | Owner-occupied | Renter-occupied |
| 1 Room | 0 (0.0%) | 0 (0.0%) |
| 2 or 3 Rooms | 4 (1.0%) | 83 (22.3%) |
| 4 or 5 Rooms | 89 (22.3%) | 132 (35.5%) |
| 6 or 7 Rooms | 155 (38.8%) | 112 (30.1%) |
| 8 or more Rooms | 152 (38.0%) | 45 (12.1%) |
| Total | 400 (100.0%) | 372 (100.0%) |
Housing Structure by Heating Type in Wolf Point
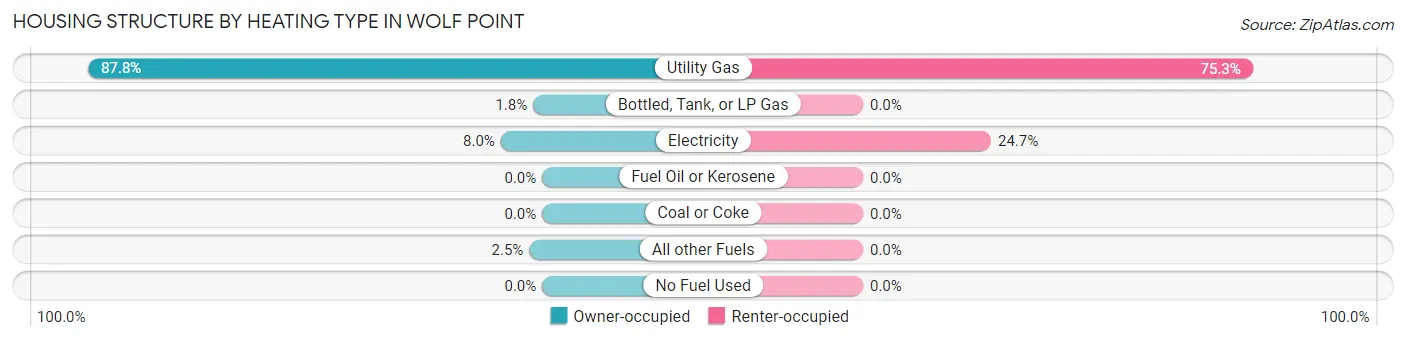
| Heating Type | Owner-occupied | Renter-occupied |
| Utility Gas | 351 (87.7%) | 280 (75.3%) |
| Bottled, Tank, or LP Gas | 7 (1.8%) | 0 (0.0%) |
| Electricity | 32 (8.0%) | 92 (24.7%) |
| Fuel Oil or Kerosene | 0 (0.0%) | 0 (0.0%) |
| Coal or Coke | 0 (0.0%) | 0 (0.0%) |
| All other Fuels | 10 (2.5%) | 0 (0.0%) |
| No Fuel Used | 0 (0.0%) | 0 (0.0%) |
| Total | 400 (100.0%) | 372 (100.0%) |
Household Vehicle Usage in Wolf Point
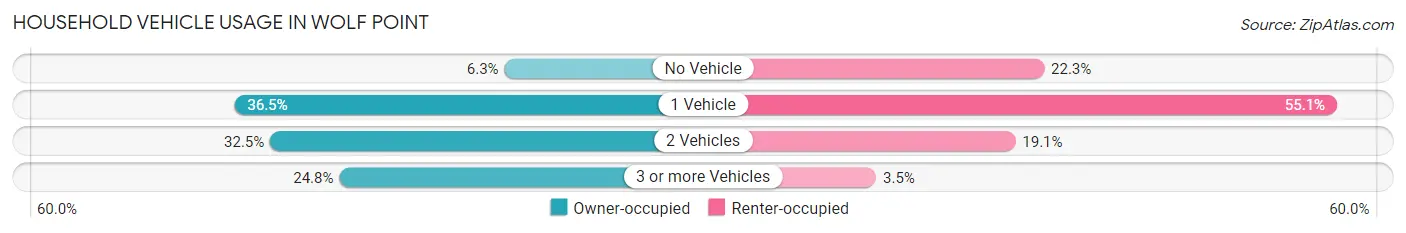
| Vehicles per Household | Owner-occupied | Renter-occupied |
| No Vehicle | 25 (6.2%) | 83 (22.3%) |
| 1 Vehicle | 146 (36.5%) | 205 (55.1%) |
| 2 Vehicles | 130 (32.5%) | 71 (19.1%) |
| 3 or more Vehicles | 99 (24.7%) | 13 (3.5%) |
| Total | 400 (100.0%) | 372 (100.0%) |
Real Estate & Mortgages in Wolf Point
Real Estate and Mortgage Overview in Wolf Point
| Characteristic | Without Mortgage | With Mortgage |
| Housing Units | 273 | 127 |
| Median Property Value | $89,300 | $156,900 |
| Median Household Income | $53,839 | $7 |
| Monthly Housing Costs | $367 | $0 |
| Real Estate Taxes | $1,613 | $5 |
Property Value by Mortgage Status in Wolf Point
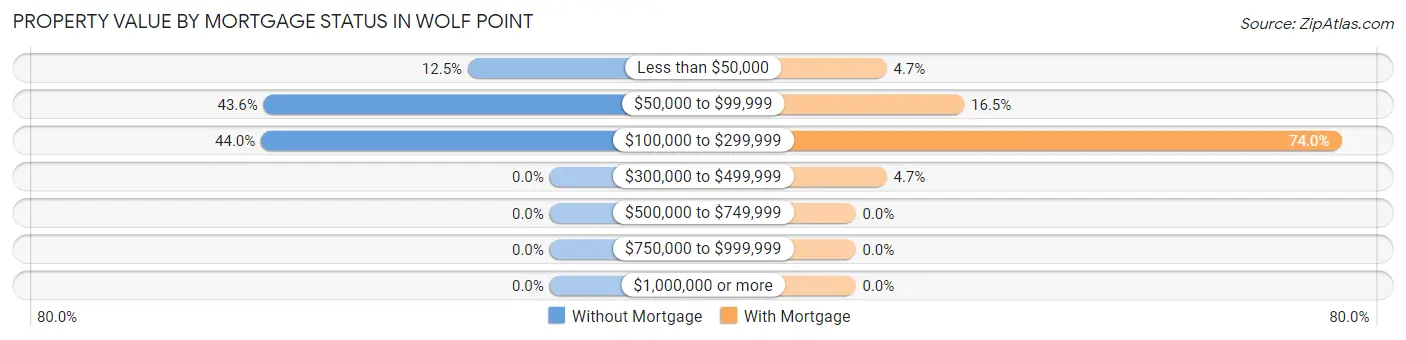
| Property Value | Without Mortgage | With Mortgage |
| Less than $50,000 | 34 (12.4%) | 6 (4.7%) |
| $50,000 to $99,999 | 119 (43.6%) | 21 (16.5%) |
| $100,000 to $299,999 | 120 (44.0%) | 94 (74.0%) |
| $300,000 to $499,999 | 0 (0.0%) | 6 (4.7%) |
| $500,000 to $749,999 | 0 (0.0%) | 0 (0.0%) |
| $750,000 to $999,999 | 0 (0.0%) | 0 (0.0%) |
| $1,000,000 or more | 0 (0.0%) | 0 (0.0%) |
| Total | 273 (100.0%) | 127 (100.0%) |
Household Income by Mortgage Status in Wolf Point
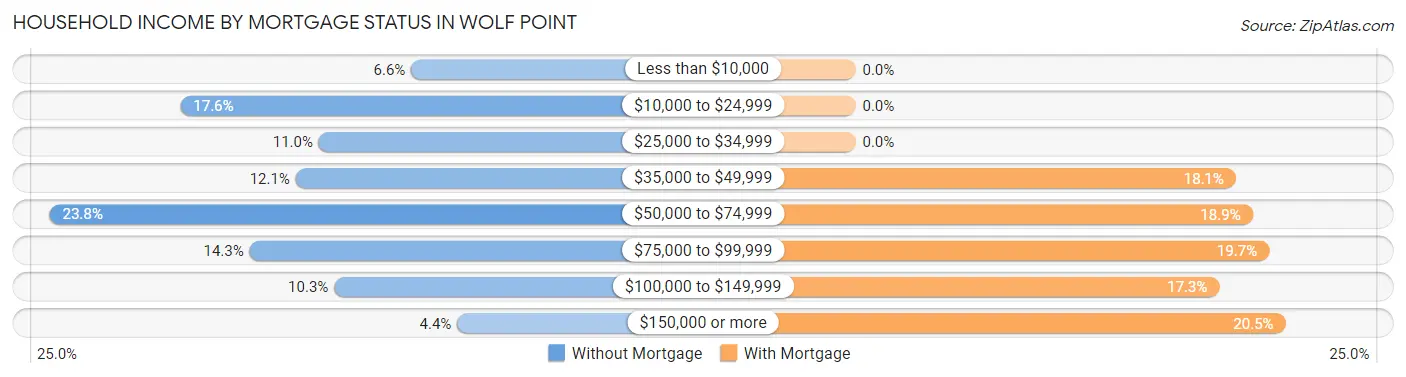
| Household Income | Without Mortgage | With Mortgage |
| Less than $10,000 | 18 (6.6%) | 0 (0.0%) |
| $10,000 to $24,999 | 48 (17.6%) | 0 (0.0%) |
| $25,000 to $34,999 | 30 (11.0%) | 0 (0.0%) |
| $35,000 to $49,999 | 33 (12.1%) | 23 (18.1%) |
| $50,000 to $74,999 | 65 (23.8%) | 24 (18.9%) |
| $75,000 to $99,999 | 39 (14.3%) | 25 (19.7%) |
| $100,000 to $149,999 | 28 (10.3%) | 22 (17.3%) |
| $150,000 or more | 12 (4.4%) | 26 (20.5%) |
| Total | 273 (100.0%) | 127 (100.0%) |
Property Value to Household Income Ratio in Wolf Point
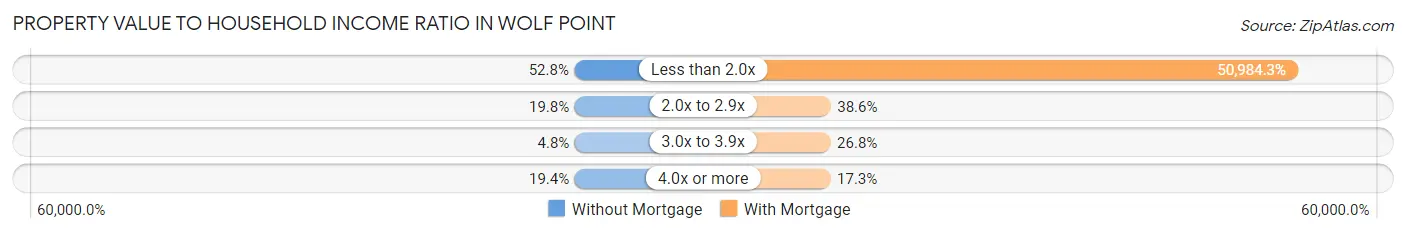
| Value-to-Income Ratio | Without Mortgage | With Mortgage |
| Less than 2.0x | 144 (52.7%) | 64,750 (50,984.2%) |
| 2.0x to 2.9x | 54 (19.8%) | 49 (38.6%) |
| 3.0x to 3.9x | 13 (4.8%) | 34 (26.8%) |
| 4.0x or more | 53 (19.4%) | 22 (17.3%) |
| Total | 273 (100.0%) | 127 (100.0%) |
Real Estate Taxes by Mortgage Status in Wolf Point
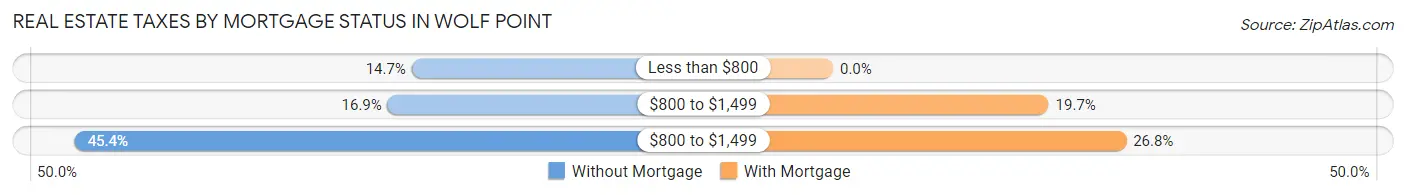
| Property Taxes | Without Mortgage | With Mortgage |
| Less than $800 | 40 (14.6%) | 0 (0.0%) |
| $800 to $1,499 | 46 (16.9%) | 25 (19.7%) |
| $800 to $1,499 | 124 (45.4%) | 34 (26.8%) |
| Total | 273 (100.0%) | 127 (100.0%) |
Health & Disability in Wolf Point
Health Insurance Coverage by Age in Wolf Point
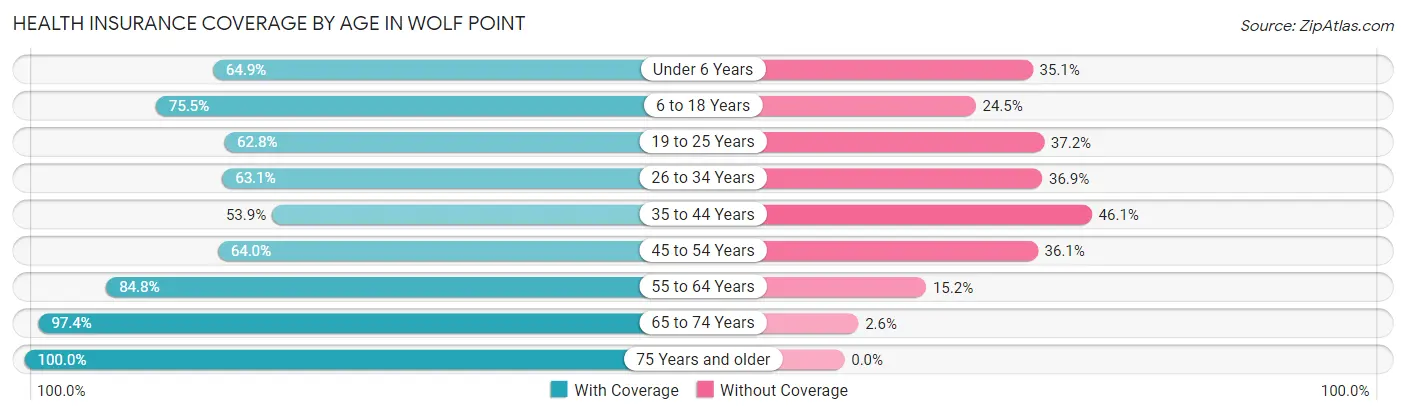
| Age Bracket | With Coverage | Without Coverage |
| Under 6 Years | 194 (64.9%) | 105 (35.1%) |
| 6 to 18 Years | 432 (75.5%) | 140 (24.5%) |
| 19 to 25 Years | 194 (62.8%) | 115 (37.2%) |
| 26 to 34 Years | 190 (63.1%) | 111 (36.9%) |
| 35 to 44 Years | 174 (53.9%) | 149 (46.1%) |
| 45 to 54 Years | 94 (63.9%) | 53 (36.0%) |
| 55 to 64 Years | 217 (84.8%) | 39 (15.2%) |
| 65 to 74 Years | 188 (97.4%) | 5 (2.6%) |
| 75 Years and older | 106 (100.0%) | 0 (0.0%) |
| Total | 1,789 (71.4%) | 717 (28.6%) |
Health Insurance Coverage by Citizenship Status in Wolf Point
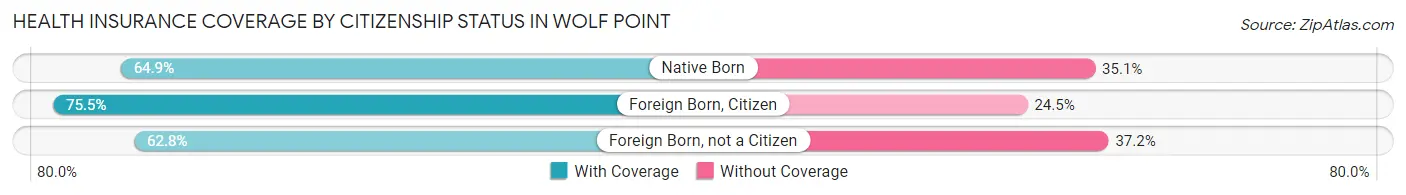
| Citizenship Status | With Coverage | Without Coverage |
| Native Born | 194 (64.9%) | 105 (35.1%) |
| Foreign Born, Citizen | 432 (75.5%) | 140 (24.5%) |
| Foreign Born, not a Citizen | 194 (62.8%) | 115 (37.2%) |
Health Insurance Coverage by Household Income in Wolf Point
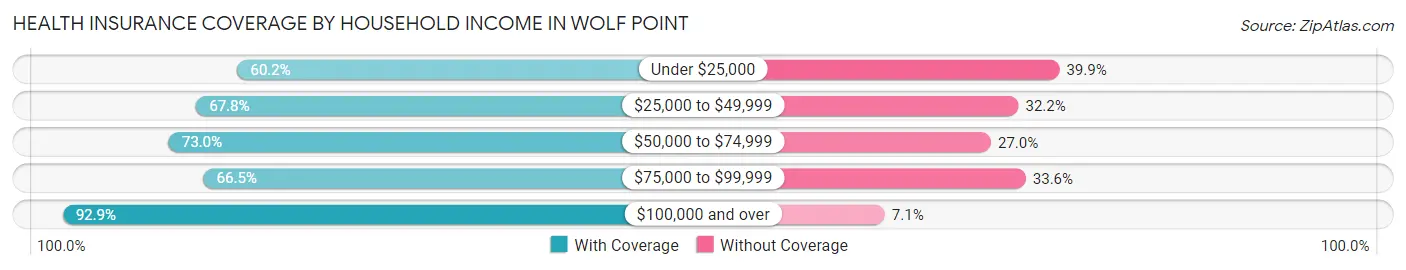
| Household Income | With Coverage | Without Coverage |
| Under $25,000 | 246 (60.2%) | 163 (39.9%) |
| $25,000 to $49,999 | 432 (67.8%) | 205 (32.2%) |
| $50,000 to $74,999 | 459 (73.0%) | 170 (27.0%) |
| $75,000 to $99,999 | 301 (66.4%) | 152 (33.6%) |
| $100,000 and over | 351 (92.9%) | 27 (7.1%) |
Public vs Private Health Insurance Coverage by Age in Wolf Point
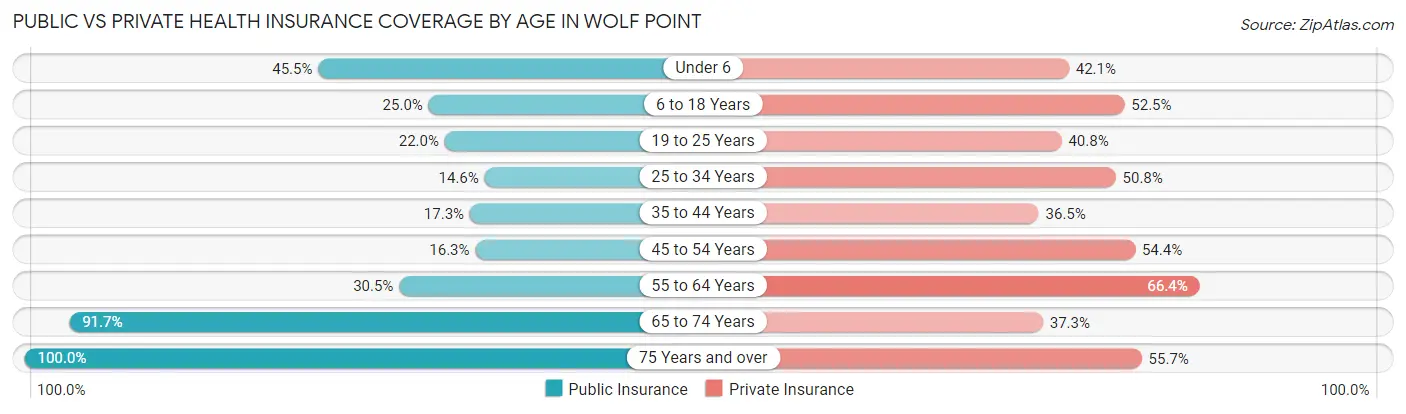
| Age Bracket | Public Insurance | Private Insurance |
| Under 6 | 136 (45.5%) | 126 (42.1%) |
| 6 to 18 Years | 143 (25.0%) | 300 (52.4%) |
| 19 to 25 Years | 68 (22.0%) | 126 (40.8%) |
| 25 to 34 Years | 44 (14.6%) | 153 (50.8%) |
| 35 to 44 Years | 56 (17.3%) | 118 (36.5%) |
| 45 to 54 Years | 24 (16.3%) | 80 (54.4%) |
| 55 to 64 Years | 78 (30.5%) | 170 (66.4%) |
| 65 to 74 Years | 177 (91.7%) | 72 (37.3%) |
| 75 Years and over | 106 (100.0%) | 59 (55.7%) |
| Total | 832 (33.2%) | 1,204 (48.0%) |
Disability Status by Sex by Age in Wolf Point
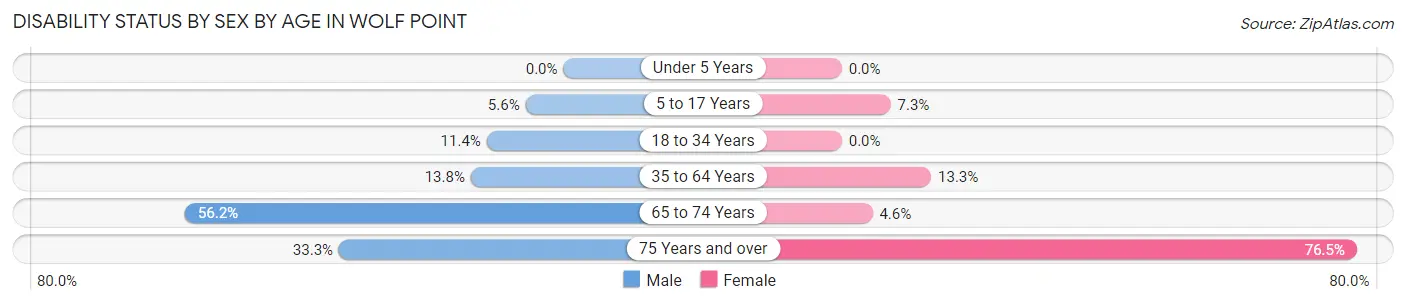
| Age Bracket | Male | Female |
| Under 5 Years | 0 (0.0%) | 0 (0.0%) |
| 5 to 17 Years | 14 (5.6%) | 20 (7.2%) |
| 18 to 34 Years | 41 (11.4%) | 0 (0.0%) |
| 35 to 64 Years | 48 (13.8%) | 50 (13.3%) |
| 65 to 74 Years | 59 (56.2%) | 4 (4.5%) |
| 75 Years and over | 7 (33.3%) | 65 (76.5%) |
Disability Class by Sex by Age in Wolf Point
Disability Class: Hearing Difficulty
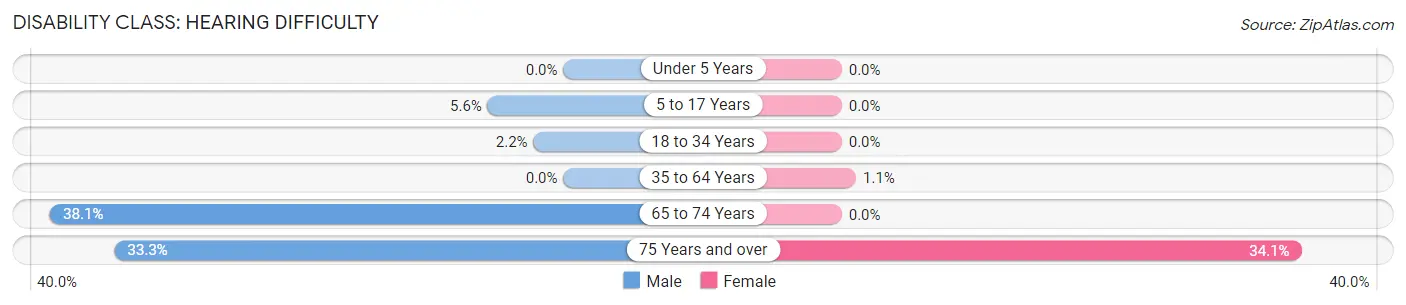
| Age Bracket | Male | Female |
| Under 5 Years | 0 (0.0%) | 0 (0.0%) |
| 5 to 17 Years | 14 (5.6%) | 0 (0.0%) |
| 18 to 34 Years | 8 (2.2%) | 0 (0.0%) |
| 35 to 64 Years | 0 (0.0%) | 4 (1.1%) |
| 65 to 74 Years | 40 (38.1%) | 0 (0.0%) |
| 75 Years and over | 7 (33.3%) | 29 (34.1%) |
Disability Class: Vision Difficulty
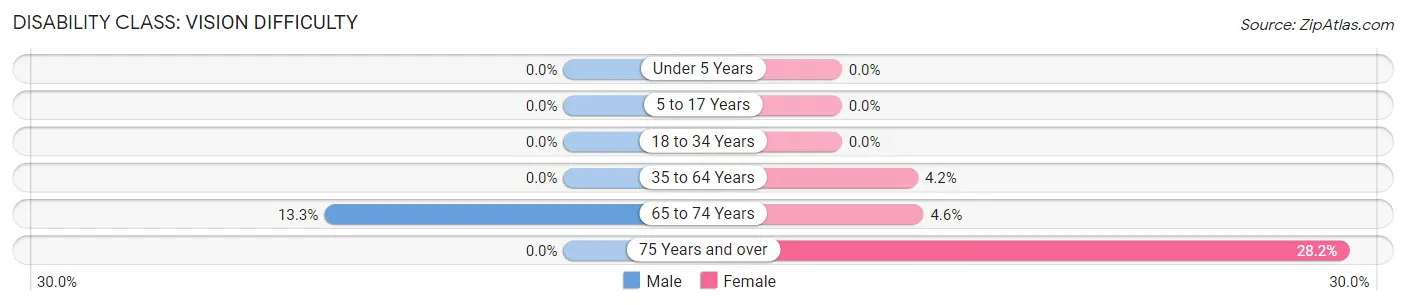
| Age Bracket | Male | Female |
| Under 5 Years | 0 (0.0%) | 0 (0.0%) |
| 5 to 17 Years | 0 (0.0%) | 0 (0.0%) |
| 18 to 34 Years | 0 (0.0%) | 0 (0.0%) |
| 35 to 64 Years | 0 (0.0%) | 16 (4.2%) |
| 65 to 74 Years | 14 (13.3%) | 4 (4.5%) |
| 75 Years and over | 0 (0.0%) | 24 (28.2%) |
Disability Class: Cognitive Difficulty
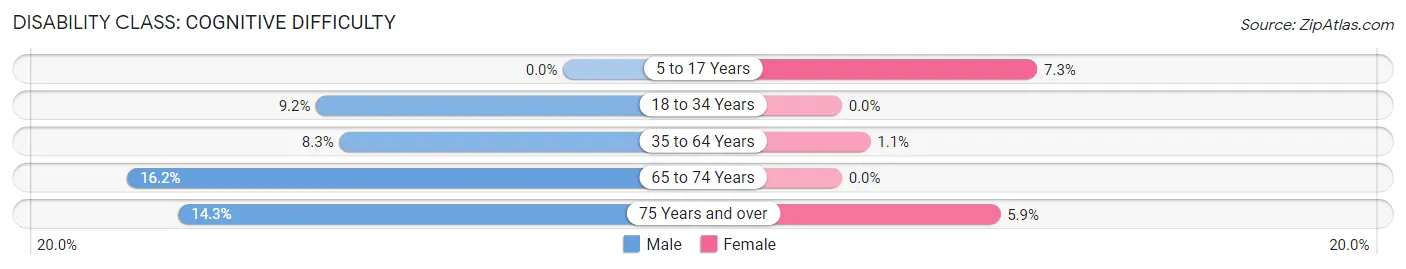
| Age Bracket | Male | Female |
| 5 to 17 Years | 0 (0.0%) | 20 (7.2%) |
| 18 to 34 Years | 33 (9.2%) | 0 (0.0%) |
| 35 to 64 Years | 29 (8.3%) | 4 (1.1%) |
| 65 to 74 Years | 17 (16.2%) | 0 (0.0%) |
| 75 Years and over | 3 (14.3%) | 5 (5.9%) |
Disability Class: Ambulatory Difficulty

| Age Bracket | Male | Female |
| 5 to 17 Years | 0 (0.0%) | 0 (0.0%) |
| 18 to 34 Years | 0 (0.0%) | 0 (0.0%) |
| 35 to 64 Years | 19 (5.4%) | 39 (10.3%) |
| 65 to 74 Years | 49 (46.7%) | 0 (0.0%) |
| 75 Years and over | 0 (0.0%) | 37 (43.5%) |
Disability Class: Self-Care Difficulty
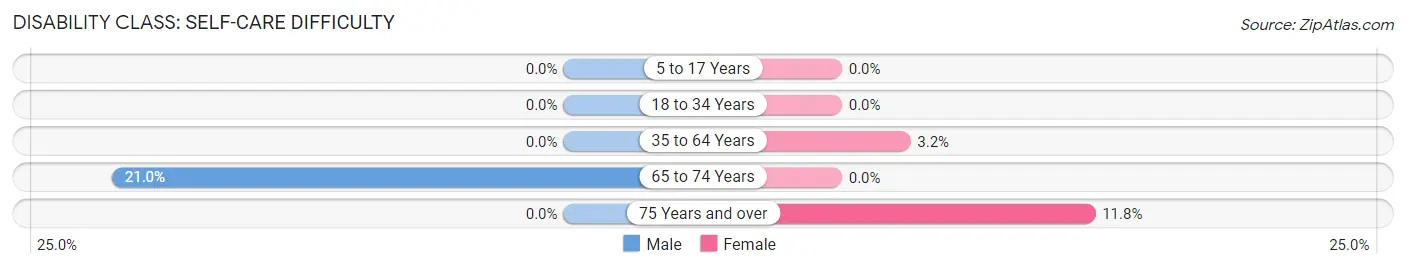
| Age Bracket | Male | Female |
| 5 to 17 Years | 0 (0.0%) | 0 (0.0%) |
| 18 to 34 Years | 0 (0.0%) | 0 (0.0%) |
| 35 to 64 Years | 0 (0.0%) | 12 (3.2%) |
| 65 to 74 Years | 22 (20.9%) | 0 (0.0%) |
| 75 Years and over | 0 (0.0%) | 10 (11.8%) |
Technology Access in Wolf Point
Computing Device Access in Wolf Point
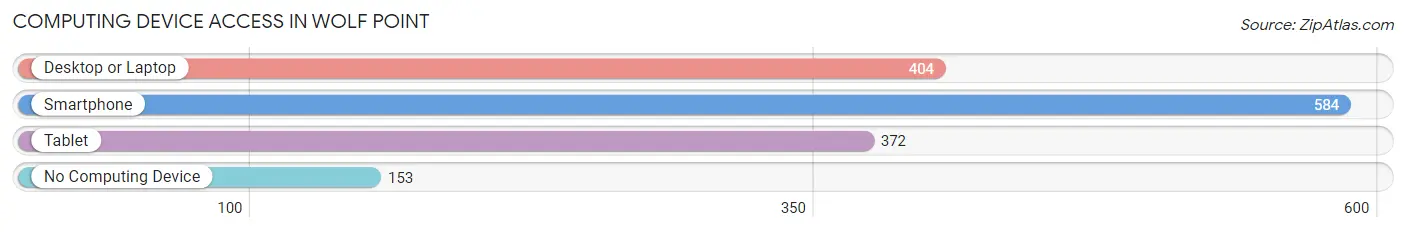
| Device Type | # Households | % Households |
| Desktop or Laptop | 404 | 52.3% |
| Smartphone | 584 | 75.6% |
| Tablet | 372 | 48.2% |
| No Computing Device | 153 | 19.8% |
| Total | 772 | 100.0% |
Internet Access in Wolf Point
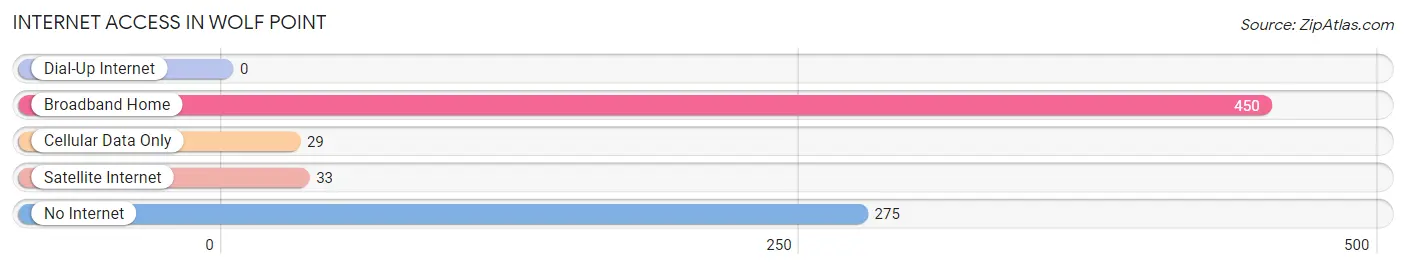
| Internet Type | # Households | % Households |
| Dial-Up Internet | 0 | 0.0% |
| Broadband Home | 450 | 58.3% |
| Cellular Data Only | 29 | 3.8% |
| Satellite Internet | 33 | 4.3% |
| No Internet | 275 | 35.6% |
| Total | 772 | 100.0% |
Wolf Point Summary
Wolf Point, Montana is a small city located in the northeastern corner of the state. It is the county seat of Roosevelt County and is situated on the banks of the Missouri River. The city has a population of approximately 3,000 people and is the largest city in the county.
History
The area that is now Wolf Point was first inhabited by the Assiniboine and Sioux Native American tribes. The first white settlers arrived in the area in the late 1800s and established a trading post. The town was officially founded in 1901 and was named after a nearby hill that was said to resemble a wolf’s head.
In the early 1900s, Wolf Point was a bustling town with a variety of businesses, including a hotel, saloon, and general store. The town was also home to a number of churches, including the First Presbyterian Church, which was established in 1906.
In the 1920s, Wolf Point experienced a period of growth and prosperity. The town was home to a number of businesses, including a bank, a movie theater, and a variety of stores. The town also had a number of churches, including the First Presbyterian Church, which was established in 1906.
In the 1940s, Wolf Point experienced a period of decline. The Great Depression and World War II had a negative impact on the town’s economy. Many businesses closed and the population decreased.
In the 1950s, Wolf Point experienced a period of revitalization. The town was home to a number of businesses, including a bank, a movie theater, and a variety of stores. The town also had a number of churches, including the First Presbyterian Church, which was established in 1906.
In the 1960s, Wolf Point experienced a period of growth and prosperity. The town was home to a number of businesses, including a bank, a movie theater, and a variety of stores. The town also had a number of churches, including the First Presbyterian Church, which was established in 1906.
In the 1970s, Wolf Point experienced a period of decline. The town was home to a number of businesses, including a bank, a movie theater, and a variety of stores. The town also had a number of churches, including the First Presbyterian Church, which was established in 1906.
Geography
Wolf Point is located in the northeastern corner of Montana, on the banks of the Missouri River. The city is situated in a valley surrounded by rolling hills and prairies. The city is located approximately 50 miles from the North Dakota border and is approximately 200 miles from the Canadian border.
The climate in Wolf Point is semi-arid, with hot summers and cold winters. The average temperature in the summer is around 80 degrees Fahrenheit, while the average temperature in the winter is around 20 degrees Fahrenheit.
Economy
The economy of Wolf Point is largely based on agriculture and tourism. The city is home to a number of farms, which produce a variety of crops, including wheat, barley, and hay. The city is also home to a number of tourist attractions, including the Fort Peck Dam and the Wolf Point Museum.
The city is also home to a number of businesses, including a bank, a movie theater, and a variety of stores. The city also has a number of churches, including the First Presbyterian Church, which was established in 1906.
Demographics
As of the 2010 census, the population of Wolf Point was 3,100. The racial makeup of the city was 94.3% White, 0.7% African American, 0.7% Native American, 0.3% Asian, 0.1% Pacific Islander, and 3.9% from other races. The median household income was $35,000 and the median family income was $41,000.
Conclusion
Wolf Point, Montana is a small city located in the northeastern corner of the state. It is the county seat of Roosevelt County and is situated on the banks of the Missouri River. The city has a population of approximately 3,000 people and is the largest city in the county. The economy of Wolf Point is largely based on agriculture and tourism. The city is home to a number of farms, which produce a variety of crops, including wheat, barley, and hay. The city is also home to a number of tourist attractions, including the Fort Peck Dam and the Wolf Point Museum. The racial makeup of the city is 94.3% White, 0.7% African American, 0.7% Native American, 0.3% Asian, 0.1% Pacific Islander, and 3.9% from other races. The median household income was $35,000 and the median family income was $41,000.
Common Questions
What is Per Capita Income in Wolf Point?
Per Capita income in Wolf Point is $18,714.
What is the Median Family Income in Wolf Point?
Median Family Income in Wolf Point is $55,000.
What is the Median Household income in Wolf Point?
Median Household Income in Wolf Point is $46,389.
What is Income or Wage Gap in Wolf Point?
Income or Wage Gap in Wolf Point is 11.6%.
Women in Wolf Point earn 88.4 cents for every dollar earned by a man.
What is Inequality or Gini Index in Wolf Point?
Inequality or Gini Index in Wolf Point is 0.41.
What is the Total Population of Wolf Point?
Total Population of Wolf Point is 2,634.
What is the Total Male Population of Wolf Point?
Total Male Population of Wolf Point is 1,327.
What is the Total Female Population of Wolf Point?
Total Female Population of Wolf Point is 1,307.
What is the Ratio of Males per 100 Females in Wolf Point?
There are 101.53 Males per 100 Females in Wolf Point.
What is the Ratio of Females per 100 Males in Wolf Point?
There are 98.49 Females per 100 Males in Wolf Point.
What is the Median Population Age in Wolf Point?
Median Population Age in Wolf Point is 30.3 Years.
What is the Average Family Size in Wolf Point
Average Family Size in Wolf Point is 4.3 People.
What is the Average Household Size in Wolf Point
Average Household Size in Wolf Point is 3.2 People.
How Large is the Labor Force in Wolf Point?
There are 1,118 People in the Labor Forcein in Wolf Point.
What is the Percentage of People in the Labor Force in Wolf Point?
56.1% of People are in the Labor Force in Wolf Point.
What is the Unemployment Rate in Wolf Point?
Unemployment Rate in Wolf Point is 16.6%.