St Marie, MT Map & Demographics
St Marie Map
St Marie Overview
$15,911
PER CAPITA INCOME
$36,597
AVG FAMILY INCOME
$36,509
AVG HOUSEHOLD INCOME
0.34
INEQUALITY / GINI INDEX
428
TOTAL POPULATION
156
MALE POPULATION
272
FEMALE POPULATION
57.35
MALES / 100 FEMALES
174.36
FEMALES / 100 MALES
37.8
MEDIAN AGE
4.6
AVG FAMILY SIZE
2.7
AVG HOUSEHOLD SIZE
112
LABOR FORCE [ PEOPLE ]
29.6%
PERCENT IN LABOR FORCE
24.1%
UNEMPLOYMENT RATE
Income in St Marie
Income Overview in St Marie
Per Capita Income in St Marie is $15,911, while median incomes of families and households are $36,597 and $36,509 respectively.
| Characteristic | Number | Measure |
| Per Capita Income | 428 | $15,911 |
| Median Family Income | 75 | $36,597 |
| Mean Family Income | 75 | $44,608 |
| Median Household Income | 157 | $36,509 |
| Mean Household Income | 157 | $35,779 |
| Income Deficit | 75 | $0 |
| Wage / Income Gap (%) | 428 | 0.00% |
| Wage / Income Gap ($) | 428 | 100.00¢ per $1 |
| Gini / Inequality Index | 428 | 0.34 |
Earnings by Sex in St Marie
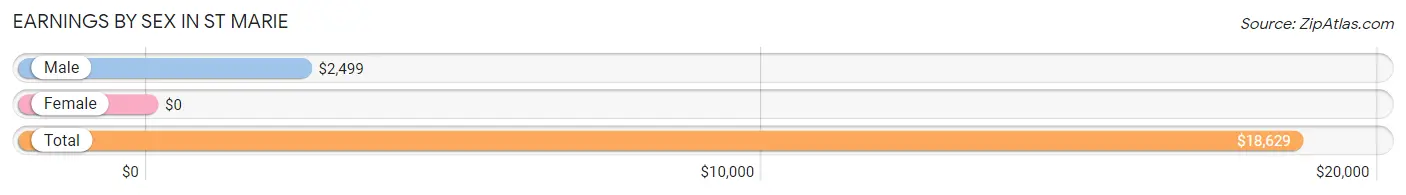
| Sex | Number | Average Earnings |
| Male | 48 (39.3%) | $2,499 |
| Female | 74 (60.7%) | $0 |
| Total | 122 (100.0%) | $18,629 |
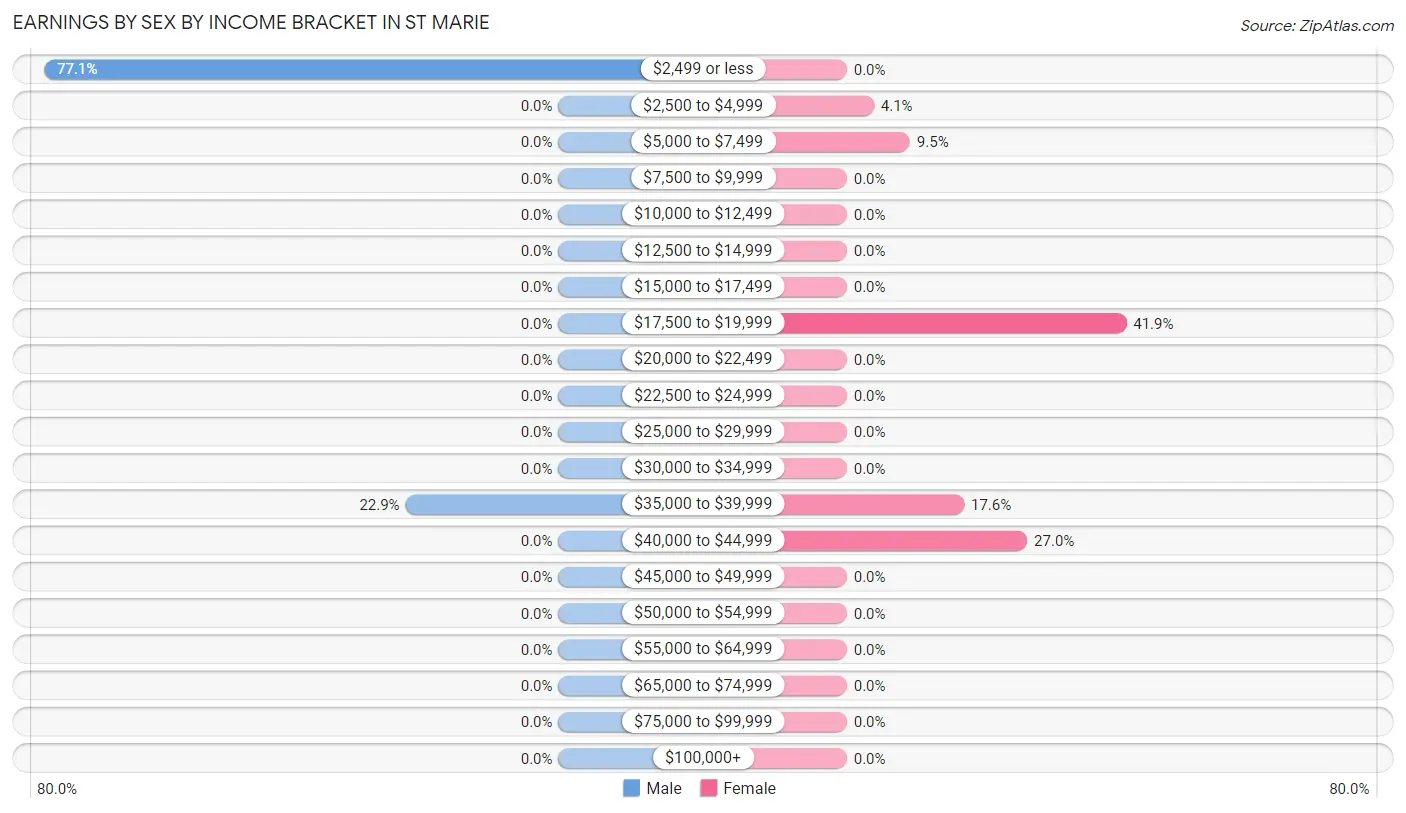
Earnings by Sex by Income Bracket in St Marie
The most common earnings brackets in St Marie are $2,499 or less for men (37 | 77.1%) and $17,500 to $19,999 for women (31 | 41.9%).
| Income | Male | Female |
| $2,499 or less | 37 (77.1%) | 0 (0.0%) |
| $2,500 to $4,999 | 0 (0.0%) | 3 (4.1%) |
| $5,000 to $7,499 | 0 (0.0%) | 7 (9.5%) |
| $7,500 to $9,999 | 0 (0.0%) | 0 (0.0%) |
| $10,000 to $12,499 | 0 (0.0%) | 0 (0.0%) |
| $12,500 to $14,999 | 0 (0.0%) | 0 (0.0%) |
| $15,000 to $17,499 | 0 (0.0%) | 0 (0.0%) |
| $17,500 to $19,999 | 0 (0.0%) | 31 (41.9%) |
| $20,000 to $22,499 | 0 (0.0%) | 0 (0.0%) |
| $22,500 to $24,999 | 0 (0.0%) | 0 (0.0%) |
| $25,000 to $29,999 | 0 (0.0%) | 0 (0.0%) |
| $30,000 to $34,999 | 0 (0.0%) | 0 (0.0%) |
| $35,000 to $39,999 | 11 (22.9%) | 13 (17.6%) |
| $40,000 to $44,999 | 0 (0.0%) | 20 (27.0%) |
| $45,000 to $49,999 | 0 (0.0%) | 0 (0.0%) |
| $50,000 to $54,999 | 0 (0.0%) | 0 (0.0%) |
| $55,000 to $64,999 | 0 (0.0%) | 0 (0.0%) |
| $65,000 to $74,999 | 0 (0.0%) | 0 (0.0%) |
| $75,000 to $99,999 | 0 (0.0%) | 0 (0.0%) |
| $100,000+ | 0 (0.0%) | 0 (0.0%) |
| Total | 48 (100.0%) | 74 (100.0%) |
Earnings by Sex by Educational Attainment in St Marie
| Educational Attainment | Male Income | Female Income |
| Less than High School | - | - |
| High School Diploma | - | - |
| College or Associate's Degree | - | - |
| Bachelor's Degree | - | - |
| Graduate Degree | - | - |
| Total | - | - |
Family Income in St Marie
Family Income Brackets in St Marie
According to the St Marie family income data, there are 22 families falling into the $50,000 to $74,999 income range, which is the most common income bracket and makes up 29.3% of all families.
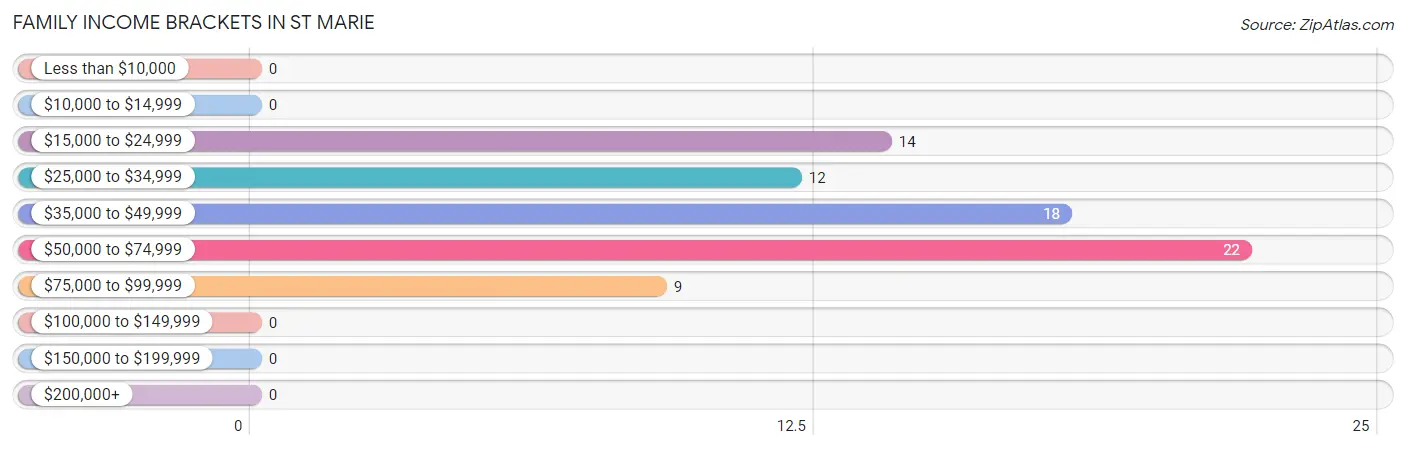
| Income Bracket | # Families | % Families |
| Less than $10,000 | 0 | 0.0% |
| $10,000 to $14,999 | 0 | 0.0% |
| $15,000 to $24,999 | 14 | 18.7% |
| $25,000 to $34,999 | 12 | 16.0% |
| $35,000 to $49,999 | 18 | 24.0% |
| $50,000 to $74,999 | 22 | 29.3% |
| $75,000 to $99,999 | 9 | 12.0% |
| $100,000 to $149,999 | 0 | 0.0% |
| $150,000 to $199,999 | 0 | 0.0% |
| $200,000+ | 0 | 0.0% |
Family Income by Famaliy Size in St Marie
2-person families (40 | 53.3%) account for the highest median family income in St Marie with $52,917 per family, while 2-person families (40 | 53.3%) have the highest median income of $26,458 per family member.
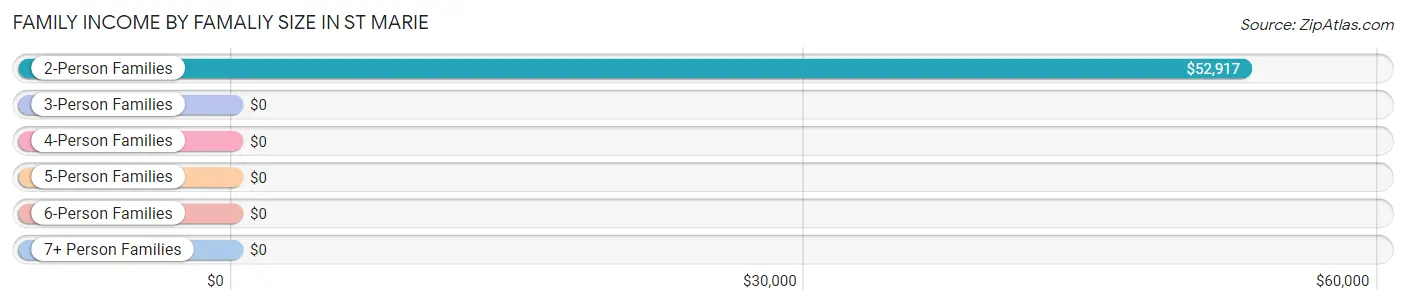
| Income Bracket | # Families | Median Income |
| 2-Person Families | 40 (53.3%) | $52,917 |
| 3-Person Families | 0 (0.0%) | $0 |
| 4-Person Families | 26 (34.7%) | $0 |
| 5-Person Families | 0 (0.0%) | $0 |
| 6-Person Families | 9 (12.0%) | $0 |
| 7+ Person Families | 0 (0.0%) | $0 |
| Total | 75 (100.0%) | $36,597 |
Family Income by Number of Earners in St Marie
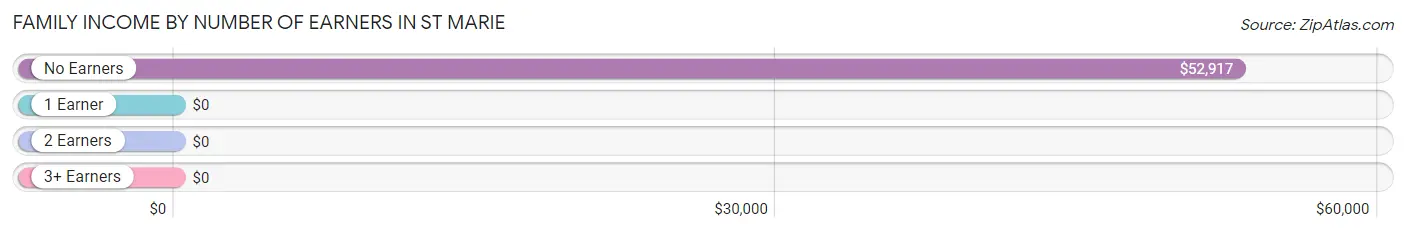
| Number of Earners | # Families | Median Income |
| No Earners | 40 (53.3%) | $52,917 |
| 1 Earner | 12 (16.0%) | $0 |
| 2 Earners | 23 (30.7%) | $0 |
| 3+ Earners | 0 (0.0%) | $0 |
| Total | 75 (100.0%) | $36,597 |
Household Income in St Marie
Household Income Brackets in St Marie
With 58 households falling in the category, the $35,000 to $49,999 income range is the most frequent in St Marie, accounting for 36.9% of all households.
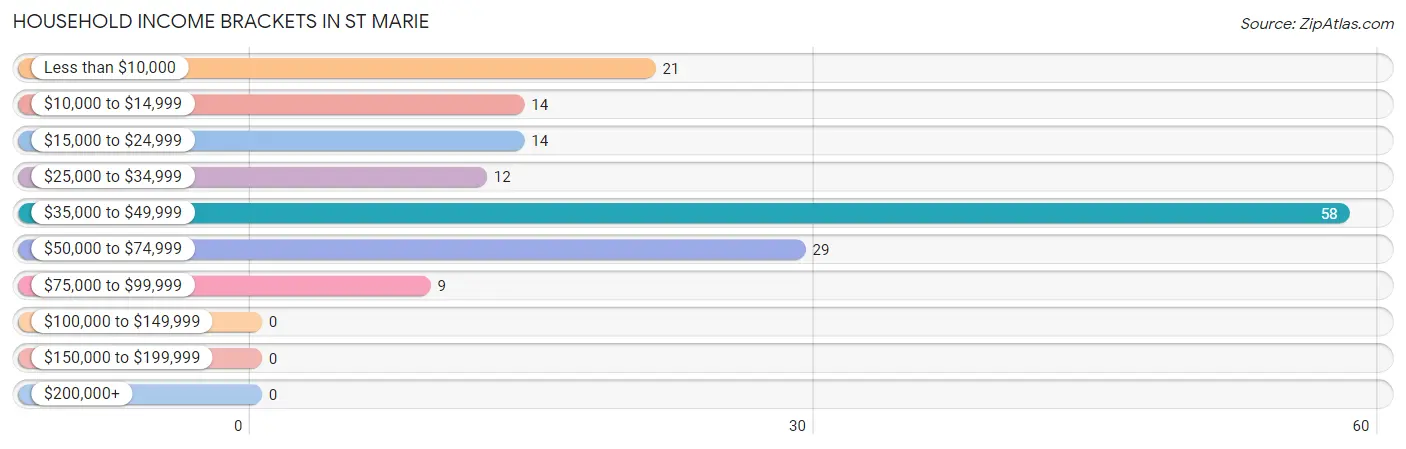
| Income Bracket | # Households | % Households |
| Less than $10,000 | 21 | 13.4% |
| $10,000 to $14,999 | 14 | 8.9% |
| $15,000 to $24,999 | 14 | 8.9% |
| $25,000 to $34,999 | 12 | 7.6% |
| $35,000 to $49,999 | 58 | 36.9% |
| $50,000 to $74,999 | 29 | 18.5% |
| $75,000 to $99,999 | 9 | 5.7% |
| $100,000 to $149,999 | 0 | 0.0% |
| $150,000 to $199,999 | 0 | 0.0% |
| $200,000+ | 0 | 0.0% |
Household Income by Householder Age in St Marie
The median household income in St Marie is $36,509, with the highest median household income of $37,083 found in the 65+ years age bracket for the primary householder. A total of 100 households (63.7%) fall into this category. Meanwhile, the 15 to 24 years age bracket for the primary householder has the lowest median household income of $0, with 3 households (1.9%) in this group.
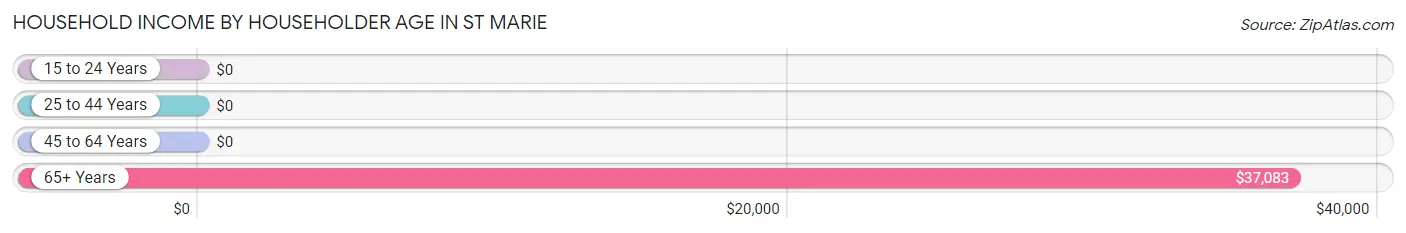
| Income Bracket | # Households | Median Income |
| 15 to 24 Years | 3 (1.9%) | $0 |
| 25 to 44 Years | 26 (16.6%) | $0 |
| 45 to 64 Years | 28 (17.8%) | $0 |
| 65+ Years | 100 (63.7%) | $37,083 |
| Total | 157 (100.0%) | $36,509 |
Poverty in St Marie
Income Below Poverty by Sex and Age in St Marie
With 55.8% poverty level for males and 27.2% for females among the residents of St Marie, 6 to 11 year old males and 6 to 11 year old females are the most vulnerable to poverty, with 19 males (100.0%) and 19 females (100.0%) in their respective age groups living below the poverty level.
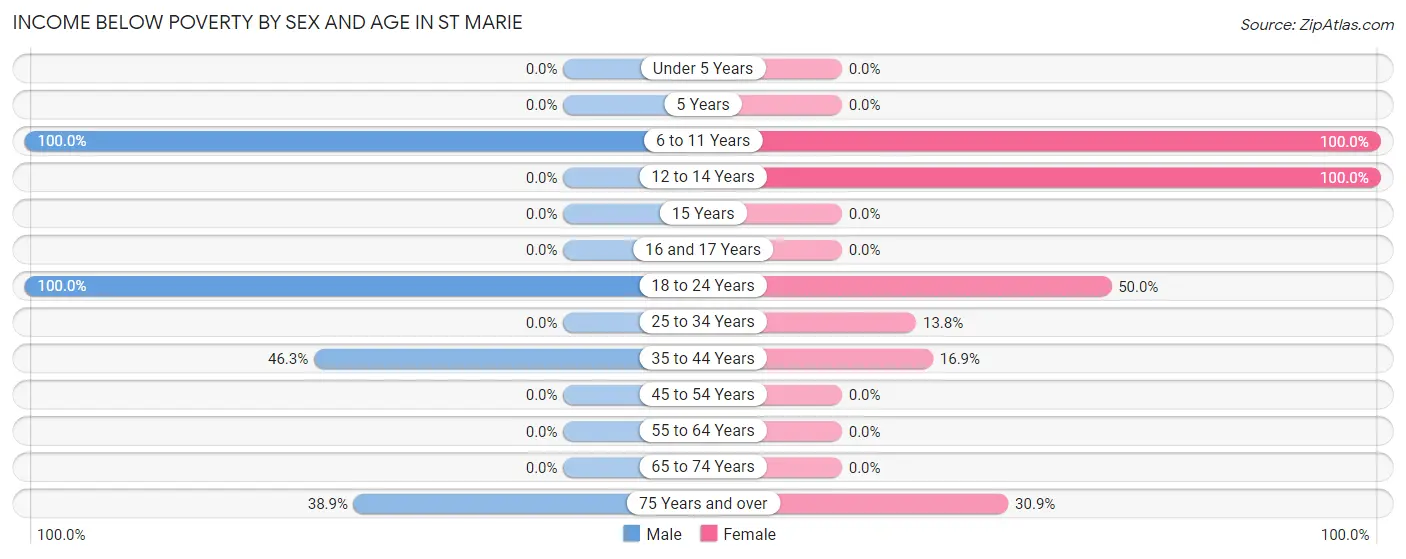
| Age Bracket | Male | Female |
| Under 5 Years | 0 (0.0%) | 0 (0.0%) |
| 5 Years | 0 (0.0%) | 0 (0.0%) |
| 6 to 11 Years | 19 (100.0%) | 19 (100.0%) |
| 12 to 14 Years | 0 (0.0%) | 11 (100.0%) |
| 15 Years | 0 (0.0%) | 0 (0.0%) |
| 16 and 17 Years | 0 (0.0%) | 0 (0.0%) |
| 18 to 24 Years | 23 (100.0%) | 3 (50.0%) |
| 25 to 34 Years | 0 (0.0%) | 8 (13.8%) |
| 35 to 44 Years | 31 (46.3%) | 12 (16.9%) |
| 45 to 54 Years | 0 (0.0%) | 0 (0.0%) |
| 55 to 64 Years | 0 (0.0%) | 0 (0.0%) |
| 65 to 74 Years | 0 (0.0%) | 0 (0.0%) |
| 75 Years and over | 14 (38.9%) | 21 (30.9%) |
| Total | 87 (55.8%) | 74 (27.2%) |
Income Above Poverty by Sex and Age in St Marie
According to the poverty statistics in St Marie, males aged 55 to 64 years and females aged 45 to 54 years are the age groups that are most secure financially, with 100.0% of males and 100.0% of females in these age groups living above the poverty line.
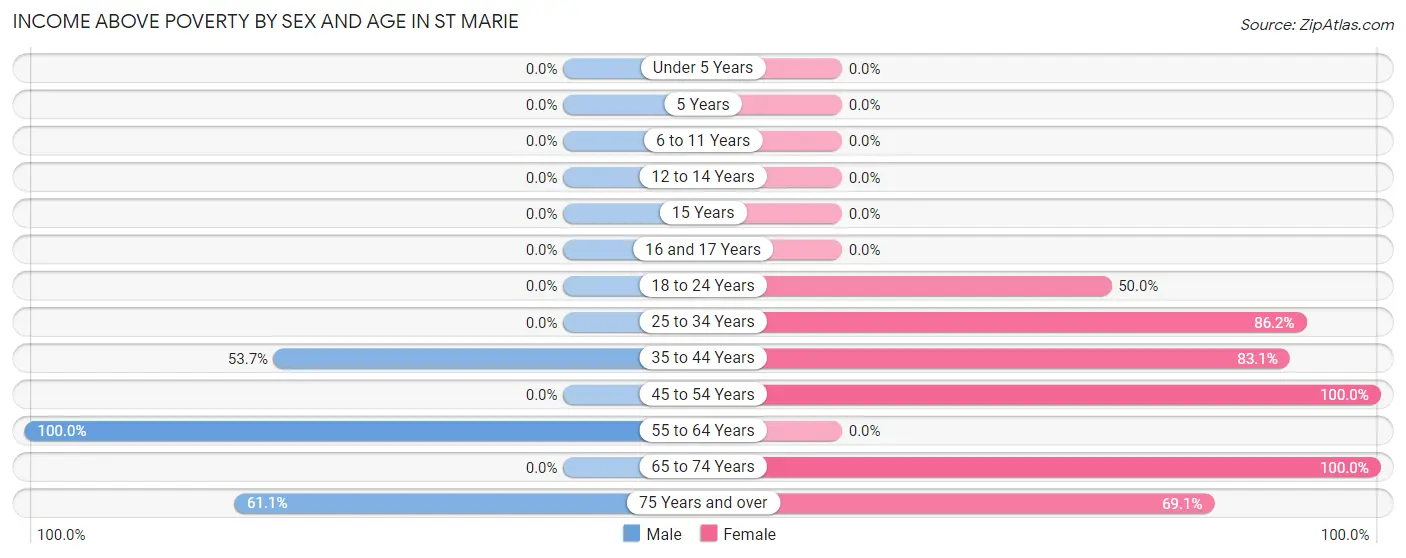
| Age Bracket | Male | Female |
| Under 5 Years | 0 (0.0%) | 0 (0.0%) |
| 5 Years | 0 (0.0%) | 0 (0.0%) |
| 6 to 11 Years | 0 (0.0%) | 0 (0.0%) |
| 12 to 14 Years | 0 (0.0%) | 0 (0.0%) |
| 15 Years | 0 (0.0%) | 0 (0.0%) |
| 16 and 17 Years | 0 (0.0%) | 0 (0.0%) |
| 18 to 24 Years | 0 (0.0%) | 3 (50.0%) |
| 25 to 34 Years | 0 (0.0%) | 50 (86.2%) |
| 35 to 44 Years | 36 (53.7%) | 59 (83.1%) |
| 45 to 54 Years | 0 (0.0%) | 17 (100.0%) |
| 55 to 64 Years | 11 (100.0%) | 0 (0.0%) |
| 65 to 74 Years | 0 (0.0%) | 22 (100.0%) |
| 75 Years and over | 22 (61.1%) | 47 (69.1%) |
| Total | 69 (44.2%) | 198 (72.8%) |
Income Below Poverty Among Married-Couple Families in St Marie
The poverty statistics for married-couple families in St Marie show that 54.2% or 26 of the total 48 families live below the poverty line. Families with 1 or 2 children have the highest poverty rate of 100.0%, comprising of 26 families. On the other hand, families with no children have the lowest poverty rate of 0.0%, which includes 0 families.
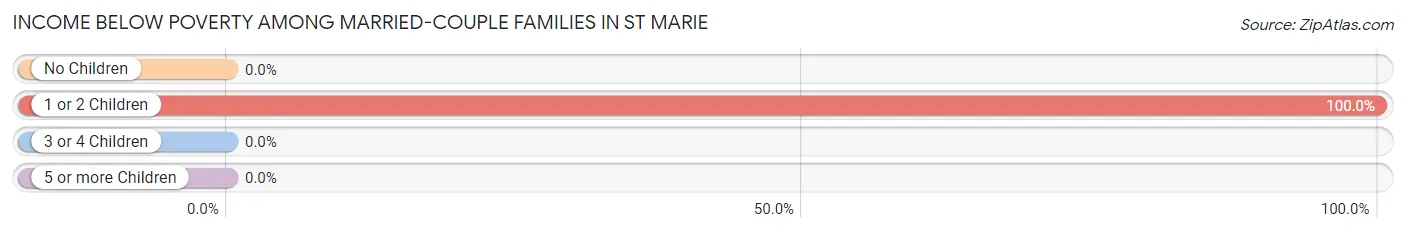
| Children | Above Poverty | Below Poverty |
| No Children | 22 (100.0%) | 0 (0.0%) |
| 1 or 2 Children | 0 (0.0%) | 26 (100.0%) |
| 3 or 4 Children | 0 (0.0%) | 0 (0.0%) |
| 5 or more Children | 0 (0.0%) | 0 (0.0%) |
| Total | 22 (45.8%) | 26 (54.2%) |
Income Below Poverty Among Single-Parent Households in St Marie
| Children | Single Father | Single Mother |
| No Children | 0 (0.0%) | 0 (0.0%) |
| 1 or 2 Children | 0 (0.0%) | 0 (0.0%) |
| 3 or 4 Children | 0 (0.0%) | 0 (0.0%) |
| 5 or more Children | 0 (0.0%) | 0 (0.0%) |
| Total | 0 (0.0%) | 0 (0.0%) |
Income Below Poverty Among Married-Couple vs Single-Parent Households in St Marie
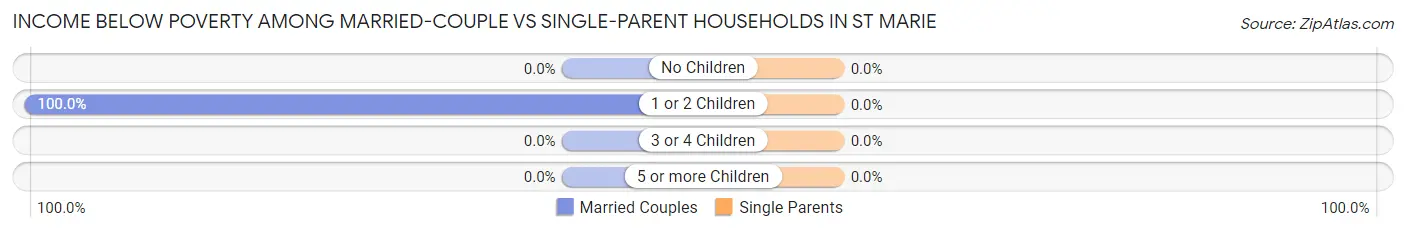
| Children | Married-Couple Families | Single-Parent Households |
| No Children | 0 (0.0%) | 0 (0.0%) |
| 1 or 2 Children | 26 (100.0%) | 0 (0.0%) |
| 3 or 4 Children | 0 (0.0%) | 0 (0.0%) |
| 5 or more Children | 0 (0.0%) | 0 (0.0%) |
| Total | 26 (54.2%) | 0 (0.0%) |
Race in St Marie
The most populous races in St Marie are White / Caucasian (249 | 58.2%), Two or more Races (170 | 39.7%), and Native / Alaskan (9 | 2.1%).
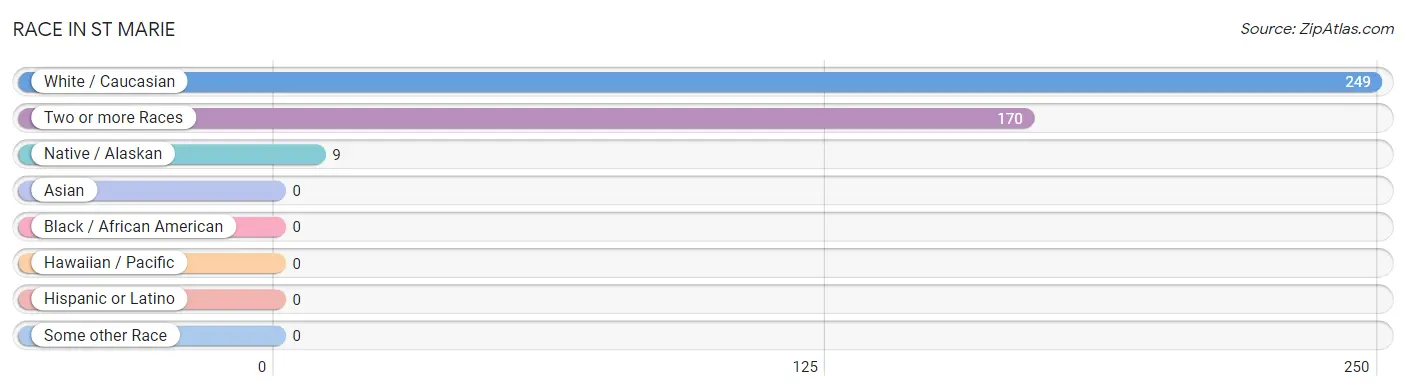
| Race | # Population | % Population |
| Asian | 0 | 0.0% |
| Black / African American | 0 | 0.0% |
| Hawaiian / Pacific | 0 | 0.0% |
| Hispanic or Latino | 0 | 0.0% |
| Native / Alaskan | 9 | 2.1% |
| White / Caucasian | 249 | 58.2% |
| Two or more Races | 170 | 39.7% |
| Some other Race | 0 | 0.0% |
| Total | 428 | 100.0% |
Ancestry in St Marie
The most populous ancestries reported in St Marie are German (70 | 16.4%), European (58 | 13.6%), Indian (Asian) (52 | 12.1%), Native Hawaiian (52 | 12.1%), and Norwegian (16 | 3.7%), together accounting for 58.0% of all St Marie residents.
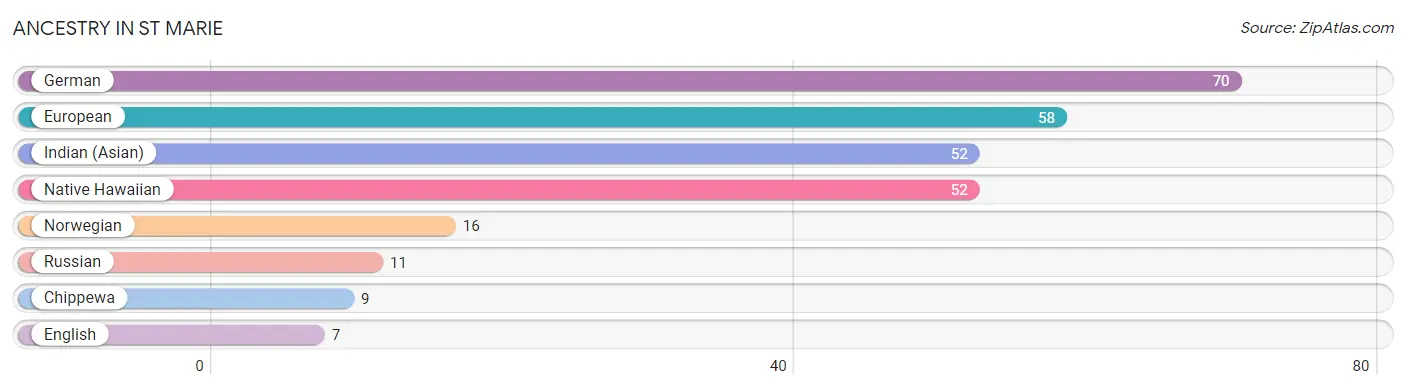
| Ancestry | # Population | % Population |
| Chippewa | 9 | 2.1% |
| English | 7 | 1.6% |
| European | 58 | 13.6% |
| German | 70 | 16.4% |
| Indian (Asian) | 52 | 12.1% |
| Native Hawaiian | 52 | 12.1% |
| Norwegian | 16 | 3.7% |
| Russian | 11 | 2.6% | View All 8 Rows |
Immigrants in St Marie

| Immigration Origin | # Population | % Population | View All 0 Rows |
Sex and Age in St Marie
Sex and Age in St Marie
The most populous age groups in St Marie are 35 to 39 Years (67 | 42.9%) for men and 35 to 39 Years (48 | 17.6%) for women.
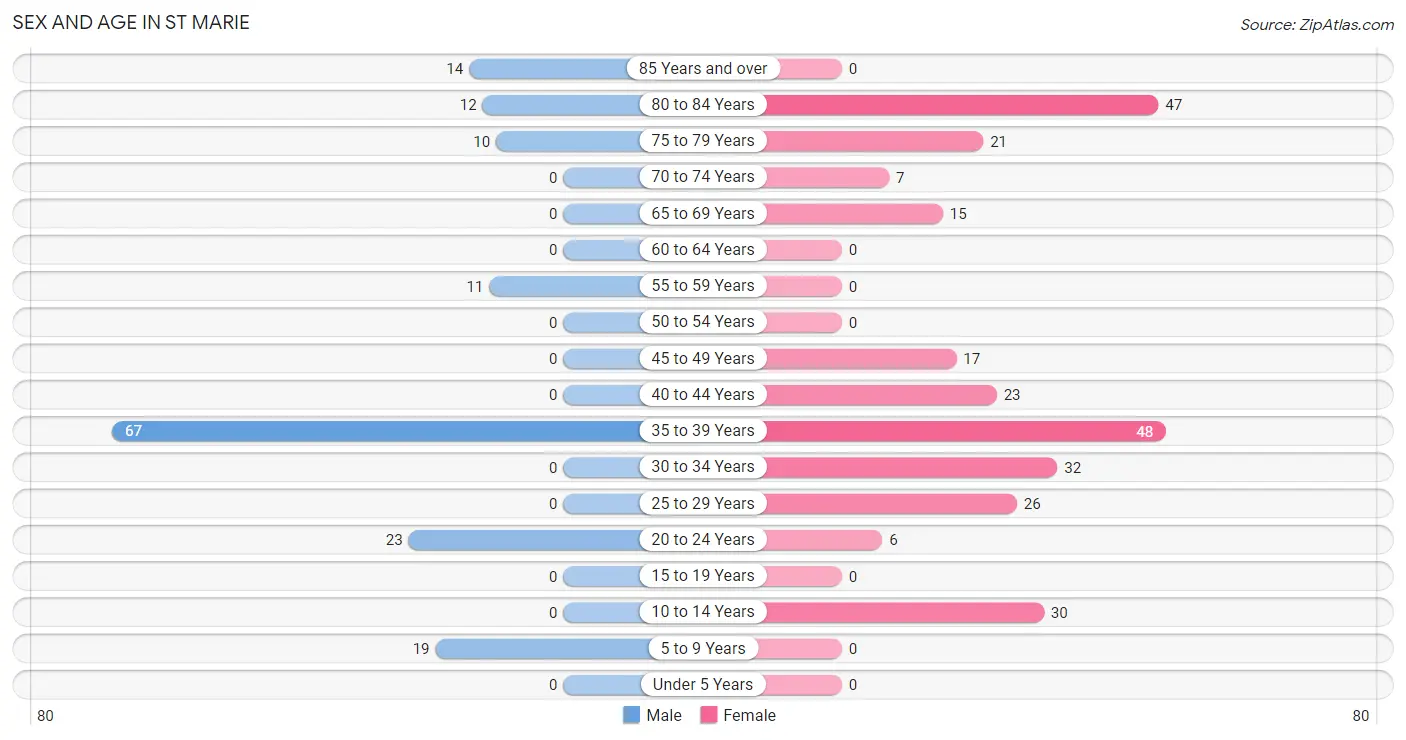
| Age Bracket | Male | Female |
| Under 5 Years | 0 (0.0%) | 0 (0.0%) |
| 5 to 9 Years | 19 (12.2%) | 0 (0.0%) |
| 10 to 14 Years | 0 (0.0%) | 30 (11.0%) |
| 15 to 19 Years | 0 (0.0%) | 0 (0.0%) |
| 20 to 24 Years | 23 (14.7%) | 6 (2.2%) |
| 25 to 29 Years | 0 (0.0%) | 26 (9.6%) |
| 30 to 34 Years | 0 (0.0%) | 32 (11.8%) |
| 35 to 39 Years | 67 (42.9%) | 48 (17.6%) |
| 40 to 44 Years | 0 (0.0%) | 23 (8.5%) |
| 45 to 49 Years | 0 (0.0%) | 17 (6.2%) |
| 50 to 54 Years | 0 (0.0%) | 0 (0.0%) |
| 55 to 59 Years | 11 (7.0%) | 0 (0.0%) |
| 60 to 64 Years | 0 (0.0%) | 0 (0.0%) |
| 65 to 69 Years | 0 (0.0%) | 15 (5.5%) |
| 70 to 74 Years | 0 (0.0%) | 7 (2.6%) |
| 75 to 79 Years | 10 (6.4%) | 21 (7.7%) |
| 80 to 84 Years | 12 (7.7%) | 47 (17.3%) |
| 85 Years and over | 14 (9.0%) | 0 (0.0%) |
| Total | 156 (100.0%) | 272 (100.0%) |
Families and Households in St Marie
Median Family Size in St Marie
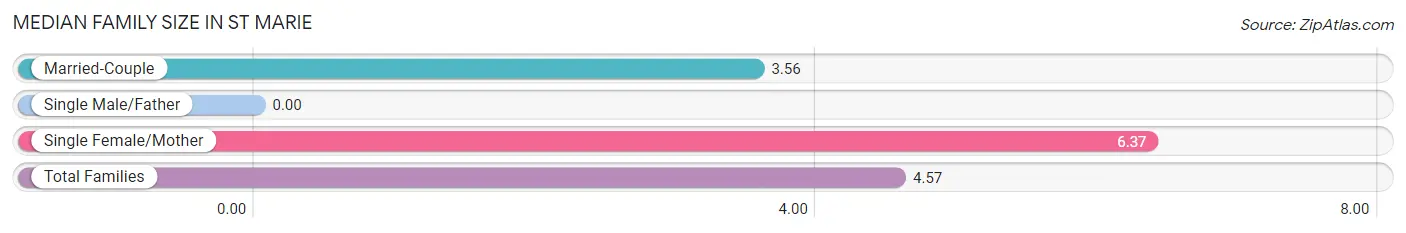
| Family Type | # Families | Family Size |
| Married-Couple | 48 (64.0%) | 3.56 |
| Single Male/Father | 0 (0.0%) | - |
| Single Female/Mother | 27 (36.0%) | 6.37 |
| Total Families | 75 (100.0%) | 4.57 |
Median Household Size in St Marie
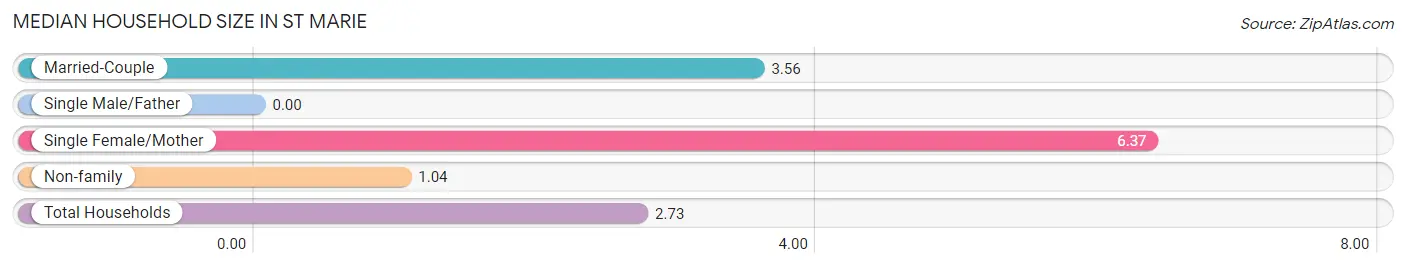
| Household Type | # Households | Household Size |
| Married-Couple | 48 (30.6%) | 3.56 |
| Single Male/Father | 0 (0.0%) | - |
| Single Female/Mother | 27 (17.2%) | 6.37 |
| Non-family | 82 (52.2%) | 1.04 |
| Total Households | 157 (100.0%) | 2.73 |
Household Size by Marriage Status in St Marie
Out of a total of 157 households in St Marie, 75 (47.8%) are family households, while 82 (52.2%) are nonfamily households. The most numerous type of family households are 2-person households, comprising 40, and the most common type of nonfamily households are 1-person households, comprising 79.
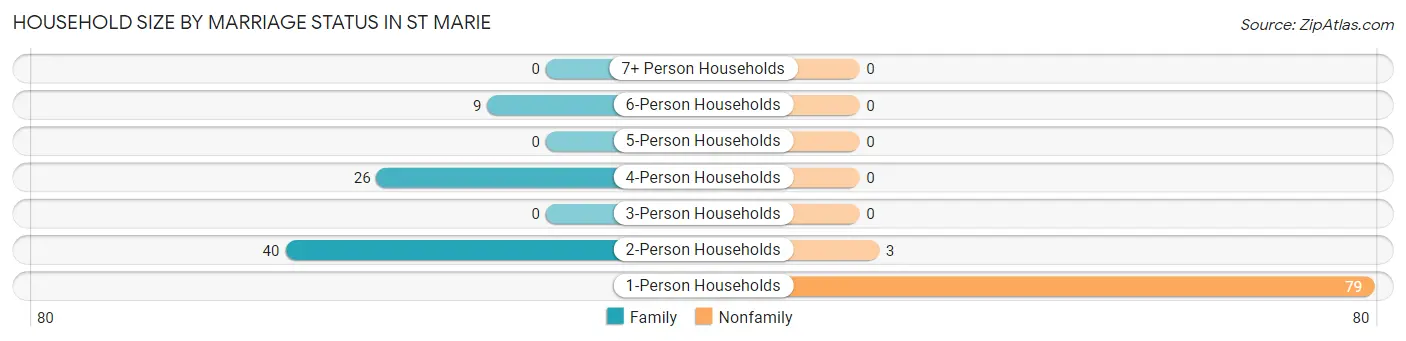
| Household Size | Family Households | Nonfamily Households |
| 1-Person Households | - | 79 (50.3%) |
| 2-Person Households | 40 (25.5%) | 3 (1.9%) |
| 3-Person Households | 0 (0.0%) | 0 (0.0%) |
| 4-Person Households | 26 (16.6%) | 0 (0.0%) |
| 5-Person Households | 0 (0.0%) | 0 (0.0%) |
| 6-Person Households | 9 (5.7%) | 0 (0.0%) |
| 7+ Person Households | 0 (0.0%) | 0 (0.0%) |
| Total | 75 (47.8%) | 82 (52.2%) |
Female Fertility in St Marie
Fertility by Age in St Marie
| Age Bracket | Women with Births | Births / 1,000 Women |
| 15 to 19 years | 0 (0.0%) | 0.0 |
| 20 to 34 years | 0 (0.0%) | 0.0 |
| 35 to 50 years | 0 (0.0%) | 0.0 |
| Total | 0 (0.0%) | 0.0 |
Fertility by Age by Marriage Status in St Marie
| Age Bracket | Married | Unmarried |
| 15 to 19 years | 0 (0.0%) | 0 (0.0%) |
| 20 to 34 years | 0 (0.0%) | 0 (0.0%) |
| 35 to 50 years | 0 (0.0%) | 0 (0.0%) |
| Total | 0 (0.0%) | 0 (0.0%) |
Fertility by Education in St Marie
| Educational Attainment | Women with Births | Births / 1,000 Women |
| Less than High School | 0 (0.0%) | 0.0 |
| High School Diploma | 0 (0.0%) | 0.0 |
| College or Associate's Degree | 0 (0.0%) | 0.0 |
| Bachelor's Degree | 0 (0.0%) | 0.0 |
| Graduate Degree | 0 (0.0%) | 0.0 |
| Total | 0 (0.0%) | 0.0 |
Fertility by Education by Marriage Status in St Marie
| Educational Attainment | Married | Unmarried |
| Less than High School | 0 (0.0%) | 0 (0.0%) |
| High School Diploma | 0 (0.0%) | 0 (0.0%) |
| College or Associate's Degree | 0 (0.0%) | 0 (0.0%) |
| Bachelor's Degree | 0 (0.0%) | 0 (0.0%) |
| Graduate Degree | 0 (0.0%) | 0 (0.0%) |
| Total | 0 (0.0%) | 0 (0.0%) |
Employment Characteristics in St Marie
Employment by Class of Employer in St Marie
Among the 72 employed individuals in St Marie, private company employees (62 | 86.1%), self-employed (not incorporated) (7 | 9.7%), and local government employees (3 | 4.2%) make up the most common classes of employment.
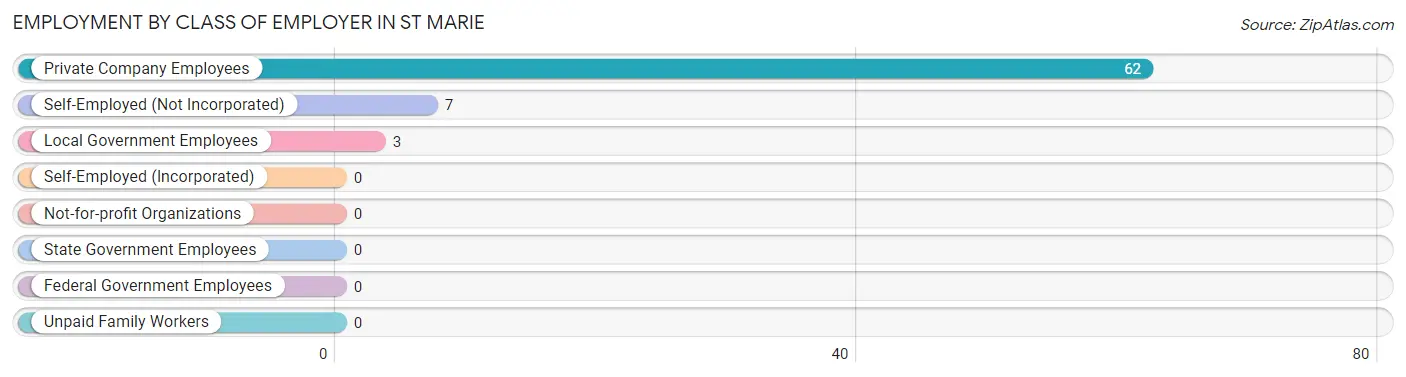
| Employer Class | # Employees | % Employees |
| Private Company Employees | 62 | 86.1% |
| Self-Employed (Incorporated) | 0 | 0.0% |
| Self-Employed (Not Incorporated) | 7 | 9.7% |
| Not-for-profit Organizations | 0 | 0.0% |
| Local Government Employees | 3 | 4.2% |
| State Government Employees | 0 | 0.0% |
| Federal Government Employees | 0 | 0.0% |
| Unpaid Family Workers | 0 | 0.0% |
| Total | 72 | 100.0% |
Employment Status by Age in St Marie
According to the labor force statistics for St Marie, out of the total population over 16 years of age (379), 29.6% or 112 individuals are in the labor force, with 24.1% or 27 of them unemployed. The age group with the highest labor force participation rate is 25 to 29 years, with 100.0% or 26 individuals in the labor force. Within the labor force, the 25 to 29 years age range has the highest percentage of unemployed individuals, with 50.0% or 13 of them being unemployed.
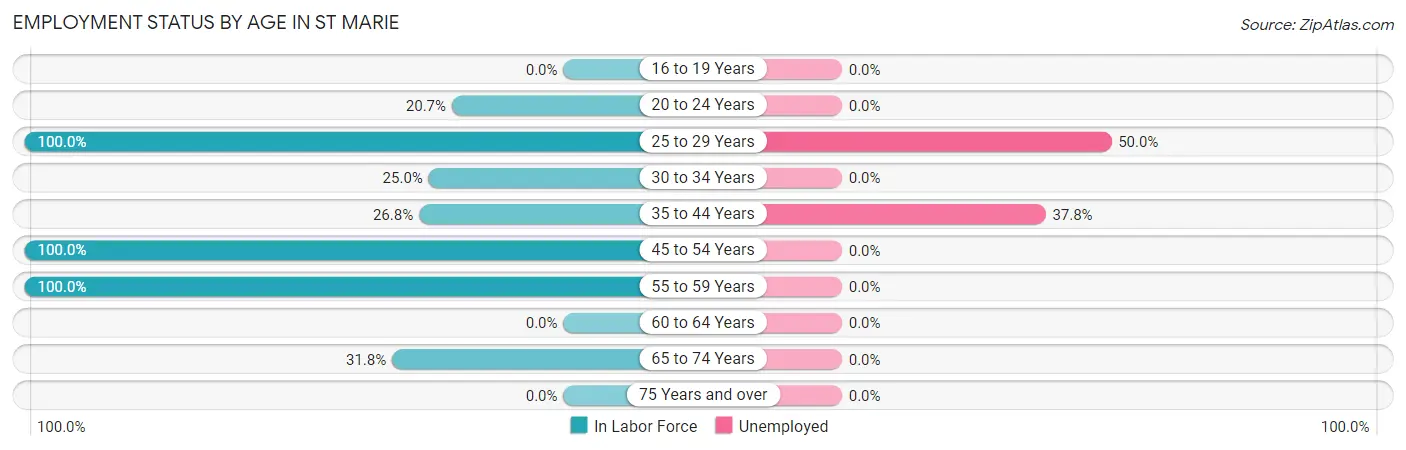
| Age Bracket | In Labor Force | Unemployed |
| 16 to 19 Years | 0 (0.0%) | 0 (0.0%) |
| 20 to 24 Years | 6 (20.7%) | 0 (0.0%) |
| 25 to 29 Years | 26 (100.0%) | 13 (50.0%) |
| 30 to 34 Years | 8 (25.0%) | 0 (0.0%) |
| 35 to 44 Years | 37 (26.8%) | 14 (37.8%) |
| 45 to 54 Years | 17 (100.0%) | 0 (0.0%) |
| 55 to 59 Years | 11 (100.0%) | 0 (0.0%) |
| 60 to 64 Years | 0 (0.0%) | 0 (0.0%) |
| 65 to 74 Years | 7 (31.8%) | 0 (0.0%) |
| 75 Years and over | 0 (0.0%) | 0 (0.0%) |
| Total | 112 (29.6%) | 27 (24.1%) |
Employment Status by Educational Attainment in St Marie
According to labor force statistics for St Marie, 44.2% of individuals (99) out of the total population between 25 and 64 years of age (224) are in the labor force, with 27.3% or 27 of them being unemployed. The group with the highest labor force participation rate are those with the educational attainment of college / associate degree, with 100.0% or 44 individuals in the labor force. Within the labor force, individuals with high school diploma education have the highest percentage of unemployment, with 40.6% or 13 of them being unemployed.
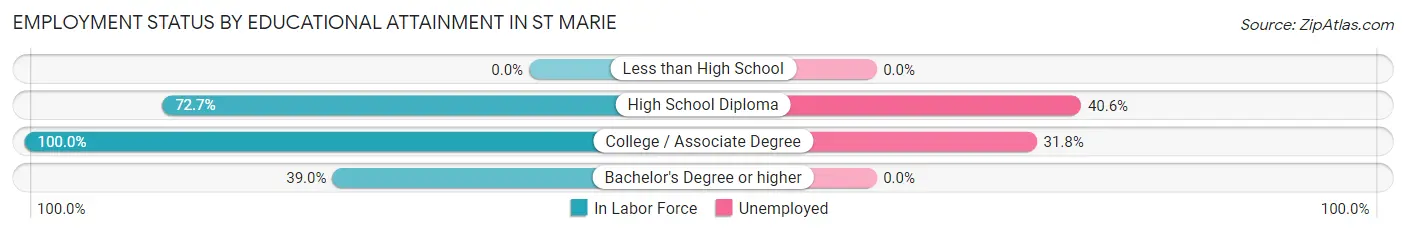
| Educational Attainment | In Labor Force | Unemployed |
| Less than High School | 0 (0.0%) | 0 (0.0%) |
| High School Diploma | 32 (72.7%) | 18 (40.6%) |
| College / Associate Degree | 44 (100.0%) | 14 (31.8%) |
| Bachelor's Degree or higher | 23 (39.0%) | 0 (0.0%) |
| Total | 99 (44.2%) | 61 (27.3%) |
Employment Occupations by Sex in St Marie
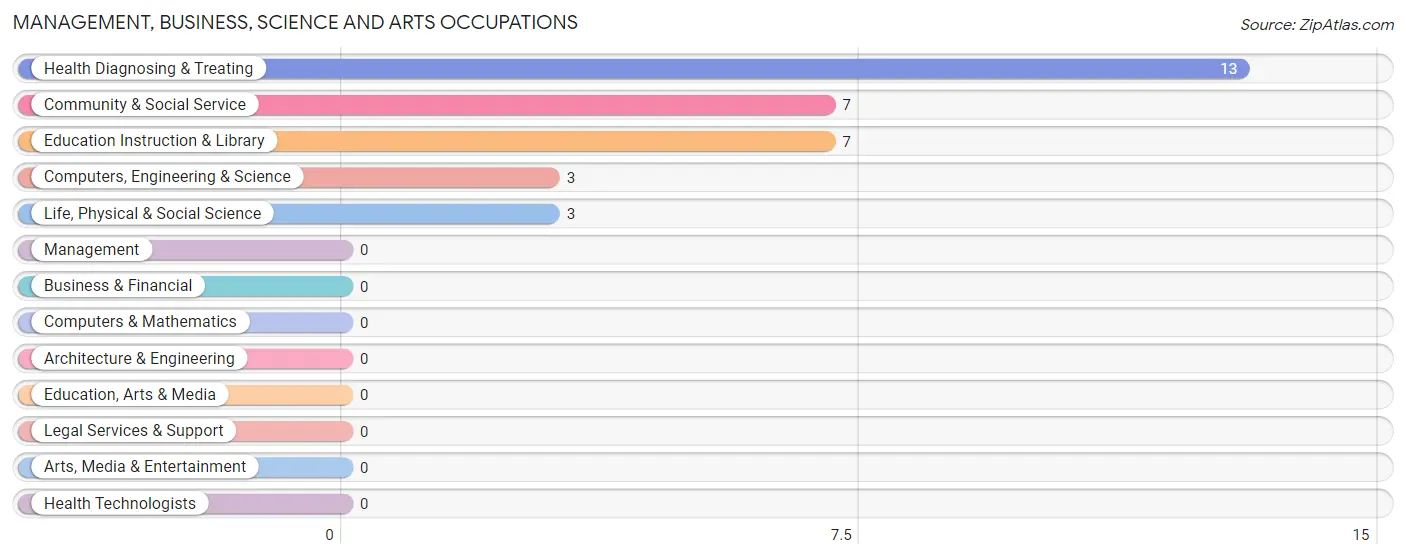
Management, Business, Science and Arts Occupations
The most common Management, Business, Science and Arts occupations in St Marie are Health Diagnosing & Treating (13 | 15.3%), Community & Social Service (7 | 8.2%), Education Instruction & Library (7 | 8.2%), Computers, Engineering & Science (3 | 3.5%), and Life, Physical & Social Science (3 | 3.5%).
Management, Business, Science and Arts Occupations by Sex
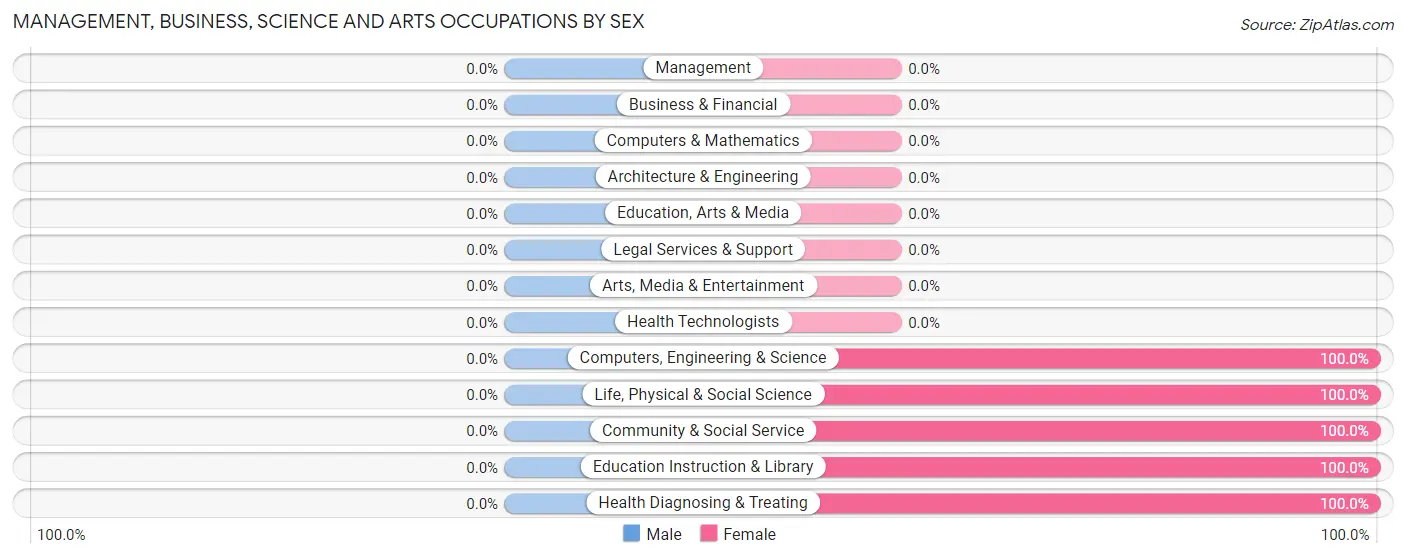
| Occupation | Male | Female |
| Management | 0 (0.0%) | 0 (0.0%) |
| Business & Financial | 0 (0.0%) | 0 (0.0%) |
| Computers, Engineering & Science | 0 (0.0%) | 3 (100.0%) |
| Computers & Mathematics | 0 (0.0%) | 0 (0.0%) |
| Architecture & Engineering | 0 (0.0%) | 0 (0.0%) |
| Life, Physical & Social Science | 0 (0.0%) | 3 (100.0%) |
| Community & Social Service | 0 (0.0%) | 7 (100.0%) |
| Education, Arts & Media | 0 (0.0%) | 0 (0.0%) |
| Legal Services & Support | 0 (0.0%) | 0 (0.0%) |
| Education Instruction & Library | 0 (0.0%) | 7 (100.0%) |
| Arts, Media & Entertainment | 0 (0.0%) | 0 (0.0%) |
| Health Diagnosing & Treating | 0 (0.0%) | 13 (100.0%) |
| Health Technologists | 0 (0.0%) | 0 (0.0%) |
| Total (Category) | 0 (0.0%) | 23 (100.0%) |
| Total (Overall) | 11 (12.9%) | 74 (87.1%) |
Services Occupations
The most common Services occupations in St Marie are Cleaning & Maintenance (11 | 12.9%), Food Preparation & Serving (8 | 9.4%), and Healthcare Support (3 | 3.5%).
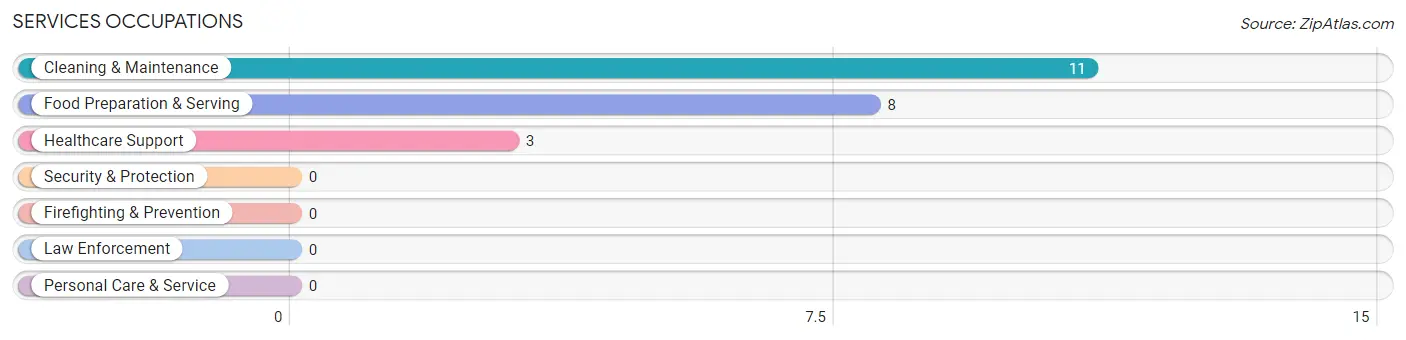
Services Occupations by Sex
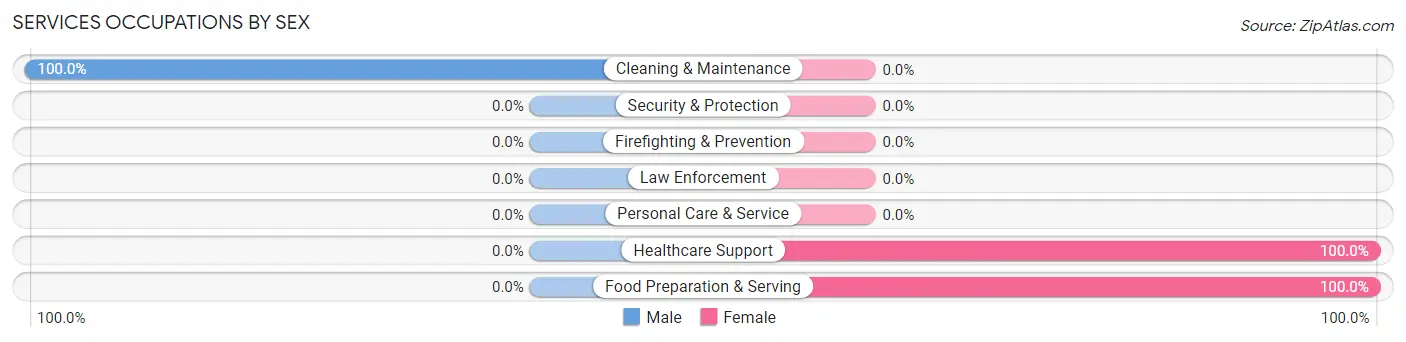
| Occupation | Male | Female |
| Healthcare Support | 0 (0.0%) | 3 (100.0%) |
| Security & Protection | 0 (0.0%) | 0 (0.0%) |
| Firefighting & Prevention | 0 (0.0%) | 0 (0.0%) |
| Law Enforcement | 0 (0.0%) | 0 (0.0%) |
| Food Preparation & Serving | 0 (0.0%) | 8 (100.0%) |
| Cleaning & Maintenance | 11 (100.0%) | 0 (0.0%) |
| Personal Care & Service | 0 (0.0%) | 0 (0.0%) |
| Total (Category) | 11 (50.0%) | 11 (50.0%) |
| Total (Overall) | 11 (12.9%) | 74 (87.1%) |
Sales and Office Occupations
The most common Sales and Office occupations in St Marie are Sales & Related (23 | 27.1%), and Office & Administration (17 | 20.0%).
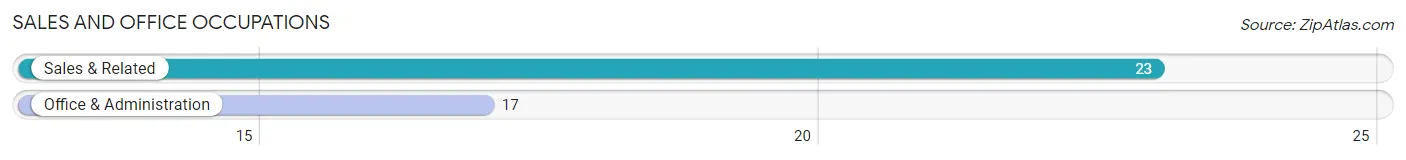
Sales and Office Occupations by Sex
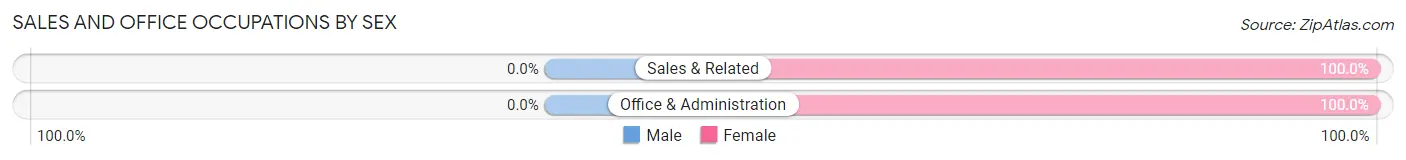
| Occupation | Male | Female |
| Sales & Related | 0 (0.0%) | 23 (100.0%) |
| Office & Administration | 0 (0.0%) | 17 (100.0%) |
| Total (Category) | 0 (0.0%) | 40 (100.0%) |
| Total (Overall) | 11 (12.9%) | 74 (87.1%) |
Natural Resources, Construction and Maintenance Occupations
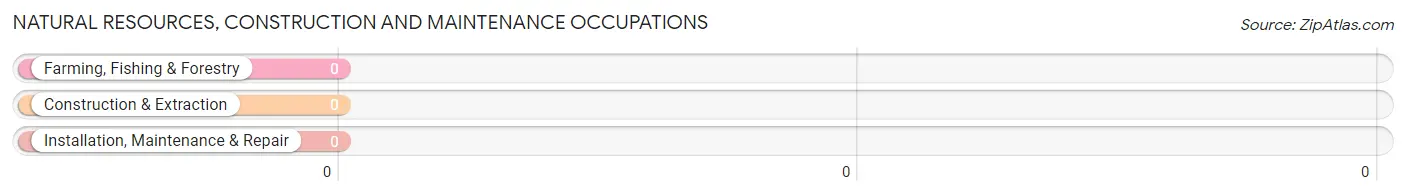
Natural Resources, Construction and Maintenance Occupations by Sex
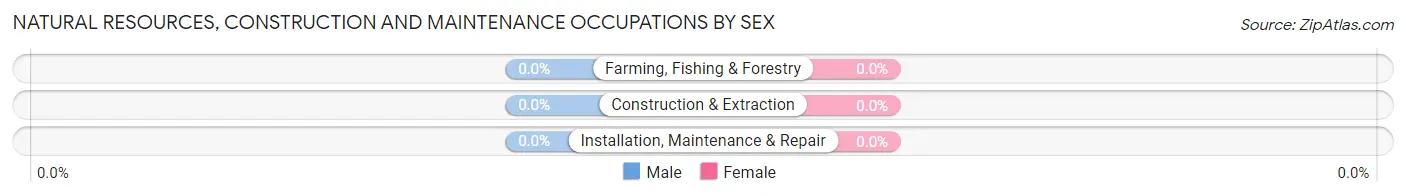
| Occupation | Male | Female |
| Farming, Fishing & Forestry | 0 (0.0%) | 0 (0.0%) |
| Construction & Extraction | 0 (0.0%) | 0 (0.0%) |
| Installation, Maintenance & Repair | 0 (0.0%) | 0 (0.0%) |
| Total (Category) | 0 (0.0%) | 0 (0.0%) |
| Total (Overall) | 11 (12.9%) | 74 (87.1%) |
Production, Transportation and Moving Occupations
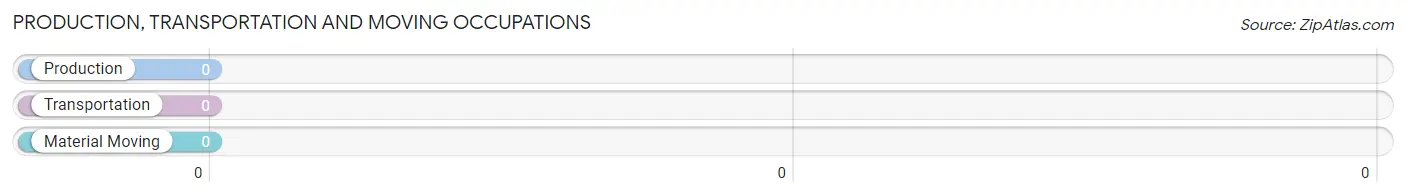
Production, Transportation and Moving Occupations by Sex
| Occupation | Male | Female |
| Production | 0 (0.0%) | 0 (0.0%) |
| Transportation | 0 (0.0%) | 0 (0.0%) |
| Material Moving | 0 (0.0%) | 0 (0.0%) |
| Total (Category) | 0 (0.0%) | 0 (0.0%) |
| Total (Overall) | 11 (12.9%) | 74 (87.1%) |
Employment Industries by Sex in St Marie
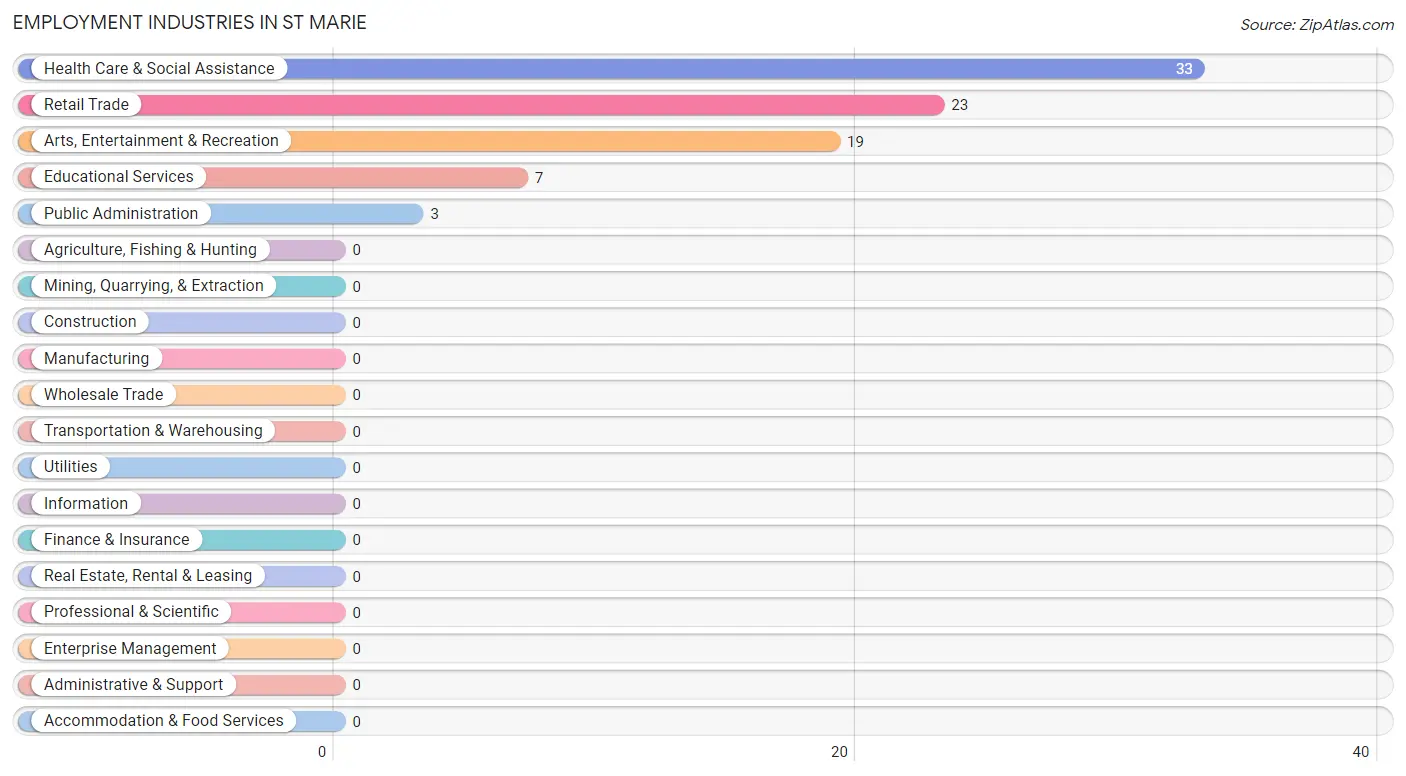
Employment Industries in St Marie
The major employment industries in St Marie include Health Care & Social Assistance (33 | 38.8%), Retail Trade (23 | 27.1%), Arts, Entertainment & Recreation (19 | 22.4%), Educational Services (7 | 8.2%), and Public Administration (3 | 3.5%).
Employment Industries by Sex in St Marie
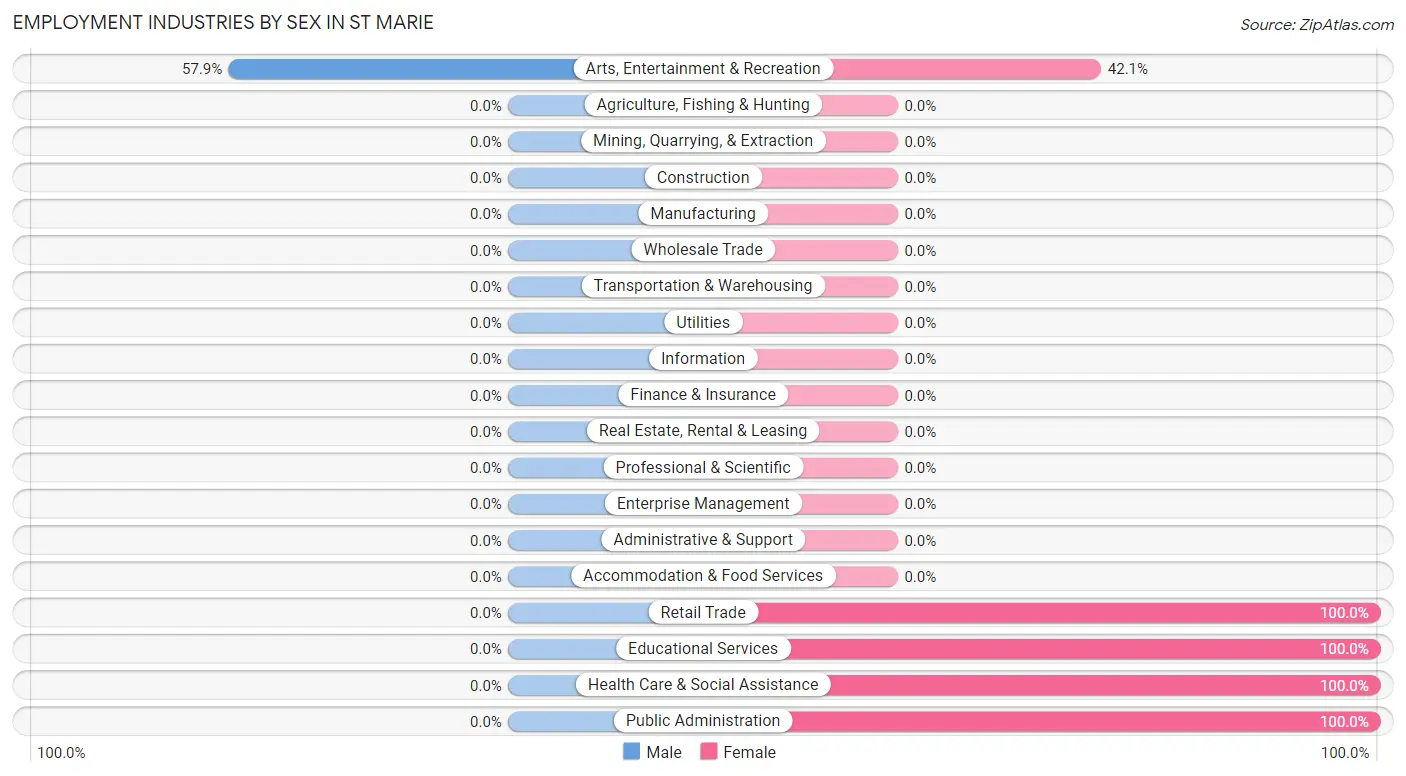
| Industry | Male | Female |
| Agriculture, Fishing & Hunting | 0 (0.0%) | 0 (0.0%) |
| Mining, Quarrying, & Extraction | 0 (0.0%) | 0 (0.0%) |
| Construction | 0 (0.0%) | 0 (0.0%) |
| Manufacturing | 0 (0.0%) | 0 (0.0%) |
| Wholesale Trade | 0 (0.0%) | 0 (0.0%) |
| Retail Trade | 0 (0.0%) | 23 (100.0%) |
| Transportation & Warehousing | 0 (0.0%) | 0 (0.0%) |
| Utilities | 0 (0.0%) | 0 (0.0%) |
| Information | 0 (0.0%) | 0 (0.0%) |
| Finance & Insurance | 0 (0.0%) | 0 (0.0%) |
| Real Estate, Rental & Leasing | 0 (0.0%) | 0 (0.0%) |
| Professional & Scientific | 0 (0.0%) | 0 (0.0%) |
| Enterprise Management | 0 (0.0%) | 0 (0.0%) |
| Administrative & Support | 0 (0.0%) | 0 (0.0%) |
| Educational Services | 0 (0.0%) | 7 (100.0%) |
| Health Care & Social Assistance | 0 (0.0%) | 33 (100.0%) |
| Arts, Entertainment & Recreation | 11 (57.9%) | 8 (42.1%) |
| Accommodation & Food Services | 0 (0.0%) | 0 (0.0%) |
| Public Administration | 0 (0.0%) | 3 (100.0%) |
| Total | 11 (12.9%) | 74 (87.1%) |
Education in St Marie
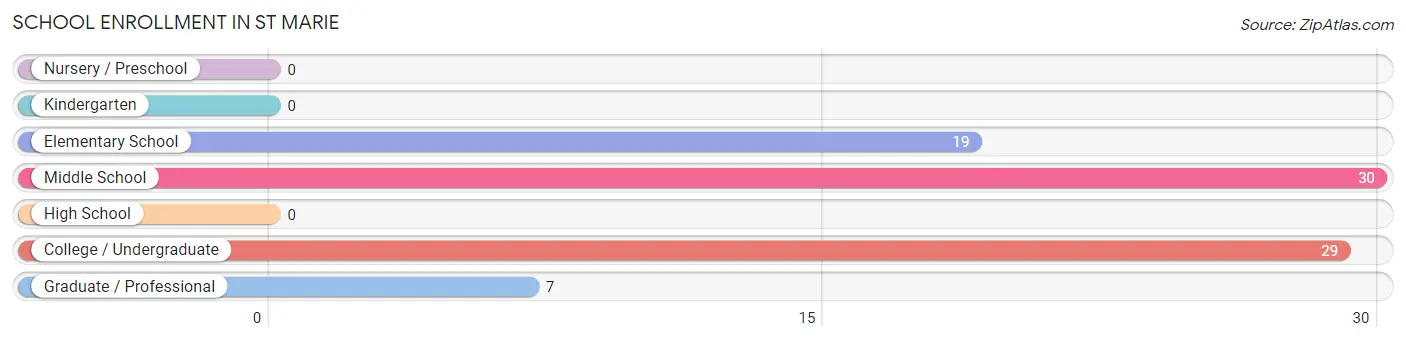
School Enrollment in St Marie
The most common levels of schooling among the 85 students in St Marie are middle school (30 | 35.3%), college / undergraduate (29 | 34.1%), and elementary school (19 | 22.4%).
| School Level | # Students | % Students |
| Nursery / Preschool | 0 | 0.0% |
| Kindergarten | 0 | 0.0% |
| Elementary School | 19 | 22.4% |
| Middle School | 30 | 35.3% |
| High School | 0 | 0.0% |
| College / Undergraduate | 29 | 34.1% |
| Graduate / Professional | 7 | 8.2% |
| Total | 85 | 100.0% |
School Enrollment by Age by Funding Source in St Marie
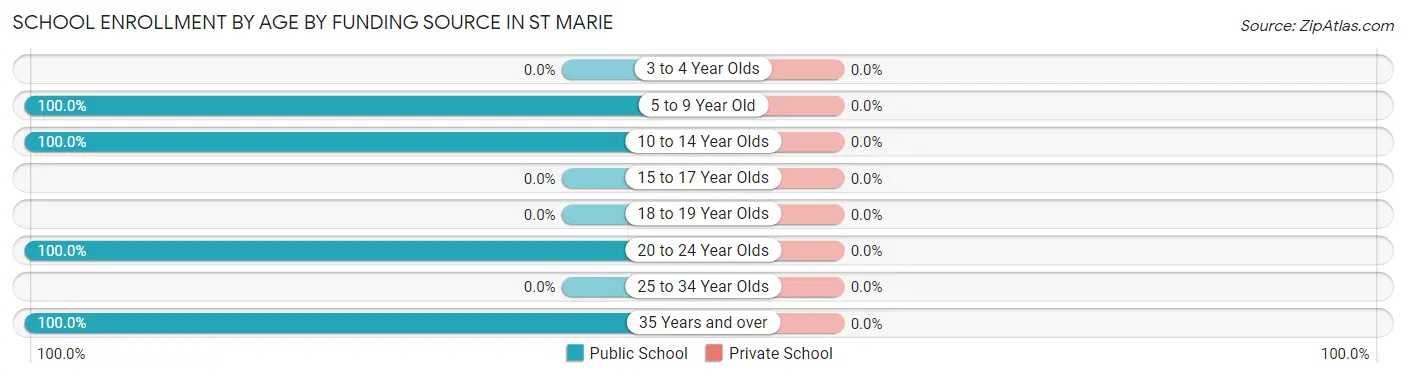
| Age Bracket | Public School | Private School |
| 3 to 4 Year Olds | 0 (0.0%) | 0 (0.0%) |
| 5 to 9 Year Old | 19 (100.0%) | 0 (0.0%) |
| 10 to 14 Year Olds | 30 (100.0%) | 0 (0.0%) |
| 15 to 17 Year Olds | 0 (0.0%) | 0 (0.0%) |
| 18 to 19 Year Olds | 0 (0.0%) | 0 (0.0%) |
| 20 to 24 Year Olds | 29 (100.0%) | 0 (0.0%) |
| 25 to 34 Year Olds | 0 (0.0%) | 0 (0.0%) |
| 35 Years and over | 7 (100.0%) | 0 (0.0%) |
| Total | 85 (100.0%) | 0 (0.0%) |
Educational Attainment by Field of Study in St Marie
Social sciences (36 | 49.3%), physical & health sciences (23 | 31.5%), science & technology (7 | 9.6%), and education (7 | 9.6%) are the most common fields of study among 73 individuals in St Marie who have obtained a bachelor's degree or higher.
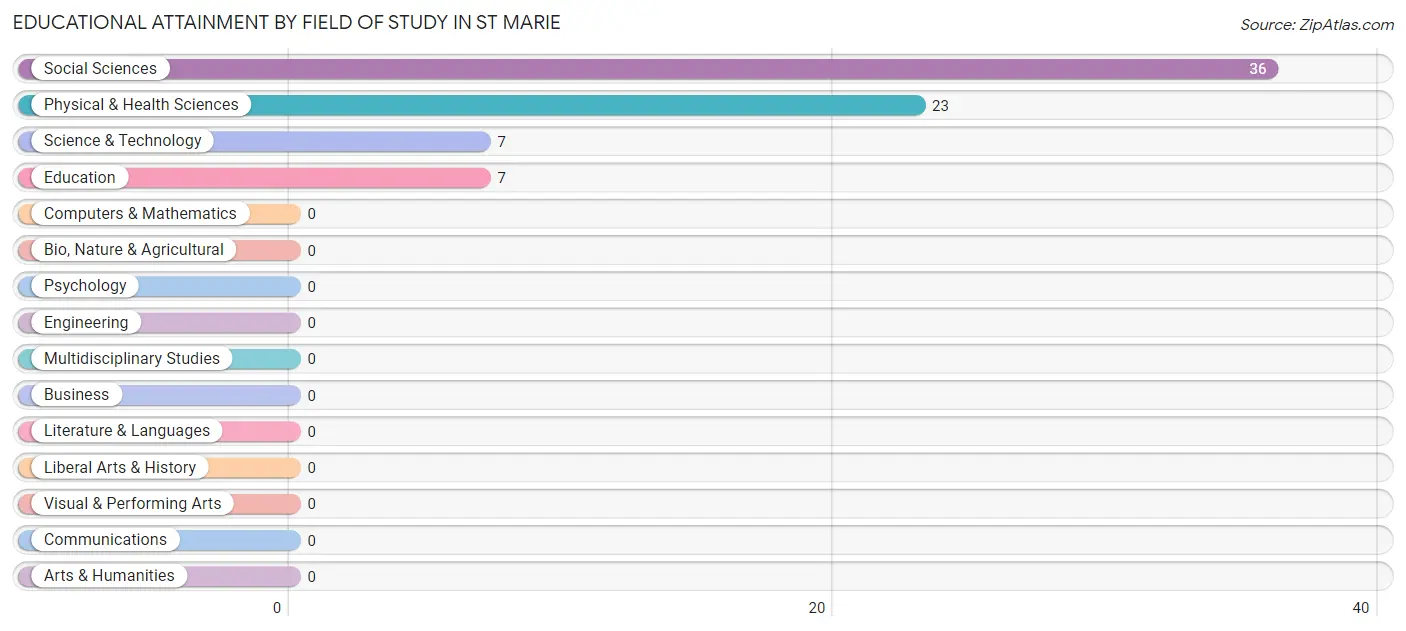
| Field of Study | # Graduates | % Graduates |
| Computers & Mathematics | 0 | 0.0% |
| Bio, Nature & Agricultural | 0 | 0.0% |
| Physical & Health Sciences | 23 | 31.5% |
| Psychology | 0 | 0.0% |
| Social Sciences | 36 | 49.3% |
| Engineering | 0 | 0.0% |
| Multidisciplinary Studies | 0 | 0.0% |
| Science & Technology | 7 | 9.6% |
| Business | 0 | 0.0% |
| Education | 7 | 9.6% |
| Literature & Languages | 0 | 0.0% |
| Liberal Arts & History | 0 | 0.0% |
| Visual & Performing Arts | 0 | 0.0% |
| Communications | 0 | 0.0% |
| Arts & Humanities | 0 | 0.0% |
| Total | 73 | 100.0% |
Transportation & Commute in St Marie
Vehicle Availability by Sex in St Marie
The most prevalent vehicle ownership categories in St Marie are males with 2 vehicles (11, accounting for 100.0%) and females with 2 vehicles (7, making up 18.0%).
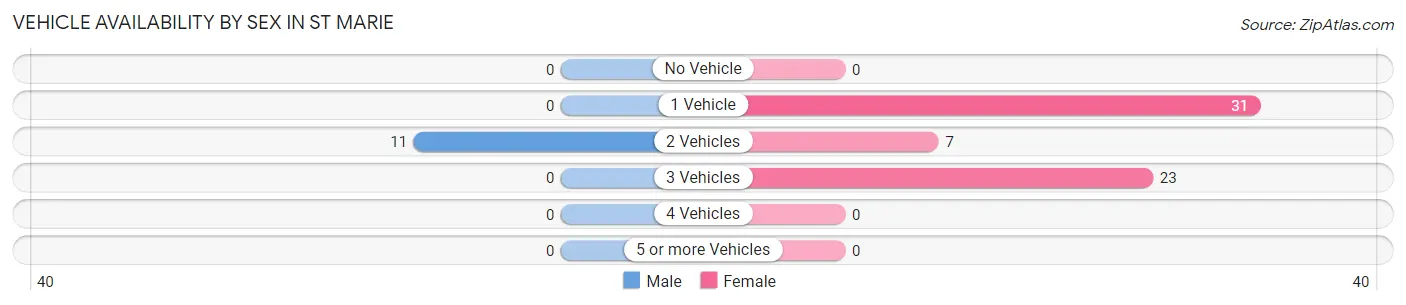
| Vehicles Available | Male | Female |
| No Vehicle | 0 (0.0%) | 0 (0.0%) |
| 1 Vehicle | 0 (0.0%) | 31 (50.8%) |
| 2 Vehicles | 11 (100.0%) | 7 (11.5%) |
| 3 Vehicles | 0 (0.0%) | 23 (37.7%) |
| 4 Vehicles | 0 (0.0%) | 0 (0.0%) |
| 5 or more Vehicles | 0 (0.0%) | 0 (0.0%) |
| Total | 11 (100.0%) | 61 (100.0%) |
Commute Time in St Marie
The most frequently occuring commute durations in St Marie are 5 to 9 minutes (33 commuters, 60.0%), 20 to 24 minutes (11 commuters, 20.0%), and 25 to 29 minutes (8 commuters, 14.5%).
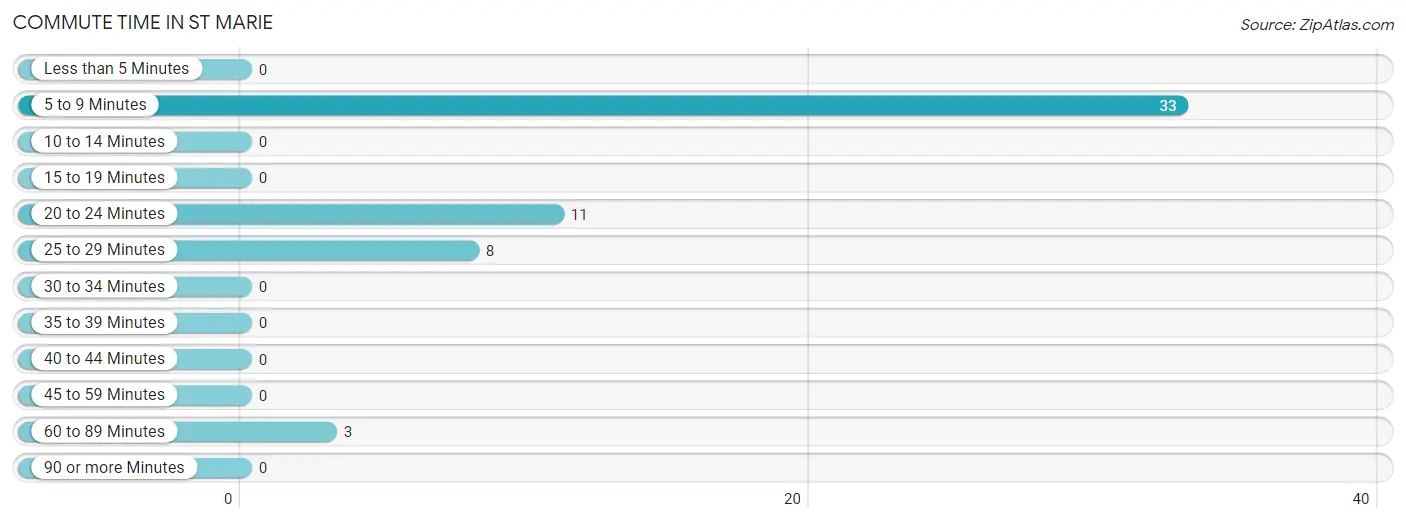
| Commute Time | # Commuters | % Commuters |
| Less than 5 Minutes | 0 | 0.0% |
| 5 to 9 Minutes | 33 | 60.0% |
| 10 to 14 Minutes | 0 | 0.0% |
| 15 to 19 Minutes | 0 | 0.0% |
| 20 to 24 Minutes | 11 | 20.0% |
| 25 to 29 Minutes | 8 | 14.5% |
| 30 to 34 Minutes | 0 | 0.0% |
| 35 to 39 Minutes | 0 | 0.0% |
| 40 to 44 Minutes | 0 | 0.0% |
| 45 to 59 Minutes | 0 | 0.0% |
| 60 to 89 Minutes | 3 | 5.4% |
| 90 or more Minutes | 0 | 0.0% |
Commute Time by Sex in St Marie
The most common commute times in St Marie are 20 to 24 minutes (11 commuters, 100.0%) for males and 5 to 9 minutes (33 commuters, 75.0%) for females.
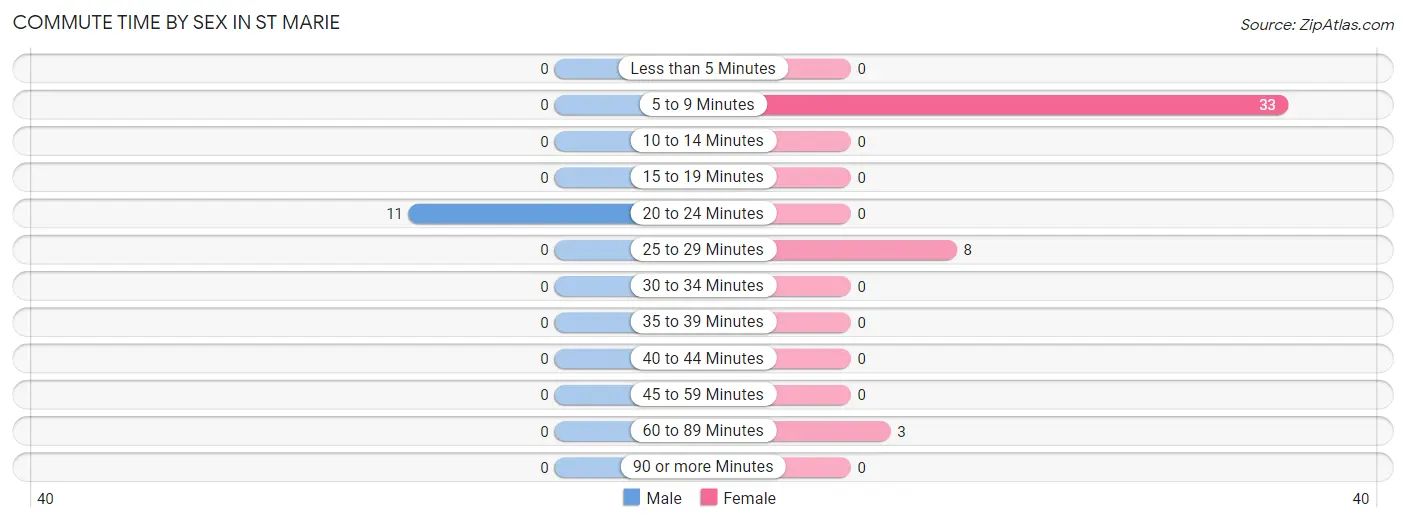
| Commute Time | Male | Female |
| Less than 5 Minutes | 0 (0.0%) | 0 (0.0%) |
| 5 to 9 Minutes | 0 (0.0%) | 33 (75.0%) |
| 10 to 14 Minutes | 0 (0.0%) | 0 (0.0%) |
| 15 to 19 Minutes | 0 (0.0%) | 0 (0.0%) |
| 20 to 24 Minutes | 11 (100.0%) | 0 (0.0%) |
| 25 to 29 Minutes | 0 (0.0%) | 8 (18.2%) |
| 30 to 34 Minutes | 0 (0.0%) | 0 (0.0%) |
| 35 to 39 Minutes | 0 (0.0%) | 0 (0.0%) |
| 40 to 44 Minutes | 0 (0.0%) | 0 (0.0%) |
| 45 to 59 Minutes | 0 (0.0%) | 0 (0.0%) |
| 60 to 89 Minutes | 0 (0.0%) | 3 (6.8%) |
| 90 or more Minutes | 0 (0.0%) | 0 (0.0%) |
Time of Departure to Work by Sex in St Marie
The most frequent times of departure to work in St Marie are 8:00 AM to 8:29 AM (11, 100.0%) for males and 9:00 AM to 9:59 AM (23, 52.3%) for females.
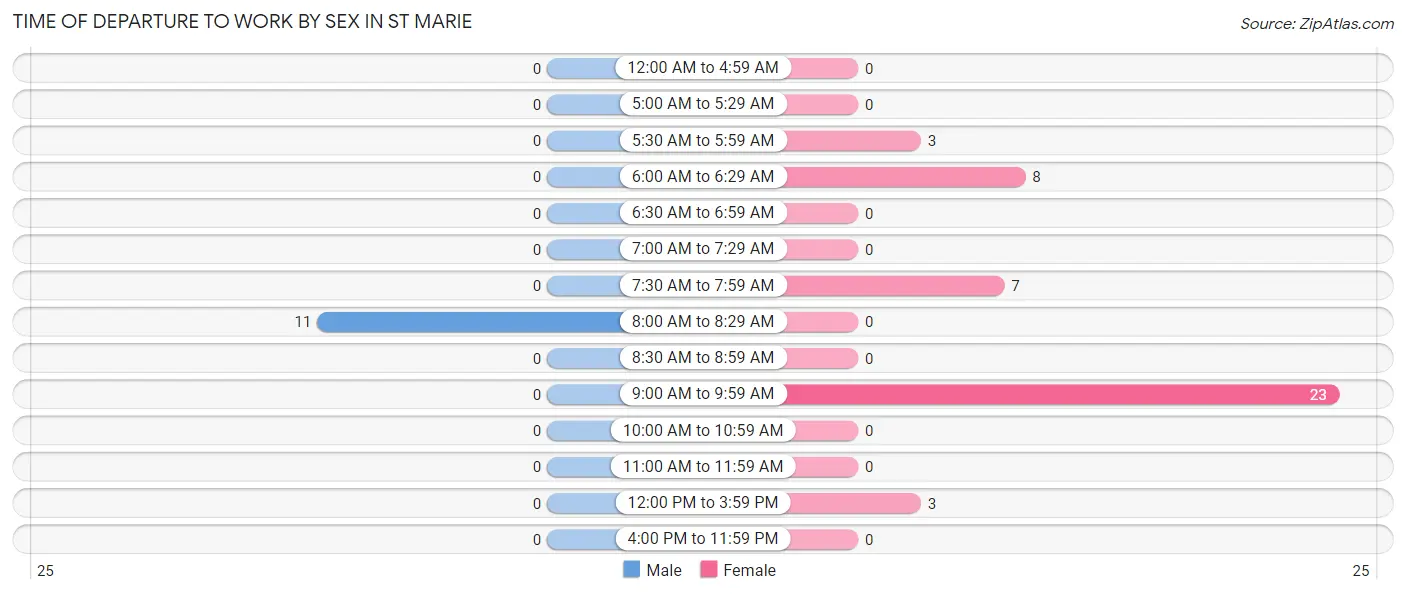
| Time of Departure | Male | Female |
| 12:00 AM to 4:59 AM | 0 (0.0%) | 0 (0.0%) |
| 5:00 AM to 5:29 AM | 0 (0.0%) | 0 (0.0%) |
| 5:30 AM to 5:59 AM | 0 (0.0%) | 3 (6.8%) |
| 6:00 AM to 6:29 AM | 0 (0.0%) | 8 (18.2%) |
| 6:30 AM to 6:59 AM | 0 (0.0%) | 0 (0.0%) |
| 7:00 AM to 7:29 AM | 0 (0.0%) | 0 (0.0%) |
| 7:30 AM to 7:59 AM | 0 (0.0%) | 7 (15.9%) |
| 8:00 AM to 8:29 AM | 11 (100.0%) | 0 (0.0%) |
| 8:30 AM to 8:59 AM | 0 (0.0%) | 0 (0.0%) |
| 9:00 AM to 9:59 AM | 0 (0.0%) | 23 (52.3%) |
| 10:00 AM to 10:59 AM | 0 (0.0%) | 0 (0.0%) |
| 11:00 AM to 11:59 AM | 0 (0.0%) | 0 (0.0%) |
| 12:00 PM to 3:59 PM | 0 (0.0%) | 3 (6.8%) |
| 4:00 PM to 11:59 PM | 0 (0.0%) | 0 (0.0%) |
| Total | 11 (100.0%) | 44 (100.0%) |
Housing Occupancy in St Marie
Occupancy by Ownership in St Marie
Of the total 157 dwellings in St Marie, owner-occupied units account for 131 (83.4%), while renter-occupied units make up 26 (16.6%).
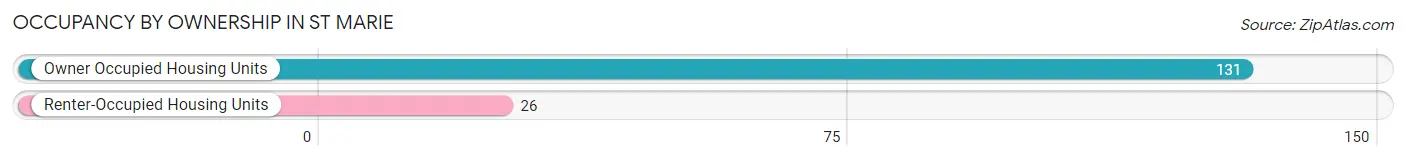
| Occupancy | # Housing Units | % Housing Units |
| Owner Occupied Housing Units | 131 | 83.4% |
| Renter-Occupied Housing Units | 26 | 16.6% |
| Total Occupied Housing Units | 157 | 100.0% |
Occupancy by Household Size in St Marie
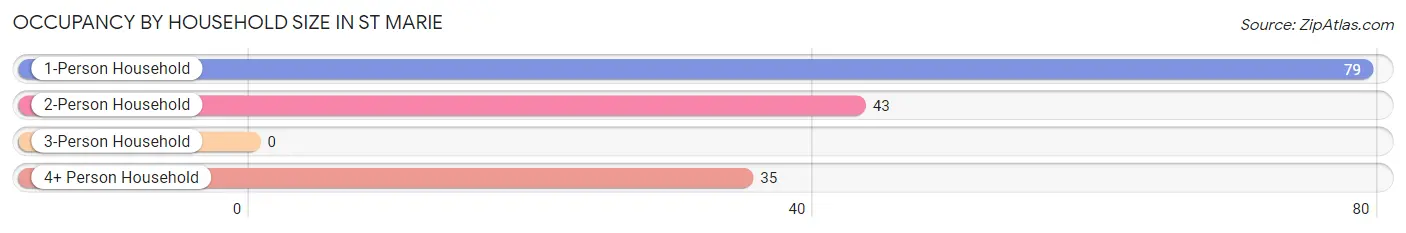
| Household Size | # Housing Units | % Housing Units |
| 1-Person Household | 79 | 50.3% |
| 2-Person Household | 43 | 27.4% |
| 3-Person Household | 0 | 0.0% |
| 4+ Person Household | 35 | 22.3% |
| Total Housing Units | 157 | 100.0% |
Occupancy by Ownership by Household Size in St Marie
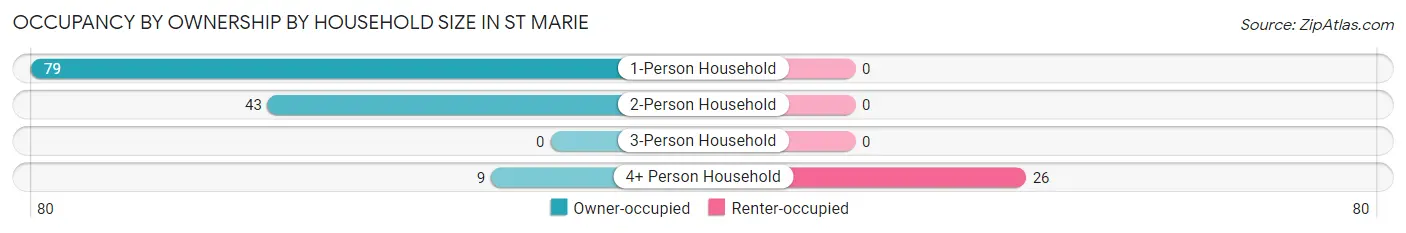
| Household Size | Owner-occupied | Renter-occupied |
| 1-Person Household | 79 (100.0%) | 0 (0.0%) |
| 2-Person Household | 43 (100.0%) | 0 (0.0%) |
| 3-Person Household | 0 (0.0%) | 0 (0.0%) |
| 4+ Person Household | 9 (25.7%) | 26 (74.3%) |
| Total Housing Units | 131 (83.4%) | 26 (16.6%) |
Occupancy by Educational Attainment in St Marie
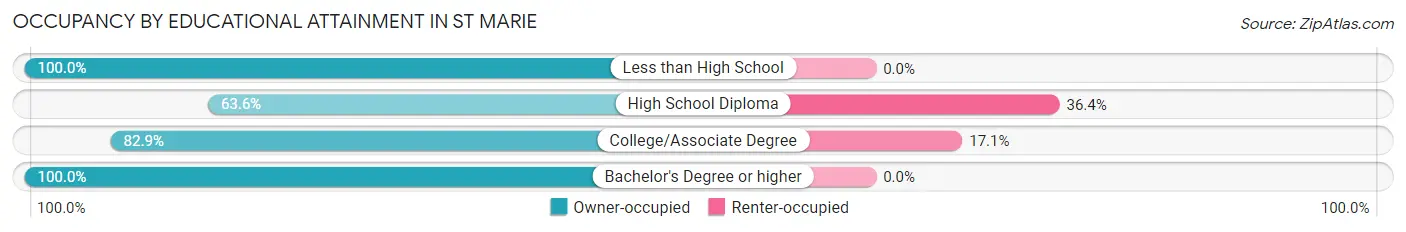
| Household Size | Owner-occupied | Renter-occupied |
| Less than High School | 32 (100.0%) | 0 (0.0%) |
| High School Diploma | 21 (63.6%) | 12 (36.4%) |
| College/Associate Degree | 68 (82.9%) | 14 (17.1%) |
| Bachelor's Degree or higher | 10 (100.0%) | 0 (0.0%) |
Occupancy by Age of Householder in St Marie
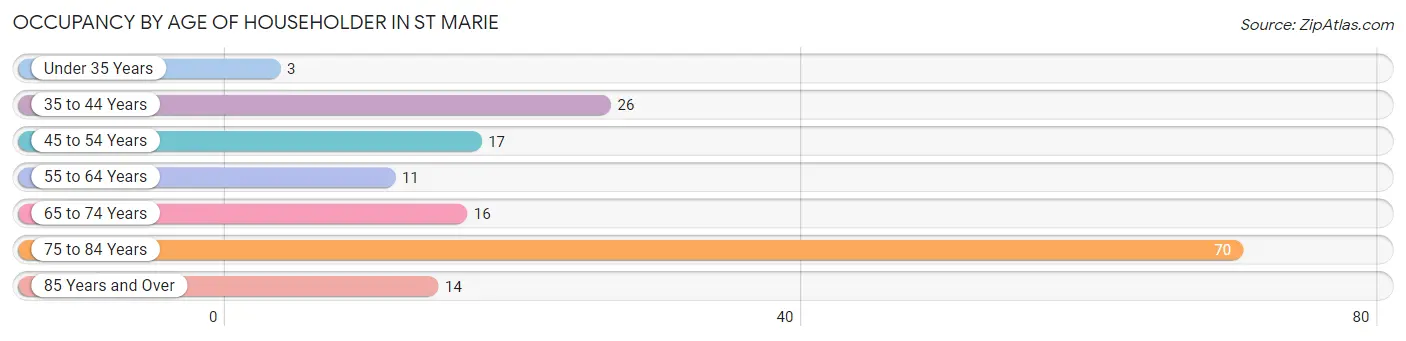
| Age Bracket | # Households | % Households |
| Under 35 Years | 3 | 1.9% |
| 35 to 44 Years | 26 | 16.6% |
| 45 to 54 Years | 17 | 10.8% |
| 55 to 64 Years | 11 | 7.0% |
| 65 to 74 Years | 16 | 10.2% |
| 75 to 84 Years | 70 | 44.6% |
| 85 Years and Over | 14 | 8.9% |
| Total | 157 | 100.0% |
Housing Finances in St Marie
Median Income by Occupancy in St Marie
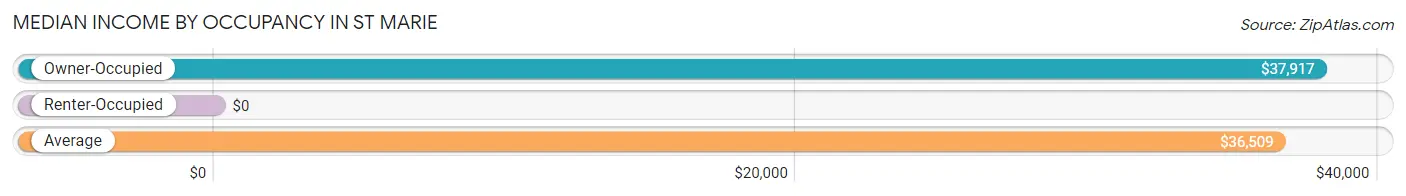
| Occupancy Type | # Households | Median Income |
| Owner-Occupied | 131 (83.4%) | $37,917 |
| Renter-Occupied | 26 (16.6%) | $0 |
| Average | 157 (100.0%) | $36,509 |
Occupancy by Householder Income Bracket in St Marie
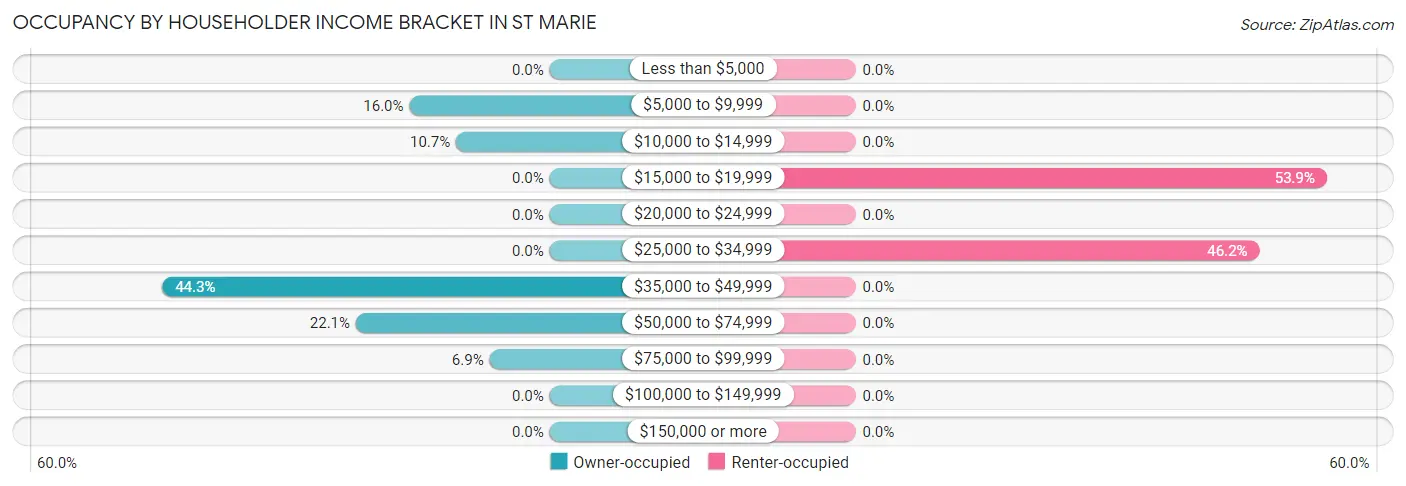
| Income Bracket | Owner-occupied | Renter-occupied |
| Less than $5,000 | 0 (0.0%) | 0 (0.0%) |
| $5,000 to $9,999 | 21 (16.0%) | 0 (0.0%) |
| $10,000 to $14,999 | 14 (10.7%) | 0 (0.0%) |
| $15,000 to $19,999 | 0 (0.0%) | 14 (53.8%) |
| $20,000 to $24,999 | 0 (0.0%) | 0 (0.0%) |
| $25,000 to $34,999 | 0 (0.0%) | 12 (46.2%) |
| $35,000 to $49,999 | 58 (44.3%) | 0 (0.0%) |
| $50,000 to $74,999 | 29 (22.1%) | 0 (0.0%) |
| $75,000 to $99,999 | 9 (6.9%) | 0 (0.0%) |
| $100,000 to $149,999 | 0 (0.0%) | 0 (0.0%) |
| $150,000 or more | 0 (0.0%) | 0 (0.0%) |
| Total | 131 (100.0%) | 26 (100.0%) |
Monthly Housing Cost Tiers in St Marie
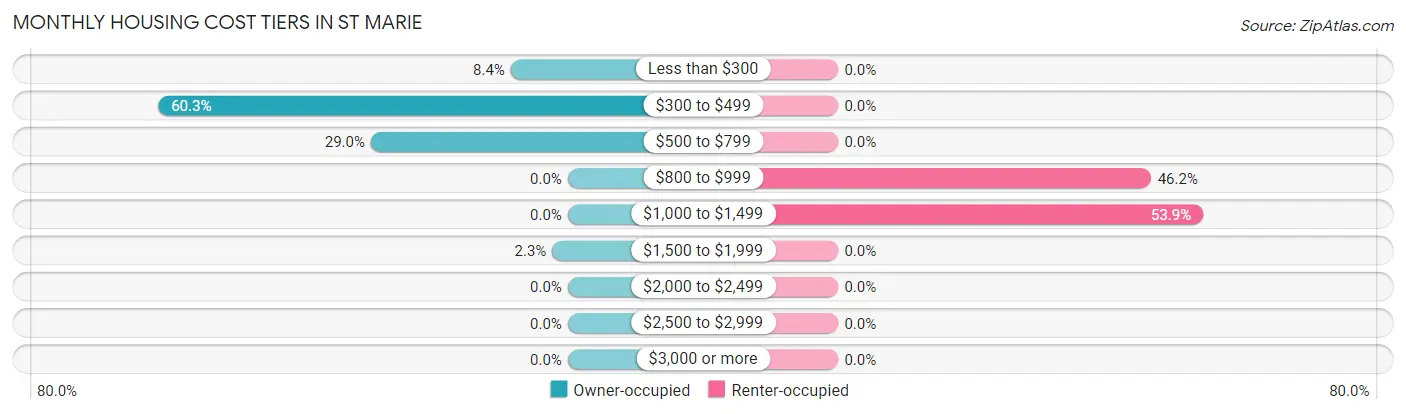
| Monthly Cost | Owner-occupied | Renter-occupied |
| Less than $300 | 11 (8.4%) | 0 (0.0%) |
| $300 to $499 | 79 (60.3%) | 0 (0.0%) |
| $500 to $799 | 38 (29.0%) | 0 (0.0%) |
| $800 to $999 | 0 (0.0%) | 12 (46.2%) |
| $1,000 to $1,499 | 0 (0.0%) | 14 (53.8%) |
| $1,500 to $1,999 | 3 (2.3%) | 0 (0.0%) |
| $2,000 to $2,499 | 0 (0.0%) | 0 (0.0%) |
| $2,500 to $2,999 | 0 (0.0%) | 0 (0.0%) |
| $3,000 or more | 0 (0.0%) | 0 (0.0%) |
| Total | 131 (100.0%) | 26 (100.0%) |
Physical Housing Characteristics in St Marie
Housing Structures in St Marie
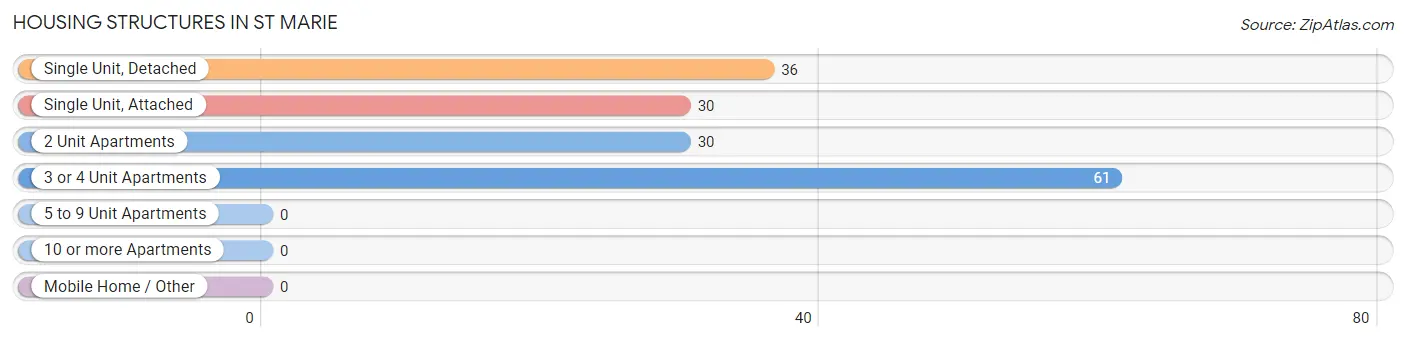
| Structure Type | # Housing Units | % Housing Units |
| Single Unit, Detached | 36 | 22.9% |
| Single Unit, Attached | 30 | 19.1% |
| 2 Unit Apartments | 30 | 19.1% |
| 3 or 4 Unit Apartments | 61 | 38.9% |
| 5 to 9 Unit Apartments | 0 | 0.0% |
| 10 or more Apartments | 0 | 0.0% |
| Mobile Home / Other | 0 | 0.0% |
| Total | 157 | 100.0% |
Housing Structures by Occupancy in St Marie
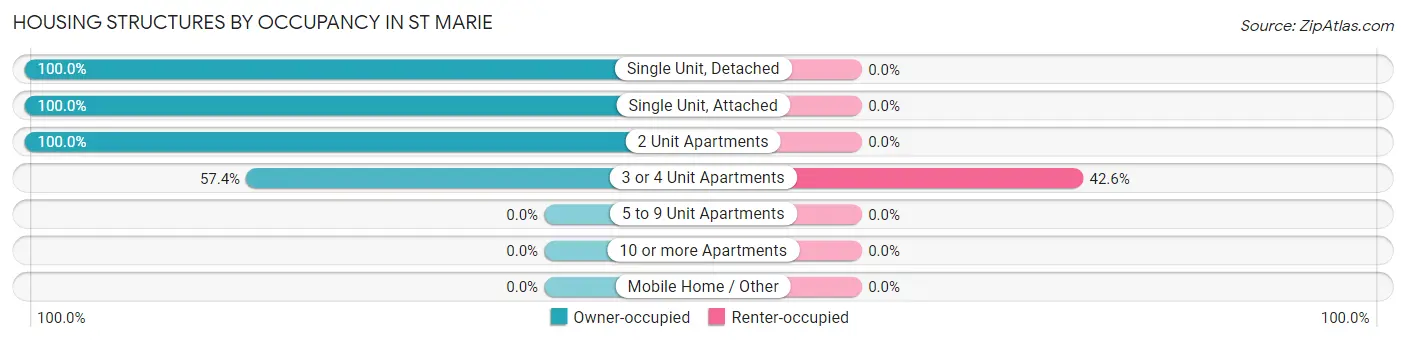
| Structure Type | Owner-occupied | Renter-occupied |
| Single Unit, Detached | 36 (100.0%) | 0 (0.0%) |
| Single Unit, Attached | 30 (100.0%) | 0 (0.0%) |
| 2 Unit Apartments | 30 (100.0%) | 0 (0.0%) |
| 3 or 4 Unit Apartments | 35 (57.4%) | 26 (42.6%) |
| 5 to 9 Unit Apartments | 0 (0.0%) | 0 (0.0%) |
| 10 or more Apartments | 0 (0.0%) | 0 (0.0%) |
| Mobile Home / Other | 0 (0.0%) | 0 (0.0%) |
| Total | 131 (83.4%) | 26 (16.6%) |
Housing Structures by Number of Rooms in St Marie
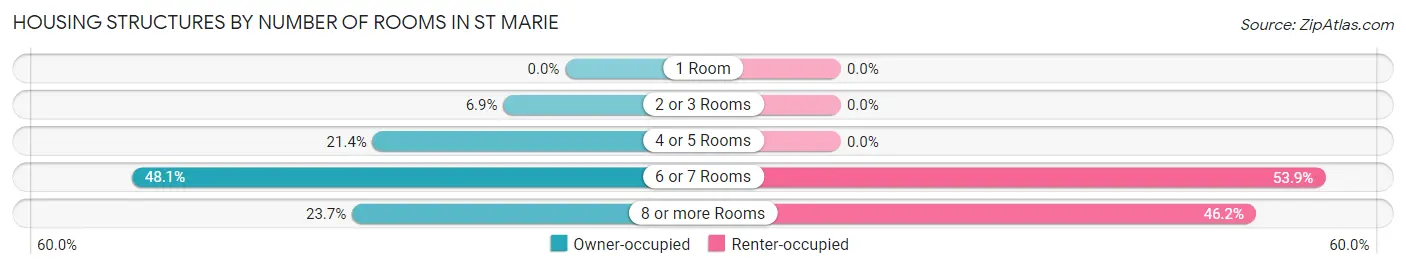
| Number of Rooms | Owner-occupied | Renter-occupied |
| 1 Room | 0 (0.0%) | 0 (0.0%) |
| 2 or 3 Rooms | 9 (6.9%) | 0 (0.0%) |
| 4 or 5 Rooms | 28 (21.4%) | 0 (0.0%) |
| 6 or 7 Rooms | 63 (48.1%) | 14 (53.8%) |
| 8 or more Rooms | 31 (23.7%) | 12 (46.2%) |
| Total | 131 (100.0%) | 26 (100.0%) |
Housing Structure by Heating Type in St Marie
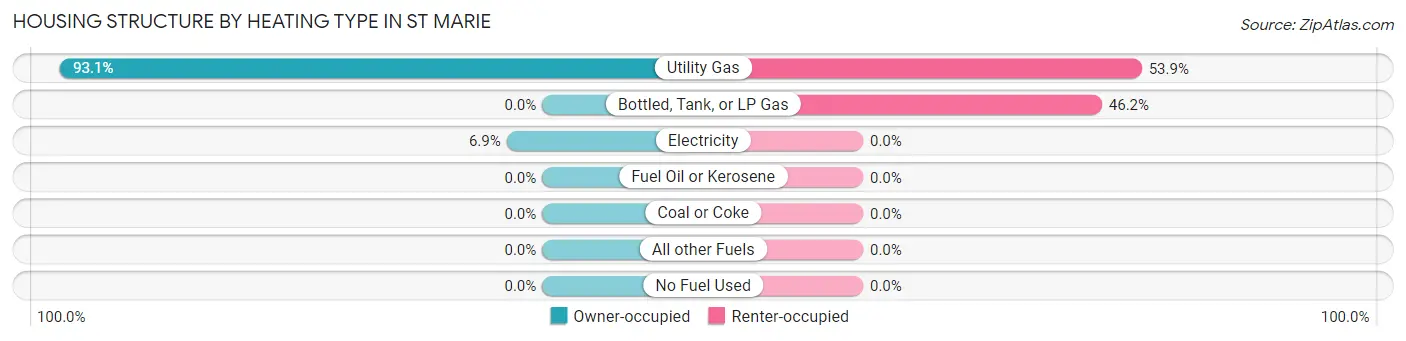
| Heating Type | Owner-occupied | Renter-occupied |
| Utility Gas | 122 (93.1%) | 14 (53.8%) |
| Bottled, Tank, or LP Gas | 0 (0.0%) | 12 (46.2%) |
| Electricity | 9 (6.9%) | 0 (0.0%) |
| Fuel Oil or Kerosene | 0 (0.0%) | 0 (0.0%) |
| Coal or Coke | 0 (0.0%) | 0 (0.0%) |
| All other Fuels | 0 (0.0%) | 0 (0.0%) |
| No Fuel Used | 0 (0.0%) | 0 (0.0%) |
| Total | 131 (100.0%) | 26 (100.0%) |
Household Vehicle Usage in St Marie
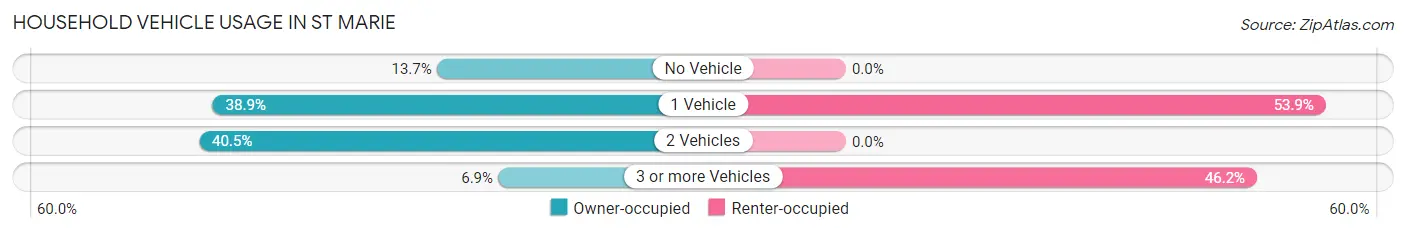
| Vehicles per Household | Owner-occupied | Renter-occupied |
| No Vehicle | 18 (13.7%) | 0 (0.0%) |
| 1 Vehicle | 51 (38.9%) | 14 (53.8%) |
| 2 Vehicles | 53 (40.5%) | 0 (0.0%) |
| 3 or more Vehicles | 9 (6.9%) | 12 (46.2%) |
| Total | 131 (100.0%) | 26 (100.0%) |
Real Estate & Mortgages in St Marie
Real Estate and Mortgage Overview in St Marie
| Characteristic | Without Mortgage | With Mortgage |
| Housing Units | 128 | 3 |
| Median Property Value | $20,600 | $0 |
| Median Household Income | $37,500 | $0 |
| Monthly Housing Costs | $463 | $0 |
| Real Estate Taxes | $468 | $0 |
Property Value by Mortgage Status in St Marie
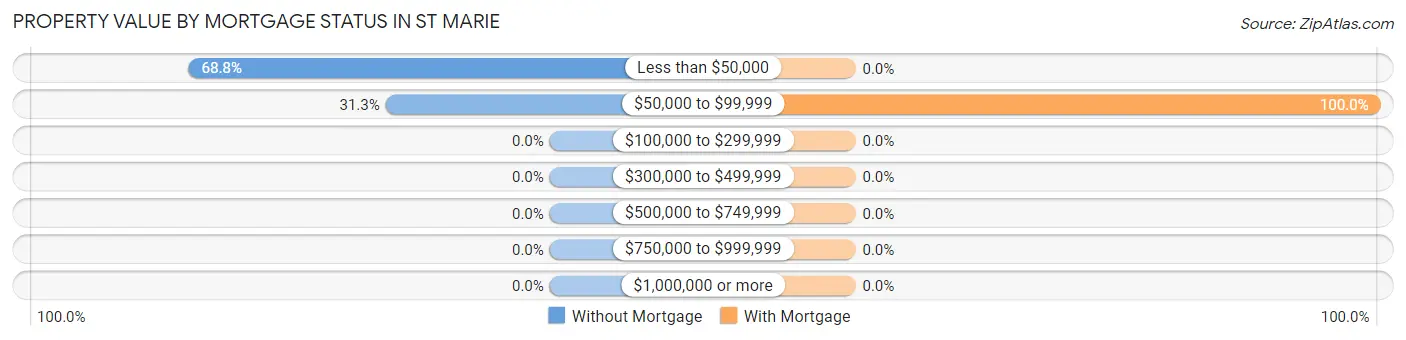
| Property Value | Without Mortgage | With Mortgage |
| Less than $50,000 | 88 (68.8%) | 0 (0.0%) |
| $50,000 to $99,999 | 40 (31.2%) | 3 (100.0%) |
| $100,000 to $299,999 | 0 (0.0%) | 0 (0.0%) |
| $300,000 to $499,999 | 0 (0.0%) | 0 (0.0%) |
| $500,000 to $749,999 | 0 (0.0%) | 0 (0.0%) |
| $750,000 to $999,999 | 0 (0.0%) | 0 (0.0%) |
| $1,000,000 or more | 0 (0.0%) | 0 (0.0%) |
| Total | 128 (100.0%) | 3 (100.0%) |
Household Income by Mortgage Status in St Marie
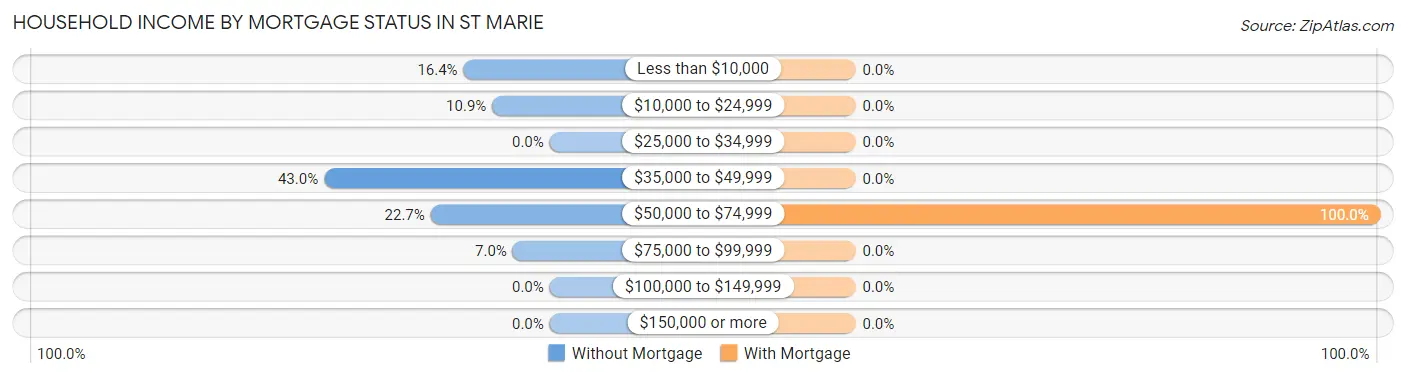
| Household Income | Without Mortgage | With Mortgage |
| Less than $10,000 | 21 (16.4%) | 0 (0.0%) |
| $10,000 to $24,999 | 14 (10.9%) | 0 (0.0%) |
| $25,000 to $34,999 | 0 (0.0%) | 0 (0.0%) |
| $35,000 to $49,999 | 55 (43.0%) | 0 (0.0%) |
| $50,000 to $74,999 | 29 (22.7%) | 3 (100.0%) |
| $75,000 to $99,999 | 9 (7.0%) | 0 (0.0%) |
| $100,000 to $149,999 | 0 (0.0%) | 0 (0.0%) |
| $150,000 or more | 0 (0.0%) | 0 (0.0%) |
| Total | 128 (100.0%) | 3 (100.0%) |
Property Value to Household Income Ratio in St Marie
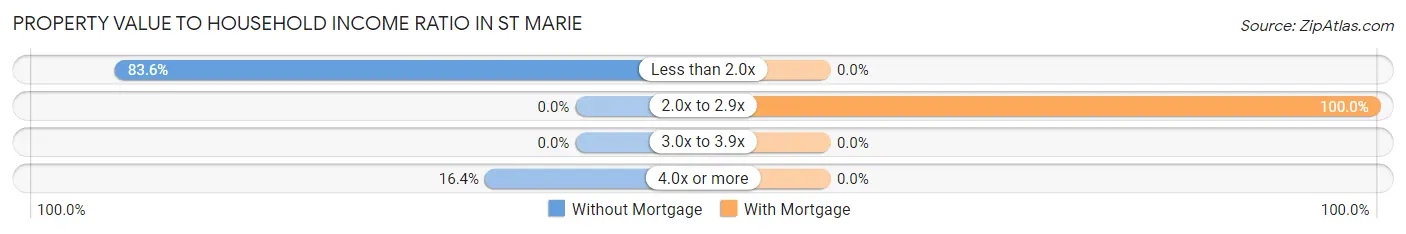
| Value-to-Income Ratio | Without Mortgage | With Mortgage |
| Less than 2.0x | 107 (83.6%) | 0 (0.0%) |
| 2.0x to 2.9x | 0 (0.0%) | 3 (100.0%) |
| 3.0x to 3.9x | 0 (0.0%) | 0 (0.0%) |
| 4.0x or more | 21 (16.4%) | 0 (0.0%) |
| Total | 128 (100.0%) | 3 (100.0%) |
Real Estate Taxes by Mortgage Status in St Marie
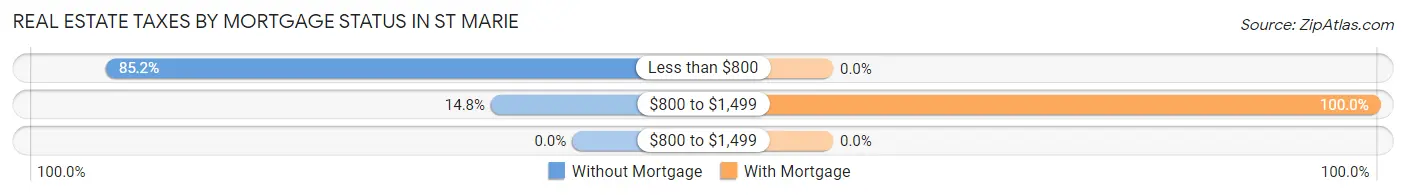
| Property Taxes | Without Mortgage | With Mortgage |
| Less than $800 | 109 (85.2%) | 0 (0.0%) |
| $800 to $1,499 | 19 (14.8%) | 3 (100.0%) |
| $800 to $1,499 | 0 (0.0%) | 0 (0.0%) |
| Total | 128 (100.0%) | 3 (100.0%) |
Health & Disability in St Marie
Health Insurance Coverage by Age in St Marie
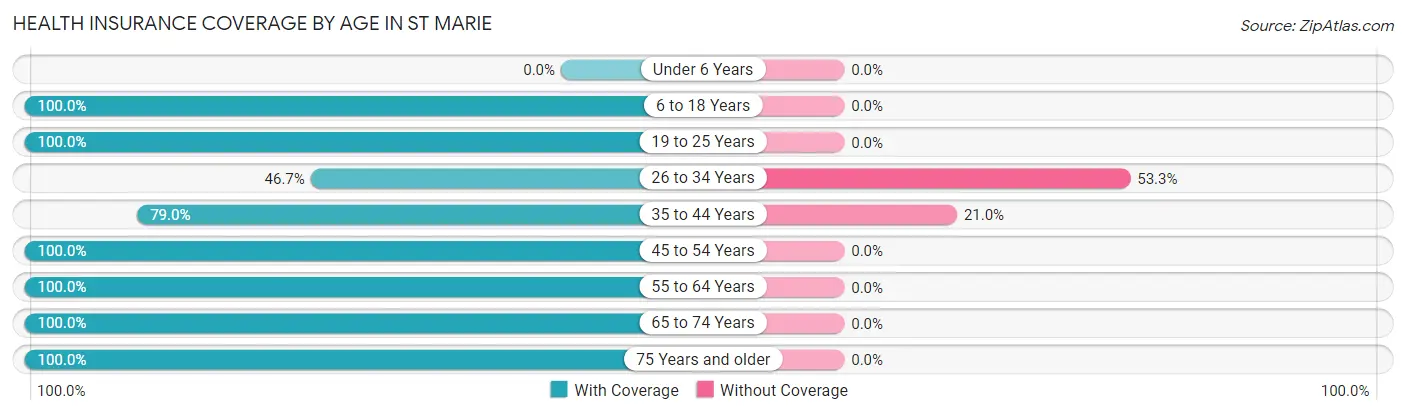
| Age Bracket | With Coverage | Without Coverage |
| Under 6 Years | 0 (0.0%) | 0 (0.0%) |
| 6 to 18 Years | 49 (100.0%) | 0 (0.0%) |
| 19 to 25 Years | 42 (100.0%) | 0 (0.0%) |
| 26 to 34 Years | 21 (46.7%) | 24 (53.3%) |
| 35 to 44 Years | 109 (79.0%) | 29 (21.0%) |
| 45 to 54 Years | 17 (100.0%) | 0 (0.0%) |
| 55 to 64 Years | 11 (100.0%) | 0 (0.0%) |
| 65 to 74 Years | 22 (100.0%) | 0 (0.0%) |
| 75 Years and older | 104 (100.0%) | 0 (0.0%) |
| Total | 375 (87.6%) | 53 (12.4%) |
Health Insurance Coverage by Citizenship Status in St Marie
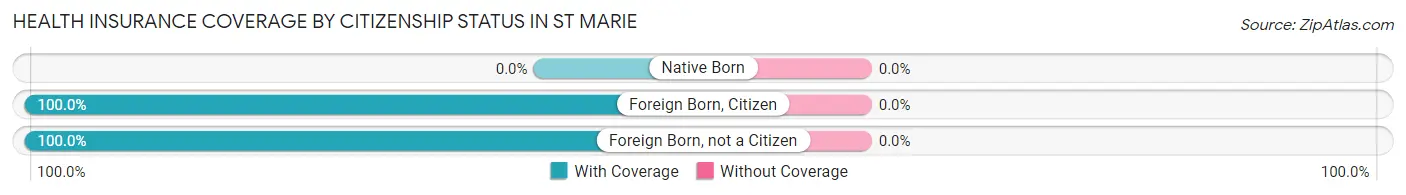
| Citizenship Status | With Coverage | Without Coverage |
| Native Born | 0 (0.0%) | 0 (0.0%) |
| Foreign Born, Citizen | 49 (100.0%) | 0 (0.0%) |
| Foreign Born, not a Citizen | 42 (100.0%) | 0 (0.0%) |
Health Insurance Coverage by Household Income in St Marie
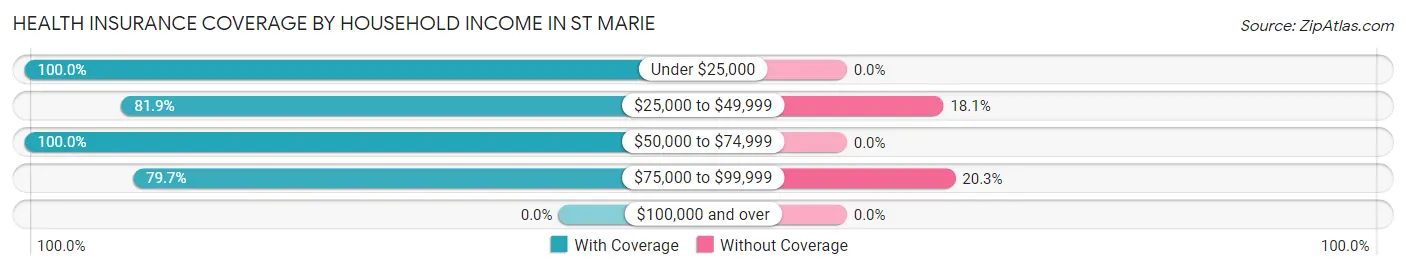
| Household Income | With Coverage | Without Coverage |
| Under $25,000 | 95 (100.0%) | 0 (0.0%) |
| $25,000 to $49,999 | 131 (81.9%) | 29 (18.1%) |
| $50,000 to $74,999 | 55 (100.0%) | 0 (0.0%) |
| $75,000 to $99,999 | 94 (79.7%) | 24 (20.3%) |
| $100,000 and over | 0 (0.0%) | 0 (0.0%) |
Public vs Private Health Insurance Coverage by Age in St Marie
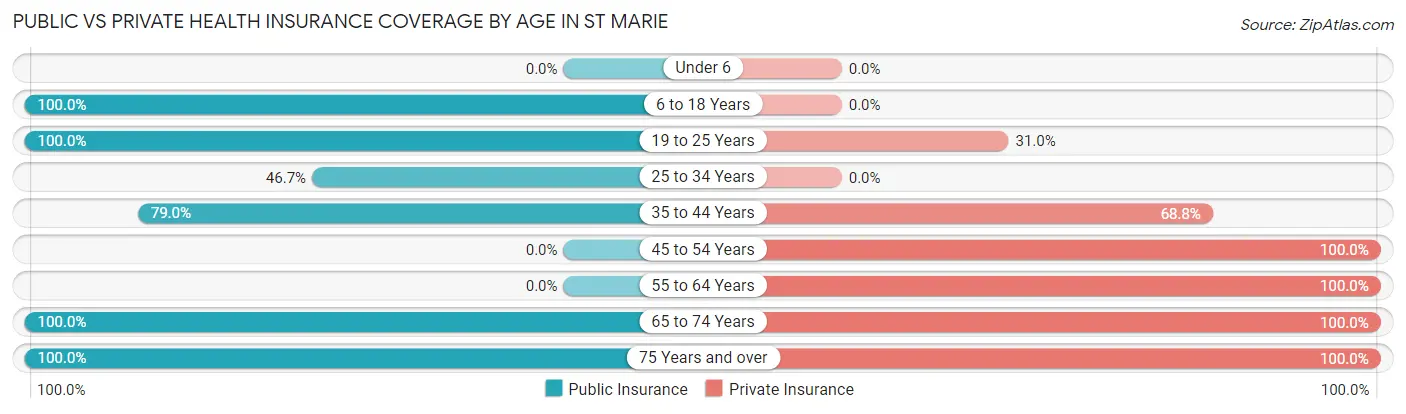
| Age Bracket | Public Insurance | Private Insurance |
| Under 6 | 0 (0.0%) | 0 (0.0%) |
| 6 to 18 Years | 49 (100.0%) | 0 (0.0%) |
| 19 to 25 Years | 42 (100.0%) | 13 (30.9%) |
| 25 to 34 Years | 21 (46.7%) | 0 (0.0%) |
| 35 to 44 Years | 109 (79.0%) | 95 (68.8%) |
| 45 to 54 Years | 0 (0.0%) | 17 (100.0%) |
| 55 to 64 Years | 0 (0.0%) | 11 (100.0%) |
| 65 to 74 Years | 22 (100.0%) | 22 (100.0%) |
| 75 Years and over | 104 (100.0%) | 104 (100.0%) |
| Total | 347 (81.1%) | 262 (61.2%) |
Disability Status by Sex by Age in St Marie
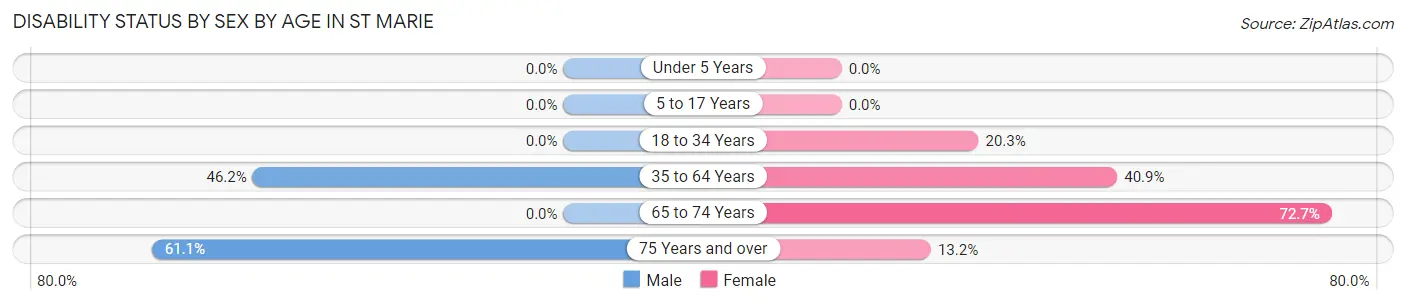
| Age Bracket | Male | Female |
| Under 5 Years | 0 (0.0%) | 0 (0.0%) |
| 5 to 17 Years | 0 (0.0%) | 0 (0.0%) |
| 18 to 34 Years | 0 (0.0%) | 13 (20.3%) |
| 35 to 64 Years | 36 (46.2%) | 36 (40.9%) |
| 65 to 74 Years | 0 (0.0%) | 16 (72.7%) |
| 75 Years and over | 22 (61.1%) | 9 (13.2%) |
Disability Class by Sex by Age in St Marie
Disability Class: Hearing Difficulty
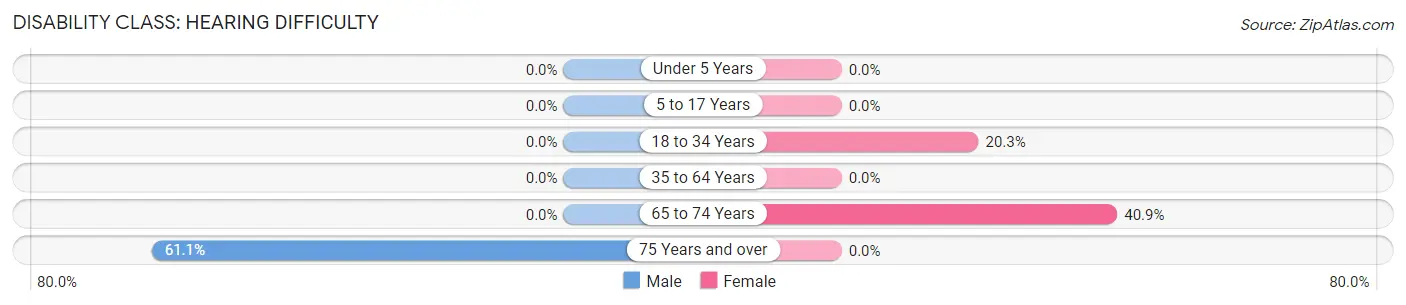
| Age Bracket | Male | Female |
| Under 5 Years | 0 (0.0%) | 0 (0.0%) |
| 5 to 17 Years | 0 (0.0%) | 0 (0.0%) |
| 18 to 34 Years | 0 (0.0%) | 13 (20.3%) |
| 35 to 64 Years | 0 (0.0%) | 0 (0.0%) |
| 65 to 74 Years | 0 (0.0%) | 9 (40.9%) |
| 75 Years and over | 22 (61.1%) | 0 (0.0%) |
Disability Class: Vision Difficulty
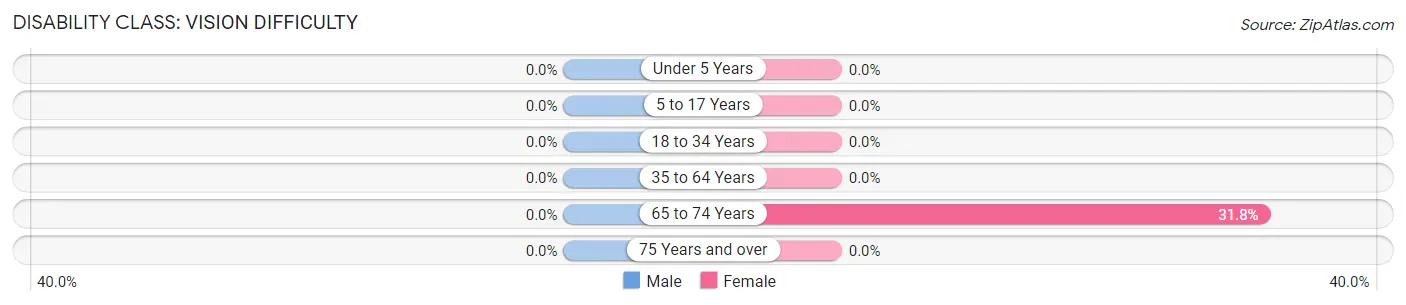
| Age Bracket | Male | Female |
| Under 5 Years | 0 (0.0%) | 0 (0.0%) |
| 5 to 17 Years | 0 (0.0%) | 0 (0.0%) |
| 18 to 34 Years | 0 (0.0%) | 0 (0.0%) |
| 35 to 64 Years | 0 (0.0%) | 0 (0.0%) |
| 65 to 74 Years | 0 (0.0%) | 7 (31.8%) |
| 75 Years and over | 0 (0.0%) | 0 (0.0%) |
Disability Class: Cognitive Difficulty
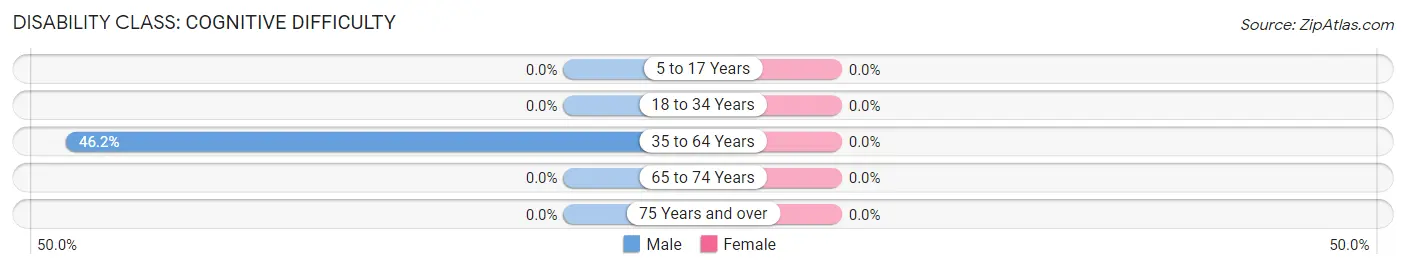
| Age Bracket | Male | Female |
| 5 to 17 Years | 0 (0.0%) | 0 (0.0%) |
| 18 to 34 Years | 0 (0.0%) | 0 (0.0%) |
| 35 to 64 Years | 36 (46.2%) | 0 (0.0%) |
| 65 to 74 Years | 0 (0.0%) | 0 (0.0%) |
| 75 Years and over | 0 (0.0%) | 0 (0.0%) |
Disability Class: Ambulatory Difficulty
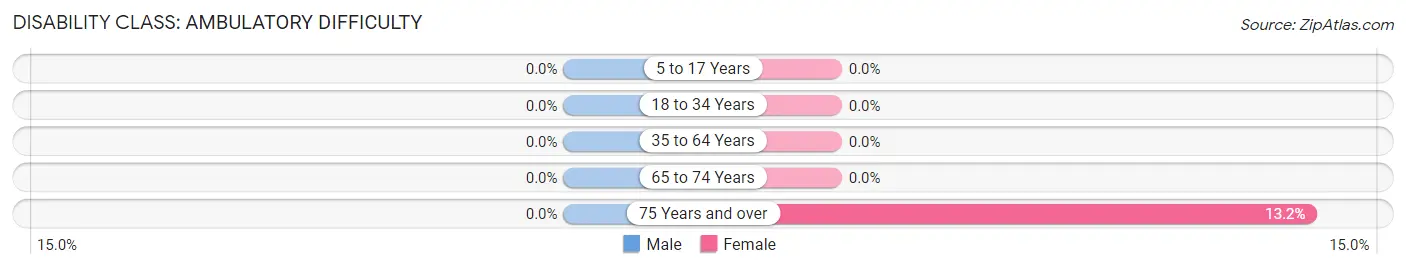
| Age Bracket | Male | Female |
| 5 to 17 Years | 0 (0.0%) | 0 (0.0%) |
| 18 to 34 Years | 0 (0.0%) | 0 (0.0%) |
| 35 to 64 Years | 0 (0.0%) | 0 (0.0%) |
| 65 to 74 Years | 0 (0.0%) | 0 (0.0%) |
| 75 Years and over | 0 (0.0%) | 9 (13.2%) |
Disability Class: Self-Care Difficulty
| Age Bracket | Male | Female |
| 5 to 17 Years | 0 (0.0%) | 0 (0.0%) |
| 18 to 34 Years | 0 (0.0%) | 0 (0.0%) |
| 35 to 64 Years | 0 (0.0%) | 0 (0.0%) |
| 65 to 74 Years | 0 (0.0%) | 0 (0.0%) |
| 75 Years and over | 0 (0.0%) | 0 (0.0%) |
Technology Access in St Marie
Computing Device Access in St Marie
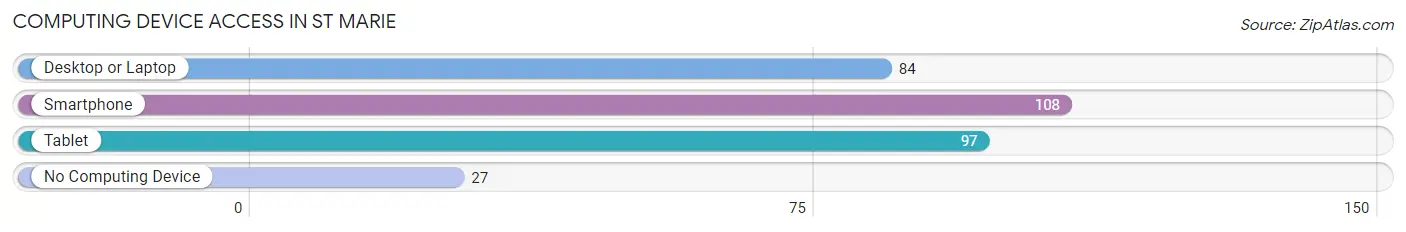
| Device Type | # Households | % Households |
| Desktop or Laptop | 84 | 53.5% |
| Smartphone | 108 | 68.8% |
| Tablet | 97 | 61.8% |
| No Computing Device | 27 | 17.2% |
| Total | 157 | 100.0% |
Internet Access in St Marie
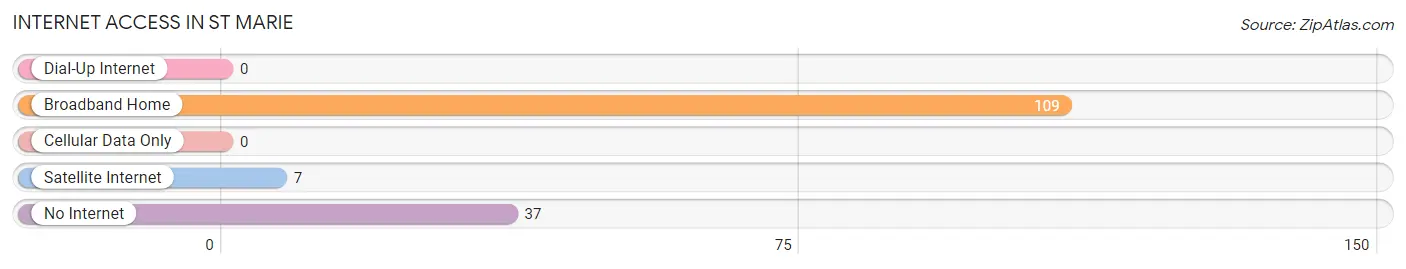
| Internet Type | # Households | % Households |
| Dial-Up Internet | 0 | 0.0% |
| Broadband Home | 109 | 69.4% |
| Cellular Data Only | 0 | 0.0% |
| Satellite Internet | 7 | 4.5% |
| No Internet | 37 | 23.6% |
| Total | 157 | 100.0% |
St Marie Summary
St. Marie, Montana is a small town located in the western part of the state, near the Idaho border. It is situated in the Bitterroot Valley, a region of the Rocky Mountains known for its stunning scenery and outdoor recreation opportunities. The town has a population of just over 1,000 people and is the county seat of Ravalli County.
History
St. Marie was founded in 1864 by a group of French-Canadian settlers who were looking for a place to settle and raise their families. The town was named after the patron saint of the settlers, St. Marie de L'Incarnation. The settlers were drawn to the area by the abundance of natural resources, including timber, minerals, and water.
The town quickly grew and prospered, becoming a hub for the surrounding area. In 1883, the Northern Pacific Railroad arrived in St. Marie, connecting the town to the rest of the country. This allowed the town to become a major trading center for the region.
In the early 1900s, St. Marie was a bustling town with a variety of businesses, including a bank, a hotel, a newspaper, and a variety of stores. The town also had a thriving lumber industry, which provided jobs for many of the town's residents.
Geography
St. Marie is located in the Bitterroot Valley, a region of the Rocky Mountains. The town is situated at an elevation of 3,400 feet and is surrounded by mountains and forests. The Bitterroot River runs through the town, providing a source of water for the area.
The climate in St. Marie is mild and temperate, with warm summers and cold winters. The average annual temperature is around 50 degrees Fahrenheit. The area receives an average of 20 inches of precipitation each year, mostly in the form of snow.
Economy
St. Marie's economy is largely based on tourism and agriculture. The town is a popular destination for outdoor recreation, such as fishing, hunting, and camping. The area is also known for its production of potatoes, wheat, and other crops.
The town also has a variety of small businesses, including restaurants, shops, and services. The town is home to a number of manufacturing companies, including a furniture factory and a woodworking shop.
Demographics
As of the 2010 census, St. Marie had a population of 1,072 people. The population is predominantly white, with a small percentage of Native Americans and African Americans. The median household income is $37,000, and the median age is 44.
St. Marie is a small, close-knit community with a strong sense of community and pride. The town is home to a variety of churches, schools, and other organizations that help to bring the community together. The town also hosts a variety of events throughout the year, including a summer festival and a winter carnival.
Common Questions
What is Per Capita Income in St Marie?
Per Capita income in St Marie is $15,911.
What is the Median Family Income in St Marie?
Median Family Income in St Marie is $36,597.
What is the Median Household income in St Marie?
Median Household Income in St Marie is $36,509.
What is Inequality or Gini Index in St Marie?
Inequality or Gini Index in St Marie is 0.34.
What is the Total Population of St Marie?
Total Population of St Marie is 428.
What is the Total Male Population of St Marie?
Total Male Population of St Marie is 156.
What is the Total Female Population of St Marie?
Total Female Population of St Marie is 272.
What is the Ratio of Males per 100 Females in St Marie?
There are 57.35 Males per 100 Females in St Marie.
What is the Ratio of Females per 100 Males in St Marie?
There are 174.36 Females per 100 Males in St Marie.
What is the Median Population Age in St Marie?
Median Population Age in St Marie is 37.8 Years.
What is the Average Family Size in St Marie
Average Family Size in St Marie is 4.6 People.
What is the Average Household Size in St Marie
Average Household Size in St Marie is 2.7 People.
How Large is the Labor Force in St Marie?
There are 112 People in the Labor Forcein in St Marie.
What is the Percentage of People in the Labor Force in St Marie?
29.6% of People are in the Labor Force in St Marie.
What is the Unemployment Rate in St Marie?
Unemployment Rate in St Marie is 24.1%.