Dillon, MT Map & Demographics
Dillon Map
Dillon Overview
$27,611
PER CAPITA INCOME
$76,250
AVG FAMILY INCOME
$42,037
AVG HOUSEHOLD INCOME
25.5%
WAGE / INCOME GAP [ % ]
74.5¢/ $1
WAGE / INCOME GAP [ $ ]
0.49
INEQUALITY / GINI INDEX
3,958
TOTAL POPULATION
2,020
MALE POPULATION
1,938
FEMALE POPULATION
104.23
MALES / 100 FEMALES
95.94
FEMALES / 100 MALES
29.9
MEDIAN AGE
2.9
AVG FAMILY SIZE
2.1
AVG HOUSEHOLD SIZE
1,916
LABOR FORCE [ PEOPLE ]
56.1%
PERCENT IN LABOR FORCE
3.8%
UNEMPLOYMENT RATE
Dillon Zip Codes
Dillon Area Codes
Income in Dillon
Income Overview in Dillon
Per Capita Income in Dillon is $27,611, while median incomes of families and households are $76,250 and $42,037 respectively.
| Characteristic | Number | Measure |
| Per Capita Income | 3,958 | $27,611 |
| Median Family Income | 766 | $76,250 |
| Mean Family Income | 766 | $84,514 |
| Median Household Income | 1,626 | $42,037 |
| Mean Household Income | 1,626 | $63,186 |
| Income Deficit | 766 | $0 |
| Wage / Income Gap (%) | 3,958 | 25.55% |
| Wage / Income Gap ($) | 3,958 | 74.45¢ per $1 |
| Gini / Inequality Index | 3,958 | 0.49 |
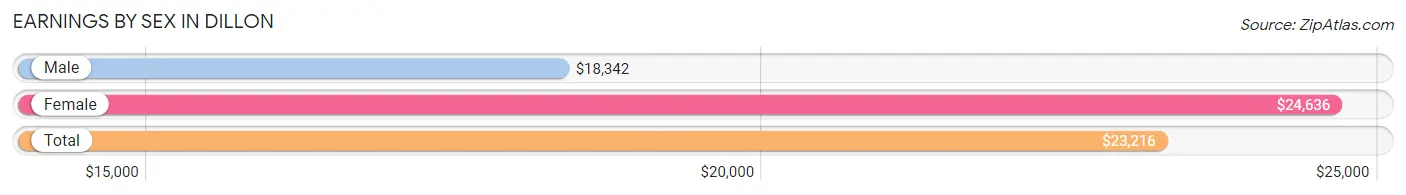
Earnings by Sex in Dillon
Average Earnings in Dillon are $23,216, $18,342 for men and $24,636 for women, a difference of 25.6%.
| Sex | Number | Average Earnings |
| Male | 1,301 (53.2%) | $18,342 |
| Female | 1,146 (46.8%) | $24,636 |
| Total | 2,447 (100.0%) | $23,216 |
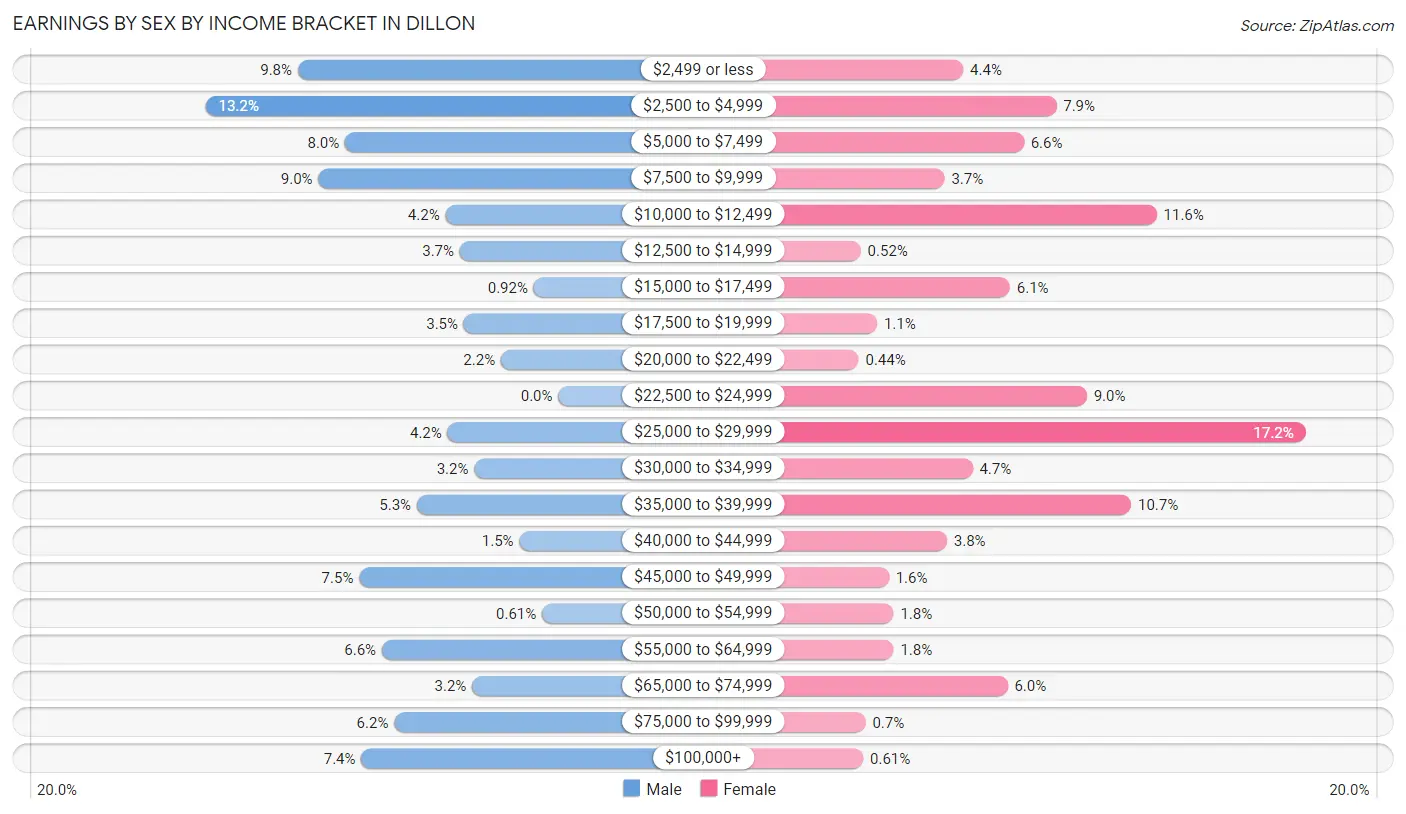
Earnings by Sex by Income Bracket in Dillon
The most common earnings brackets in Dillon are $2,500 to $4,999 for men (172 | 13.2%) and $25,000 to $29,999 for women (197 | 17.2%).
| Income | Male | Female |
| $2,499 or less | 127 (9.8%) | 50 (4.4%) |
| $2,500 to $4,999 | 172 (13.2%) | 90 (7.9%) |
| $5,000 to $7,499 | 104 (8.0%) | 76 (6.6%) |
| $7,500 to $9,999 | 117 (9.0%) | 42 (3.7%) |
| $10,000 to $12,499 | 55 (4.2%) | 133 (11.6%) |
| $12,500 to $14,999 | 48 (3.7%) | 6 (0.5%) |
| $15,000 to $17,499 | 12 (0.9%) | 70 (6.1%) |
| $17,500 to $19,999 | 46 (3.5%) | 13 (1.1%) |
| $20,000 to $22,499 | 28 (2.1%) | 5 (0.4%) |
| $22,500 to $24,999 | 0 (0.0%) | 103 (9.0%) |
| $25,000 to $29,999 | 54 (4.2%) | 197 (17.2%) |
| $30,000 to $34,999 | 41 (3.2%) | 54 (4.7%) |
| $35,000 to $39,999 | 69 (5.3%) | 122 (10.6%) |
| $40,000 to $44,999 | 19 (1.5%) | 43 (3.7%) |
| $45,000 to $49,999 | 97 (7.5%) | 18 (1.6%) |
| $50,000 to $54,999 | 8 (0.6%) | 20 (1.8%) |
| $55,000 to $64,999 | 86 (6.6%) | 20 (1.8%) |
| $65,000 to $74,999 | 42 (3.2%) | 69 (6.0%) |
| $75,000 to $99,999 | 80 (6.1%) | 8 (0.7%) |
| $100,000+ | 96 (7.4%) | 7 (0.6%) |
| Total | 1,301 (100.0%) | 1,146 (100.0%) |
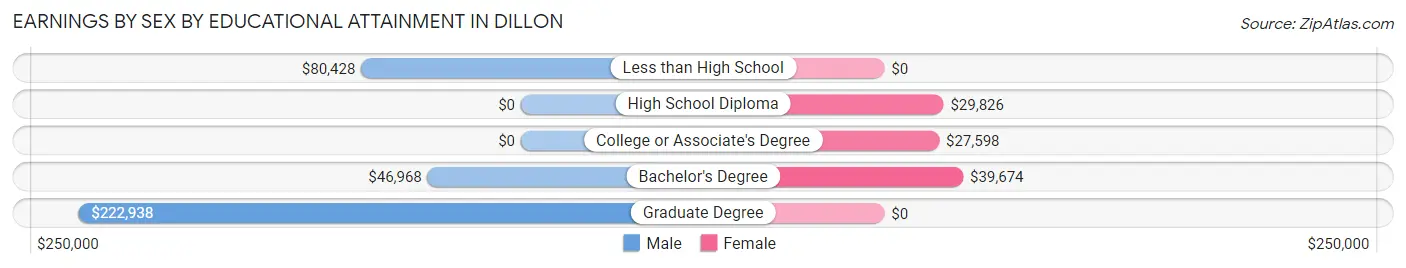
Earnings by Sex by Educational Attainment in Dillon
Average earnings in Dillon are $44,643 for men and $29,799 for women, a difference of 33.3%. Men with an educational attainment of graduate degree enjoy the highest average annual earnings of $222,938, while those with bachelor's degree education earn the least with $46,968. Women with an educational attainment of bachelor's degree earn the most with the average annual earnings of $39,674, while those with college or associate's degree education have the smallest earnings of $27,598.
| Educational Attainment | Male Income | Female Income |
| Less than High School | $80,428 | $0 |
| High School Diploma | - | - |
| College or Associate's Degree | - | - |
| Bachelor's Degree | $46,968 | $39,674 |
| Graduate Degree | $222,938 | $0 |
| Total | $44,643 | $29,799 |
Family Income in Dillon
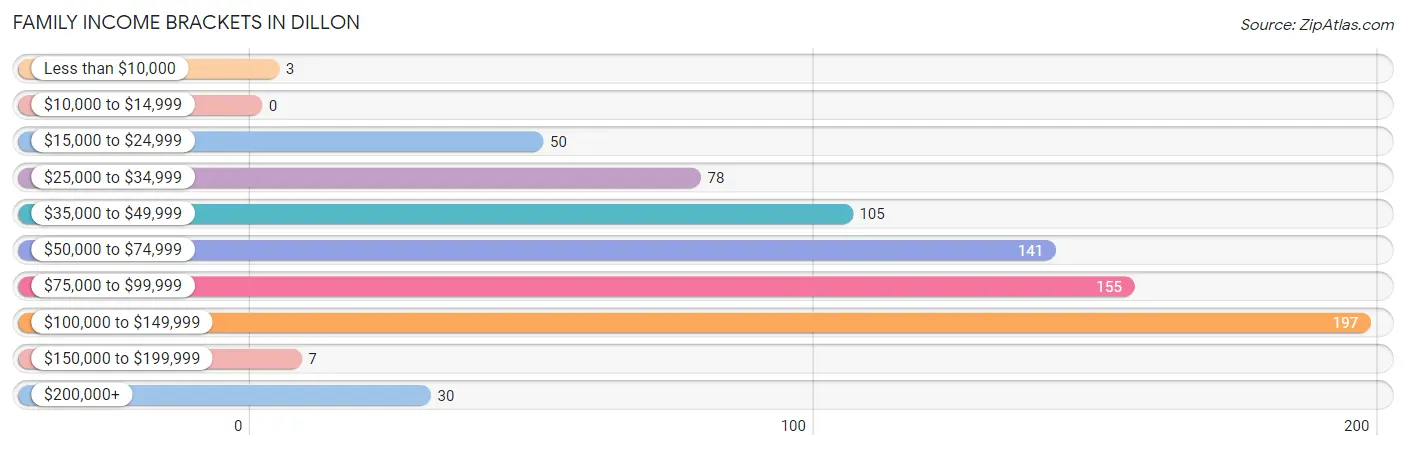
Family Income Brackets in Dillon
According to the Dillon family income data, there are 197 families falling into the $100,000 to $149,999 income range, which is the most common income bracket and makes up 25.7% of all families.
| Income Bracket | # Families | % Families |
| Less than $10,000 | 3 | 0.4% |
| $10,000 to $14,999 | 0 | 0.0% |
| $15,000 to $24,999 | 50 | 6.5% |
| $25,000 to $34,999 | 78 | 10.2% |
| $35,000 to $49,999 | 105 | 13.7% |
| $50,000 to $74,999 | 141 | 18.4% |
| $75,000 to $99,999 | 155 | 20.2% |
| $100,000 to $149,999 | 197 | 25.7% |
| $150,000 to $199,999 | 7 | 0.9% |
| $200,000+ | 30 | 3.9% |
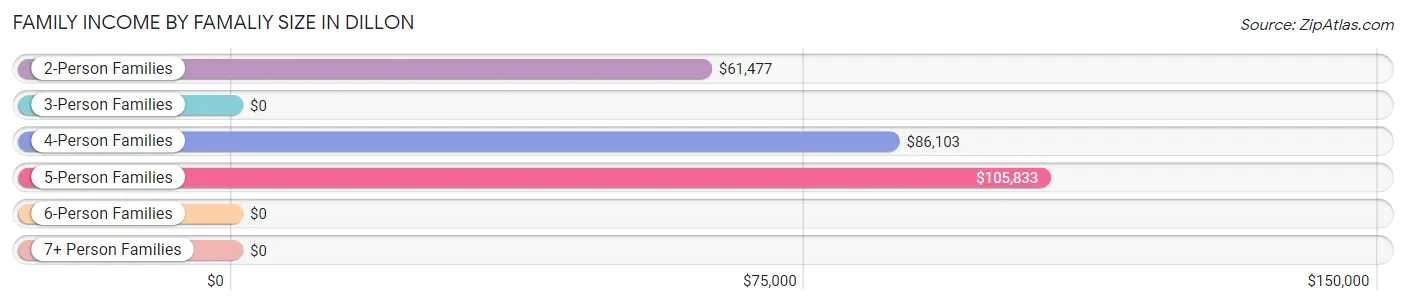
Family Income by Famaliy Size in Dillon
5-person families (36 | 4.7%) account for the highest median family income in Dillon with $105,833 per family, while 2-person families (404 | 52.7%) have the highest median income of $30,738 per family member.
| Income Bracket | # Families | Median Income |
| 2-Person Families | 404 (52.7%) | $61,477 |
| 3-Person Families | 39 (5.1%) | $0 |
| 4-Person Families | 265 (34.6%) | $86,103 |
| 5-Person Families | 36 (4.7%) | $105,833 |
| 6-Person Families | 0 (0.0%) | $0 |
| 7+ Person Families | 22 (2.9%) | $0 |
| Total | 766 (100.0%) | $76,250 |
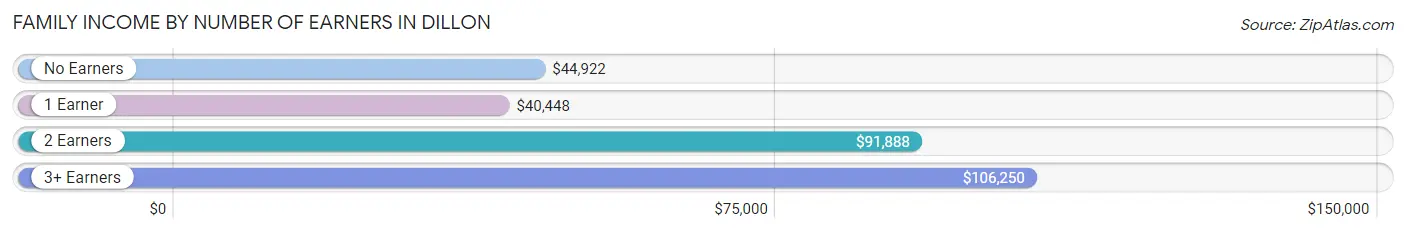
Family Income by Number of Earners in Dillon
The median family income in Dillon is $76,250, with families comprising 3+ earners (37) having the highest median family income of $106,250, while families with 1 earner (143) have the lowest median family income of $40,448, accounting for 4.8% and 18.7% of families, respectively.
| Number of Earners | # Families | Median Income |
| No Earners | 121 (15.8%) | $44,922 |
| 1 Earner | 143 (18.7%) | $40,448 |
| 2 Earners | 465 (60.7%) | $91,888 |
| 3+ Earners | 37 (4.8%) | $106,250 |
| Total | 766 (100.0%) | $76,250 |
Household Income in Dillon
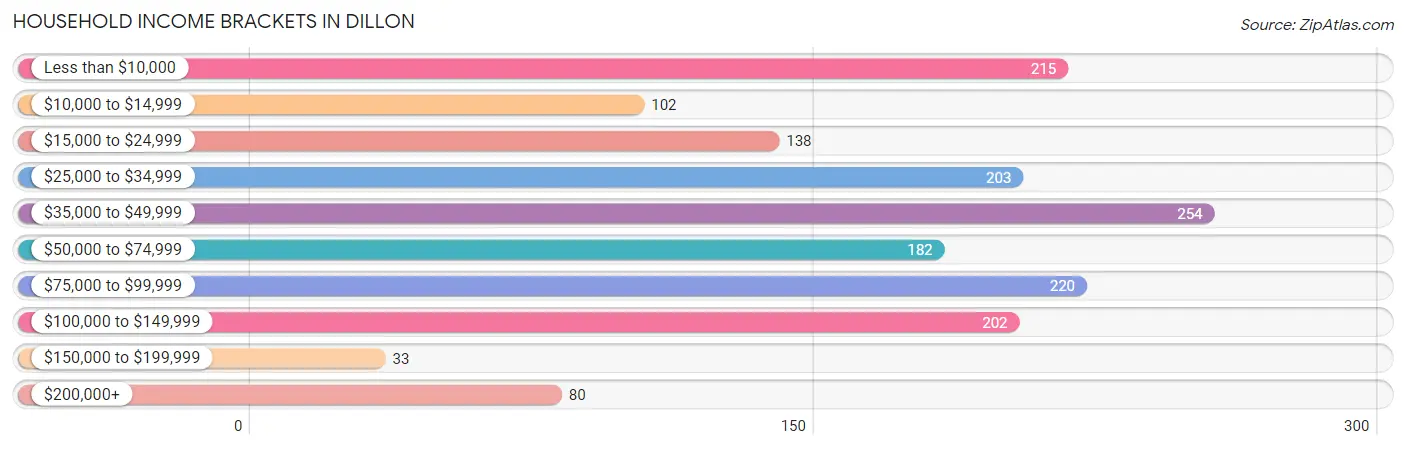
Household Income Brackets in Dillon
With 254 households falling in the category, the $35,000 to $49,999 income range is the most frequent in Dillon, accounting for 15.6% of all households. In contrast, only 33 households (2.0%) fall into the $150,000 to $199,999 income bracket, making it the least populous group.
| Income Bracket | # Households | % Households |
| Less than $10,000 | 215 | 13.2% |
| $10,000 to $14,999 | 102 | 6.3% |
| $15,000 to $24,999 | 138 | 8.5% |
| $25,000 to $34,999 | 203 | 12.5% |
| $35,000 to $49,999 | 254 | 15.6% |
| $50,000 to $74,999 | 182 | 11.2% |
| $75,000 to $99,999 | 220 | 13.5% |
| $100,000 to $149,999 | 202 | 12.4% |
| $150,000 to $199,999 | 33 | 2.0% |
| $200,000+ | 80 | 4.9% |
Household Income by Householder Age in Dillon
The median household income in Dillon is $42,037, with the highest median household income of $69,808 found in the 25 to 44 years age bracket for the primary householder. A total of 538 households (33.1%) fall into this category. Meanwhile, the 15 to 24 years age bracket for the primary householder has the lowest median household income of $0, with 305 households (18.8%) in this group.
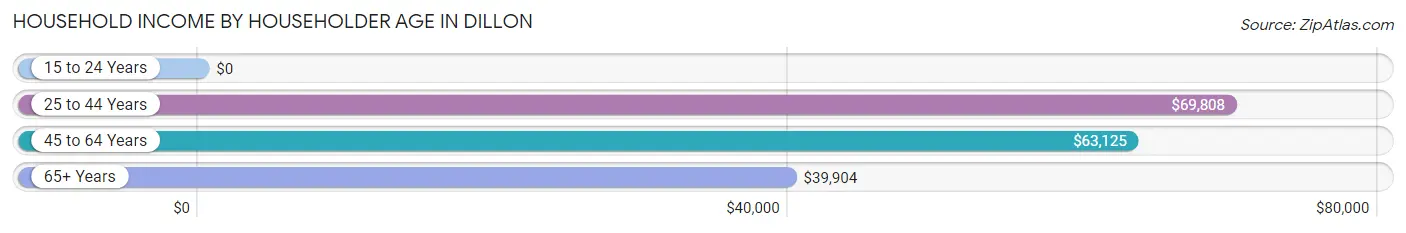
| Income Bracket | # Households | Median Income |
| 15 to 24 Years | 305 (18.8%) | $0 |
| 25 to 44 Years | 538 (33.1%) | $69,808 |
| 45 to 64 Years | 360 (22.1%) | $63,125 |
| 65+ Years | 423 (26.0%) | $39,904 |
| Total | 1,626 (100.0%) | $42,037 |
Poverty in Dillon
Income Below Poverty by Sex and Age in Dillon
With 26.1% poverty level for males and 18.4% for females among the residents of Dillon, 18 to 24 year old males and 5 year old females are the most vulnerable to poverty, with 359 males (89.5%) and 12 females (63.2%) in their respective age groups living below the poverty level.
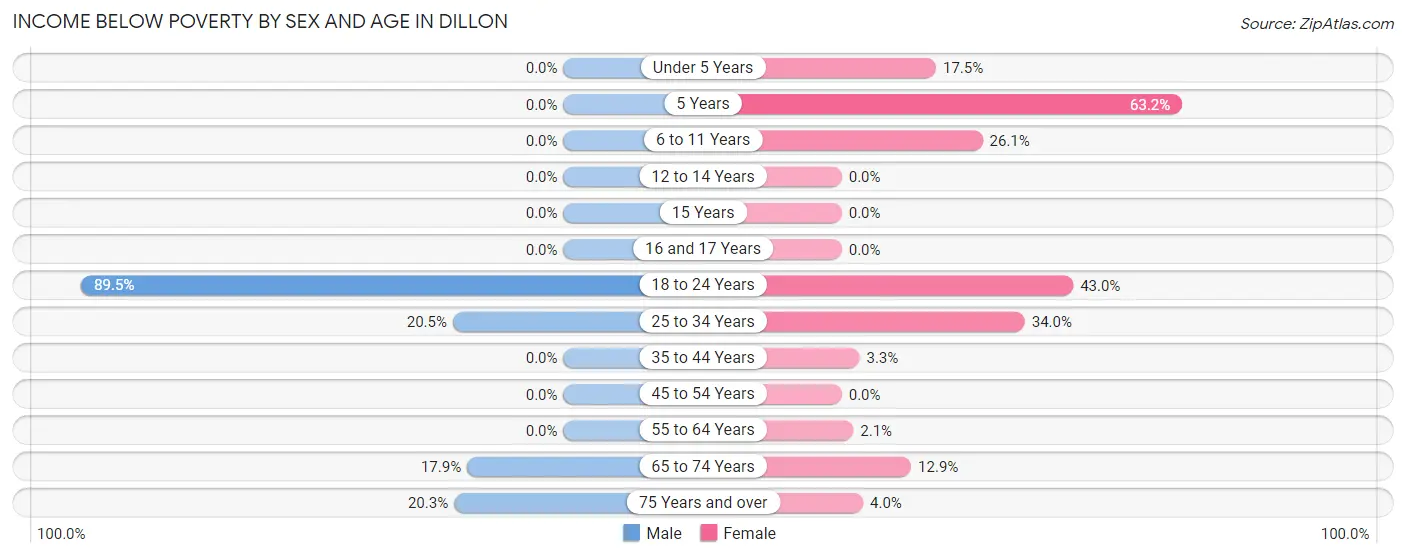
| Age Bracket | Male | Female |
| Under 5 Years | 0 (0.0%) | 14 (17.5%) |
| 5 Years | 0 (0.0%) | 12 (63.2%) |
| 6 to 11 Years | 0 (0.0%) | 23 (26.1%) |
| 12 to 14 Years | 0 (0.0%) | 0 (0.0%) |
| 15 Years | 0 (0.0%) | 0 (0.0%) |
| 16 and 17 Years | 0 (0.0%) | 0 (0.0%) |
| 18 to 24 Years | 359 (89.5%) | 134 (42.9%) |
| 25 to 34 Years | 47 (20.5%) | 89 (34.0%) |
| 35 to 44 Years | 0 (0.0%) | 5 (3.3%) |
| 45 to 54 Years | 0 (0.0%) | 0 (0.0%) |
| 55 to 64 Years | 0 (0.0%) | 5 (2.1%) |
| 65 to 74 Years | 34 (17.9%) | 26 (12.9%) |
| 75 Years and over | 27 (20.3%) | 6 (4.0%) |
| Total | 467 (26.1%) | 314 (18.4%) |
Income Above Poverty by Sex and Age in Dillon
According to the poverty statistics in Dillon, males aged under 5 years and females aged 12 to 14 years are the age groups that are most secure financially, with 100.0% of males and 100.0% of females in these age groups living above the poverty line.
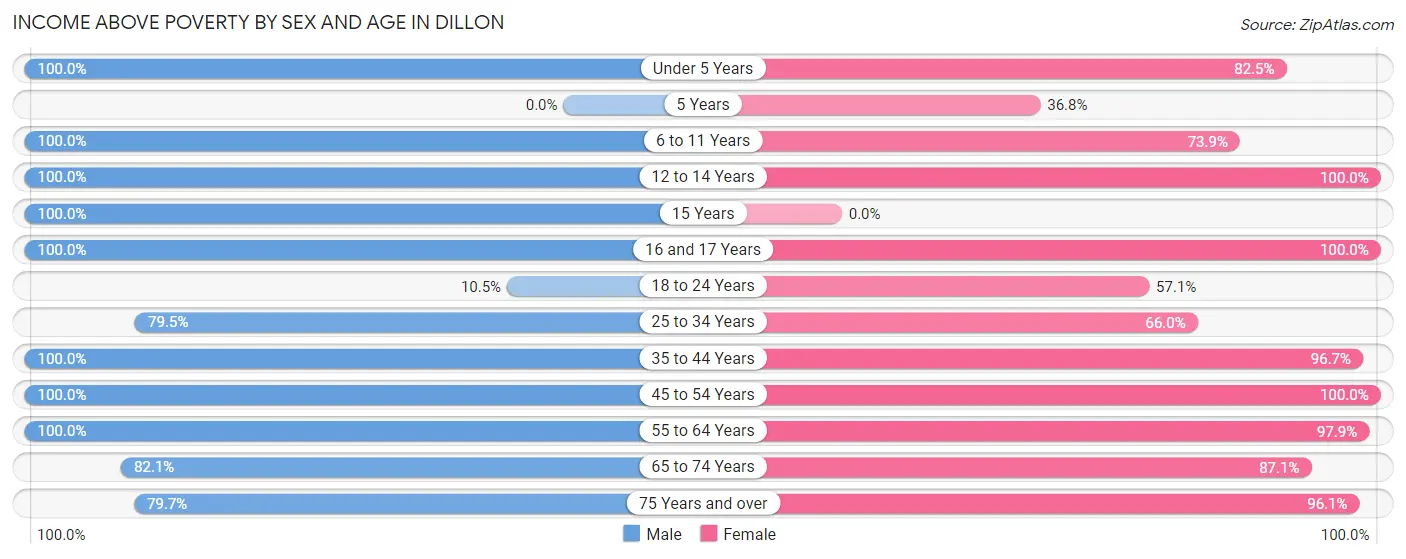
| Age Bracket | Male | Female |
| Under 5 Years | 57 (100.0%) | 66 (82.5%) |
| 5 Years | 0 (0.0%) | 7 (36.8%) |
| 6 to 11 Years | 176 (100.0%) | 65 (73.9%) |
| 12 to 14 Years | 17 (100.0%) | 68 (100.0%) |
| 15 Years | 10 (100.0%) | 0 (0.0%) |
| 16 and 17 Years | 54 (100.0%) | 32 (100.0%) |
| 18 to 24 Years | 42 (10.5%) | 178 (57.1%) |
| 25 to 34 Years | 182 (79.5%) | 173 (66.0%) |
| 35 to 44 Years | 232 (100.0%) | 147 (96.7%) |
| 45 to 54 Years | 83 (100.0%) | 108 (100.0%) |
| 55 to 64 Years | 205 (100.0%) | 229 (97.9%) |
| 65 to 74 Years | 156 (82.1%) | 176 (87.1%) |
| 75 Years and over | 106 (79.7%) | 146 (96.1%) |
| Total | 1,320 (73.9%) | 1,395 (81.6%) |
Income Below Poverty Among Married-Couple Families in Dillon
The poverty statistics for married-couple families in Dillon show that 8.3% or 53 of the total 639 families live below the poverty line. Families with no children have the highest poverty rate of 11.2%, comprising of 40 families. On the other hand, families with 3 or 4 children have the lowest poverty rate of 0.0%, which includes 0 families.
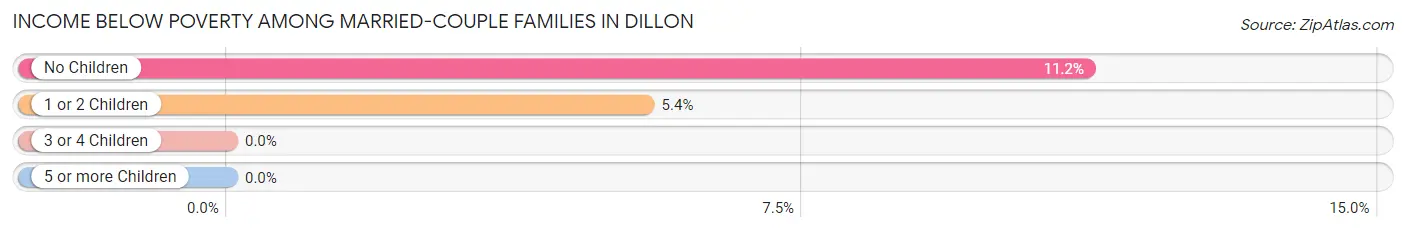
| Children | Above Poverty | Below Poverty |
| No Children | 317 (88.8%) | 40 (11.2%) |
| 1 or 2 Children | 226 (94.6%) | 13 (5.4%) |
| 3 or 4 Children | 21 (100.0%) | 0 (0.0%) |
| 5 or more Children | 22 (100.0%) | 0 (0.0%) |
| Total | 586 (91.7%) | 53 (8.3%) |
Income Below Poverty Among Single-Parent Households in Dillon
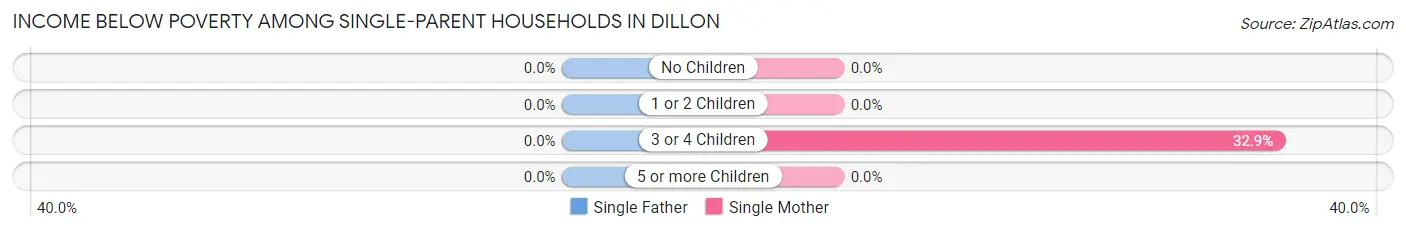
| Children | Single Father | Single Mother |
| No Children | 0 (0.0%) | 0 (0.0%) |
| 1 or 2 Children | 0 (0.0%) | 0 (0.0%) |
| 3 or 4 Children | 0 (0.0%) | 24 (32.9%) |
| 5 or more Children | 0 (0.0%) | 0 (0.0%) |
| Total | 0 (0.0%) | 24 (26.1%) |
Income Below Poverty Among Married-Couple vs Single-Parent Households in Dillon
The poverty data for Dillon shows that 53 of the married-couple family households (8.3%) and 24 of the single-parent households (18.9%) are living below the poverty level. Within the married-couple family households, those with no children have the highest poverty rate, with 40 households (11.2%) falling below the poverty line. Among the single-parent households, those with 3 or 4 children have the highest poverty rate, with 24 household (32.9%) living below poverty.
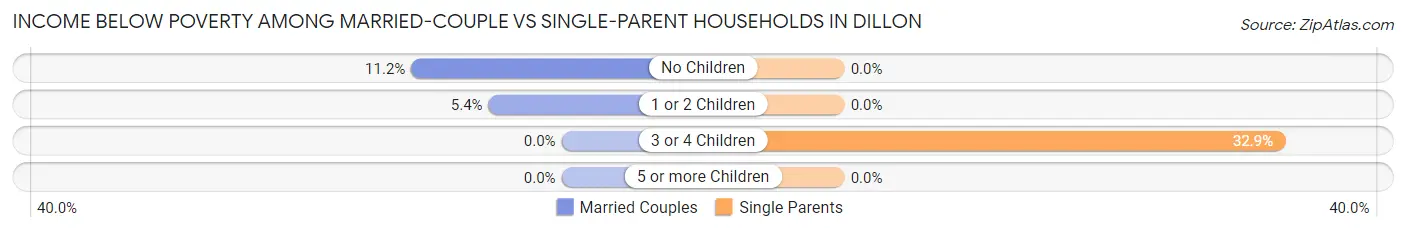
| Children | Married-Couple Families | Single-Parent Households |
| No Children | 40 (11.2%) | 0 (0.0%) |
| 1 or 2 Children | 13 (5.4%) | 0 (0.0%) |
| 3 or 4 Children | 0 (0.0%) | 24 (32.9%) |
| 5 or more Children | 0 (0.0%) | 0 (0.0%) |
| Total | 53 (8.3%) | 24 (18.9%) |
Race in Dillon
The most populous races in Dillon are White / Caucasian (3,642 | 92.0%), Native / Alaskan (131 | 3.3%), and Black / African American (98 | 2.5%).
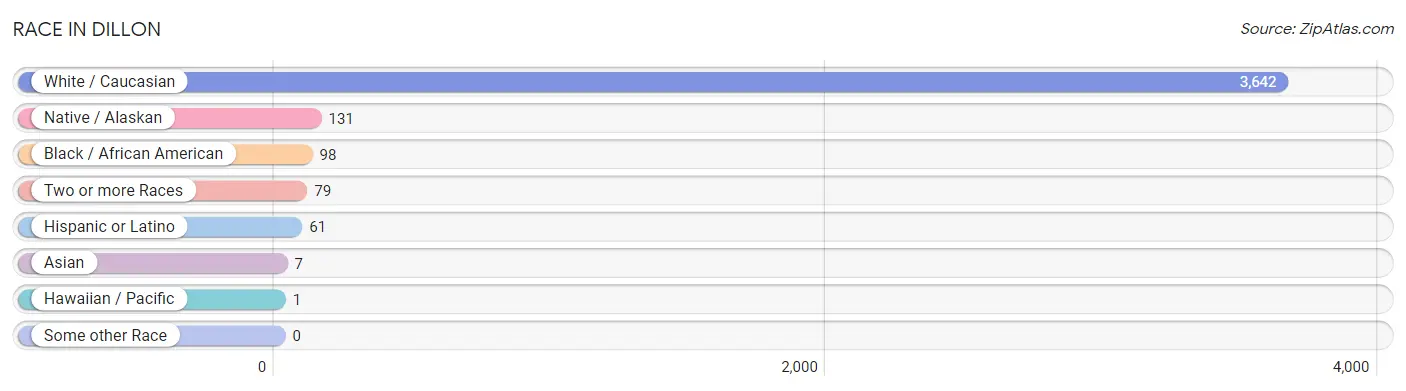
| Race | # Population | % Population |
| Asian | 7 | 0.2% |
| Black / African American | 98 | 2.5% |
| Hawaiian / Pacific | 1 | 0.0% |
| Hispanic or Latino | 61 | 1.5% |
| Native / Alaskan | 131 | 3.3% |
| White / Caucasian | 3,642 | 92.0% |
| Two or more Races | 79 | 2.0% |
| Some other Race | 0 | 0.0% |
| Total | 3,958 | 100.0% |
Ancestry in Dillon
The most populous ancestries reported in Dillon are German (887 | 22.4%), English (623 | 15.7%), Irish (536 | 13.5%), Norwegian (393 | 9.9%), and American (219 | 5.5%), together accounting for 67.2% of all Dillon residents.
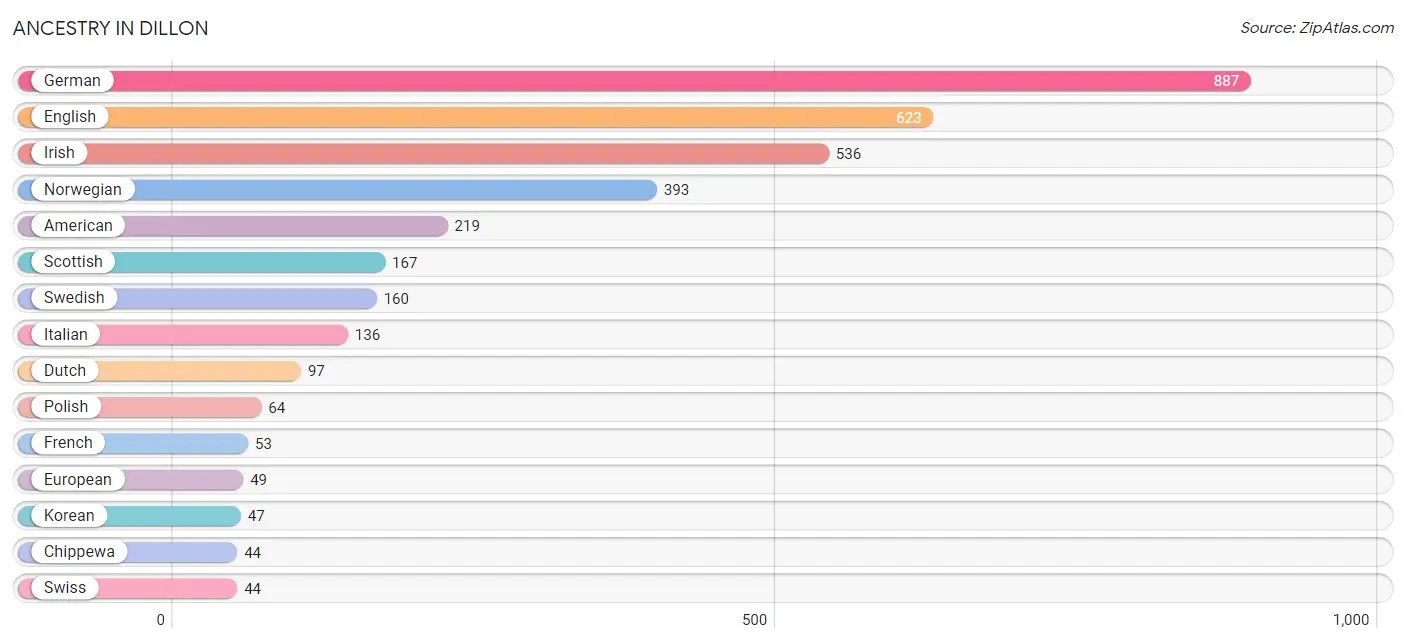
| Ancestry | # Population | % Population |
| American | 219 | 5.5% |
| Arab | 13 | 0.3% |
| Australian | 5 | 0.1% |
| Austrian | 16 | 0.4% |
| Basque | 8 | 0.2% |
| Blackfeet | 12 | 0.3% |
| British | 20 | 0.5% |
| Canadian | 2 | 0.1% |
| Cheyenne | 1 | 0.0% |
| Chippewa | 44 | 1.1% |
| Cuban | 37 | 0.9% |
| Czech | 5 | 0.1% |
| Danish | 40 | 1.0% |
| Dutch | 97 | 2.5% |
| Eastern European | 4 | 0.1% |
| English | 623 | 15.7% |
| European | 49 | 1.2% |
| French | 53 | 1.3% |
| French Canadian | 14 | 0.4% |
| German | 887 | 22.4% |
| Greek | 4 | 0.1% |
| Indian (Asian) | 3 | 0.1% |
| Irish | 536 | 13.5% |
| Italian | 136 | 3.4% |
| Korean | 47 | 1.2% |
| Lebanese | 13 | 0.3% |
| Mexican | 24 | 0.6% |
| Norwegian | 393 | 9.9% |
| Polish | 64 | 1.6% |
| Portuguese | 8 | 0.2% |
| Russian | 4 | 0.1% |
| Samoan | 1 | 0.0% |
| Scandinavian | 4 | 0.1% |
| Scotch-Irish | 3 | 0.1% |
| Scottish | 167 | 4.2% |
| Swedish | 160 | 4.0% |
| Swiss | 44 | 1.1% |
| Tlingit-Haida | 8 | 0.2% |
| Welsh | 40 | 1.0% |
| Yugoslavian | 4 | 0.1% | View All 40 Rows |
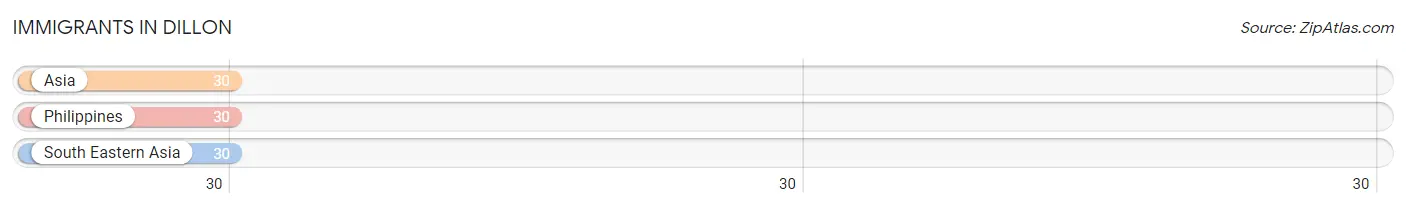
Immigrants in Dillon
The most numerous immigrant groups reported in Dillon came from Asia (30 | 0.8%), Philippines (30 | 0.8%), and South Eastern Asia (30 | 0.8%), together accounting for 2.3% of all Dillon residents.
| Immigration Origin | # Population | % Population |
| Asia | 30 | 0.8% |
| Philippines | 30 | 0.8% |
| South Eastern Asia | 30 | 0.8% | View All 3 Rows |
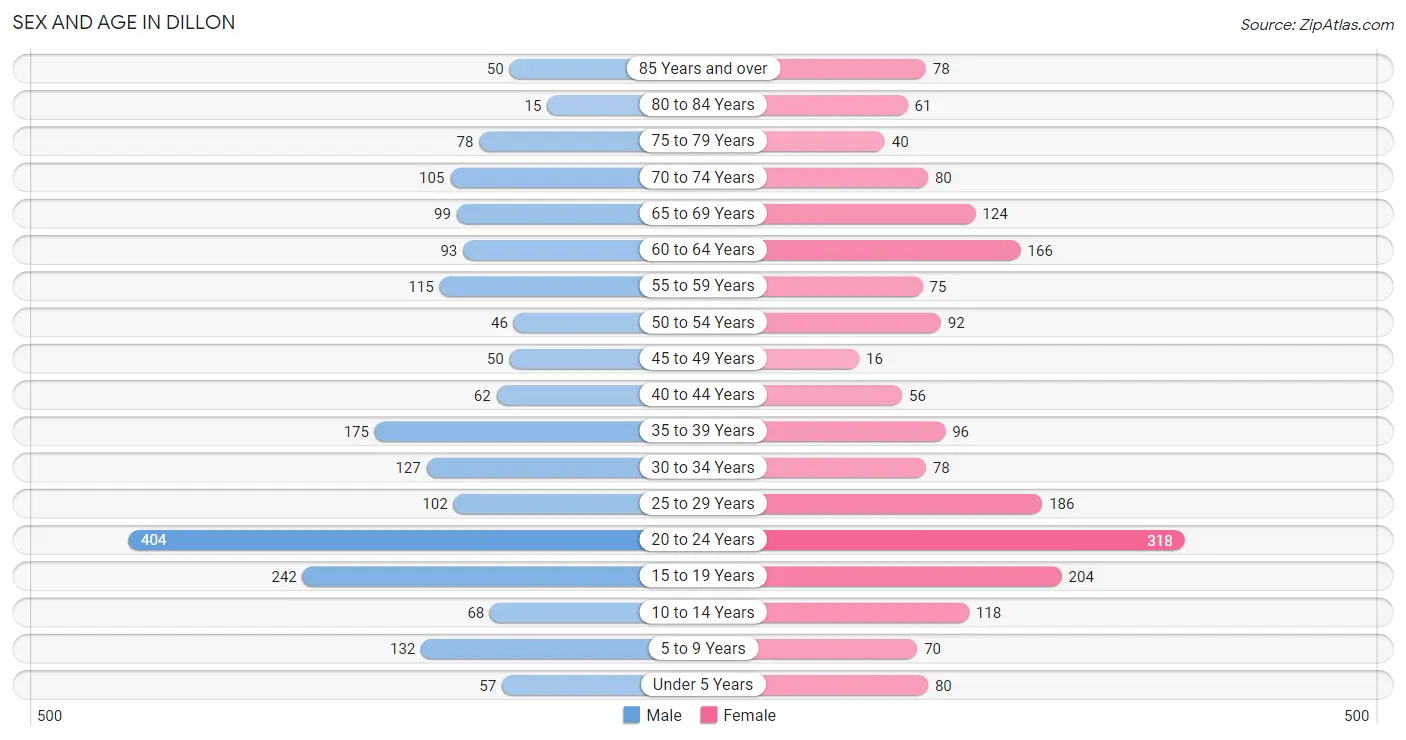
Sex and Age in Dillon
Sex and Age in Dillon
The most populous age groups in Dillon are 20 to 24 Years (404 | 20.0%) for men and 20 to 24 Years (318 | 16.4%) for women.
| Age Bracket | Male | Female |
| Under 5 Years | 57 (2.8%) | 80 (4.1%) |
| 5 to 9 Years | 132 (6.5%) | 70 (3.6%) |
| 10 to 14 Years | 68 (3.4%) | 118 (6.1%) |
| 15 to 19 Years | 242 (12.0%) | 204 (10.5%) |
| 20 to 24 Years | 404 (20.0%) | 318 (16.4%) |
| 25 to 29 Years | 102 (5.1%) | 186 (9.6%) |
| 30 to 34 Years | 127 (6.3%) | 78 (4.0%) |
| 35 to 39 Years | 175 (8.7%) | 96 (5.0%) |
| 40 to 44 Years | 62 (3.1%) | 56 (2.9%) |
| 45 to 49 Years | 50 (2.5%) | 16 (0.8%) |
| 50 to 54 Years | 46 (2.3%) | 92 (4.8%) |
| 55 to 59 Years | 115 (5.7%) | 75 (3.9%) |
| 60 to 64 Years | 93 (4.6%) | 166 (8.6%) |
| 65 to 69 Years | 99 (4.9%) | 124 (6.4%) |
| 70 to 74 Years | 105 (5.2%) | 80 (4.1%) |
| 75 to 79 Years | 78 (3.9%) | 40 (2.1%) |
| 80 to 84 Years | 15 (0.7%) | 61 (3.2%) |
| 85 Years and over | 50 (2.5%) | 78 (4.0%) |
| Total | 2,020 (100.0%) | 1,938 (100.0%) |
Families and Households in Dillon
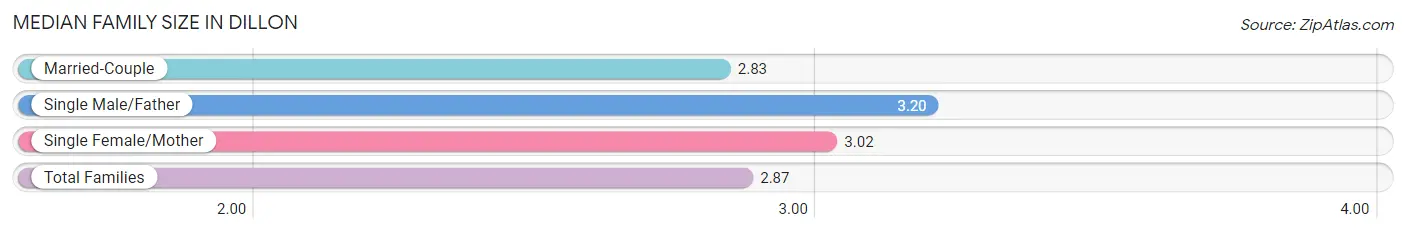
Median Family Size in Dillon
The median family size in Dillon is 2.87 persons per family, with single male/father families (35 | 4.6%) accounting for the largest median family size of 3.2 persons per family. On the other hand, married-couple families (639 | 83.4%) represent the smallest median family size with 2.83 persons per family.
| Family Type | # Families | Family Size |
| Married-Couple | 639 (83.4%) | 2.83 |
| Single Male/Father | 35 (4.6%) | 3.20 |
| Single Female/Mother | 92 (12.0%) | 3.02 |
| Total Families | 766 (100.0%) | 2.87 |
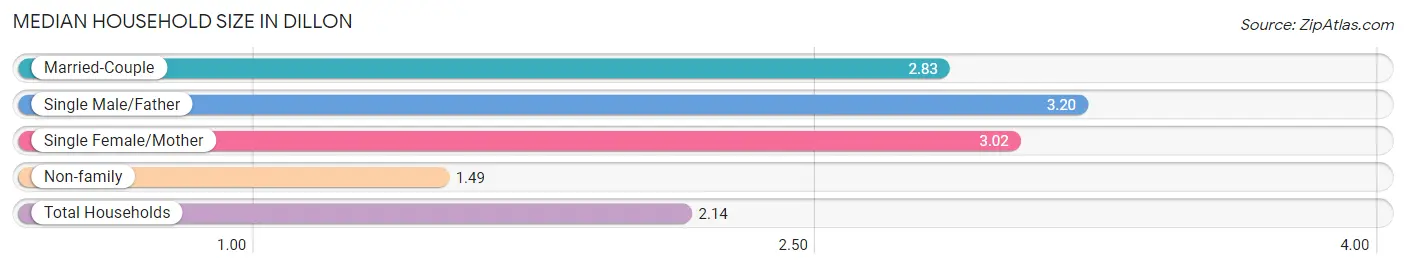
Median Household Size in Dillon
The median household size in Dillon is 2.14 persons per household, with single male/father households (35 | 2.1%) accounting for the largest median household size of 3.2 persons per household. non-family households (860 | 52.9%) represent the smallest median household size with 1.49 persons per household.
| Household Type | # Households | Household Size |
| Married-Couple | 639 (39.3%) | 2.83 |
| Single Male/Father | 35 (2.1%) | 3.20 |
| Single Female/Mother | 92 (5.7%) | 3.02 |
| Non-family | 860 (52.9%) | 1.49 |
| Total Households | 1,626 (100.0%) | 2.14 |
Household Size by Marriage Status in Dillon
Out of a total of 1,626 households in Dillon, 766 (47.1%) are family households, while 860 (52.9%) are nonfamily households. The most numerous type of family households are 2-person households, comprising 404, and the most common type of nonfamily households are 1-person households, comprising 704.
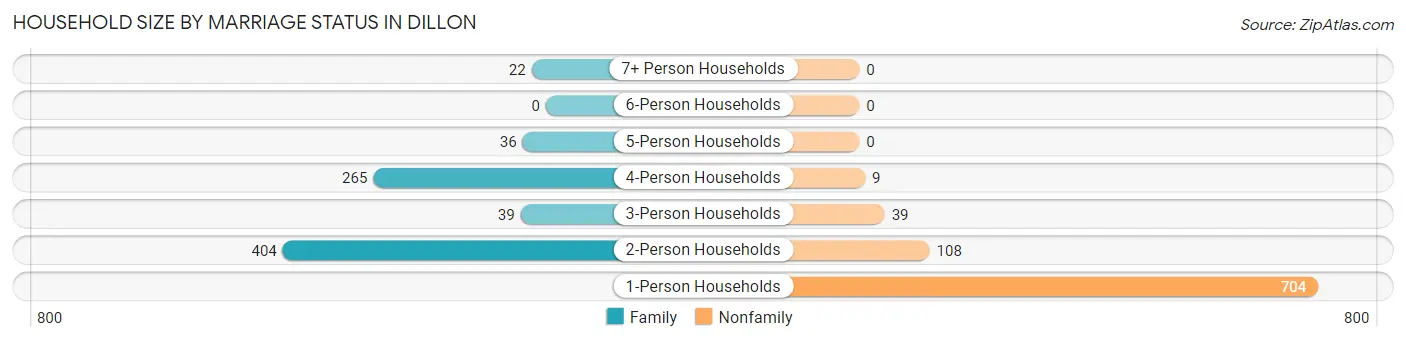
| Household Size | Family Households | Nonfamily Households |
| 1-Person Households | - | 704 (43.3%) |
| 2-Person Households | 404 (24.8%) | 108 (6.6%) |
| 3-Person Households | 39 (2.4%) | 39 (2.4%) |
| 4-Person Households | 265 (16.3%) | 9 (0.5%) |
| 5-Person Households | 36 (2.2%) | 0 (0.0%) |
| 6-Person Households | 0 (0.0%) | 0 (0.0%) |
| 7+ Person Households | 22 (1.3%) | 0 (0.0%) |
| Total | 766 (47.1%) | 860 (52.9%) |
Female Fertility in Dillon
Fertility by Age in Dillon
Average fertility rate in Dillon is 19.0 births per 1,000 women. Women in the age bracket of 20 to 34 years have the highest fertility rate with 31.0 births per 1,000 women. Women in the age bracket of 20 to 34 years acount for 100.0% of all women with births.
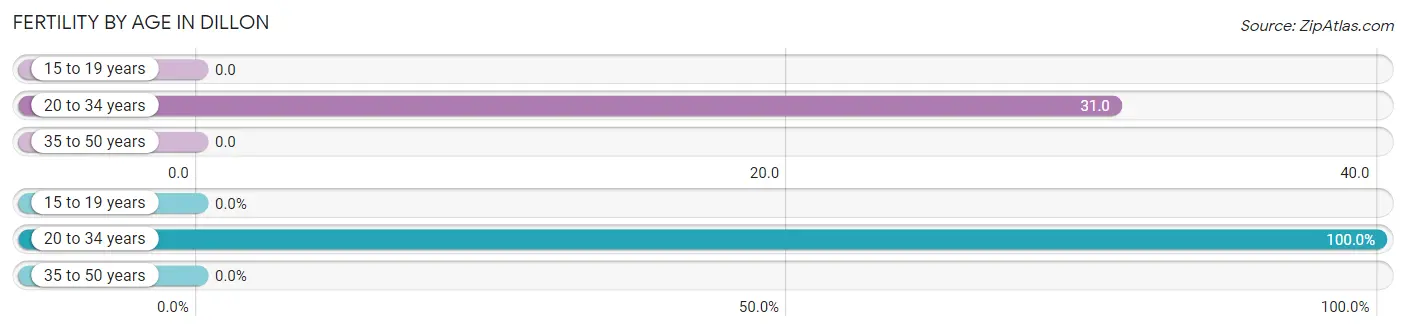
| Age Bracket | Women with Births | Births / 1,000 Women |
| 15 to 19 years | 0 (0.0%) | 0.0 |
| 20 to 34 years | 18 (100.0%) | 31.0 |
| 35 to 50 years | 0 (0.0%) | 0.0 |
| Total | 18 (100.0%) | 19.0 |
Fertility by Age by Marriage Status in Dillon
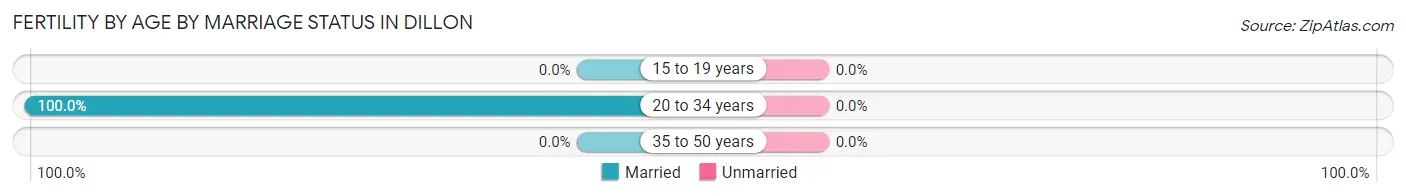
| Age Bracket | Married | Unmarried |
| 15 to 19 years | 0 (0.0%) | 0 (0.0%) |
| 20 to 34 years | 18 (100.0%) | 0 (0.0%) |
| 35 to 50 years | 0 (0.0%) | 0 (0.0%) |
| Total | 18 (100.0%) | 0 (0.0%) |
Fertility by Education in Dillon
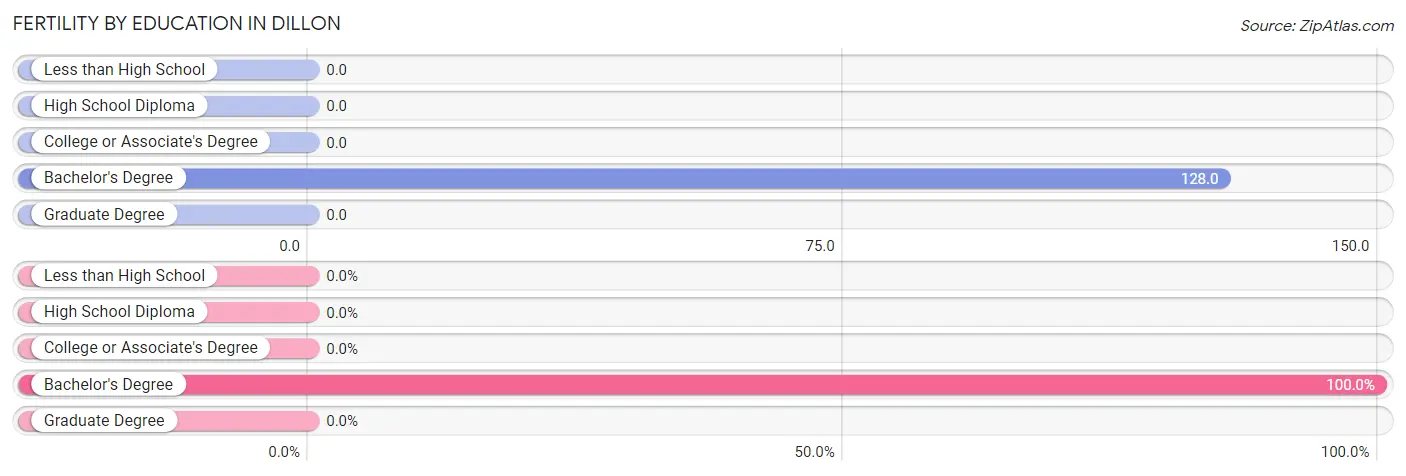
| Educational Attainment | Women with Births | Births / 1,000 Women |
| Less than High School | 0 (0.0%) | 0.0 |
| High School Diploma | 0 (0.0%) | 0.0 |
| College or Associate's Degree | 0 (0.0%) | 0.0 |
| Bachelor's Degree | 18 (100.0%) | 128.0 |
| Graduate Degree | 0 (0.0%) | 0.0 |
| Total | 18 (100.0%) | 19.0 |
Fertility by Education by Marriage Status in Dillon
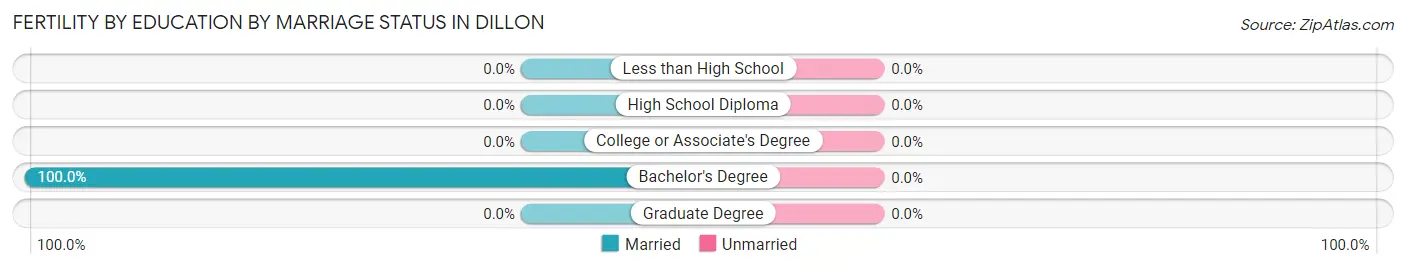
| Educational Attainment | Married | Unmarried |
| Less than High School | 0 (0.0%) | 0 (0.0%) |
| High School Diploma | 0 (0.0%) | 0 (0.0%) |
| College or Associate's Degree | 0 (0.0%) | 0 (0.0%) |
| Bachelor's Degree | 18 (100.0%) | 0 (0.0%) |
| Graduate Degree | 0 (0.0%) | 0 (0.0%) |
| Total | 18 (100.0%) | 0 (0.0%) |
Employment Characteristics in Dillon
Employment by Class of Employer in Dillon
Among the 1,840 employed individuals in Dillon, private company employees (1,080 | 58.7%), self-employed (not incorporated) (211 | 11.5%), and not-for-profit organizations (197 | 10.7%) make up the most common classes of employment.
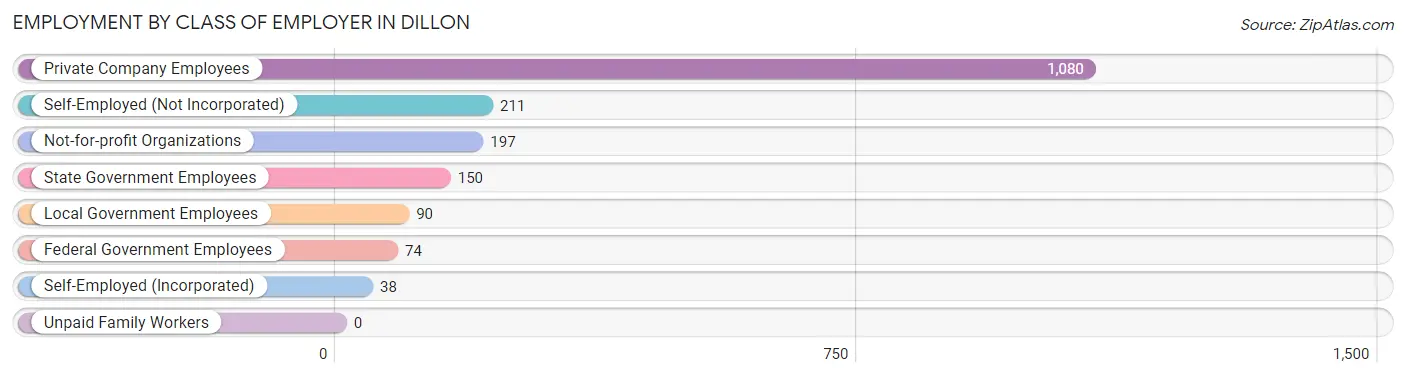
| Employer Class | # Employees | % Employees |
| Private Company Employees | 1,080 | 58.7% |
| Self-Employed (Incorporated) | 38 | 2.1% |
| Self-Employed (Not Incorporated) | 211 | 11.5% |
| Not-for-profit Organizations | 197 | 10.7% |
| Local Government Employees | 90 | 4.9% |
| State Government Employees | 150 | 8.2% |
| Federal Government Employees | 74 | 4.0% |
| Unpaid Family Workers | 0 | 0.0% |
| Total | 1,840 | 100.0% |
Employment Status by Age in Dillon
According to the labor force statistics for Dillon, out of the total population over 16 years of age (3,416), 56.1% or 1,916 individuals are in the labor force, with 3.8% or 73 of them unemployed. The age group with the highest labor force participation rate is 25 to 29 years, with 99.7% or 287 individuals in the labor force. Within the labor force, the 16 to 19 years age range has the highest percentage of unemployed individuals, with 14.0% or 16 of them being unemployed.
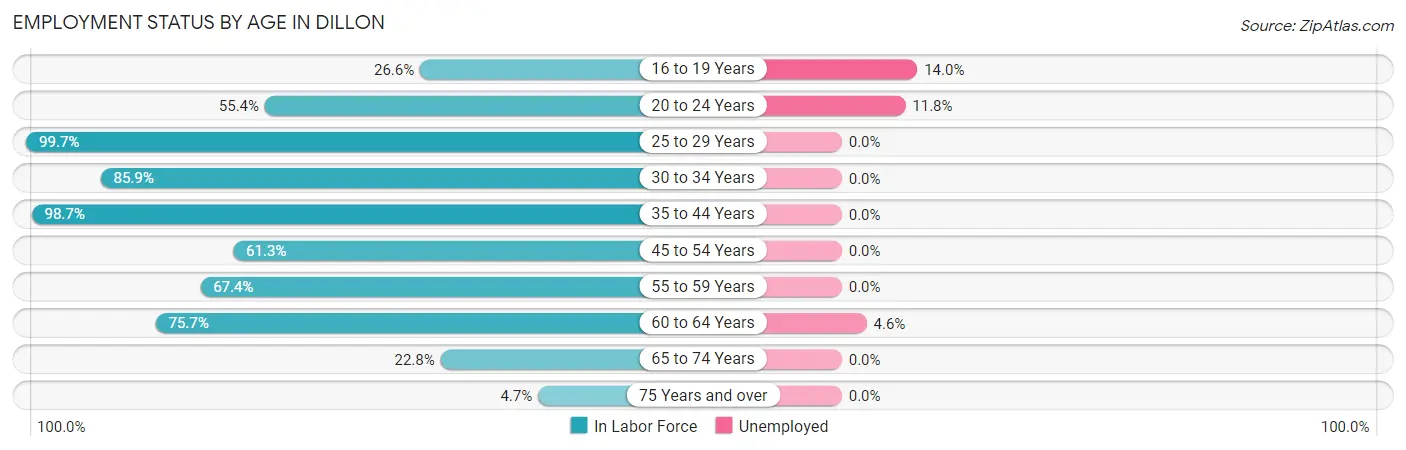
| Age Bracket | In Labor Force | Unemployed |
| 16 to 19 Years | 114 (26.6%) | 16 (14.0%) |
| 20 to 24 Years | 400 (55.4%) | 47 (11.8%) |
| 25 to 29 Years | 287 (99.7%) | 0 (0.0%) |
| 30 to 34 Years | 176 (85.9%) | 0 (0.0%) |
| 35 to 44 Years | 384 (98.7%) | 0 (0.0%) |
| 45 to 54 Years | 125 (61.3%) | 0 (0.0%) |
| 55 to 59 Years | 128 (67.4%) | 0 (0.0%) |
| 60 to 64 Years | 196 (75.7%) | 9 (4.6%) |
| 65 to 74 Years | 93 (22.8%) | 0 (0.0%) |
| 75 Years and over | 15 (4.7%) | 0 (0.0%) |
| Total | 1,916 (56.1%) | 73 (3.8%) |
Employment Status by Educational Attainment in Dillon
According to labor force statistics for Dillon, 84.4% of individuals (1,296) out of the total population between 25 and 64 years of age (1,535) are in the labor force, with 0.7% or 9 of them being unemployed. The group with the highest labor force participation rate are those with the educational attainment of less than high school, with 91.2% or 83 individuals in the labor force. Within the labor force, individuals with college / associate degree education have the highest percentage of unemployment, with 1.7% or 9 of them being unemployed.
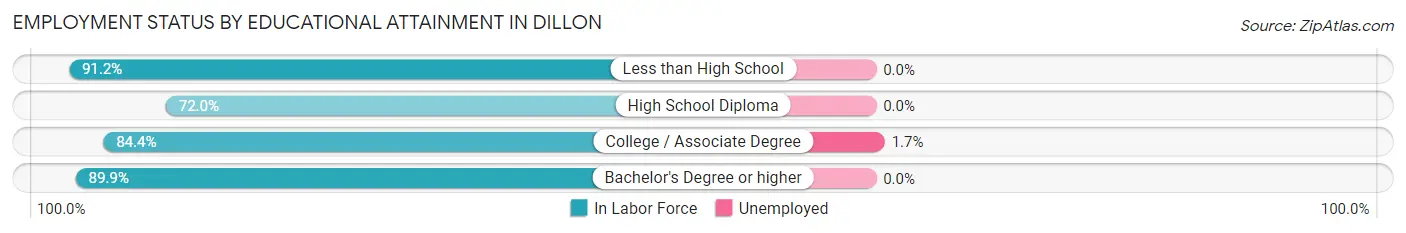
| Educational Attainment | In Labor Force | Unemployed |
| Less than High School | 83 (91.2%) | 0 (0.0%) |
| High School Diploma | 203 (72.0%) | 0 (0.0%) |
| College / Associate Degree | 530 (84.4%) | 11 (1.7%) |
| Bachelor's Degree or higher | 480 (89.9%) | 0 (0.0%) |
| Total | 1,296 (84.4%) | 11 (0.7%) |
Employment Occupations by Sex in Dillon
Management, Business, Science and Arts Occupations
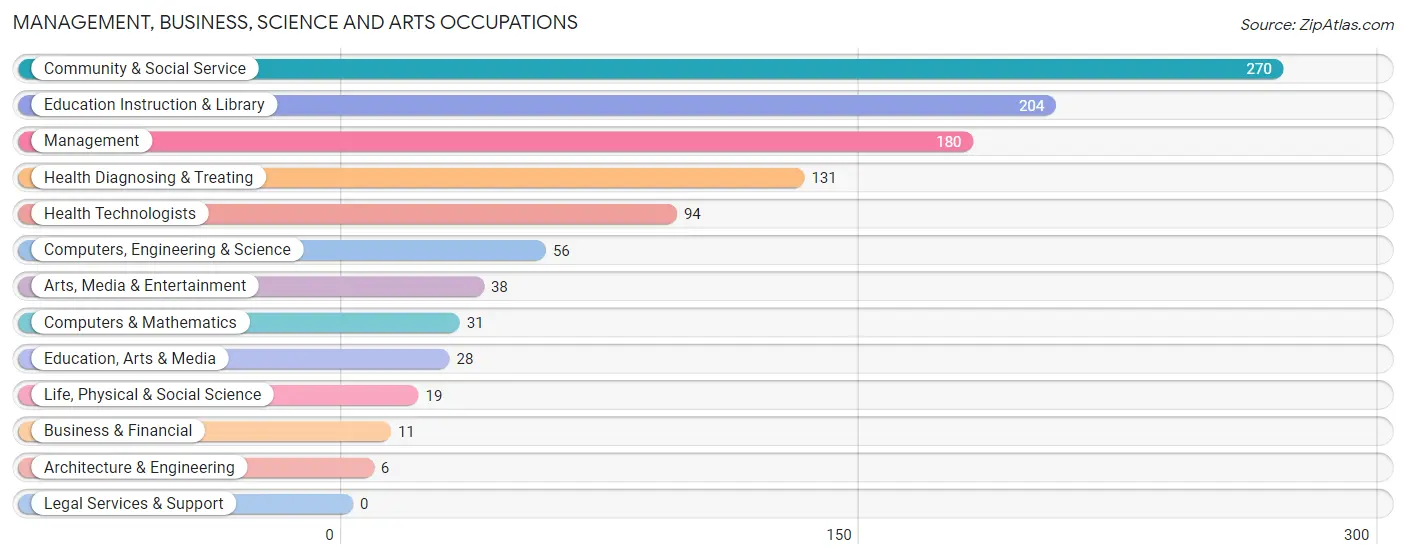
The most common Management, Business, Science and Arts occupations in Dillon are Community & Social Service (270 | 14.6%), Education Instruction & Library (204 | 11.1%), Management (180 | 9.8%), Health Diagnosing & Treating (131 | 7.1%), and Health Technologists (94 | 5.1%).
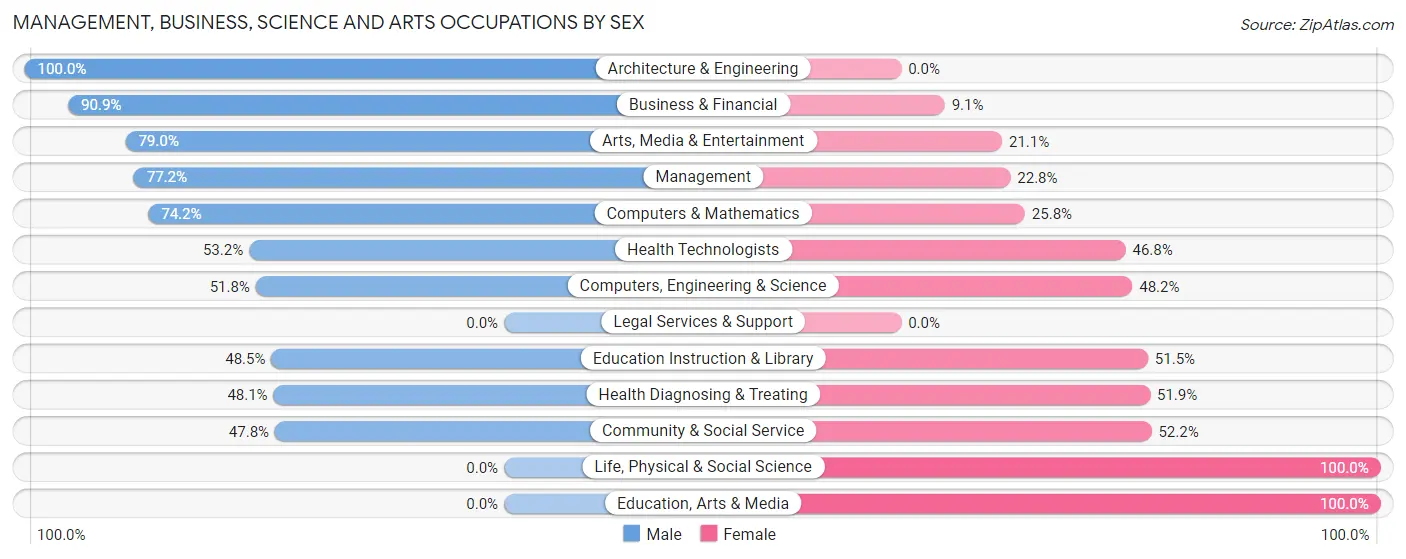
Management, Business, Science and Arts Occupations by Sex
Within the Management, Business, Science and Arts occupations in Dillon, the most male-oriented occupations are Architecture & Engineering (100.0%), Business & Financial (90.9%), and Arts, Media & Entertainment (78.9%), while the most female-oriented occupations are Life, Physical & Social Science (100.0%), Education, Arts & Media (100.0%), and Community & Social Service (52.2%).
| Occupation | Male | Female |
| Management | 139 (77.2%) | 41 (22.8%) |
| Business & Financial | 10 (90.9%) | 1 (9.1%) |
| Computers, Engineering & Science | 29 (51.8%) | 27 (48.2%) |
| Computers & Mathematics | 23 (74.2%) | 8 (25.8%) |
| Architecture & Engineering | 6 (100.0%) | 0 (0.0%) |
| Life, Physical & Social Science | 0 (0.0%) | 19 (100.0%) |
| Community & Social Service | 129 (47.8%) | 141 (52.2%) |
| Education, Arts & Media | 0 (0.0%) | 28 (100.0%) |
| Legal Services & Support | 0 (0.0%) | 0 (0.0%) |
| Education Instruction & Library | 99 (48.5%) | 105 (51.5%) |
| Arts, Media & Entertainment | 30 (78.9%) | 8 (21.0%) |
| Health Diagnosing & Treating | 63 (48.1%) | 68 (51.9%) |
| Health Technologists | 50 (53.2%) | 44 (46.8%) |
| Total (Category) | 370 (57.1%) | 278 (42.9%) |
| Total (Overall) | 877 (47.5%) | 969 (52.5%) |
Services Occupations
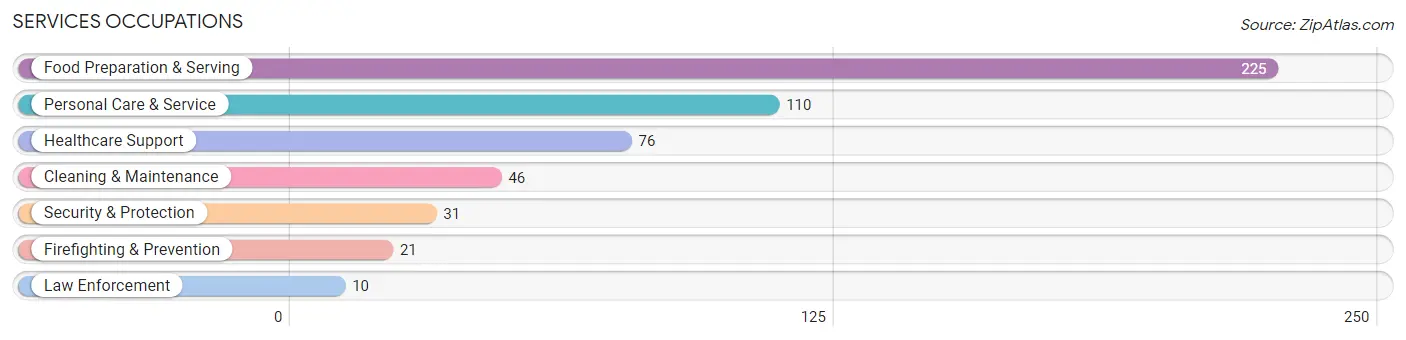
The most common Services occupations in Dillon are Food Preparation & Serving (225 | 12.2%), Personal Care & Service (110 | 6.0%), Healthcare Support (76 | 4.1%), Cleaning & Maintenance (46 | 2.5%), and Security & Protection (31 | 1.7%).
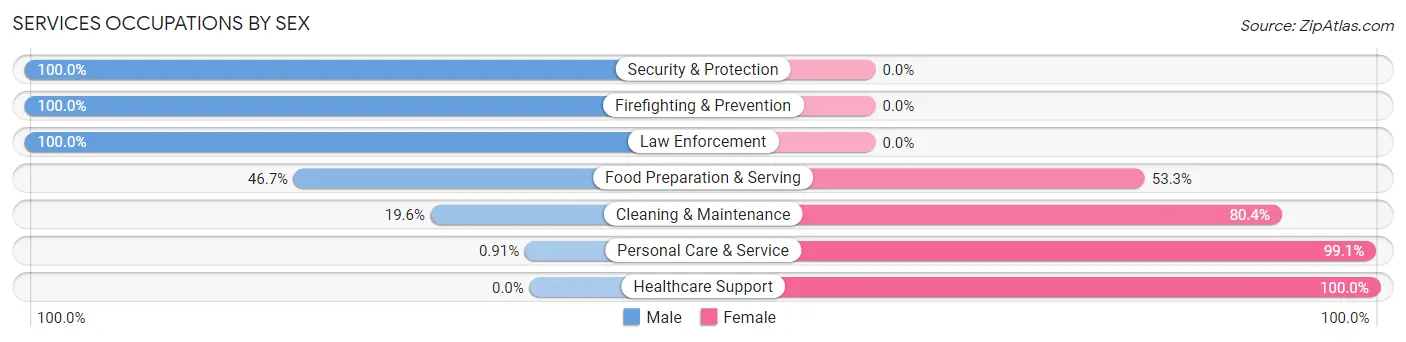
Services Occupations by Sex
Within the Services occupations in Dillon, the most male-oriented occupations are Security & Protection (100.0%), Firefighting & Prevention (100.0%), and Law Enforcement (100.0%), while the most female-oriented occupations are Healthcare Support (100.0%), Personal Care & Service (99.1%), and Cleaning & Maintenance (80.4%).
| Occupation | Male | Female |
| Healthcare Support | 0 (0.0%) | 76 (100.0%) |
| Security & Protection | 31 (100.0%) | 0 (0.0%) |
| Firefighting & Prevention | 21 (100.0%) | 0 (0.0%) |
| Law Enforcement | 10 (100.0%) | 0 (0.0%) |
| Food Preparation & Serving | 105 (46.7%) | 120 (53.3%) |
| Cleaning & Maintenance | 9 (19.6%) | 37 (80.4%) |
| Personal Care & Service | 1 (0.9%) | 109 (99.1%) |
| Total (Category) | 146 (29.9%) | 342 (70.1%) |
| Total (Overall) | 877 (47.5%) | 969 (52.5%) |
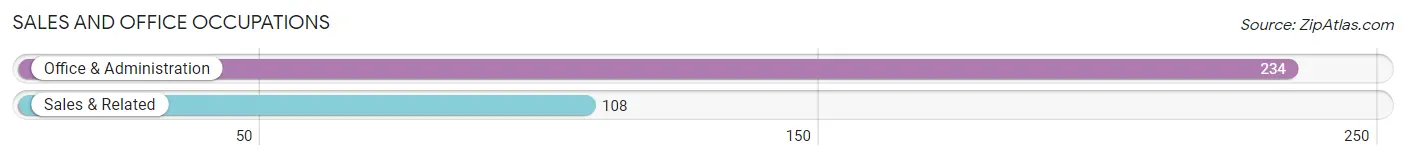
Sales and Office Occupations
The most common Sales and Office occupations in Dillon are Office & Administration (234 | 12.7%), and Sales & Related (108 | 5.9%).
Sales and Office Occupations by Sex
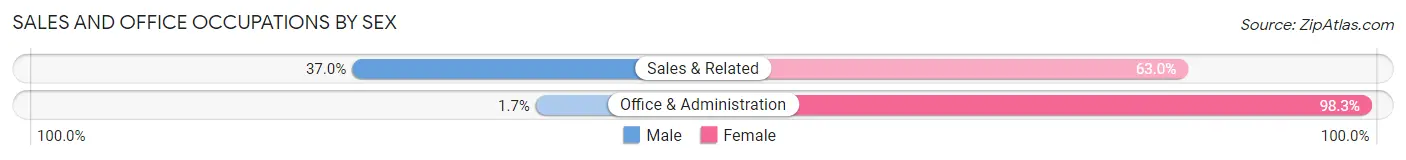
| Occupation | Male | Female |
| Sales & Related | 40 (37.0%) | 68 (63.0%) |
| Office & Administration | 4 (1.7%) | 230 (98.3%) |
| Total (Category) | 44 (12.9%) | 298 (87.1%) |
| Total (Overall) | 877 (47.5%) | 969 (52.5%) |
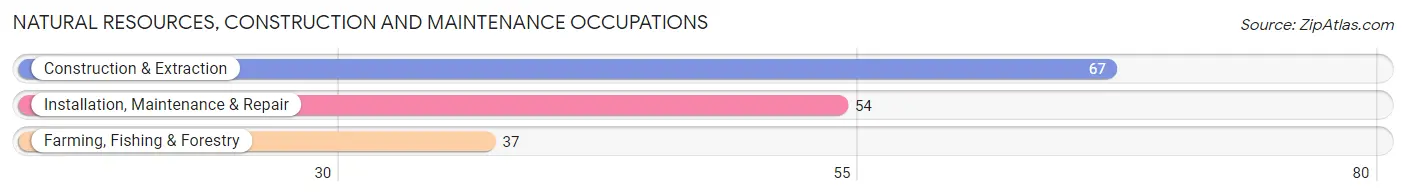
Natural Resources, Construction and Maintenance Occupations
The most common Natural Resources, Construction and Maintenance occupations in Dillon are Construction & Extraction (67 | 3.6%), Installation, Maintenance & Repair (54 | 2.9%), and Farming, Fishing & Forestry (37 | 2.0%).
Natural Resources, Construction and Maintenance Occupations by Sex
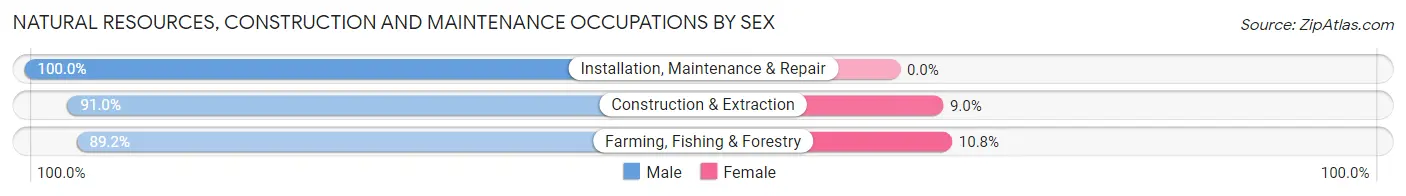
| Occupation | Male | Female |
| Farming, Fishing & Forestry | 33 (89.2%) | 4 (10.8%) |
| Construction & Extraction | 61 (91.0%) | 6 (9.0%) |
| Installation, Maintenance & Repair | 54 (100.0%) | 0 (0.0%) |
| Total (Category) | 148 (93.7%) | 10 (6.3%) |
| Total (Overall) | 877 (47.5%) | 969 (52.5%) |
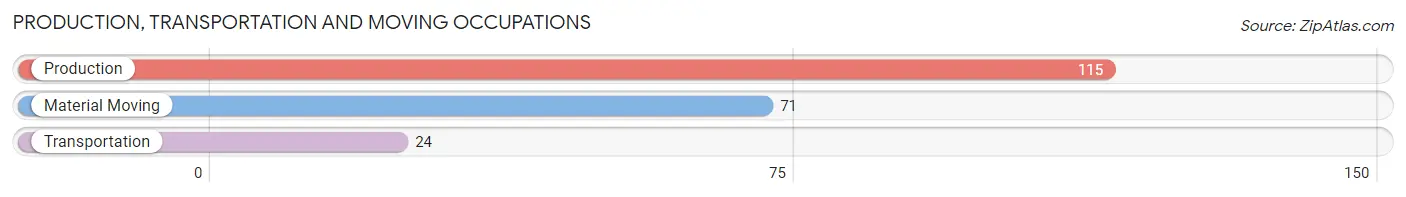
Production, Transportation and Moving Occupations
The most common Production, Transportation and Moving occupations in Dillon are Production (115 | 6.2%), Material Moving (71 | 3.8%), and Transportation (24 | 1.3%).
Production, Transportation and Moving Occupations by Sex
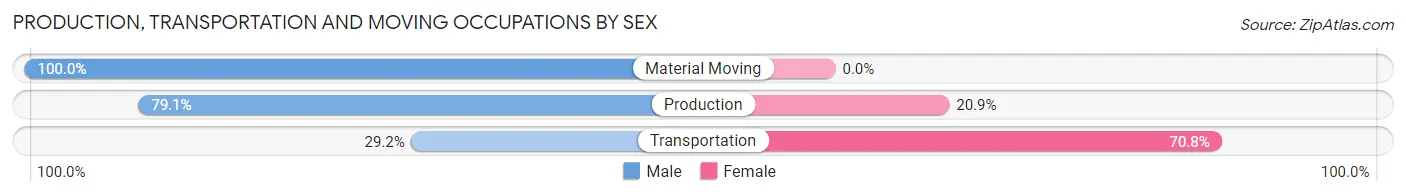
| Occupation | Male | Female |
| Production | 91 (79.1%) | 24 (20.9%) |
| Transportation | 7 (29.2%) | 17 (70.8%) |
| Material Moving | 71 (100.0%) | 0 (0.0%) |
| Total (Category) | 169 (80.5%) | 41 (19.5%) |
| Total (Overall) | 877 (47.5%) | 969 (52.5%) |
Employment Industries by Sex in Dillon
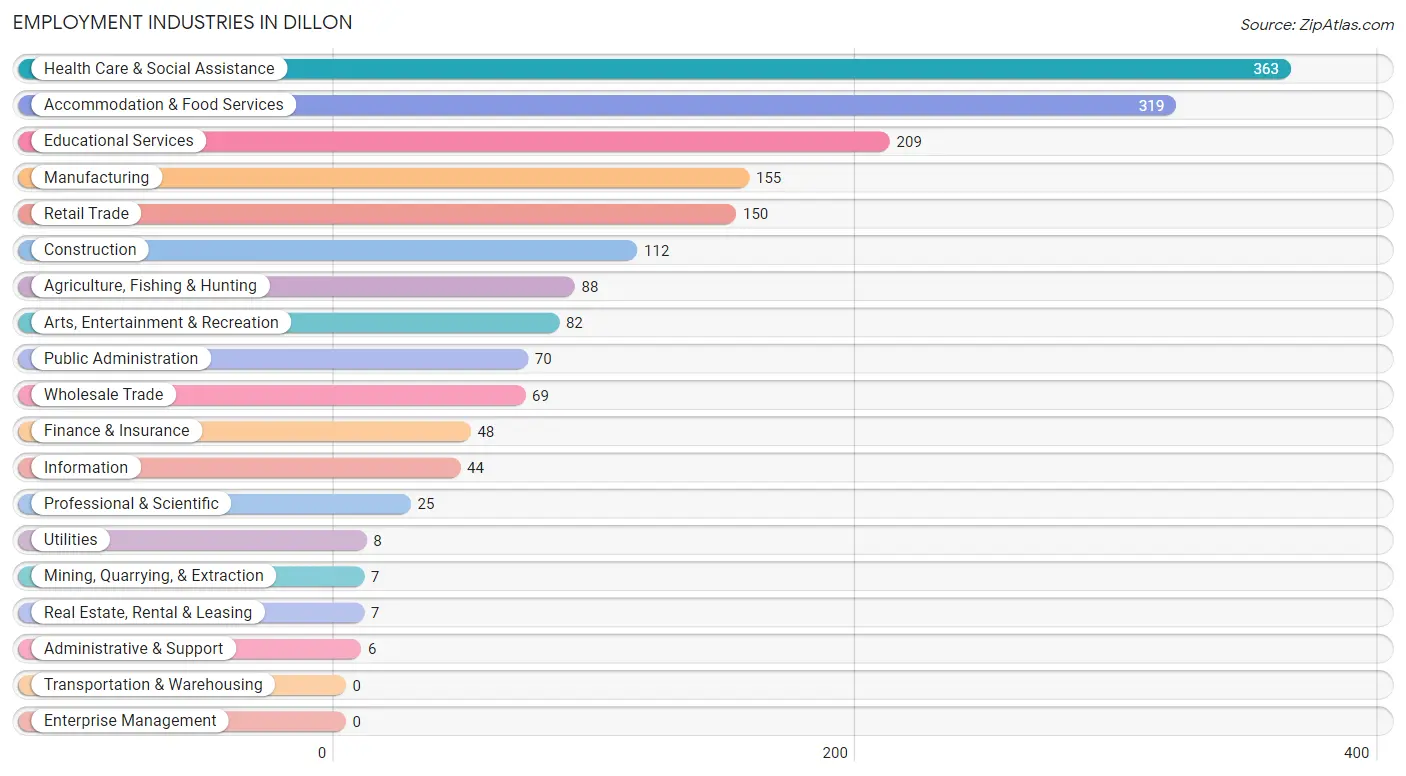
Employment Industries in Dillon
The major employment industries in Dillon include Health Care & Social Assistance (363 | 19.7%), Accommodation & Food Services (319 | 17.3%), Educational Services (209 | 11.3%), Manufacturing (155 | 8.4%), and Retail Trade (150 | 8.1%).
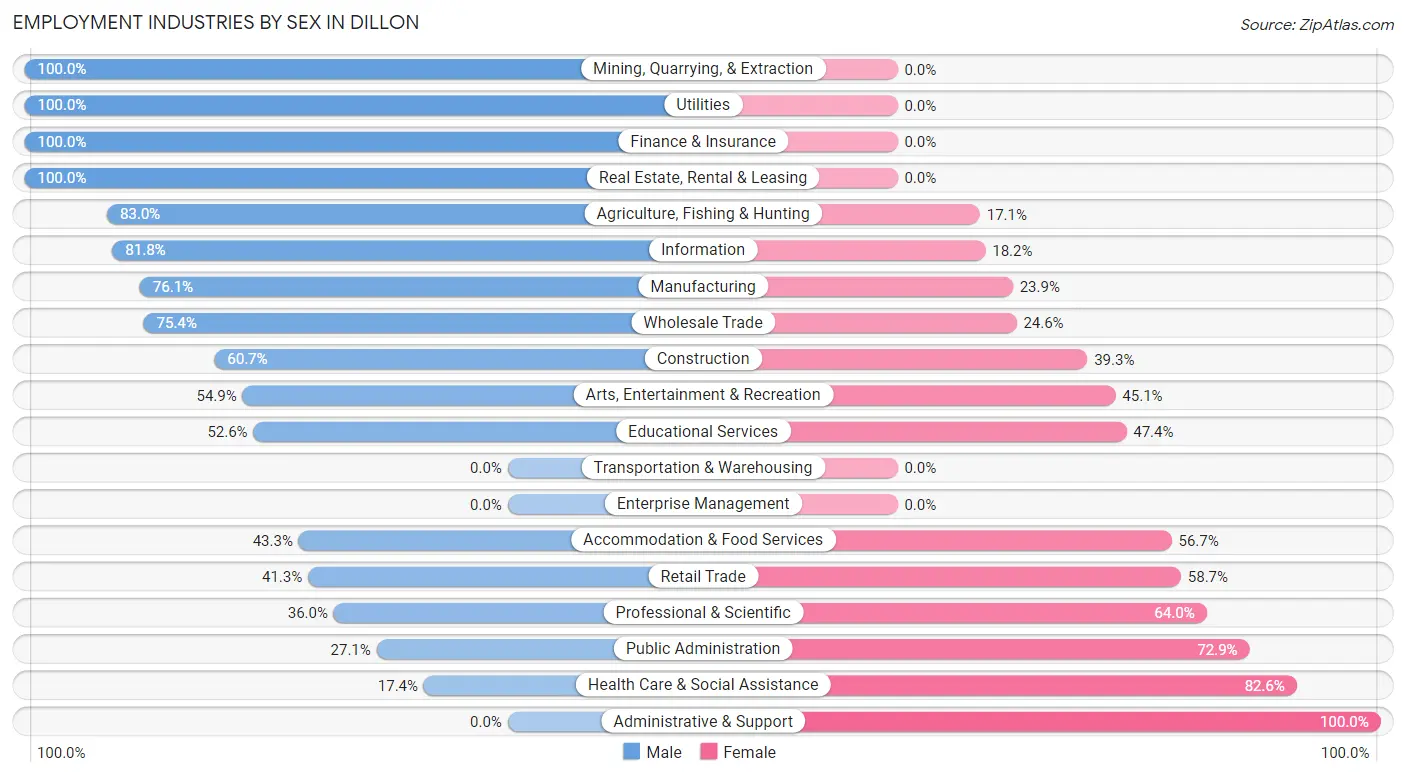
Employment Industries by Sex in Dillon
The Dillon industries that see more men than women are Mining, Quarrying, & Extraction (100.0%), Utilities (100.0%), and Finance & Insurance (100.0%), whereas the industries that tend to have a higher number of women are Administrative & Support (100.0%), Health Care & Social Assistance (82.6%), and Public Administration (72.9%).
| Industry | Male | Female |
| Agriculture, Fishing & Hunting | 73 (83.0%) | 15 (17.1%) |
| Mining, Quarrying, & Extraction | 7 (100.0%) | 0 (0.0%) |
| Construction | 68 (60.7%) | 44 (39.3%) |
| Manufacturing | 118 (76.1%) | 37 (23.9%) |
| Wholesale Trade | 52 (75.4%) | 17 (24.6%) |
| Retail Trade | 62 (41.3%) | 88 (58.7%) |
| Transportation & Warehousing | 0 (0.0%) | 0 (0.0%) |
| Utilities | 8 (100.0%) | 0 (0.0%) |
| Information | 36 (81.8%) | 8 (18.2%) |
| Finance & Insurance | 48 (100.0%) | 0 (0.0%) |
| Real Estate, Rental & Leasing | 7 (100.0%) | 0 (0.0%) |
| Professional & Scientific | 9 (36.0%) | 16 (64.0%) |
| Enterprise Management | 0 (0.0%) | 0 (0.0%) |
| Administrative & Support | 0 (0.0%) | 6 (100.0%) |
| Educational Services | 110 (52.6%) | 99 (47.4%) |
| Health Care & Social Assistance | 63 (17.4%) | 300 (82.6%) |
| Arts, Entertainment & Recreation | 45 (54.9%) | 37 (45.1%) |
| Accommodation & Food Services | 138 (43.3%) | 181 (56.7%) |
| Public Administration | 19 (27.1%) | 51 (72.9%) |
| Total | 877 (47.5%) | 969 (52.5%) |
Education in Dillon
School Enrollment in Dillon
The most common levels of schooling among the 1,364 students in Dillon are college / undergraduate (825 | 60.5%), high school (150 | 11.0%), and elementary school (136 | 10.0%).
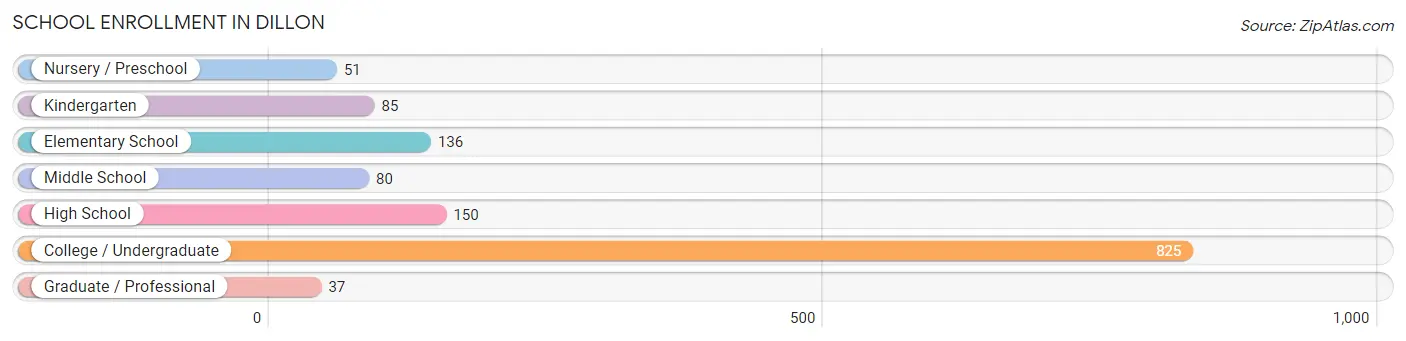
| School Level | # Students | % Students |
| Nursery / Preschool | 51 | 3.7% |
| Kindergarten | 85 | 6.2% |
| Elementary School | 136 | 10.0% |
| Middle School | 80 | 5.9% |
| High School | 150 | 11.0% |
| College / Undergraduate | 825 | 60.5% |
| Graduate / Professional | 37 | 2.7% |
| Total | 1,364 | 100.0% |
School Enrollment by Age by Funding Source in Dillon
Out of a total of 1,364 students who are enrolled in schools in Dillon, 259 (19.0%) attend a private institution, while the remaining 1,105 (81.0%) are enrolled in public schools. The age group of 15 to 17 year olds has the highest likelihood of being enrolled in private schools, with 105 (77.8% in the age bracket) enrolled. Conversely, the age group of 20 to 24 year olds has the lowest likelihood of being enrolled in a private school, with 544 (100.0% in the age bracket) attending a public institution.
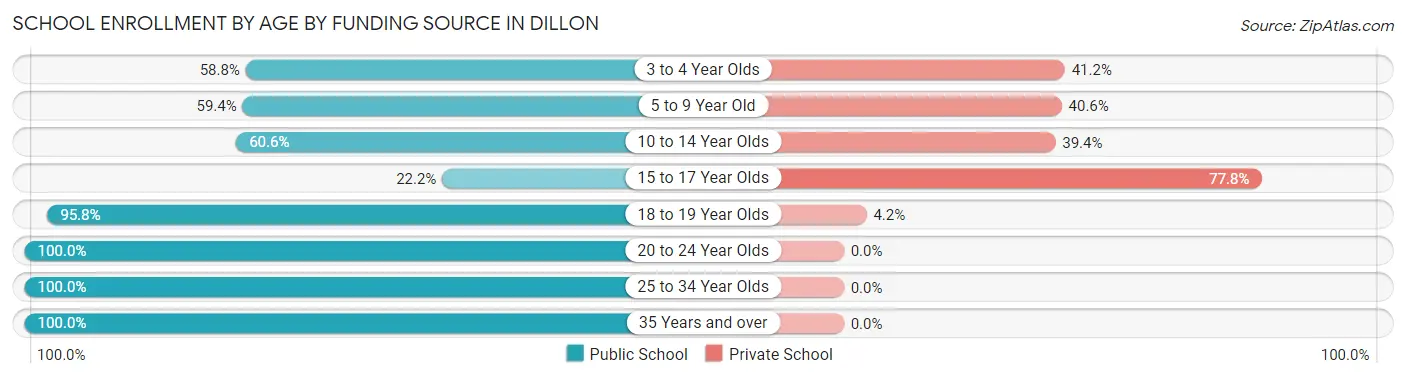
| Age Bracket | Public School | Private School |
| 3 to 4 Year Olds | 30 (58.8%) | 21 (41.2%) |
| 5 to 9 Year Old | 120 (59.4%) | 82 (40.6%) |
| 10 to 14 Year Olds | 63 (60.6%) | 41 (39.4%) |
| 15 to 17 Year Olds | 30 (22.2%) | 105 (77.8%) |
| 18 to 19 Year Olds | 226 (95.8%) | 10 (4.2%) |
| 20 to 24 Year Olds | 544 (100.0%) | 0 (0.0%) |
| 25 to 34 Year Olds | 84 (100.0%) | 0 (0.0%) |
| 35 Years and over | 8 (100.0%) | 0 (0.0%) |
| Total | 1,105 (81.0%) | 259 (19.0%) |
Educational Attainment by Field of Study in Dillon
Education (170 | 19.8%), business (123 | 14.3%), bio, nature & agricultural (110 | 12.8%), literature & languages (110 | 12.8%), and science & technology (91 | 10.6%) are the most common fields of study among 860 individuals in Dillon who have obtained a bachelor's degree or higher.
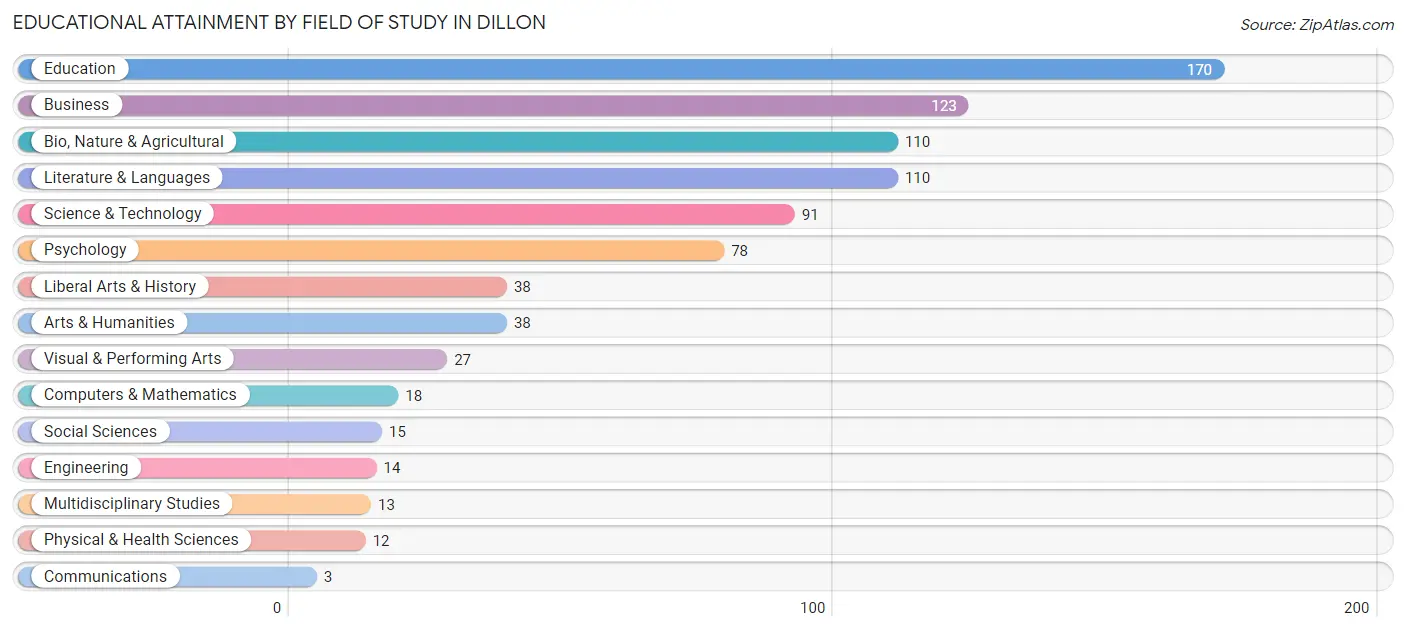
| Field of Study | # Graduates | % Graduates |
| Computers & Mathematics | 18 | 2.1% |
| Bio, Nature & Agricultural | 110 | 12.8% |
| Physical & Health Sciences | 12 | 1.4% |
| Psychology | 78 | 9.1% |
| Social Sciences | 15 | 1.7% |
| Engineering | 14 | 1.6% |
| Multidisciplinary Studies | 13 | 1.5% |
| Science & Technology | 91 | 10.6% |
| Business | 123 | 14.3% |
| Education | 170 | 19.8% |
| Literature & Languages | 110 | 12.8% |
| Liberal Arts & History | 38 | 4.4% |
| Visual & Performing Arts | 27 | 3.1% |
| Communications | 3 | 0.4% |
| Arts & Humanities | 38 | 4.4% |
| Total | 860 | 100.0% |
Transportation & Commute in Dillon
Vehicle Availability by Sex in Dillon
The most prevalent vehicle ownership categories in Dillon are males with 2 vehicles (392, accounting for 47.2%) and females with 2 vehicles (382, making up 42.6%).
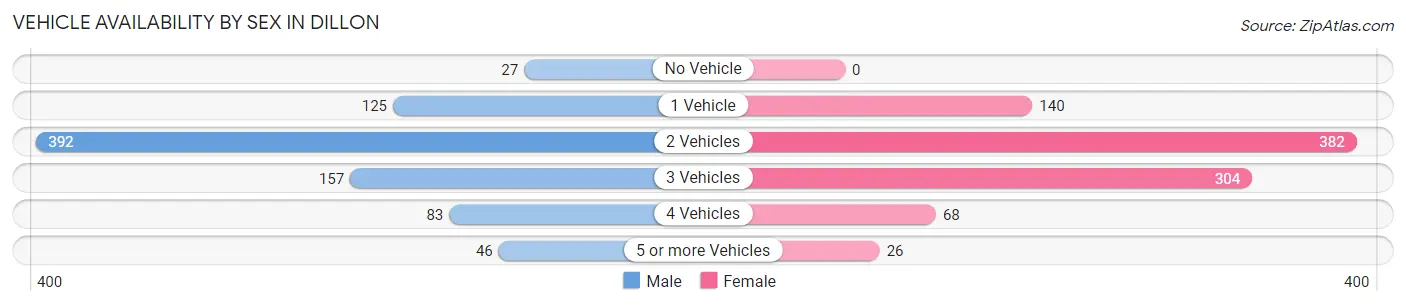
| Vehicles Available | Male | Female |
| No Vehicle | 27 (3.3%) | 0 (0.0%) |
| 1 Vehicle | 125 (15.1%) | 140 (15.2%) |
| 2 Vehicles | 392 (47.2%) | 382 (41.5%) |
| 3 Vehicles | 157 (18.9%) | 304 (33.0%) |
| 4 Vehicles | 83 (10.0%) | 68 (7.4%) |
| 5 or more Vehicles | 46 (5.5%) | 26 (2.8%) |
| Total | 830 (100.0%) | 920 (100.0%) |
Commute Time in Dillon
The most frequently occuring commute durations in Dillon are less than 5 minutes (490 commuters, 27.3%), 5 to 9 minutes (490 commuters, 27.3%), and 10 to 14 minutes (359 commuters, 20.0%).
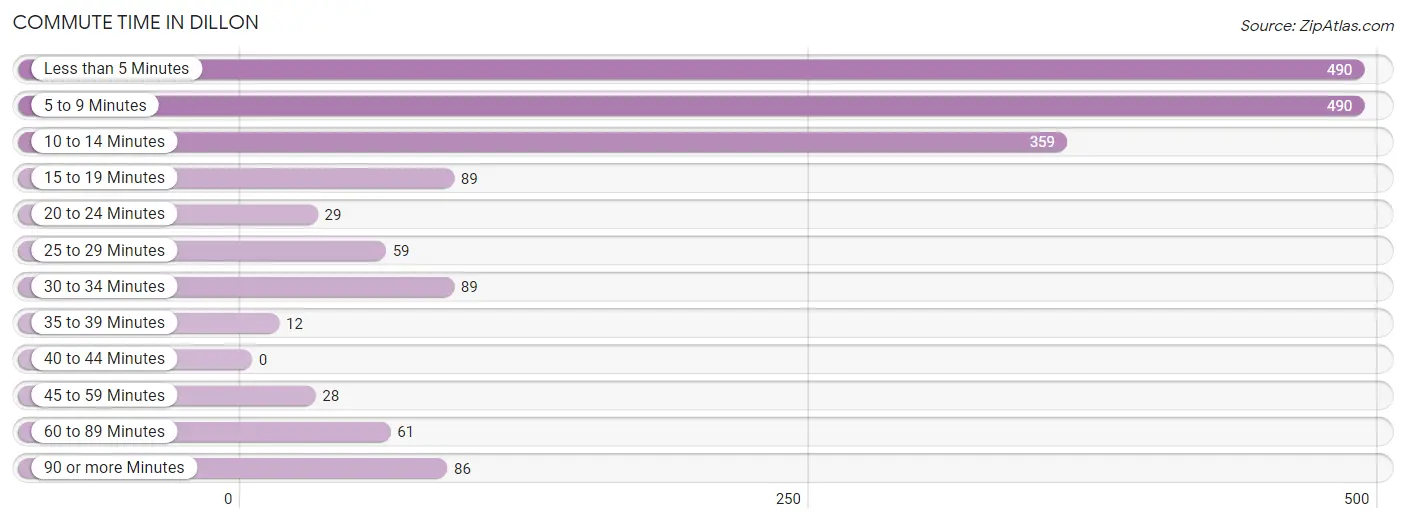
| Commute Time | # Commuters | % Commuters |
| Less than 5 Minutes | 490 | 27.3% |
| 5 to 9 Minutes | 490 | 27.3% |
| 10 to 14 Minutes | 359 | 20.0% |
| 15 to 19 Minutes | 89 | 5.0% |
| 20 to 24 Minutes | 29 | 1.6% |
| 25 to 29 Minutes | 59 | 3.3% |
| 30 to 34 Minutes | 89 | 5.0% |
| 35 to 39 Minutes | 12 | 0.7% |
| 40 to 44 Minutes | 0 | 0.0% |
| 45 to 59 Minutes | 28 | 1.6% |
| 60 to 89 Minutes | 61 | 3.4% |
| 90 or more Minutes | 86 | 4.8% |
Commute Time by Sex in Dillon
The most common commute times in Dillon are 10 to 14 minutes (241 commuters, 28.2%) for males and 5 to 9 minutes (311 commuters, 33.2%) for females.
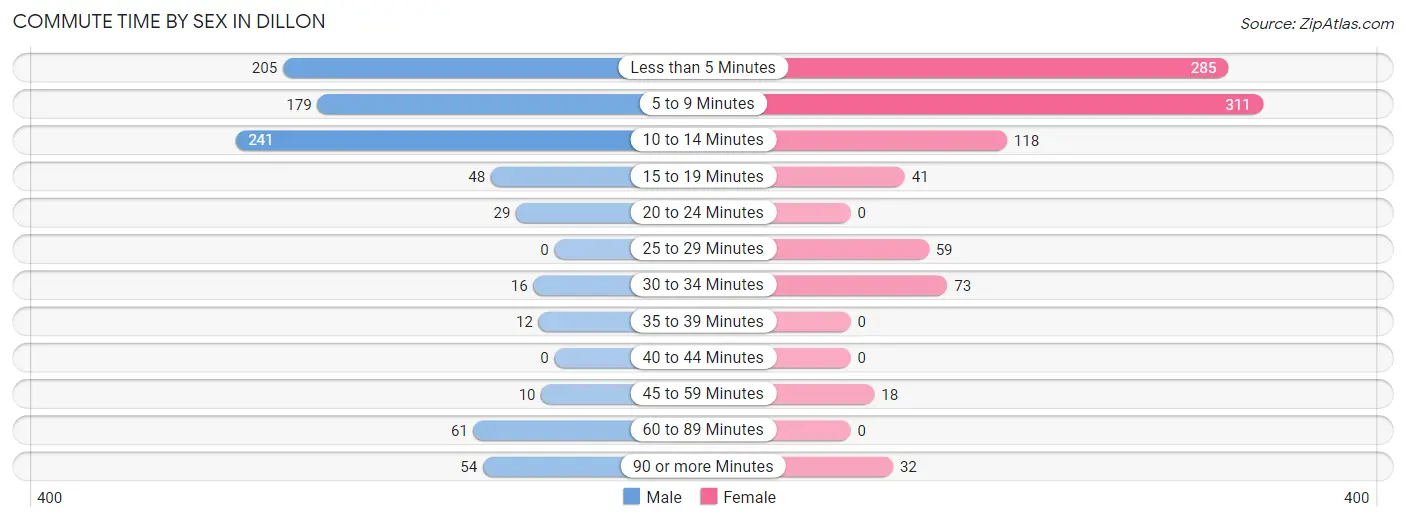
| Commute Time | Male | Female |
| Less than 5 Minutes | 205 (24.0%) | 285 (30.4%) |
| 5 to 9 Minutes | 179 (20.9%) | 311 (33.2%) |
| 10 to 14 Minutes | 241 (28.2%) | 118 (12.6%) |
| 15 to 19 Minutes | 48 (5.6%) | 41 (4.4%) |
| 20 to 24 Minutes | 29 (3.4%) | 0 (0.0%) |
| 25 to 29 Minutes | 0 (0.0%) | 59 (6.3%) |
| 30 to 34 Minutes | 16 (1.9%) | 73 (7.8%) |
| 35 to 39 Minutes | 12 (1.4%) | 0 (0.0%) |
| 40 to 44 Minutes | 0 (0.0%) | 0 (0.0%) |
| 45 to 59 Minutes | 10 (1.2%) | 18 (1.9%) |
| 60 to 89 Minutes | 61 (7.1%) | 0 (0.0%) |
| 90 or more Minutes | 54 (6.3%) | 32 (3.4%) |
Time of Departure to Work by Sex in Dillon
The most frequent times of departure to work in Dillon are 4:00 PM to 11:59 PM (186, 21.7%) for males and 7:00 AM to 7:29 AM (158, 16.9%) for females.
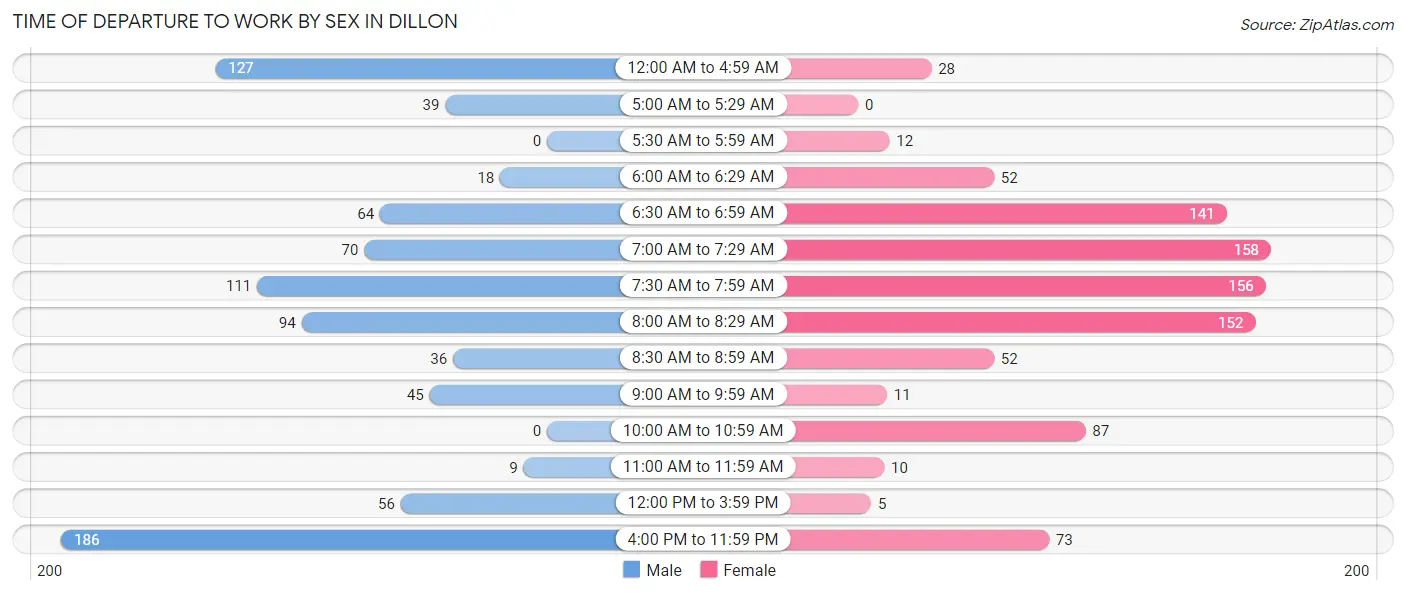
| Time of Departure | Male | Female |
| 12:00 AM to 4:59 AM | 127 (14.8%) | 28 (3.0%) |
| 5:00 AM to 5:29 AM | 39 (4.6%) | 0 (0.0%) |
| 5:30 AM to 5:59 AM | 0 (0.0%) | 12 (1.3%) |
| 6:00 AM to 6:29 AM | 18 (2.1%) | 52 (5.6%) |
| 6:30 AM to 6:59 AM | 64 (7.5%) | 141 (15.0%) |
| 7:00 AM to 7:29 AM | 70 (8.2%) | 158 (16.9%) |
| 7:30 AM to 7:59 AM | 111 (13.0%) | 156 (16.7%) |
| 8:00 AM to 8:29 AM | 94 (11.0%) | 152 (16.2%) |
| 8:30 AM to 8:59 AM | 36 (4.2%) | 52 (5.6%) |
| 9:00 AM to 9:59 AM | 45 (5.3%) | 11 (1.2%) |
| 10:00 AM to 10:59 AM | 0 (0.0%) | 87 (9.3%) |
| 11:00 AM to 11:59 AM | 9 (1.1%) | 10 (1.1%) |
| 12:00 PM to 3:59 PM | 56 (6.6%) | 5 (0.5%) |
| 4:00 PM to 11:59 PM | 186 (21.7%) | 73 (7.8%) |
| Total | 855 (100.0%) | 937 (100.0%) |
Housing Occupancy in Dillon
Occupancy by Ownership in Dillon
Of the total 1,626 dwellings in Dillon, owner-occupied units account for 816 (50.2%), while renter-occupied units make up 810 (49.8%).
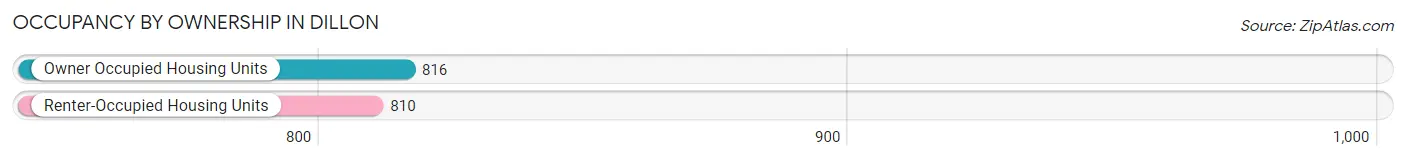
| Occupancy | # Housing Units | % Housing Units |
| Owner Occupied Housing Units | 816 | 50.2% |
| Renter-Occupied Housing Units | 810 | 49.8% |
| Total Occupied Housing Units | 1,626 | 100.0% |
Occupancy by Household Size in Dillon
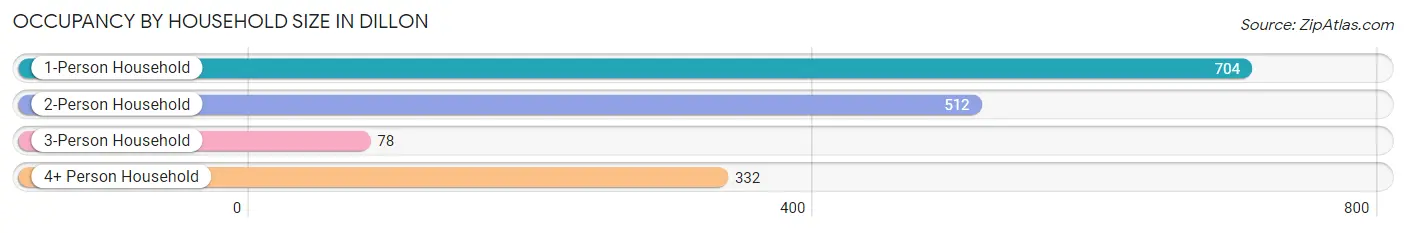
| Household Size | # Housing Units | % Housing Units |
| 1-Person Household | 704 | 43.3% |
| 2-Person Household | 512 | 31.5% |
| 3-Person Household | 78 | 4.8% |
| 4+ Person Household | 332 | 20.4% |
| Total Housing Units | 1,626 | 100.0% |
Occupancy by Ownership by Household Size in Dillon
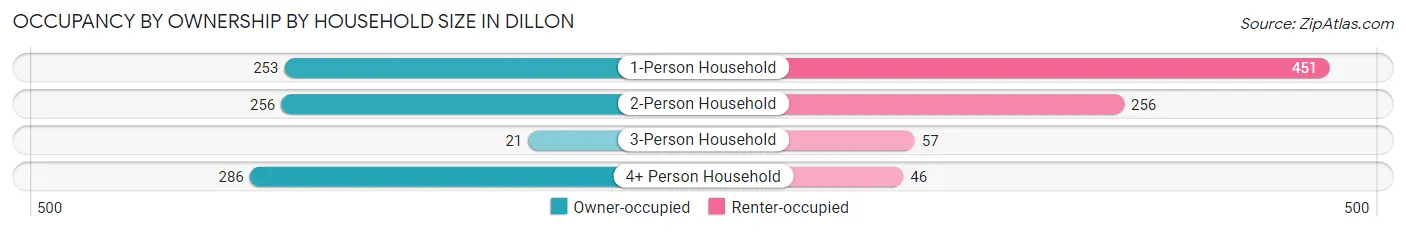
| Household Size | Owner-occupied | Renter-occupied |
| 1-Person Household | 253 (35.9%) | 451 (64.1%) |
| 2-Person Household | 256 (50.0%) | 256 (50.0%) |
| 3-Person Household | 21 (26.9%) | 57 (73.1%) |
| 4+ Person Household | 286 (86.1%) | 46 (13.9%) |
| Total Housing Units | 816 (50.2%) | 810 (49.8%) |
Occupancy by Educational Attainment in Dillon
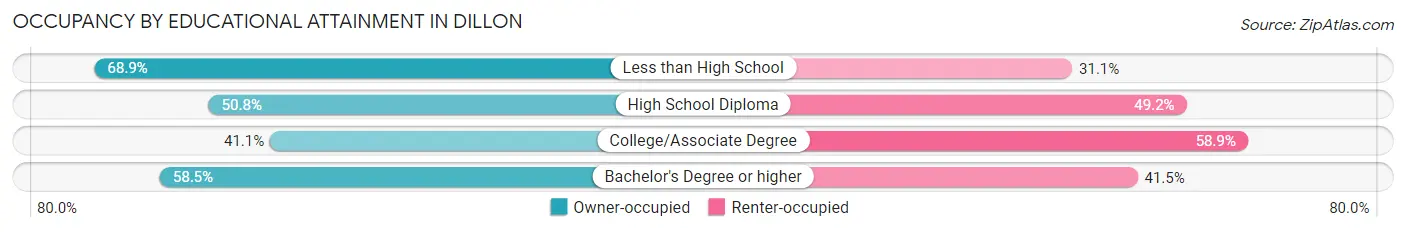
| Household Size | Owner-occupied | Renter-occupied |
| Less than High School | 51 (68.9%) | 23 (31.1%) |
| High School Diploma | 127 (50.8%) | 123 (49.2%) |
| College/Associate Degree | 292 (41.1%) | 419 (58.9%) |
| Bachelor's Degree or higher | 346 (58.5%) | 245 (41.5%) |
Occupancy by Age of Householder in Dillon
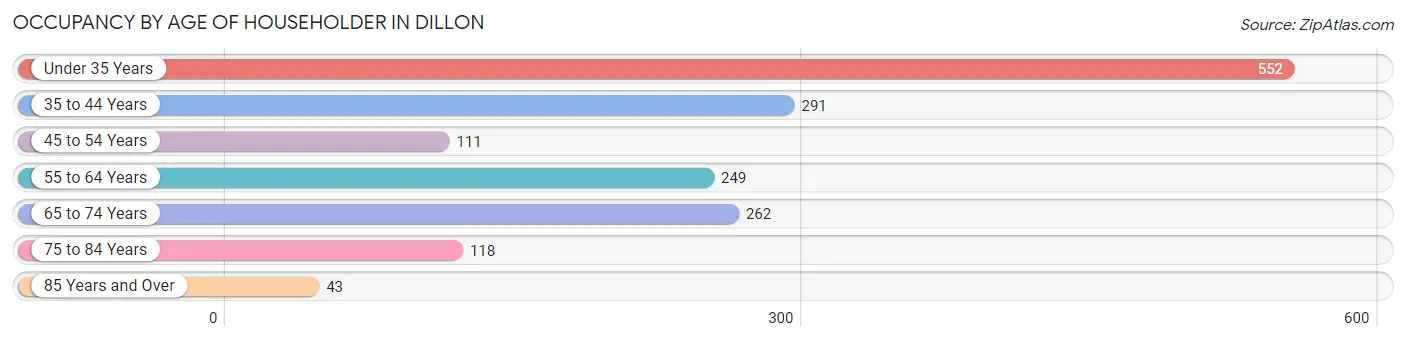
| Age Bracket | # Households | % Households |
| Under 35 Years | 552 | 34.0% |
| 35 to 44 Years | 291 | 17.9% |
| 45 to 54 Years | 111 | 6.8% |
| 55 to 64 Years | 249 | 15.3% |
| 65 to 74 Years | 262 | 16.1% |
| 75 to 84 Years | 118 | 7.3% |
| 85 Years and Over | 43 | 2.6% |
| Total | 1,626 | 100.0% |
Housing Finances in Dillon
Median Income by Occupancy in Dillon
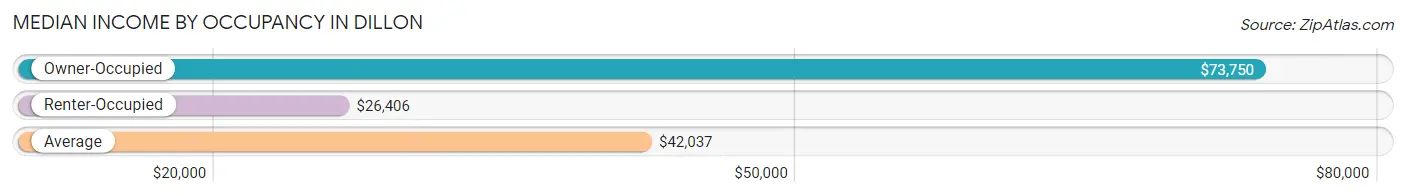
| Occupancy Type | # Households | Median Income |
| Owner-Occupied | 816 (50.2%) | $73,750 |
| Renter-Occupied | 810 (49.8%) | $26,406 |
| Average | 1,626 (100.0%) | $42,037 |
Occupancy by Householder Income Bracket in Dillon
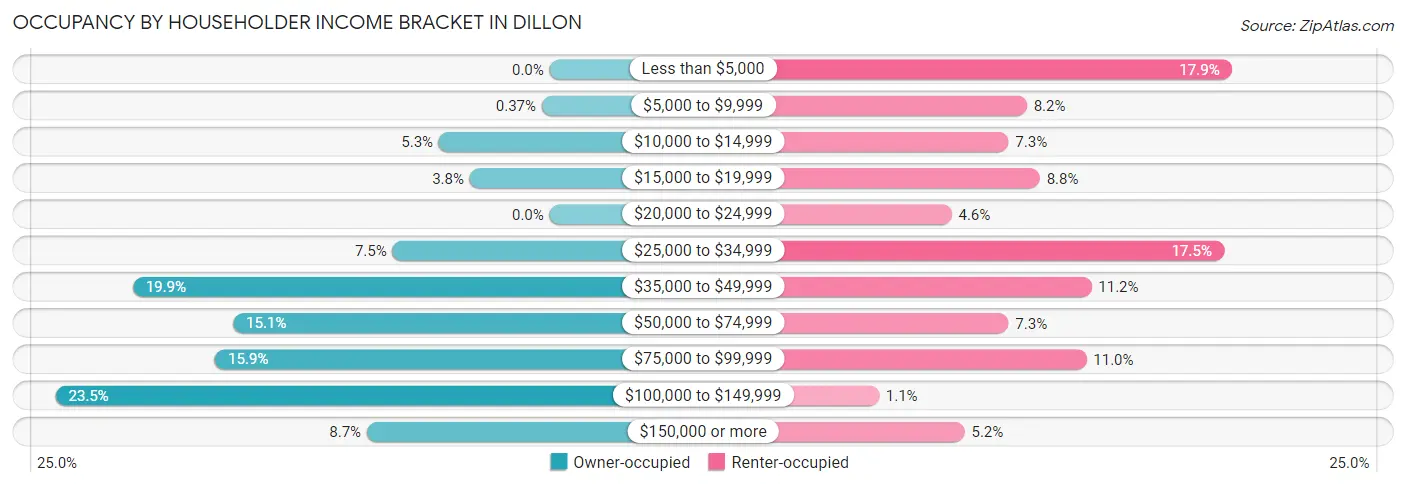
| Income Bracket | Owner-occupied | Renter-occupied |
| Less than $5,000 | 0 (0.0%) | 145 (17.9%) |
| $5,000 to $9,999 | 3 (0.4%) | 66 (8.2%) |
| $10,000 to $14,999 | 43 (5.3%) | 59 (7.3%) |
| $15,000 to $19,999 | 31 (3.8%) | 71 (8.8%) |
| $20,000 to $24,999 | 0 (0.0%) | 37 (4.6%) |
| $25,000 to $34,999 | 61 (7.5%) | 142 (17.5%) |
| $35,000 to $49,999 | 162 (19.9%) | 91 (11.2%) |
| $50,000 to $74,999 | 123 (15.1%) | 59 (7.3%) |
| $75,000 to $99,999 | 130 (15.9%) | 89 (11.0%) |
| $100,000 to $149,999 | 192 (23.5%) | 9 (1.1%) |
| $150,000 or more | 71 (8.7%) | 42 (5.2%) |
| Total | 816 (100.0%) | 810 (100.0%) |
Monthly Housing Cost Tiers in Dillon
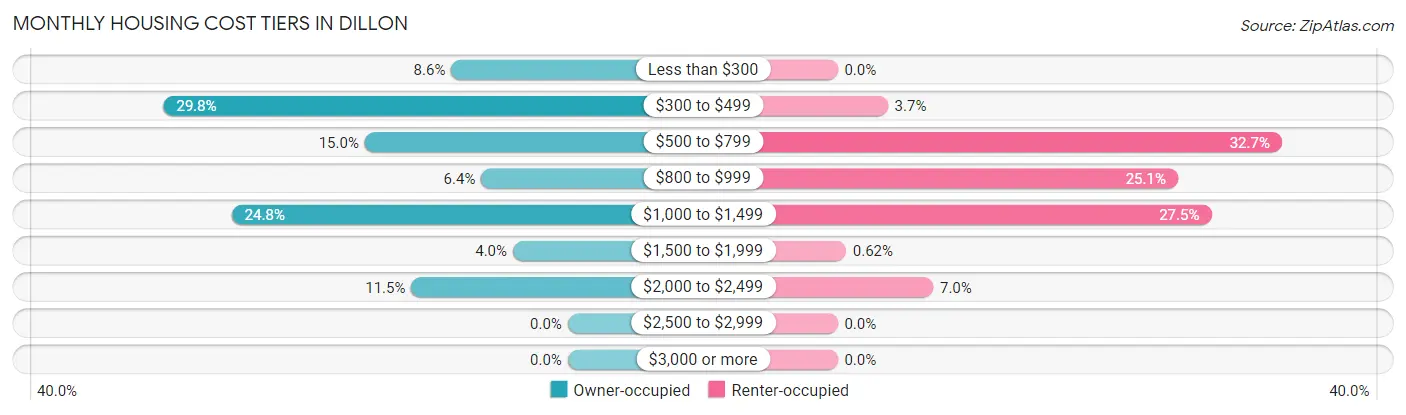
| Monthly Cost | Owner-occupied | Renter-occupied |
| Less than $300 | 70 (8.6%) | 0 (0.0%) |
| $300 to $499 | 243 (29.8%) | 30 (3.7%) |
| $500 to $799 | 122 (14.9%) | 265 (32.7%) |
| $800 to $999 | 52 (6.4%) | 203 (25.1%) |
| $1,000 to $1,499 | 202 (24.7%) | 223 (27.5%) |
| $1,500 to $1,999 | 33 (4.0%) | 5 (0.6%) |
| $2,000 to $2,499 | 94 (11.5%) | 57 (7.0%) |
| $2,500 to $2,999 | 0 (0.0%) | 0 (0.0%) |
| $3,000 or more | 0 (0.0%) | 0 (0.0%) |
| Total | 816 (100.0%) | 810 (100.0%) |
Physical Housing Characteristics in Dillon
Housing Structures in Dillon
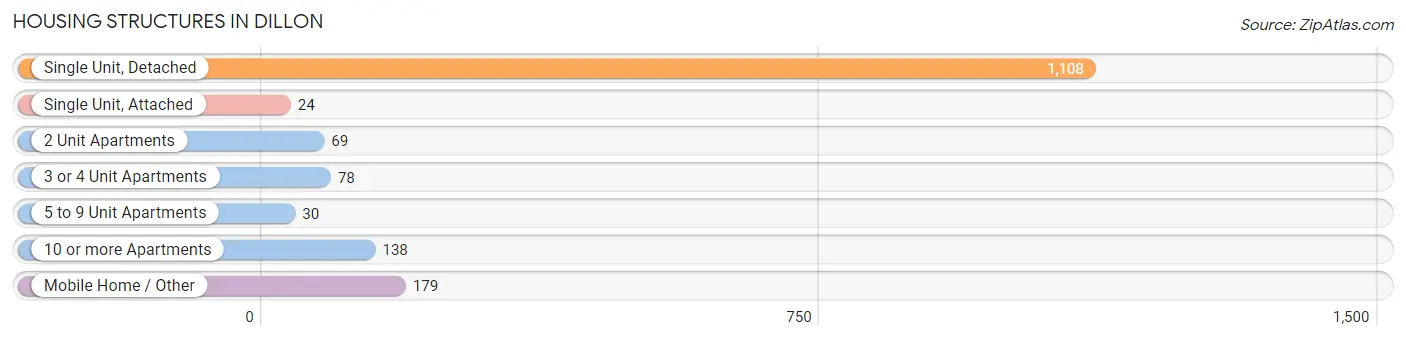
| Structure Type | # Housing Units | % Housing Units |
| Single Unit, Detached | 1,108 | 68.1% |
| Single Unit, Attached | 24 | 1.5% |
| 2 Unit Apartments | 69 | 4.2% |
| 3 or 4 Unit Apartments | 78 | 4.8% |
| 5 to 9 Unit Apartments | 30 | 1.8% |
| 10 or more Apartments | 138 | 8.5% |
| Mobile Home / Other | 179 | 11.0% |
| Total | 1,626 | 100.0% |
Housing Structures by Occupancy in Dillon
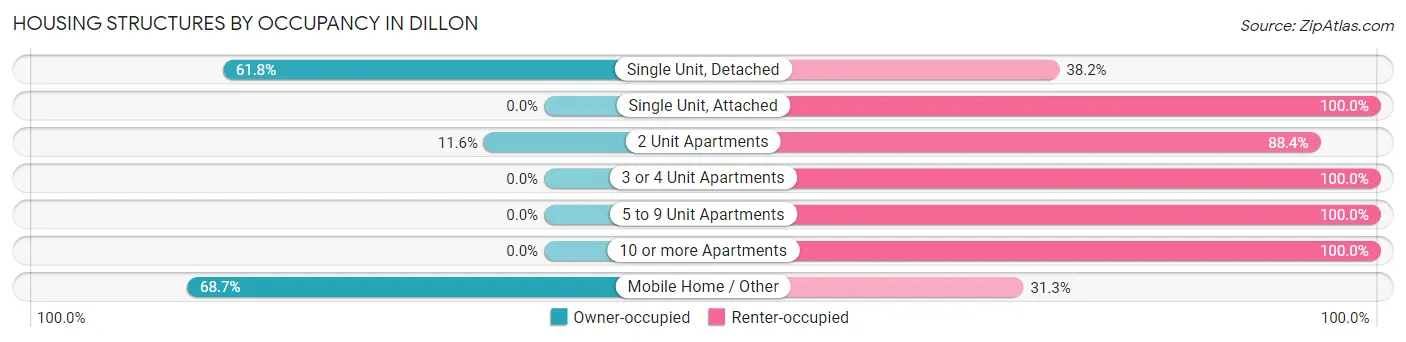
| Structure Type | Owner-occupied | Renter-occupied |
| Single Unit, Detached | 685 (61.8%) | 423 (38.2%) |
| Single Unit, Attached | 0 (0.0%) | 24 (100.0%) |
| 2 Unit Apartments | 8 (11.6%) | 61 (88.4%) |
| 3 or 4 Unit Apartments | 0 (0.0%) | 78 (100.0%) |
| 5 to 9 Unit Apartments | 0 (0.0%) | 30 (100.0%) |
| 10 or more Apartments | 0 (0.0%) | 138 (100.0%) |
| Mobile Home / Other | 123 (68.7%) | 56 (31.3%) |
| Total | 816 (50.2%) | 810 (49.8%) |
Housing Structures by Number of Rooms in Dillon
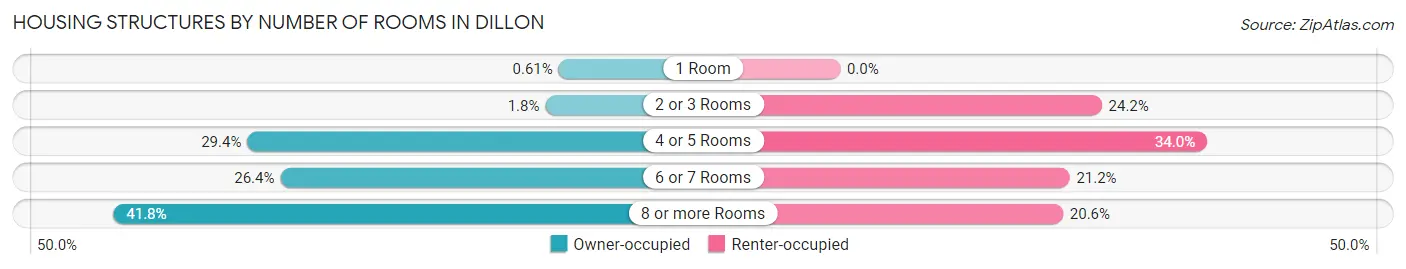
| Number of Rooms | Owner-occupied | Renter-occupied |
| 1 Room | 5 (0.6%) | 0 (0.0%) |
| 2 or 3 Rooms | 15 (1.8%) | 196 (24.2%) |
| 4 or 5 Rooms | 240 (29.4%) | 275 (34.0%) |
| 6 or 7 Rooms | 215 (26.4%) | 172 (21.2%) |
| 8 or more Rooms | 341 (41.8%) | 167 (20.6%) |
| Total | 816 (100.0%) | 810 (100.0%) |
Housing Structure by Heating Type in Dillon
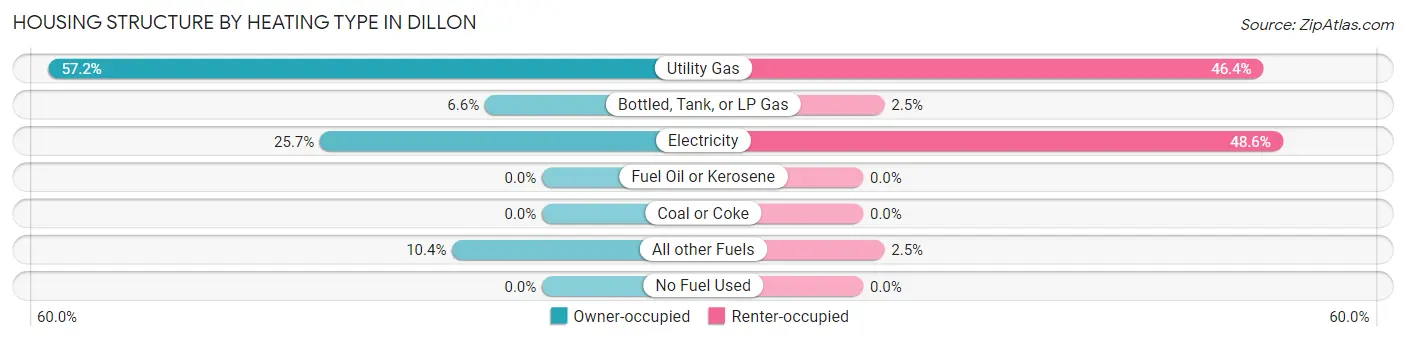
| Heating Type | Owner-occupied | Renter-occupied |
| Utility Gas | 467 (57.2%) | 376 (46.4%) |
| Bottled, Tank, or LP Gas | 54 (6.6%) | 20 (2.5%) |
| Electricity | 210 (25.7%) | 394 (48.6%) |
| Fuel Oil or Kerosene | 0 (0.0%) | 0 (0.0%) |
| Coal or Coke | 0 (0.0%) | 0 (0.0%) |
| All other Fuels | 85 (10.4%) | 20 (2.5%) |
| No Fuel Used | 0 (0.0%) | 0 (0.0%) |
| Total | 816 (100.0%) | 810 (100.0%) |
Household Vehicle Usage in Dillon
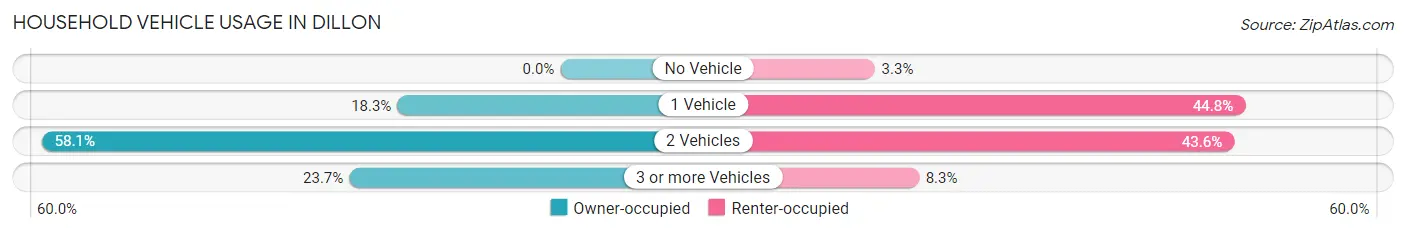
| Vehicles per Household | Owner-occupied | Renter-occupied |
| No Vehicle | 0 (0.0%) | 27 (3.3%) |
| 1 Vehicle | 149 (18.3%) | 363 (44.8%) |
| 2 Vehicles | 474 (58.1%) | 353 (43.6%) |
| 3 or more Vehicles | 193 (23.6%) | 67 (8.3%) |
| Total | 816 (100.0%) | 810 (100.0%) |
Real Estate & Mortgages in Dillon
Real Estate and Mortgage Overview in Dillon
| Characteristic | Without Mortgage | With Mortgage |
| Housing Units | 425 | 391 |
| Median Property Value | $178,100 | $236,500 |
| Median Household Income | $44,563 | $67 |
| Monthly Housing Costs | $470 | $0 |
| Real Estate Taxes | $1,988 | $0 |
Property Value by Mortgage Status in Dillon
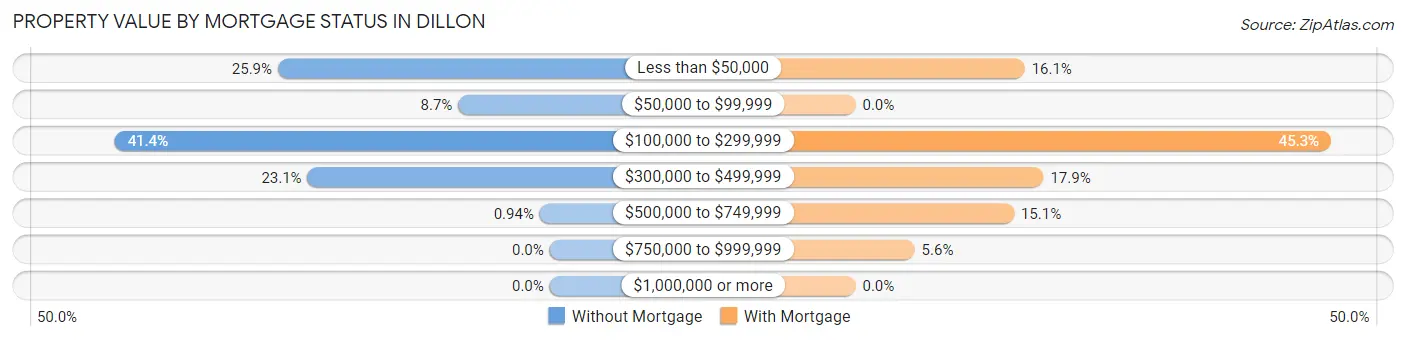
| Property Value | Without Mortgage | With Mortgage |
| Less than $50,000 | 110 (25.9%) | 63 (16.1%) |
| $50,000 to $99,999 | 37 (8.7%) | 0 (0.0%) |
| $100,000 to $299,999 | 176 (41.4%) | 177 (45.3%) |
| $300,000 to $499,999 | 98 (23.1%) | 70 (17.9%) |
| $500,000 to $749,999 | 4 (0.9%) | 59 (15.1%) |
| $750,000 to $999,999 | 0 (0.0%) | 22 (5.6%) |
| $1,000,000 or more | 0 (0.0%) | 0 (0.0%) |
| Total | 425 (100.0%) | 391 (100.0%) |
Household Income by Mortgage Status in Dillon
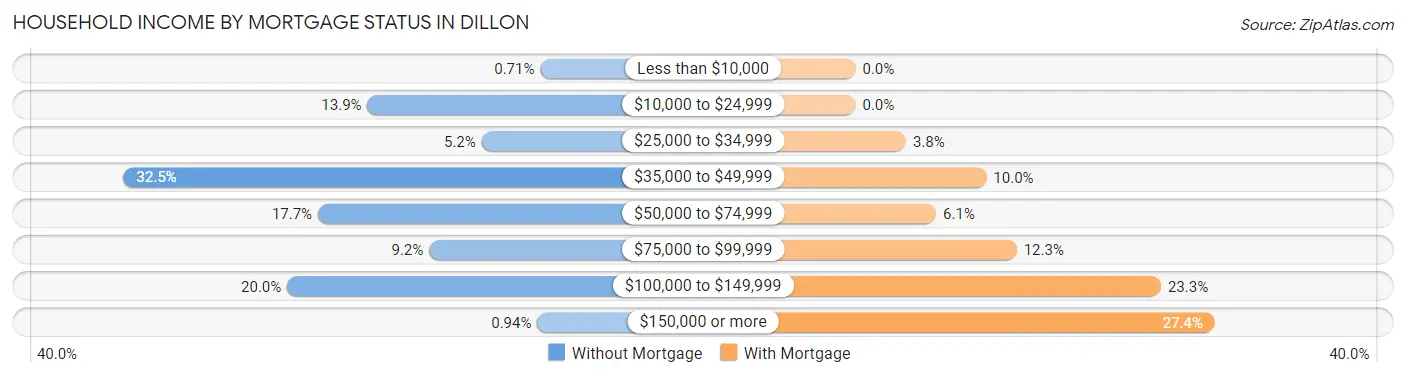
| Household Income | Without Mortgage | With Mortgage |
| Less than $10,000 | 3 (0.7%) | 0 (0.0%) |
| $10,000 to $24,999 | 59 (13.9%) | 0 (0.0%) |
| $25,000 to $34,999 | 22 (5.2%) | 15 (3.8%) |
| $35,000 to $49,999 | 138 (32.5%) | 39 (10.0%) |
| $50,000 to $74,999 | 75 (17.6%) | 24 (6.1%) |
| $75,000 to $99,999 | 39 (9.2%) | 48 (12.3%) |
| $100,000 to $149,999 | 85 (20.0%) | 91 (23.3%) |
| $150,000 or more | 4 (0.9%) | 107 (27.4%) |
| Total | 425 (100.0%) | 391 (100.0%) |
Property Value to Household Income Ratio in Dillon
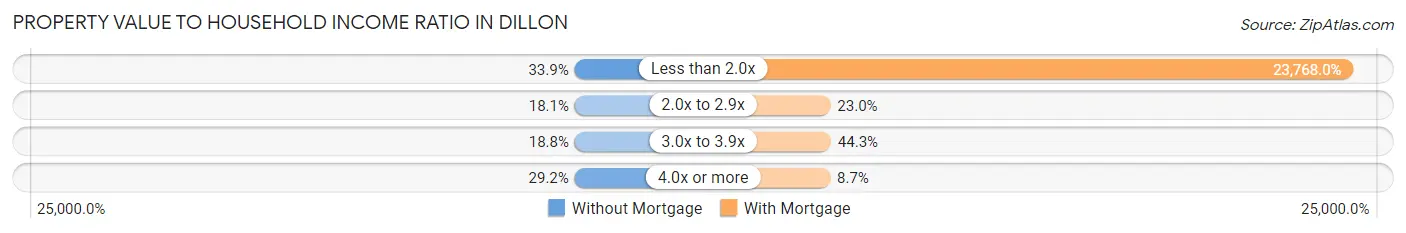
| Value-to-Income Ratio | Without Mortgage | With Mortgage |
| Less than 2.0x | 144 (33.9%) | 92,933 (23,768.0%) |
| 2.0x to 2.9x | 77 (18.1%) | 90 (23.0%) |
| 3.0x to 3.9x | 80 (18.8%) | 173 (44.3%) |
| 4.0x or more | 124 (29.2%) | 34 (8.7%) |
| Total | 425 (100.0%) | 391 (100.0%) |
Real Estate Taxes by Mortgage Status in Dillon
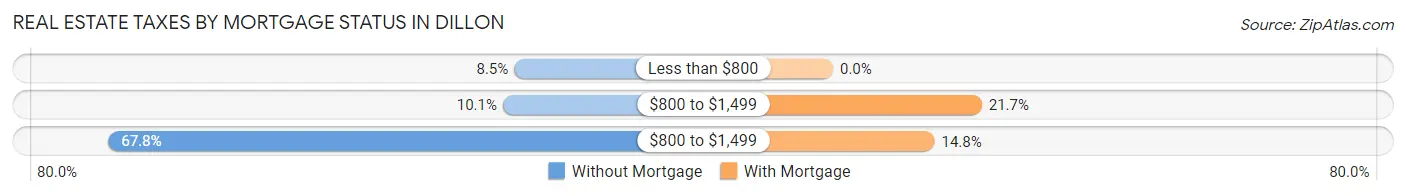
| Property Taxes | Without Mortgage | With Mortgage |
| Less than $800 | 36 (8.5%) | 0 (0.0%) |
| $800 to $1,499 | 43 (10.1%) | 85 (21.7%) |
| $800 to $1,499 | 288 (67.8%) | 58 (14.8%) |
| Total | 425 (100.0%) | 391 (100.0%) |
Health & Disability in Dillon
Health Insurance Coverage by Age in Dillon
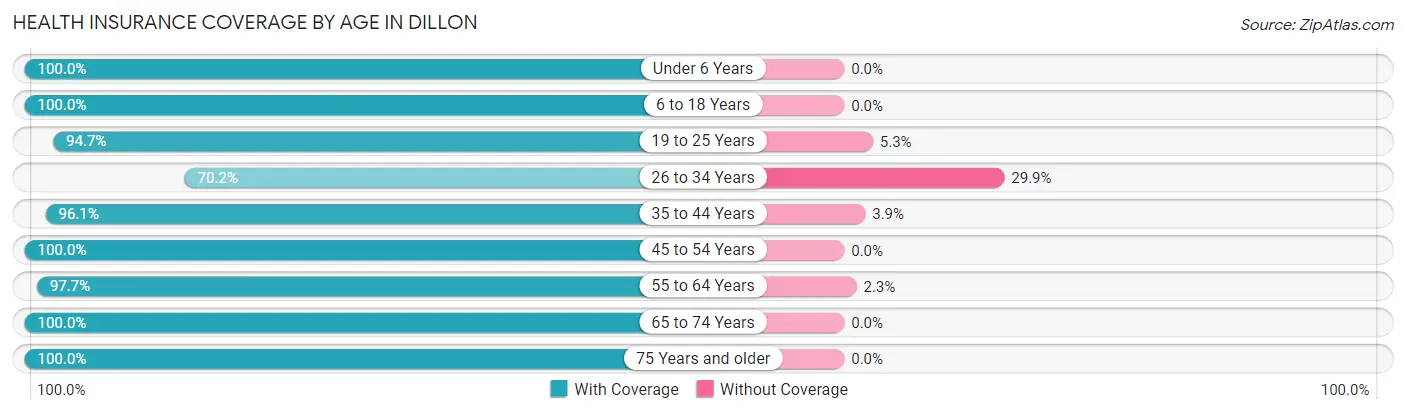
| Age Bracket | With Coverage | Without Coverage |
| Under 6 Years | 156 (100.0%) | 0 (0.0%) |
| 6 to 18 Years | 546 (100.0%) | 0 (0.0%) |
| 19 to 25 Years | 871 (94.7%) | 49 (5.3%) |
| 26 to 34 Years | 322 (70.2%) | 137 (29.8%) |
| 35 to 44 Years | 369 (96.1%) | 15 (3.9%) |
| 45 to 54 Years | 191 (100.0%) | 0 (0.0%) |
| 55 to 64 Years | 429 (97.7%) | 10 (2.3%) |
| 65 to 74 Years | 392 (100.0%) | 0 (0.0%) |
| 75 Years and older | 285 (100.0%) | 0 (0.0%) |
| Total | 3,561 (94.4%) | 211 (5.6%) |
Health Insurance Coverage by Citizenship Status in Dillon
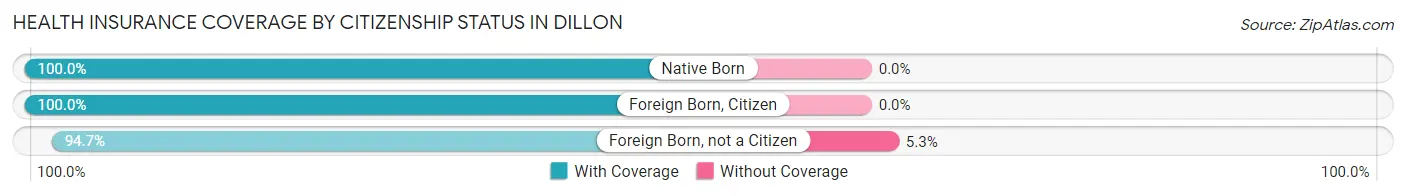
| Citizenship Status | With Coverage | Without Coverage |
| Native Born | 156 (100.0%) | 0 (0.0%) |
| Foreign Born, Citizen | 546 (100.0%) | 0 (0.0%) |
| Foreign Born, not a Citizen | 871 (94.7%) | 49 (5.3%) |
Health Insurance Coverage by Household Income in Dillon
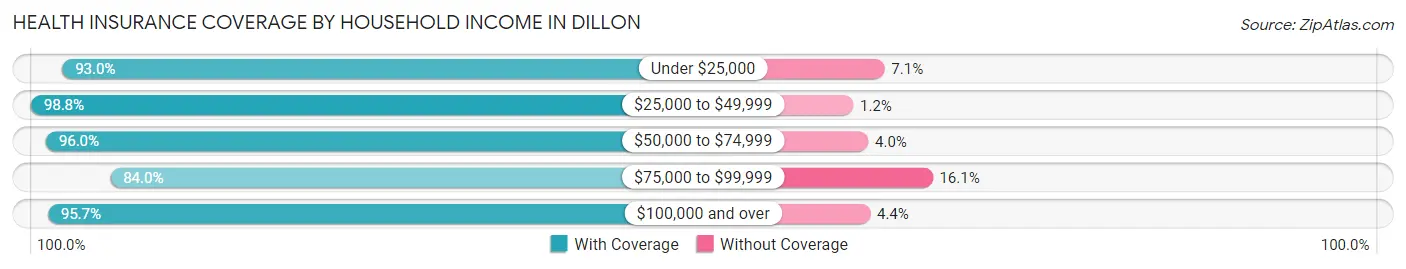
| Household Income | With Coverage | Without Coverage |
| Under $25,000 | 646 (92.9%) | 49 (7.0%) |
| $25,000 to $49,999 | 838 (98.8%) | 10 (1.2%) |
| $50,000 to $74,999 | 409 (96.0%) | 17 (4.0%) |
| $75,000 to $99,999 | 497 (84.0%) | 95 (16.1%) |
| $100,000 and over | 879 (95.7%) | 40 (4.3%) |
Public vs Private Health Insurance Coverage by Age in Dillon
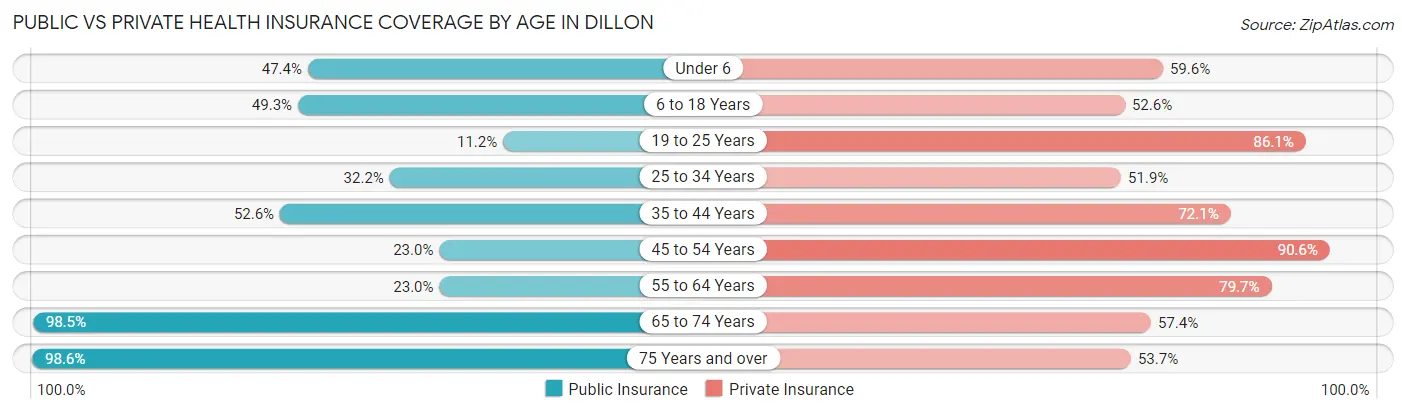
| Age Bracket | Public Insurance | Private Insurance |
| Under 6 | 74 (47.4%) | 93 (59.6%) |
| 6 to 18 Years | 269 (49.3%) | 287 (52.6%) |
| 19 to 25 Years | 103 (11.2%) | 792 (86.1%) |
| 25 to 34 Years | 148 (32.2%) | 238 (51.8%) |
| 35 to 44 Years | 202 (52.6%) | 277 (72.1%) |
| 45 to 54 Years | 44 (23.0%) | 173 (90.6%) |
| 55 to 64 Years | 101 (23.0%) | 350 (79.7%) |
| 65 to 74 Years | 386 (98.5%) | 225 (57.4%) |
| 75 Years and over | 281 (98.6%) | 153 (53.7%) |
| Total | 1,608 (42.6%) | 2,588 (68.6%) |
Disability Status by Sex by Age in Dillon
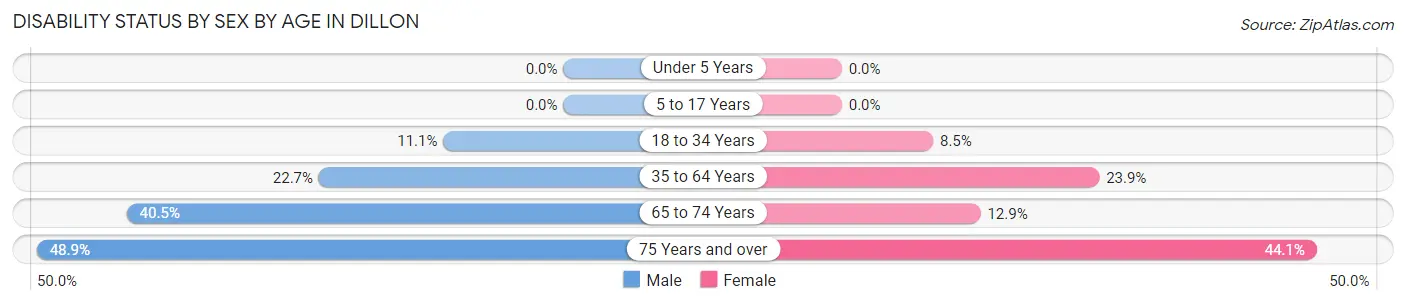
| Age Bracket | Male | Female |
| Under 5 Years | 0 (0.0%) | 0 (0.0%) |
| 5 to 17 Years | 0 (0.0%) | 0 (0.0%) |
| 18 to 34 Years | 86 (11.1%) | 60 (8.5%) |
| 35 to 64 Years | 118 (22.7%) | 118 (23.9%) |
| 65 to 74 Years | 77 (40.5%) | 26 (12.9%) |
| 75 Years and over | 65 (48.9%) | 67 (44.1%) |
Disability Class by Sex by Age in Dillon
Disability Class: Hearing Difficulty
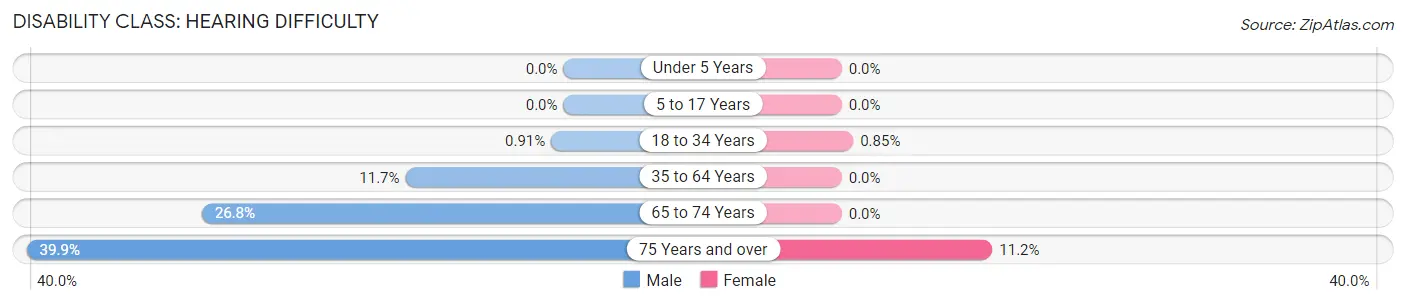
| Age Bracket | Male | Female |
| Under 5 Years | 0 (0.0%) | 0 (0.0%) |
| 5 to 17 Years | 0 (0.0%) | 0 (0.0%) |
| 18 to 34 Years | 7 (0.9%) | 6 (0.9%) |
| 35 to 64 Years | 61 (11.7%) | 0 (0.0%) |
| 65 to 74 Years | 51 (26.8%) | 0 (0.0%) |
| 75 Years and over | 53 (39.9%) | 17 (11.2%) |
Disability Class: Vision Difficulty
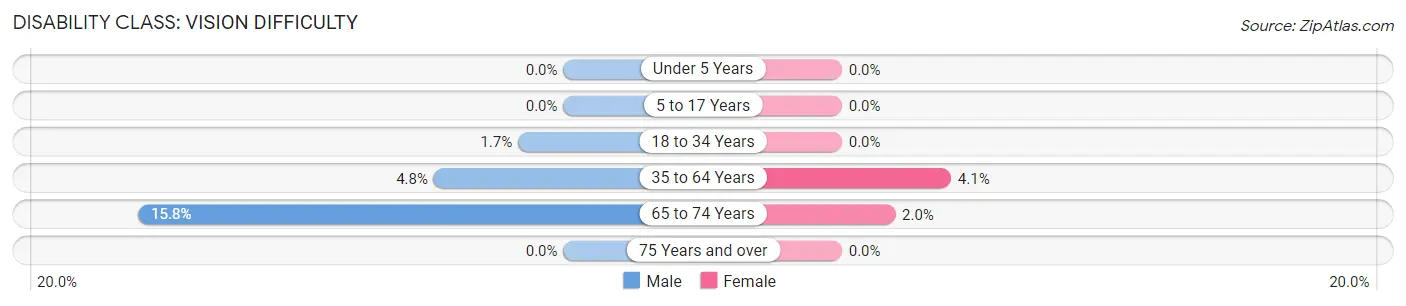
| Age Bracket | Male | Female |
| Under 5 Years | 0 (0.0%) | 0 (0.0%) |
| 5 to 17 Years | 0 (0.0%) | 0 (0.0%) |
| 18 to 34 Years | 13 (1.7%) | 0 (0.0%) |
| 35 to 64 Years | 25 (4.8%) | 20 (4.1%) |
| 65 to 74 Years | 30 (15.8%) | 4 (2.0%) |
| 75 Years and over | 0 (0.0%) | 0 (0.0%) |
Disability Class: Cognitive Difficulty
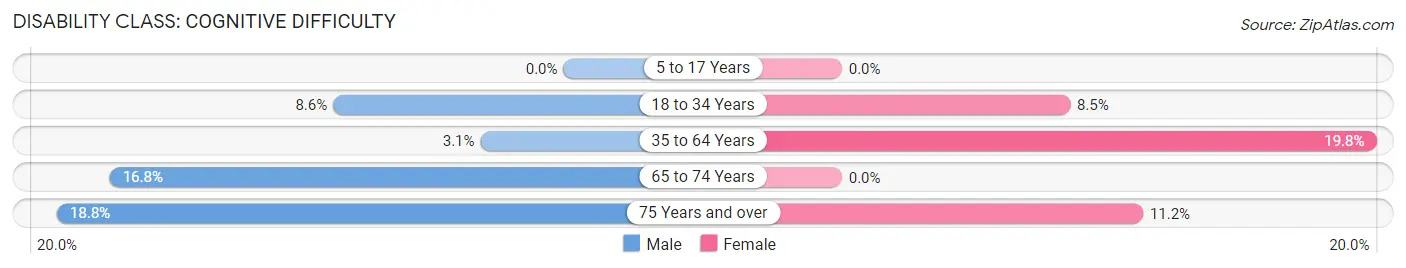
| Age Bracket | Male | Female |
| 5 to 17 Years | 0 (0.0%) | 0 (0.0%) |
| 18 to 34 Years | 66 (8.6%) | 60 (8.5%) |
| 35 to 64 Years | 16 (3.1%) | 98 (19.8%) |
| 65 to 74 Years | 32 (16.8%) | 0 (0.0%) |
| 75 Years and over | 25 (18.8%) | 17 (11.2%) |
Disability Class: Ambulatory Difficulty
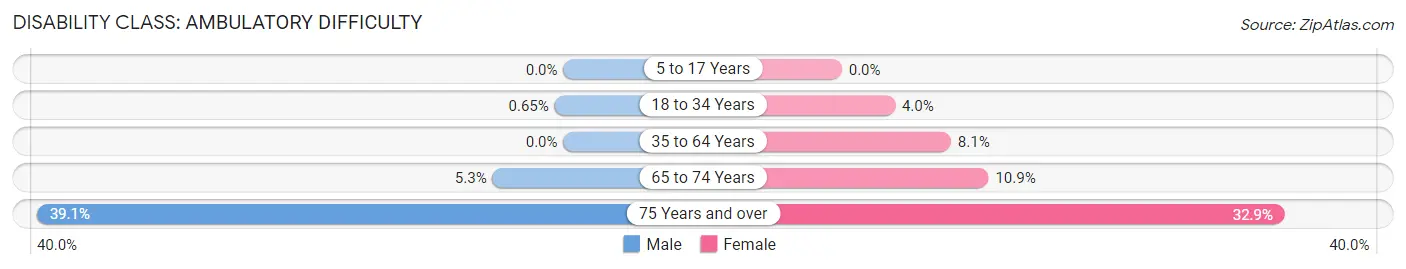
| Age Bracket | Male | Female |
| 5 to 17 Years | 0 (0.0%) | 0 (0.0%) |
| 18 to 34 Years | 5 (0.6%) | 28 (4.0%) |
| 35 to 64 Years | 0 (0.0%) | 40 (8.1%) |
| 65 to 74 Years | 10 (5.3%) | 22 (10.9%) |
| 75 Years and over | 52 (39.1%) | 50 (32.9%) |
Disability Class: Self-Care Difficulty
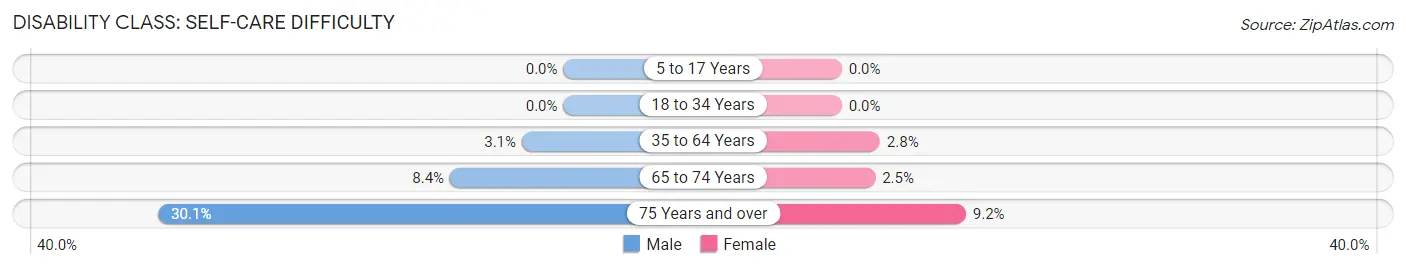
| Age Bracket | Male | Female |
| 5 to 17 Years | 0 (0.0%) | 0 (0.0%) |
| 18 to 34 Years | 0 (0.0%) | 0 (0.0%) |
| 35 to 64 Years | 16 (3.1%) | 14 (2.8%) |
| 65 to 74 Years | 16 (8.4%) | 5 (2.5%) |
| 75 Years and over | 40 (30.1%) | 14 (9.2%) |
Technology Access in Dillon
Computing Device Access in Dillon
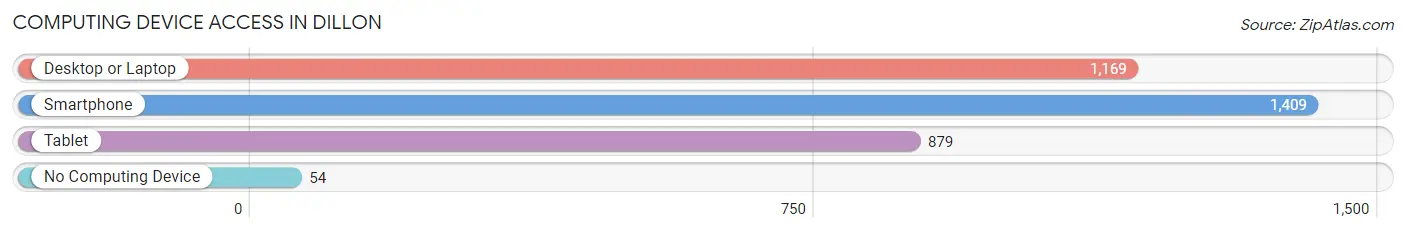
| Device Type | # Households | % Households |
| Desktop or Laptop | 1,169 | 71.9% |
| Smartphone | 1,409 | 86.7% |
| Tablet | 879 | 54.1% |
| No Computing Device | 54 | 3.3% |
| Total | 1,626 | 100.0% |
Internet Access in Dillon
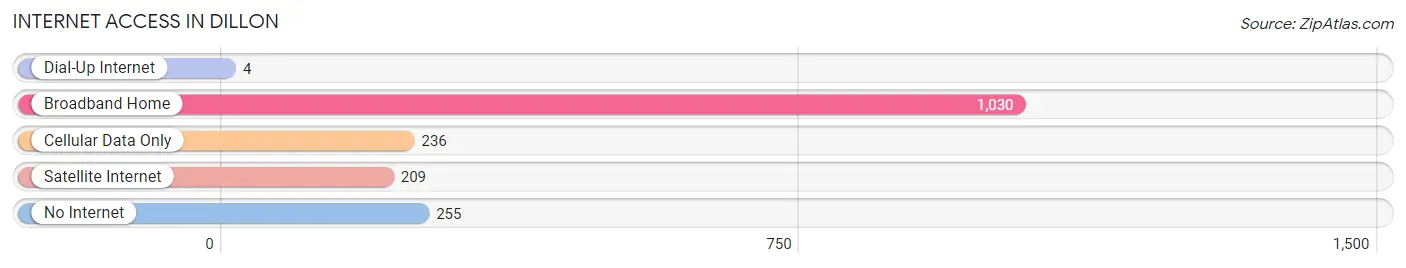
| Internet Type | # Households | % Households |
| Dial-Up Internet | 4 | 0.3% |
| Broadband Home | 1,030 | 63.3% |
| Cellular Data Only | 236 | 14.5% |
| Satellite Internet | 209 | 12.9% |
| No Internet | 255 | 15.7% |
| Total | 1,626 | 100.0% |
Dillon Summary
Dillon, Montana is a small city located in the southwestern part of the state, in Beaverhead County. It is the county seat and the largest city in the county, with a population of 4,134 as of the 2010 census. The city is situated in the Big Hole Valley, at the confluence of the Beaverhead and Red Rock Rivers. It is surrounded by the Beaverhead-Deerlodge National Forest and is close to the Continental Divide.
History
The area around Dillon was first inhabited by the Shoshone and Bannock tribes, who used the area for hunting and fishing. The first white settlers arrived in the area in the 1860s, and the town of Dillon was founded in 1880. The town was named after Union General Sidney Dillon, who had served in the Civil War.
The town quickly grew, and by the early 1900s, it had become a major center for the mining and ranching industries. The city was incorporated in 1909, and the first bank was established in 1910. The city also became a major railroad hub, with the Union Pacific Railroad running through the city.
Geography
Dillon is located in the southwestern part of Montana, in Beaverhead County. It is situated in the Big Hole Valley, at the confluence of the Beaverhead and Red Rock Rivers. The city is surrounded by the Beaverhead-Deerlodge National Forest and is close to the Continental Divide.
The city has a total area of 4.2 square miles, all of which is land. The city is located at an elevation of 5,541 feet above sea level.
Economy
The economy of Dillon is largely based on agriculture, tourism, and government services. The city is home to several large agricultural operations, including cattle ranches, wheat farms, and hay farms.
The city is also a popular tourist destination, with visitors coming to enjoy the area's outdoor recreation opportunities, such as fishing, hunting, and camping. The city is also home to several museums, including the Beaverhead County Museum and the Montana Historical Society Museum.
The city is also home to several government offices, including the Beaverhead County Courthouse and the Montana Department of Transportation.
Demographics
As of the 2010 census, there were 4,134 people, 1,717 households, and 1,039 families living in the city. The population density was 983.3 people per square mile. The racial makeup of the city was 94.2% White, 0.3% African American, 1.2% Native American, 0.4% Asian, 0.1% Pacific Islander, 1.7% from other races, and 2.1% from two or more races. Hispanic or Latino of any race were 4.2% of the population.
The median income for a household in the city was $35,938, and the median income for a family was $45,938. The per capita income for the city was $19,945. About 11.2% of families and 14.2% of the population were below the poverty line, including 17.2% of those under age 18 and 8.2% of those age 65 or over.
Common Questions
What is Per Capita Income in Dillon?
Per Capita income in Dillon is $27,611.
What is the Median Family Income in Dillon?
Median Family Income in Dillon is $76,250.
What is the Median Household income in Dillon?
Median Household Income in Dillon is $42,037.
What is Income or Wage Gap in Dillon?
Income or Wage Gap in Dillon is 25.5%.
Women in Dillon earn 74.5 cents for every dollar earned by a man.
What is Inequality or Gini Index in Dillon?
Inequality or Gini Index in Dillon is 0.49.
What is the Total Population of Dillon?
Total Population of Dillon is 3,958.
What is the Total Male Population of Dillon?
Total Male Population of Dillon is 2,020.
What is the Total Female Population of Dillon?
Total Female Population of Dillon is 1,938.
What is the Ratio of Males per 100 Females in Dillon?
There are 104.23 Males per 100 Females in Dillon.
What is the Ratio of Females per 100 Males in Dillon?
There are 95.94 Females per 100 Males in Dillon.
What is the Median Population Age in Dillon?
Median Population Age in Dillon is 29.9 Years.
What is the Average Family Size in Dillon
Average Family Size in Dillon is 2.9 People.
What is the Average Household Size in Dillon
Average Household Size in Dillon is 2.1 People.
How Large is the Labor Force in Dillon?
There are 1,916 People in the Labor Forcein in Dillon.
What is the Percentage of People in the Labor Force in Dillon?
56.1% of People are in the Labor Force in Dillon.
What is the Unemployment Rate in Dillon?
Unemployment Rate in Dillon is 3.8%.