South Hills, MT Map & Demographics
South Hills Map
South Hills Overview
$71,719
PER CAPITA INCOME
$159,028
AVG FAMILY INCOME
$156,500
AVG HOUSEHOLD INCOME
20.7%
WAGE / INCOME GAP [ % ]
79.3¢/ $1
WAGE / INCOME GAP [ $ ]
0.35
INEQUALITY / GINI INDEX
629
TOTAL POPULATION
332
MALE POPULATION
297
FEMALE POPULATION
111.78
MALES / 100 FEMALES
89.46
FEMALES / 100 MALES
47.2
MEDIAN AGE
3.2
AVG FAMILY SIZE
2.9
AVG HOUSEHOLD SIZE
342
LABOR FORCE [ PEOPLE ]
63.9%
PERCENT IN LABOR FORCE
Income in South Hills
Income Overview in South Hills
Per Capita Income in South Hills is $71,719, while median incomes of families and households are $159,028 and $156,500 respectively.
| Characteristic | Number | Measure |
| Per Capita Income | 629 | $71,719 |
| Median Family Income | 187 | $159,028 |
| Mean Family Income | 187 | $214,116 |
| Median Household Income | 214 | $156,500 |
| Mean Household Income | 214 | $199,270 |
| Income Deficit | 187 | $0 |
| Wage / Income Gap (%) | 629 | 20.69% |
| Wage / Income Gap ($) | 629 | 79.31¢ per $1 |
| Gini / Inequality Index | 629 | 0.35 |
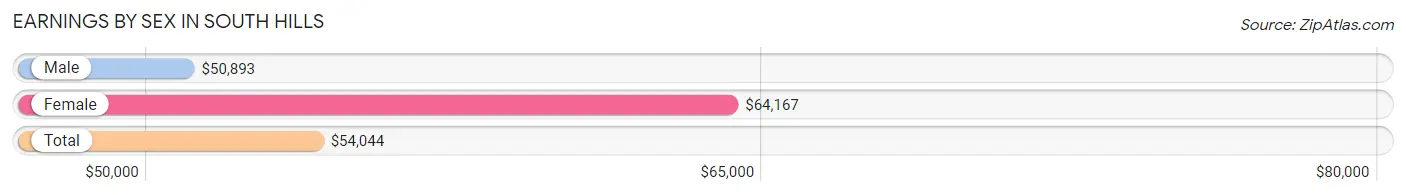
Earnings by Sex in South Hills
Average Earnings in South Hills are $54,044, $50,893 for men and $64,167 for women, a difference of 20.7%.
| Sex | Number | Average Earnings |
| Male | 239 (57.3%) | $50,893 |
| Female | 178 (42.7%) | $64,167 |
| Total | 417 (100.0%) | $54,044 |
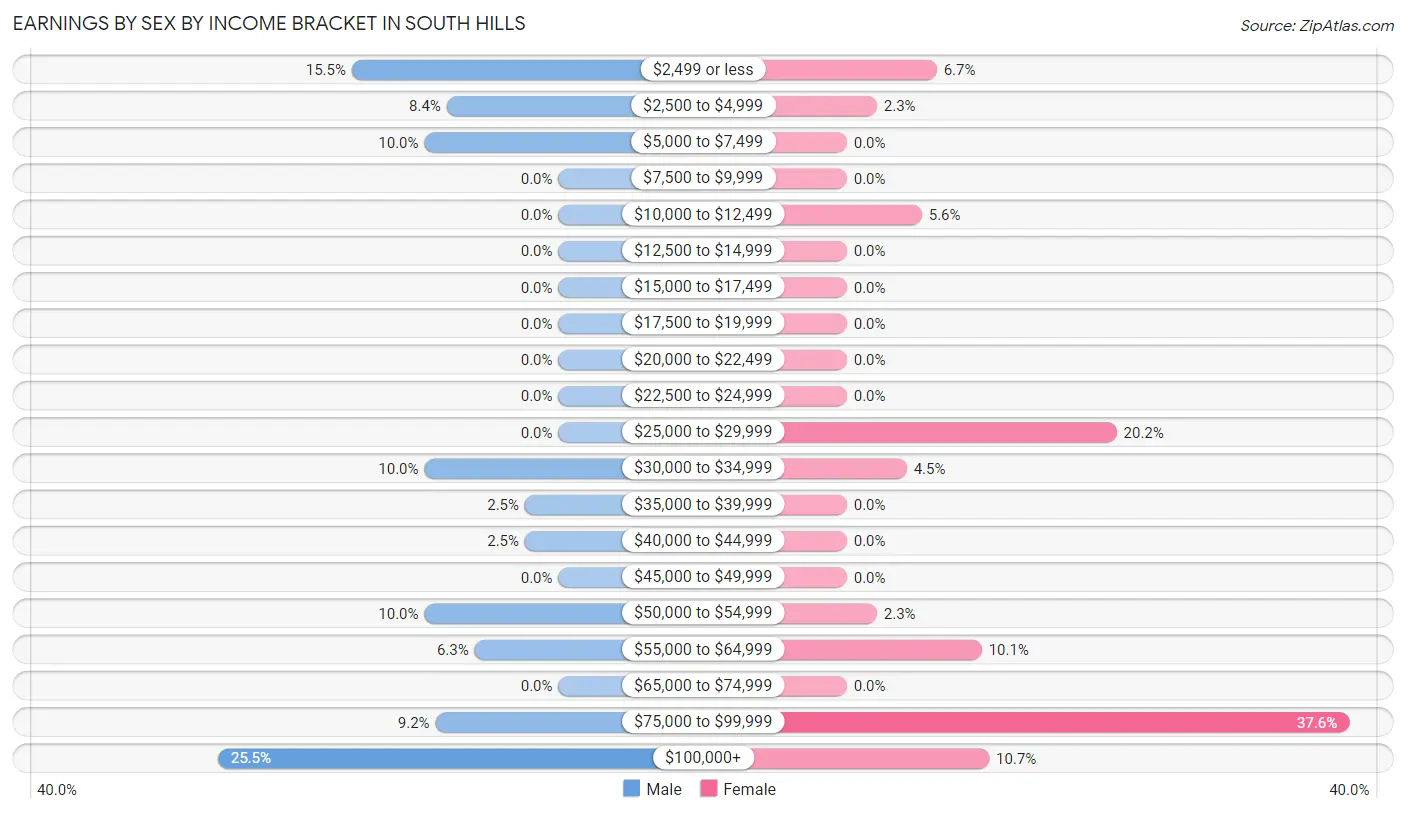
Earnings by Sex by Income Bracket in South Hills
The most common earnings brackets in South Hills are $100,000+ for men (61 | 25.5%) and $75,000 to $99,999 for women (67 | 37.6%).
| Income | Male | Female |
| $2,499 or less | 37 (15.5%) | 12 (6.7%) |
| $2,500 to $4,999 | 20 (8.4%) | 4 (2.2%) |
| $5,000 to $7,499 | 24 (10.0%) | 0 (0.0%) |
| $7,500 to $9,999 | 0 (0.0%) | 0 (0.0%) |
| $10,000 to $12,499 | 0 (0.0%) | 10 (5.6%) |
| $12,500 to $14,999 | 0 (0.0%) | 0 (0.0%) |
| $15,000 to $17,499 | 0 (0.0%) | 0 (0.0%) |
| $17,500 to $19,999 | 0 (0.0%) | 0 (0.0%) |
| $20,000 to $22,499 | 0 (0.0%) | 0 (0.0%) |
| $22,500 to $24,999 | 0 (0.0%) | 0 (0.0%) |
| $25,000 to $29,999 | 0 (0.0%) | 36 (20.2%) |
| $30,000 to $34,999 | 24 (10.0%) | 8 (4.5%) |
| $35,000 to $39,999 | 6 (2.5%) | 0 (0.0%) |
| $40,000 to $44,999 | 6 (2.5%) | 0 (0.0%) |
| $45,000 to $49,999 | 0 (0.0%) | 0 (0.0%) |
| $50,000 to $54,999 | 24 (10.0%) | 4 (2.2%) |
| $55,000 to $64,999 | 15 (6.3%) | 18 (10.1%) |
| $65,000 to $74,999 | 0 (0.0%) | 0 (0.0%) |
| $75,000 to $99,999 | 22 (9.2%) | 67 (37.6%) |
| $100,000+ | 61 (25.5%) | 19 (10.7%) |
| Total | 239 (100.0%) | 178 (100.0%) |
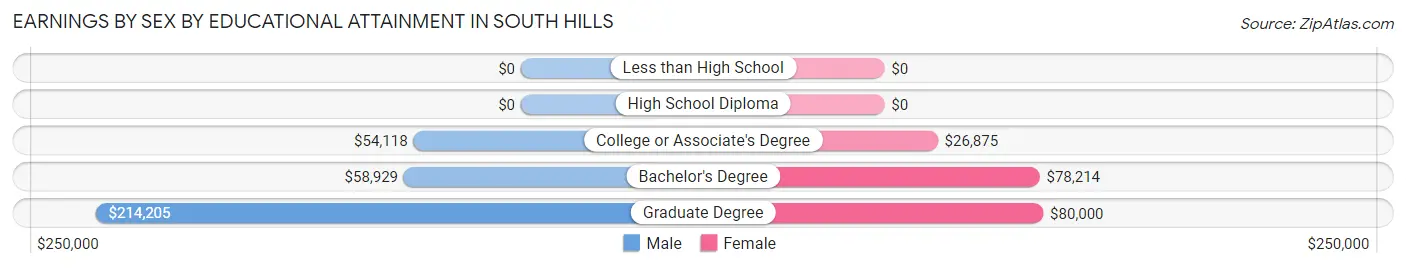
Earnings by Sex by Educational Attainment in South Hills
Average earnings in South Hills are $91,250 for men and $78,000 for women, a difference of 14.5%. Men with an educational attainment of graduate degree enjoy the highest average annual earnings of $214,205, while those with college or associate's degree education earn the least with $54,118. Women with an educational attainment of graduate degree earn the most with the average annual earnings of $80,000, while those with college or associate's degree education have the smallest earnings of $26,875.
| Educational Attainment | Male Income | Female Income |
| Less than High School | - | - |
| High School Diploma | - | - |
| College or Associate's Degree | $54,118 | $26,875 |
| Bachelor's Degree | $58,929 | $78,214 |
| Graduate Degree | $214,205 | $80,000 |
| Total | $91,250 | $78,000 |
Family Income in South Hills
Family Income Brackets in South Hills
According to the South Hills family income data, there are 73 families falling into the $150,000 to $199,999 income range, which is the most common income bracket and makes up 39.0% of all families.
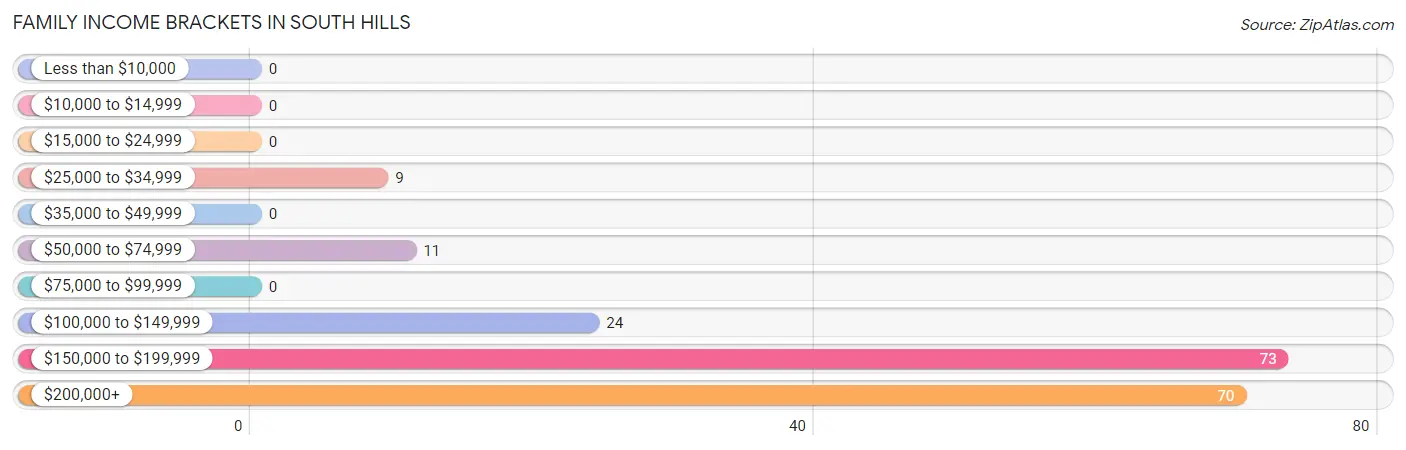
| Income Bracket | # Families | % Families |
| Less than $10,000 | 0 | 0.0% |
| $10,000 to $14,999 | 0 | 0.0% |
| $15,000 to $24,999 | 0 | 0.0% |
| $25,000 to $34,999 | 9 | 4.8% |
| $35,000 to $49,999 | 0 | 0.0% |
| $50,000 to $74,999 | 11 | 5.9% |
| $75,000 to $99,999 | 0 | 0.0% |
| $100,000 to $149,999 | 24 | 12.8% |
| $150,000 to $199,999 | 73 | 39.0% |
| $200,000+ | 70 | 37.4% |
Family Income by Famaliy Size in South Hills
3-person families (33 | 17.6%) account for the highest median family income in South Hills with $208,125 per family, while 2-person families (96 | 51.3%) have the highest median income of $76,193 per family member.
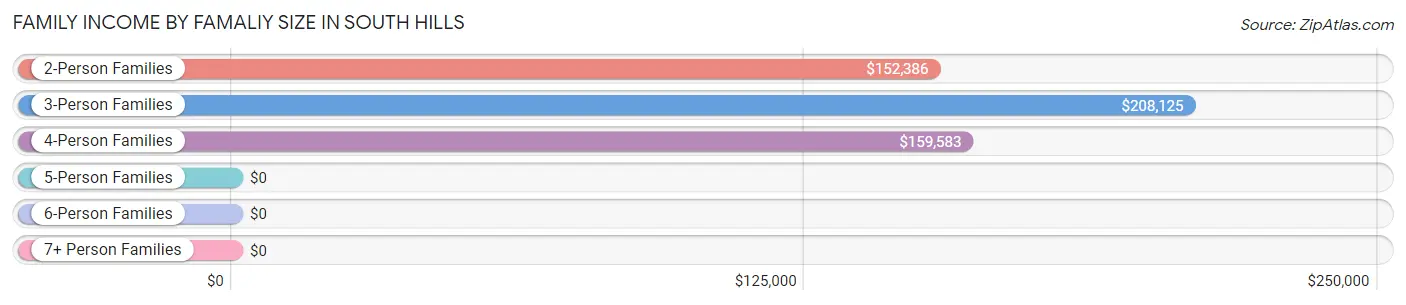
| Income Bracket | # Families | Median Income |
| 2-Person Families | 96 (51.3%) | $152,386 |
| 3-Person Families | 33 (17.6%) | $208,125 |
| 4-Person Families | 49 (26.2%) | $159,583 |
| 5-Person Families | 9 (4.8%) | $0 |
| 6-Person Families | 0 (0.0%) | $0 |
| 7+ Person Families | 0 (0.0%) | $0 |
| Total | 187 (100.0%) | $159,028 |
Family Income by Number of Earners in South Hills
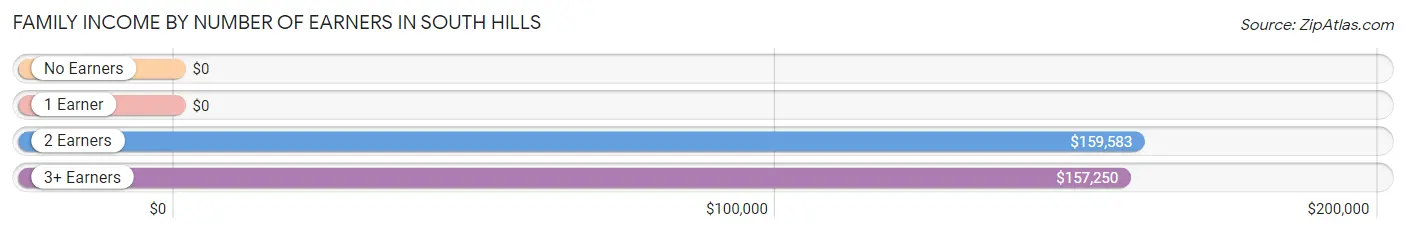
| Number of Earners | # Families | Median Income |
| No Earners | 39 (20.9%) | $0 |
| 1 Earner | 13 (7.0%) | $0 |
| 2 Earners | 93 (49.7%) | $159,583 |
| 3+ Earners | 42 (22.5%) | $157,250 |
| Total | 187 (100.0%) | $159,028 |
Household Income in South Hills
Household Income Brackets in South Hills
With 74 households falling in the category, the $200,000+ income range is the most frequent in South Hills, accounting for 34.6% of all households.
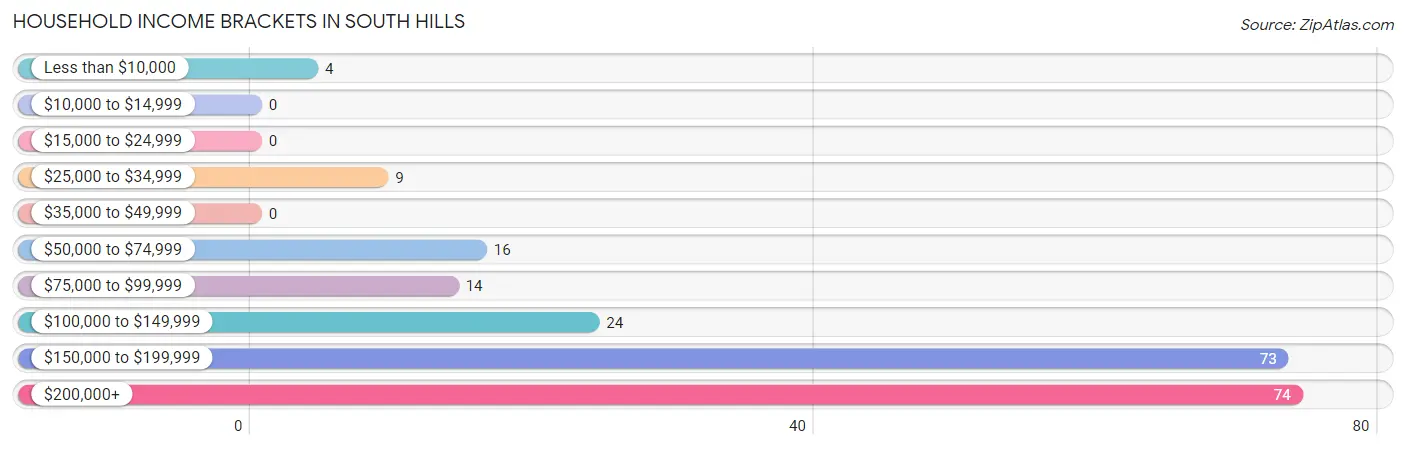
| Income Bracket | # Households | % Households |
| Less than $10,000 | 4 | 1.9% |
| $10,000 to $14,999 | 0 | 0.0% |
| $15,000 to $24,999 | 0 | 0.0% |
| $25,000 to $34,999 | 9 | 4.2% |
| $35,000 to $49,999 | 0 | 0.0% |
| $50,000 to $74,999 | 16 | 7.5% |
| $75,000 to $99,999 | 14 | 6.5% |
| $100,000 to $149,999 | 24 | 11.2% |
| $150,000 to $199,999 | 73 | 34.1% |
| $200,000+ | 74 | 34.6% |
Household Income by Householder Age in South Hills
The median household income in South Hills is $156,500, with the highest median household income of $163,750 found in the 25 to 44 years age bracket for the primary householder. A total of 29 households (13.6%) fall into this category.
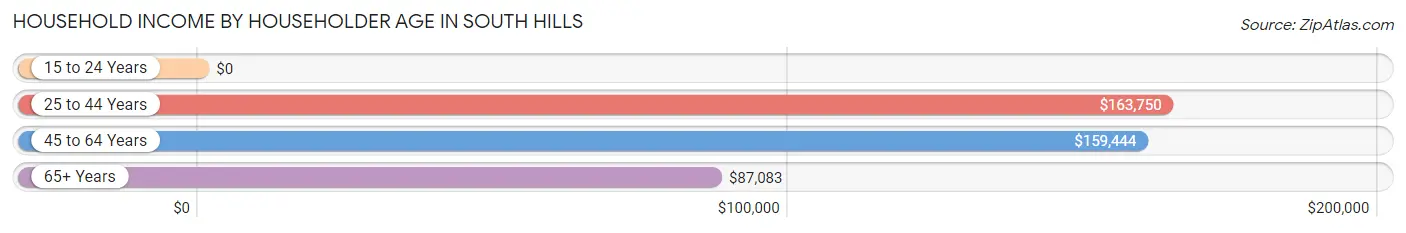
| Income Bracket | # Households | Median Income |
| 15 to 24 Years | 0 (0.0%) | $0 |
| 25 to 44 Years | 29 (13.6%) | $163,750 |
| 45 to 64 Years | 126 (58.9%) | $159,444 |
| 65+ Years | 59 (27.6%) | $87,083 |
| Total | 214 (100.0%) | $156,500 |
Poverty in South Hills
Income Below Poverty by Sex and Age in South Hills
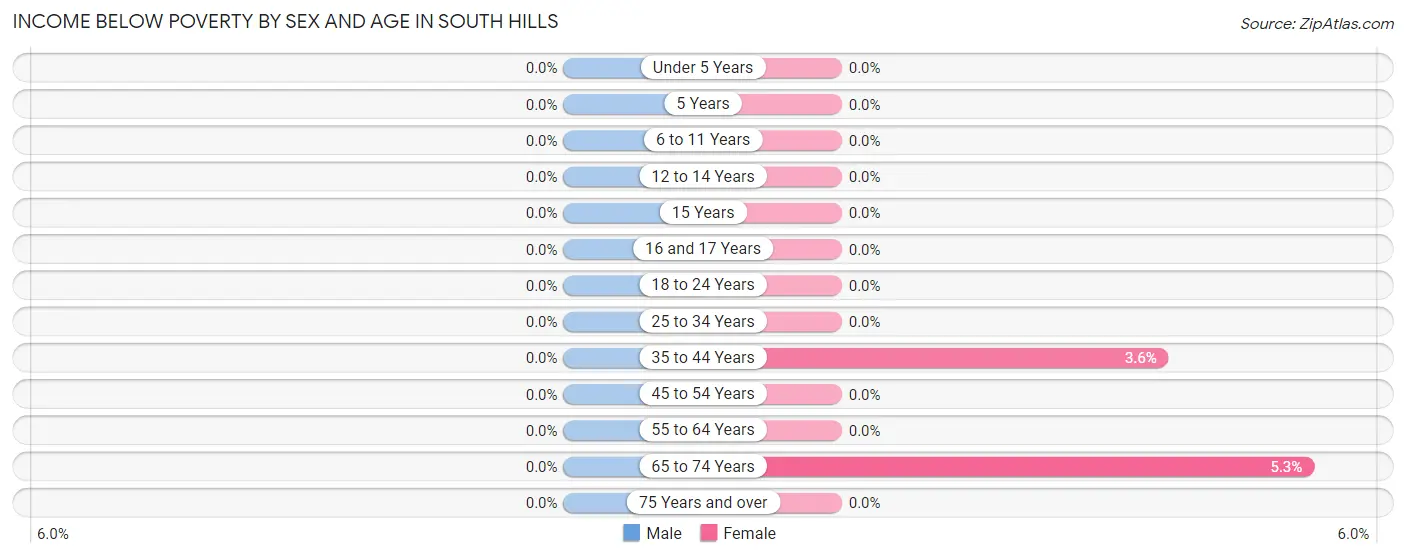
| Age Bracket | Male | Female |
| Under 5 Years | 0 (0.0%) | 0 (0.0%) |
| 5 Years | 0 (0.0%) | 0 (0.0%) |
| 6 to 11 Years | 0 (0.0%) | 0 (0.0%) |
| 12 to 14 Years | 0 (0.0%) | 0 (0.0%) |
| 15 Years | 0 (0.0%) | 0 (0.0%) |
| 16 and 17 Years | 0 (0.0%) | 0 (0.0%) |
| 18 to 24 Years | 0 (0.0%) | 0 (0.0%) |
| 25 to 34 Years | 0 (0.0%) | 0 (0.0%) |
| 35 to 44 Years | 0 (0.0%) | 2 (3.6%) |
| 45 to 54 Years | 0 (0.0%) | 0 (0.0%) |
| 55 to 64 Years | 0 (0.0%) | 0 (0.0%) |
| 65 to 74 Years | 0 (0.0%) | 2 (5.3%) |
| 75 Years and over | 0 (0.0%) | 0 (0.0%) |
| Total | 0 (0.0%) | 4 (1.3%) |
Income Above Poverty by Sex and Age in South Hills
According to the poverty statistics in South Hills, males aged 6 to 11 years and females aged under 5 years are the age groups that are most secure financially, with 100.0% of males and 100.0% of females in these age groups living above the poverty line.
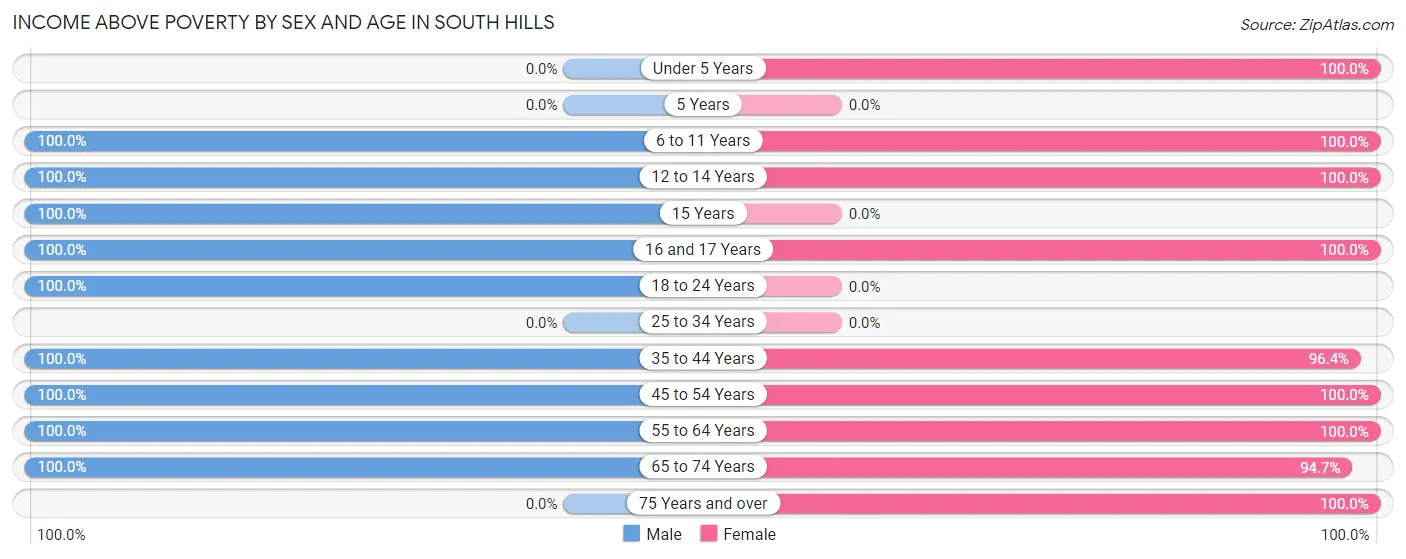
| Age Bracket | Male | Female |
| Under 5 Years | 0 (0.0%) | 8 (100.0%) |
| 5 Years | 0 (0.0%) | 0 (0.0%) |
| 6 to 11 Years | 18 (100.0%) | 25 (100.0%) |
| 12 to 14 Years | 14 (100.0%) | 19 (100.0%) |
| 15 Years | 10 (100.0%) | 0 (0.0%) |
| 16 and 17 Years | 24 (100.0%) | 17 (100.0%) |
| 18 to 24 Years | 76 (100.0%) | 0 (0.0%) |
| 25 to 34 Years | 0 (0.0%) | 0 (0.0%) |
| 35 to 44 Years | 10 (100.0%) | 53 (96.4%) |
| 45 to 54 Years | 72 (100.0%) | 73 (100.0%) |
| 55 to 64 Years | 69 (100.0%) | 57 (100.0%) |
| 65 to 74 Years | 39 (100.0%) | 36 (94.7%) |
| 75 Years and over | 0 (0.0%) | 5 (100.0%) |
| Total | 332 (100.0%) | 293 (98.7%) |
Income Below Poverty Among Married-Couple Families in South Hills
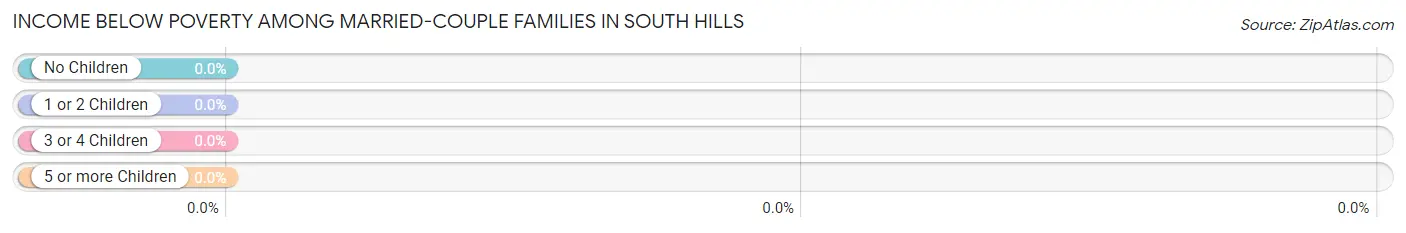
| Children | Above Poverty | Below Poverty |
| No Children | 107 (100.0%) | 0 (0.0%) |
| 1 or 2 Children | 66 (100.0%) | 0 (0.0%) |
| 3 or 4 Children | 9 (100.0%) | 0 (0.0%) |
| 5 or more Children | 0 (0.0%) | 0 (0.0%) |
| Total | 182 (100.0%) | 0 (0.0%) |
Income Below Poverty Among Single-Parent Households in South Hills
| Children | Single Father | Single Mother |
| No Children | 0 (0.0%) | 0 (0.0%) |
| 1 or 2 Children | 0 (0.0%) | 0 (0.0%) |
| 3 or 4 Children | 0 (0.0%) | 0 (0.0%) |
| 5 or more Children | 0 (0.0%) | 0 (0.0%) |
| Total | 0 (0.0%) | 0 (0.0%) |
Income Below Poverty Among Married-Couple vs Single-Parent Households in South Hills
| Children | Married-Couple Families | Single-Parent Households |
| No Children | 0 (0.0%) | 0 (0.0%) |
| 1 or 2 Children | 0 (0.0%) | 0 (0.0%) |
| 3 or 4 Children | 0 (0.0%) | 0 (0.0%) |
| 5 or more Children | 0 (0.0%) | 0 (0.0%) |
| Total | 0 (0.0%) | 0 (0.0%) |
Race in South Hills
The most populous races in South Hills are White / Caucasian (620 | 98.6%), Hispanic or Latino (17 | 2.7%), and Two or more Races (9 | 1.4%).
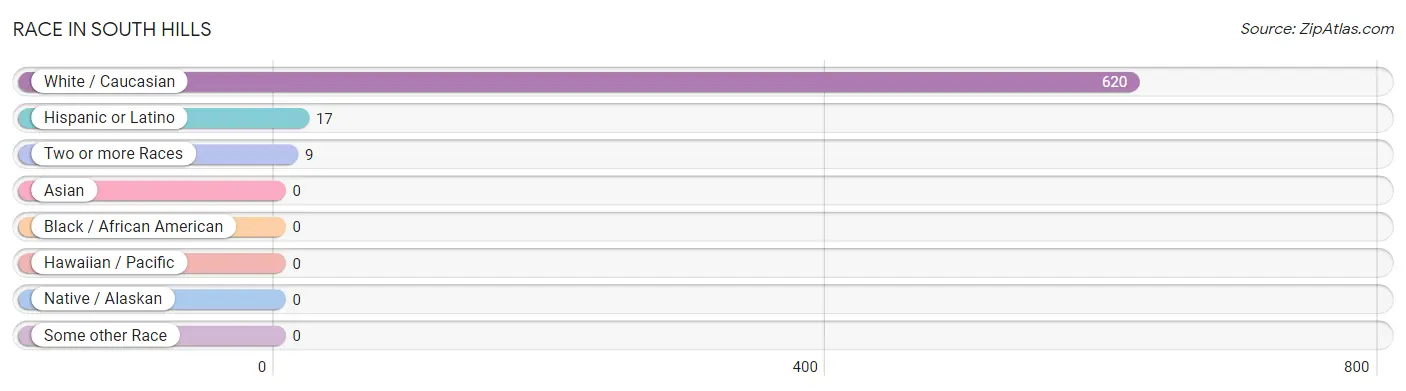
| Race | # Population | % Population |
| Asian | 0 | 0.0% |
| Black / African American | 0 | 0.0% |
| Hawaiian / Pacific | 0 | 0.0% |
| Hispanic or Latino | 17 | 2.7% |
| Native / Alaskan | 0 | 0.0% |
| White / Caucasian | 620 | 98.6% |
| Two or more Races | 9 | 1.4% |
| Some other Race | 0 | 0.0% |
| Total | 629 | 100.0% |
Ancestry in South Hills
The most populous ancestries reported in South Hills are German (159 | 25.3%), English (110 | 17.5%), Irish (83 | 13.2%), French (51 | 8.1%), and Scandinavian (45 | 7.1%), together accounting for 71.2% of all South Hills residents.
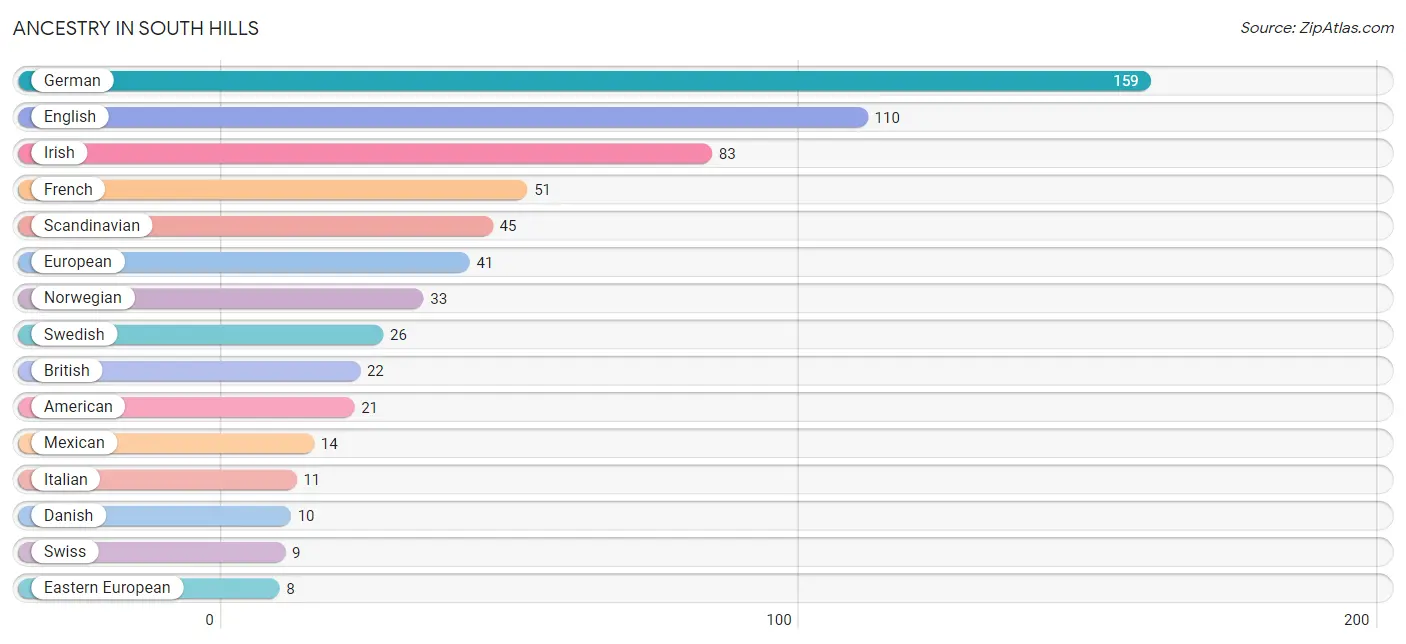
| Ancestry | # Population | % Population |
| American | 21 | 3.3% |
| Austrian | 3 | 0.5% |
| Blackfeet | 5 | 0.8% |
| British | 22 | 3.5% |
| Croatian | 6 | 0.9% |
| Cuban | 3 | 0.5% |
| Czech | 7 | 1.1% |
| Danish | 10 | 1.6% |
| Eastern European | 8 | 1.3% |
| English | 110 | 17.5% |
| European | 41 | 6.5% |
| French | 51 | 8.1% |
| French Canadian | 7 | 1.1% |
| German | 159 | 25.3% |
| Irish | 83 | 13.2% |
| Italian | 11 | 1.8% |
| Mexican | 14 | 2.2% |
| Norwegian | 33 | 5.2% |
| Russian | 6 | 0.9% |
| Scandinavian | 45 | 7.1% |
| Scotch-Irish | 5 | 0.8% |
| Swedish | 26 | 4.1% |
| Swiss | 9 | 1.4% |
| Welsh | 5 | 0.8% | View All 24 Rows |
Immigrants in South Hills
The most numerous immigrant groups reported in South Hills came from Caribbean (3 | 0.5%), Cuba (3 | 0.5%), and Latin America (3 | 0.5%), together accounting for 1.4% of all South Hills residents.
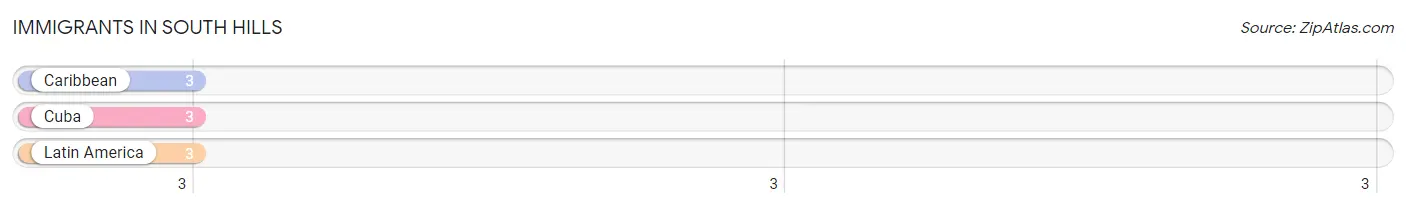
| Immigration Origin | # Population | % Population |
| Caribbean | 3 | 0.5% |
| Cuba | 3 | 0.5% |
| Latin America | 3 | 0.5% | View All 3 Rows |
Sex and Age in South Hills
Sex and Age in South Hills
The most populous age groups in South Hills are 15 to 19 Years (91 | 27.4%) for men and 45 to 49 Years (46 | 15.5%) for women.
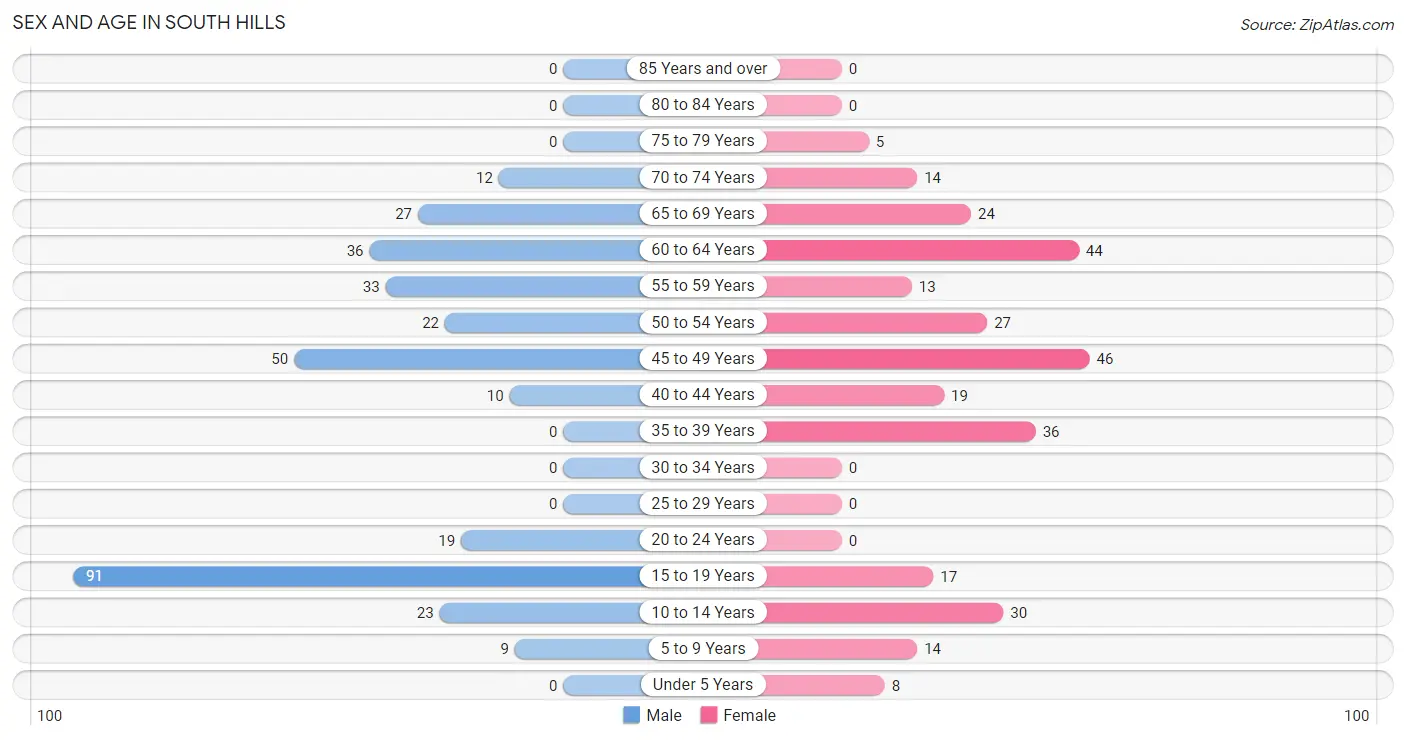
| Age Bracket | Male | Female |
| Under 5 Years | 0 (0.0%) | 8 (2.7%) |
| 5 to 9 Years | 9 (2.7%) | 14 (4.7%) |
| 10 to 14 Years | 23 (6.9%) | 30 (10.1%) |
| 15 to 19 Years | 91 (27.4%) | 17 (5.7%) |
| 20 to 24 Years | 19 (5.7%) | 0 (0.0%) |
| 25 to 29 Years | 0 (0.0%) | 0 (0.0%) |
| 30 to 34 Years | 0 (0.0%) | 0 (0.0%) |
| 35 to 39 Years | 0 (0.0%) | 36 (12.1%) |
| 40 to 44 Years | 10 (3.0%) | 19 (6.4%) |
| 45 to 49 Years | 50 (15.1%) | 46 (15.5%) |
| 50 to 54 Years | 22 (6.6%) | 27 (9.1%) |
| 55 to 59 Years | 33 (9.9%) | 13 (4.4%) |
| 60 to 64 Years | 36 (10.8%) | 44 (14.8%) |
| 65 to 69 Years | 27 (8.1%) | 24 (8.1%) |
| 70 to 74 Years | 12 (3.6%) | 14 (4.7%) |
| 75 to 79 Years | 0 (0.0%) | 5 (1.7%) |
| 80 to 84 Years | 0 (0.0%) | 0 (0.0%) |
| 85 Years and over | 0 (0.0%) | 0 (0.0%) |
| Total | 332 (100.0%) | 297 (100.0%) |
Families and Households in South Hills
Median Family Size in South Hills
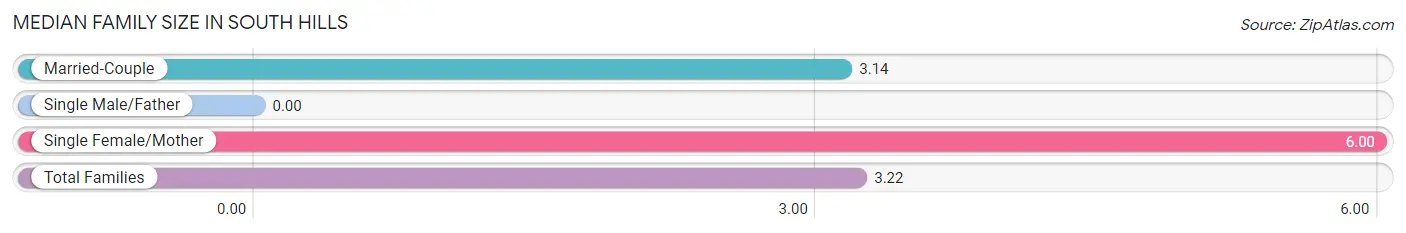
| Family Type | # Families | Family Size |
| Married-Couple | 182 (97.3%) | 3.14 |
| Single Male/Father | 0 (0.0%) | - |
| Single Female/Mother | 5 (2.7%) | 6.00 |
| Total Families | 187 (100.0%) | 3.22 |
Median Household Size in South Hills
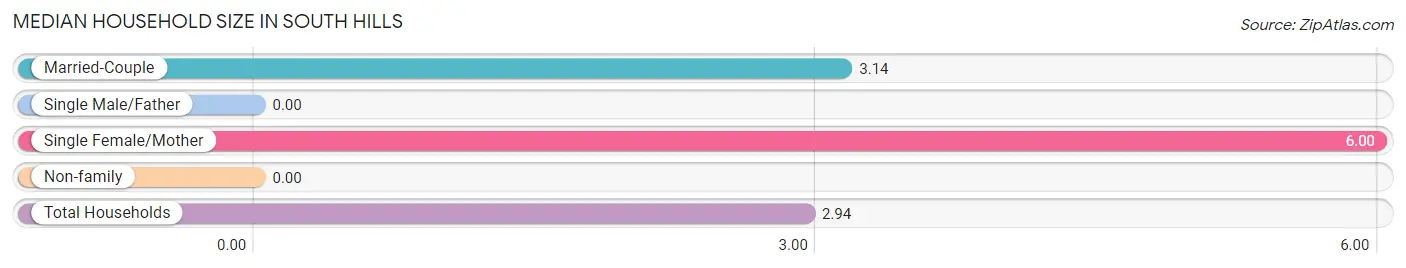
| Household Type | # Households | Household Size |
| Married-Couple | 182 (85.1%) | 3.14 |
| Single Male/Father | 0 (0.0%) | - |
| Single Female/Mother | 5 (2.3%) | 6.00 |
| Non-family | 27 (12.6%) | - |
| Total Households | 214 (100.0%) | 2.94 |
Household Size by Marriage Status in South Hills
Out of a total of 214 households in South Hills, 187 (87.4%) are family households, while 27 (12.6%) are nonfamily households. The most numerous type of family households are 2-person households, comprising 96, and the most common type of nonfamily households are 1-person households, comprising 27.
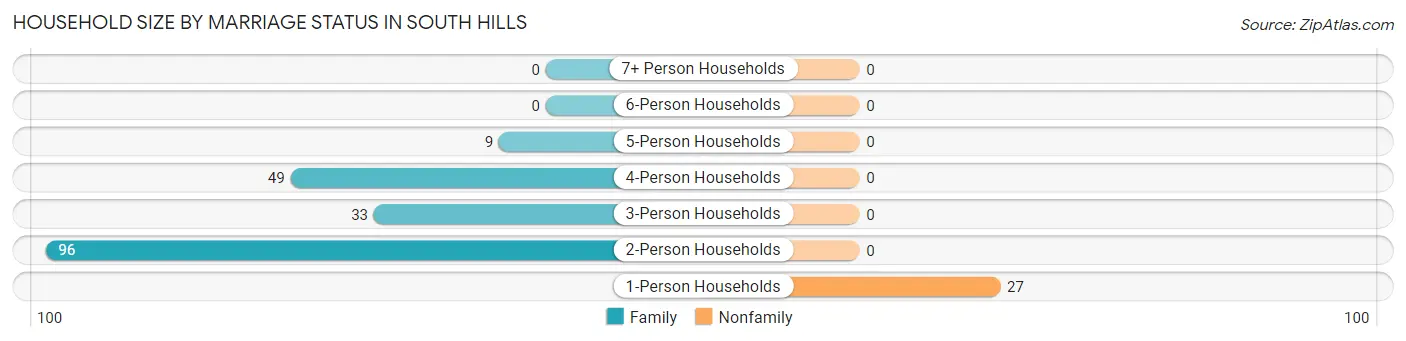
| Household Size | Family Households | Nonfamily Households |
| 1-Person Households | - | 27 (12.6%) |
| 2-Person Households | 96 (44.9%) | 0 (0.0%) |
| 3-Person Households | 33 (15.4%) | 0 (0.0%) |
| 4-Person Households | 49 (22.9%) | 0 (0.0%) |
| 5-Person Households | 9 (4.2%) | 0 (0.0%) |
| 6-Person Households | 0 (0.0%) | 0 (0.0%) |
| 7+ Person Households | 0 (0.0%) | 0 (0.0%) |
| Total | 187 (87.4%) | 27 (12.6%) |
Female Fertility in South Hills
Fertility by Age in South Hills
| Age Bracket | Women with Births | Births / 1,000 Women |
| 15 to 19 years | 0 (0.0%) | 0.0 |
| 20 to 34 years | 0 (0.0%) | 0.0 |
| 35 to 50 years | 0 (0.0%) | 0.0 |
| Total | 0 (0.0%) | 0.0 |
Fertility by Age by Marriage Status in South Hills
| Age Bracket | Married | Unmarried |
| 15 to 19 years | 0 (0.0%) | 0 (0.0%) |
| 20 to 34 years | 0 (0.0%) | 0 (0.0%) |
| 35 to 50 years | 0 (0.0%) | 0 (0.0%) |
| Total | 0 (0.0%) | 0 (0.0%) |
Fertility by Education in South Hills
| Educational Attainment | Women with Births | Births / 1,000 Women |
| Less than High School | 0 (0.0%) | 0.0 |
| High School Diploma | 0 (0.0%) | 0.0 |
| College or Associate's Degree | 0 (0.0%) | 0.0 |
| Bachelor's Degree | 0 (0.0%) | 0.0 |
| Graduate Degree | 0 (0.0%) | 0.0 |
| Total | 0 (0.0%) | 0.0 |
Fertility by Education by Marriage Status in South Hills
| Educational Attainment | Married | Unmarried |
| Less than High School | 0 (0.0%) | 0 (0.0%) |
| High School Diploma | 0 (0.0%) | 0 (0.0%) |
| College or Associate's Degree | 0 (0.0%) | 0 (0.0%) |
| Bachelor's Degree | 0 (0.0%) | 0 (0.0%) |
| Graduate Degree | 0 (0.0%) | 0 (0.0%) |
| Total | 0 (0.0%) | 0 (0.0%) |
Employment Characteristics in South Hills
Employment by Class of Employer in South Hills
Among the 328 employed individuals in South Hills, private company employees (164 | 50.0%), state government employees (70 | 21.3%), and self-employed (incorporated) (22 | 6.7%) make up the most common classes of employment.
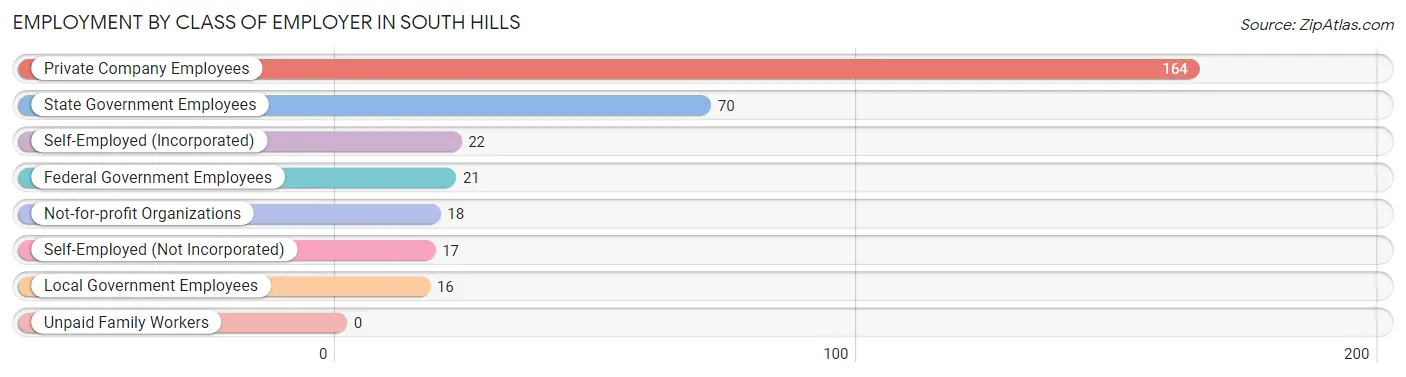
| Employer Class | # Employees | % Employees |
| Private Company Employees | 164 | 50.0% |
| Self-Employed (Incorporated) | 22 | 6.7% |
| Self-Employed (Not Incorporated) | 17 | 5.2% |
| Not-for-profit Organizations | 18 | 5.5% |
| Local Government Employees | 16 | 4.9% |
| State Government Employees | 70 | 21.3% |
| Federal Government Employees | 21 | 6.4% |
| Unpaid Family Workers | 0 | 0.0% |
| Total | 328 | 100.0% |
Employment Status by Age in South Hills
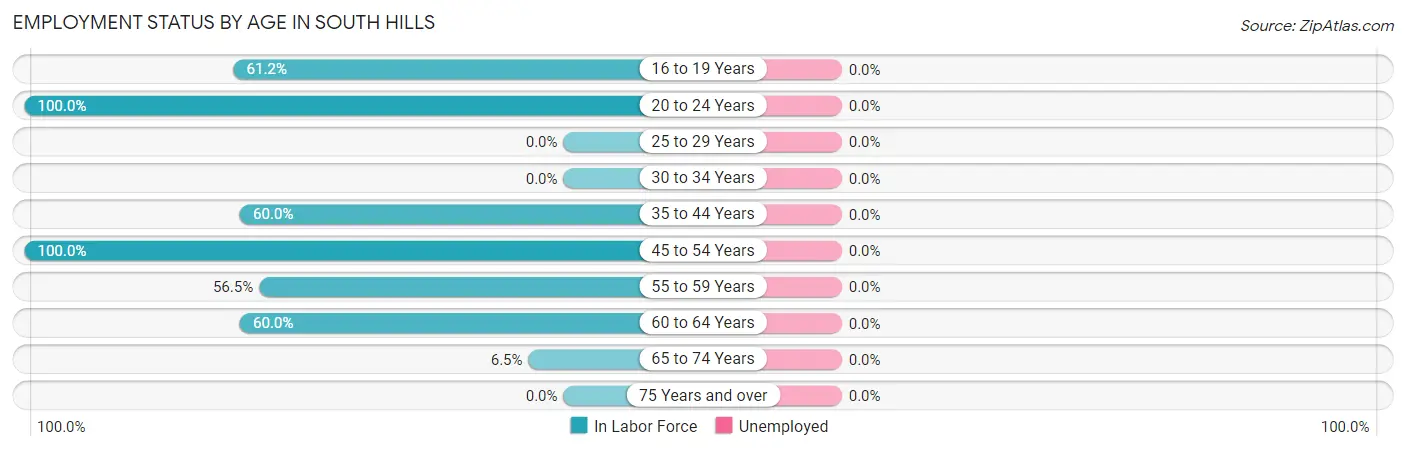
| Age Bracket | In Labor Force | Unemployed |
| 16 to 19 Years | 60 (61.2%) | 0 (0.0%) |
| 20 to 24 Years | 19 (100.0%) | 0 (0.0%) |
| 25 to 29 Years | 0 (0.0%) | 0 (0.0%) |
| 30 to 34 Years | 0 (0.0%) | 0 (0.0%) |
| 35 to 44 Years | 39 (60.0%) | 0 (0.0%) |
| 45 to 54 Years | 145 (100.0%) | 0 (0.0%) |
| 55 to 59 Years | 26 (56.5%) | 0 (0.0%) |
| 60 to 64 Years | 48 (60.0%) | 0 (0.0%) |
| 65 to 74 Years | 5 (6.5%) | 0 (0.0%) |
| 75 Years and over | 0 (0.0%) | 0 (0.0%) |
| Total | 342 (63.9%) | 0 (0.0%) |
Employment Status by Educational Attainment in South Hills
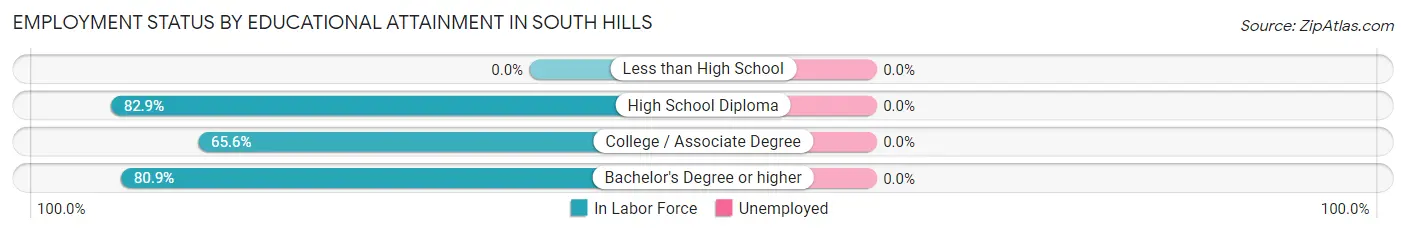
| Educational Attainment | In Labor Force | Unemployed |
| Less than High School | 0 (0.0%) | 0 (0.0%) |
| High School Diploma | 34 (82.9%) | 0 (0.0%) |
| College / Associate Degree | 63 (65.6%) | 0 (0.0%) |
| Bachelor's Degree or higher | 161 (80.9%) | 0 (0.0%) |
| Total | 258 (76.8%) | 0 (0.0%) |
Employment Occupations by Sex in South Hills
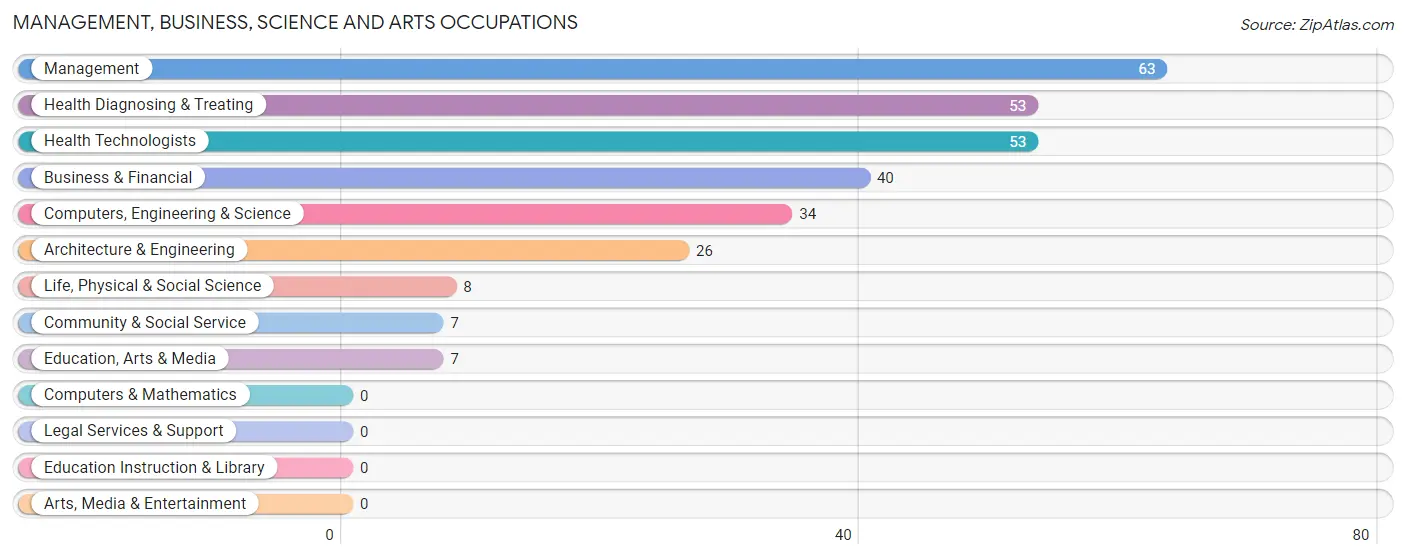
Management, Business, Science and Arts Occupations
The most common Management, Business, Science and Arts occupations in South Hills are Management (63 | 18.4%), Health Diagnosing & Treating (53 | 15.5%), Health Technologists (53 | 15.5%), Business & Financial (40 | 11.7%), and Computers, Engineering & Science (34 | 9.9%).
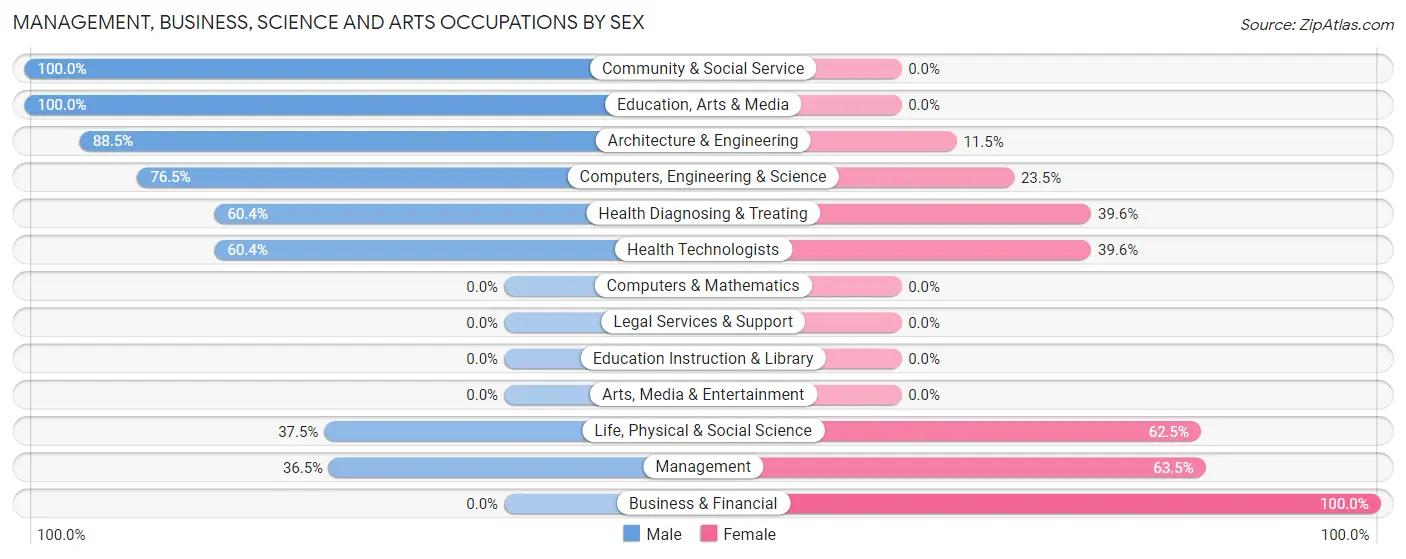
Management, Business, Science and Arts Occupations by Sex
Within the Management, Business, Science and Arts occupations in South Hills, the most male-oriented occupations are Community & Social Service (100.0%), Education, Arts & Media (100.0%), and Architecture & Engineering (88.5%), while the most female-oriented occupations are Business & Financial (100.0%), Management (63.5%), and Life, Physical & Social Science (62.5%).
| Occupation | Male | Female |
| Management | 23 (36.5%) | 40 (63.5%) |
| Business & Financial | 0 (0.0%) | 40 (100.0%) |
| Computers, Engineering & Science | 26 (76.5%) | 8 (23.5%) |
| Computers & Mathematics | 0 (0.0%) | 0 (0.0%) |
| Architecture & Engineering | 23 (88.5%) | 3 (11.5%) |
| Life, Physical & Social Science | 3 (37.5%) | 5 (62.5%) |
| Community & Social Service | 7 (100.0%) | 0 (0.0%) |
| Education, Arts & Media | 7 (100.0%) | 0 (0.0%) |
| Legal Services & Support | 0 (0.0%) | 0 (0.0%) |
| Education Instruction & Library | 0 (0.0%) | 0 (0.0%) |
| Arts, Media & Entertainment | 0 (0.0%) | 0 (0.0%) |
| Health Diagnosing & Treating | 32 (60.4%) | 21 (39.6%) |
| Health Technologists | 32 (60.4%) | 21 (39.6%) |
| Total (Category) | 88 (44.7%) | 109 (55.3%) |
| Total (Overall) | 201 (58.8%) | 141 (41.2%) |
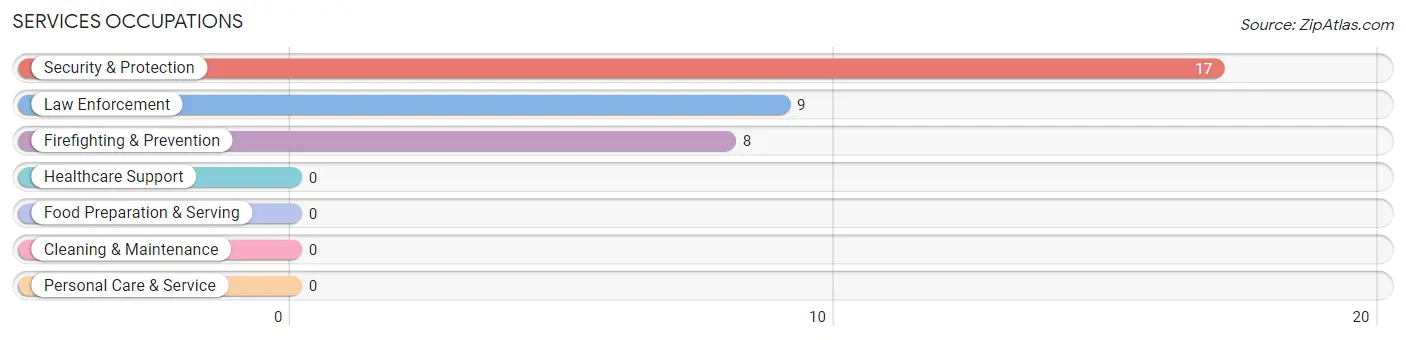
Services Occupations
The most common Services occupations in South Hills are Security & Protection (17 | 5.0%), Law Enforcement (9 | 2.6%), and Firefighting & Prevention (8 | 2.3%).
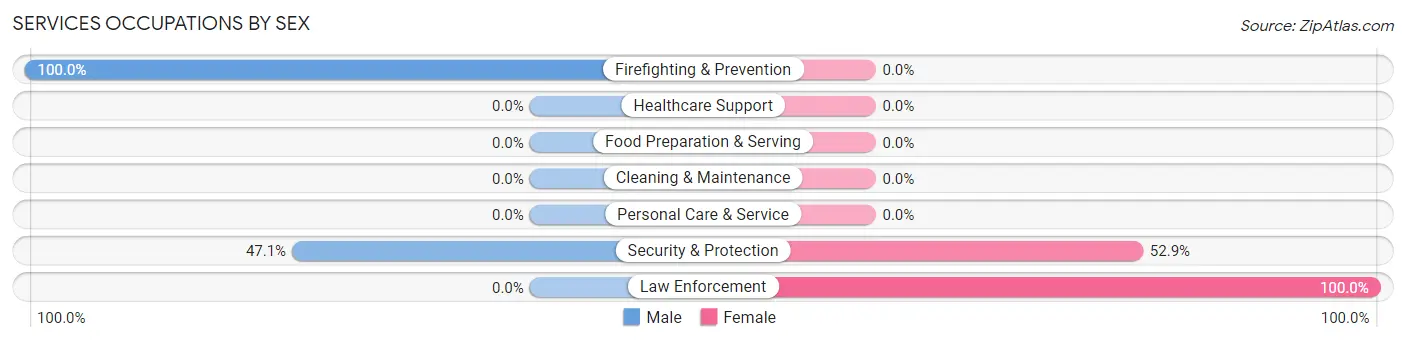
Services Occupations by Sex
Within the Services occupations in South Hills, the most male-oriented occupations are Firefighting & Prevention (100.0%), and Security & Protection (47.1%), while the most female-oriented occupations are Law Enforcement (100.0%), and Security & Protection (52.9%).
| Occupation | Male | Female |
| Healthcare Support | 0 (0.0%) | 0 (0.0%) |
| Security & Protection | 8 (47.1%) | 9 (52.9%) |
| Firefighting & Prevention | 8 (100.0%) | 0 (0.0%) |
| Law Enforcement | 0 (0.0%) | 9 (100.0%) |
| Food Preparation & Serving | 0 (0.0%) | 0 (0.0%) |
| Cleaning & Maintenance | 0 (0.0%) | 0 (0.0%) |
| Personal Care & Service | 0 (0.0%) | 0 (0.0%) |
| Total (Category) | 8 (47.1%) | 9 (52.9%) |
| Total (Overall) | 201 (58.8%) | 141 (41.2%) |
Sales and Office Occupations
The most common Sales and Office occupations in South Hills are Office & Administration (23 | 6.7%), and Sales & Related (7 | 2.1%).
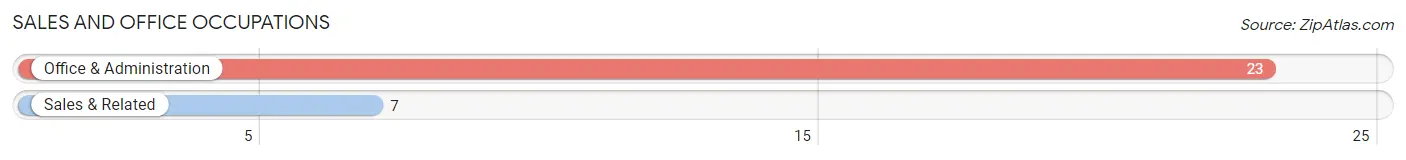
Sales and Office Occupations by Sex
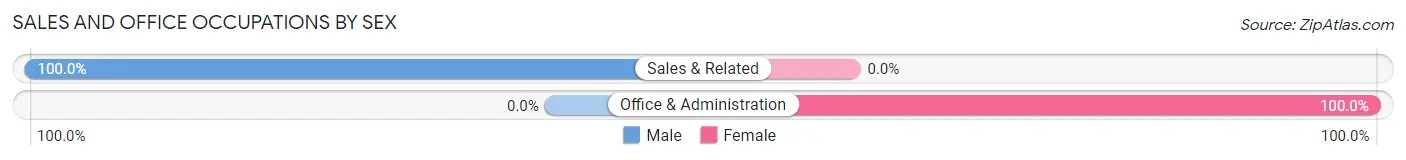
| Occupation | Male | Female |
| Sales & Related | 7 (100.0%) | 0 (0.0%) |
| Office & Administration | 0 (0.0%) | 23 (100.0%) |
| Total (Category) | 7 (23.3%) | 23 (76.7%) |
| Total (Overall) | 201 (58.8%) | 141 (41.2%) |
Natural Resources, Construction and Maintenance Occupations
The most common Natural Resources, Construction and Maintenance occupations in South Hills are Installation, Maintenance & Repair (44 | 12.9%), Farming, Fishing & Forestry (19 | 5.6%), and Construction & Extraction (17 | 5.0%).
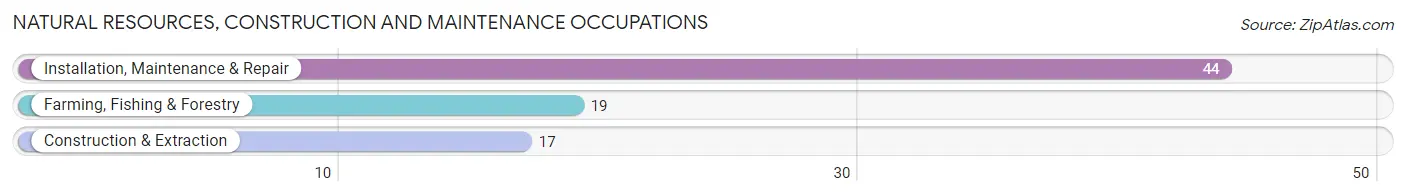
Natural Resources, Construction and Maintenance Occupations by Sex
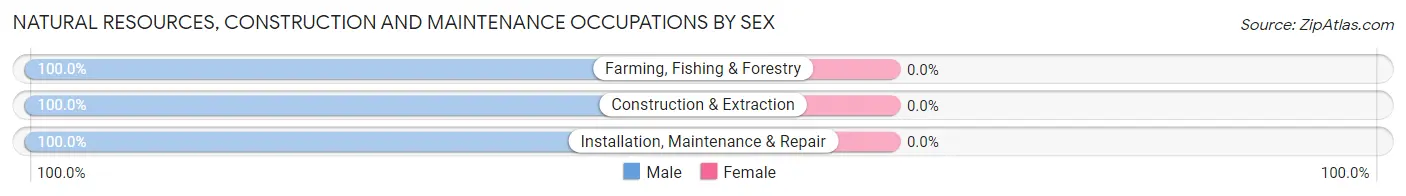
| Occupation | Male | Female |
| Farming, Fishing & Forestry | 19 (100.0%) | 0 (0.0%) |
| Construction & Extraction | 17 (100.0%) | 0 (0.0%) |
| Installation, Maintenance & Repair | 44 (100.0%) | 0 (0.0%) |
| Total (Category) | 80 (100.0%) | 0 (0.0%) |
| Total (Overall) | 201 (58.8%) | 141 (41.2%) |
Production, Transportation and Moving Occupations
The most common Production, Transportation and Moving occupations in South Hills are Material Moving (11 | 3.2%), and Production (7 | 2.1%).
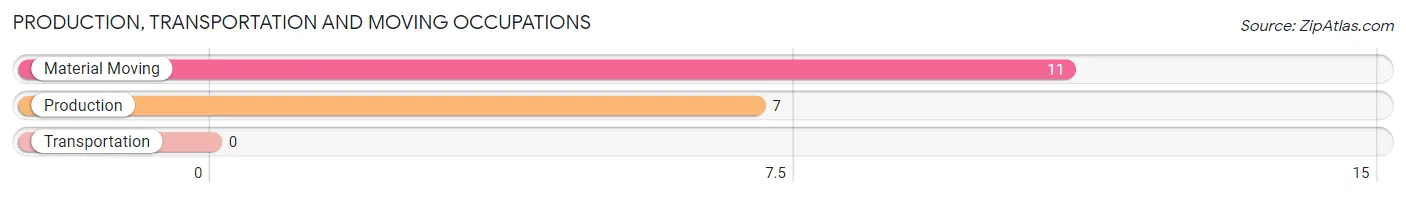
Production, Transportation and Moving Occupations by Sex
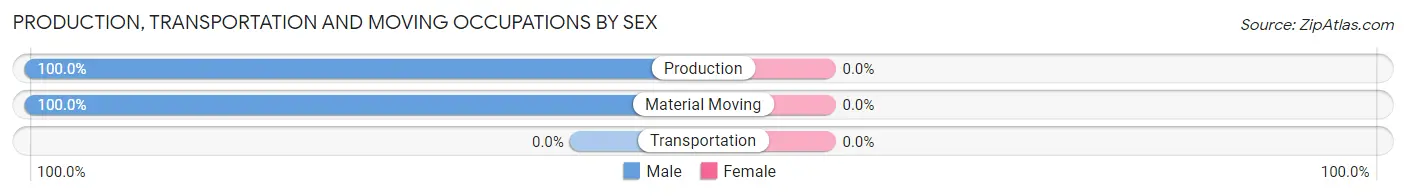
| Occupation | Male | Female |
| Production | 7 (100.0%) | 0 (0.0%) |
| Transportation | 0 (0.0%) | 0 (0.0%) |
| Material Moving | 11 (100.0%) | 0 (0.0%) |
| Total (Category) | 18 (100.0%) | 0 (0.0%) |
| Total (Overall) | 201 (58.8%) | 141 (41.2%) |
Employment Industries by Sex in South Hills
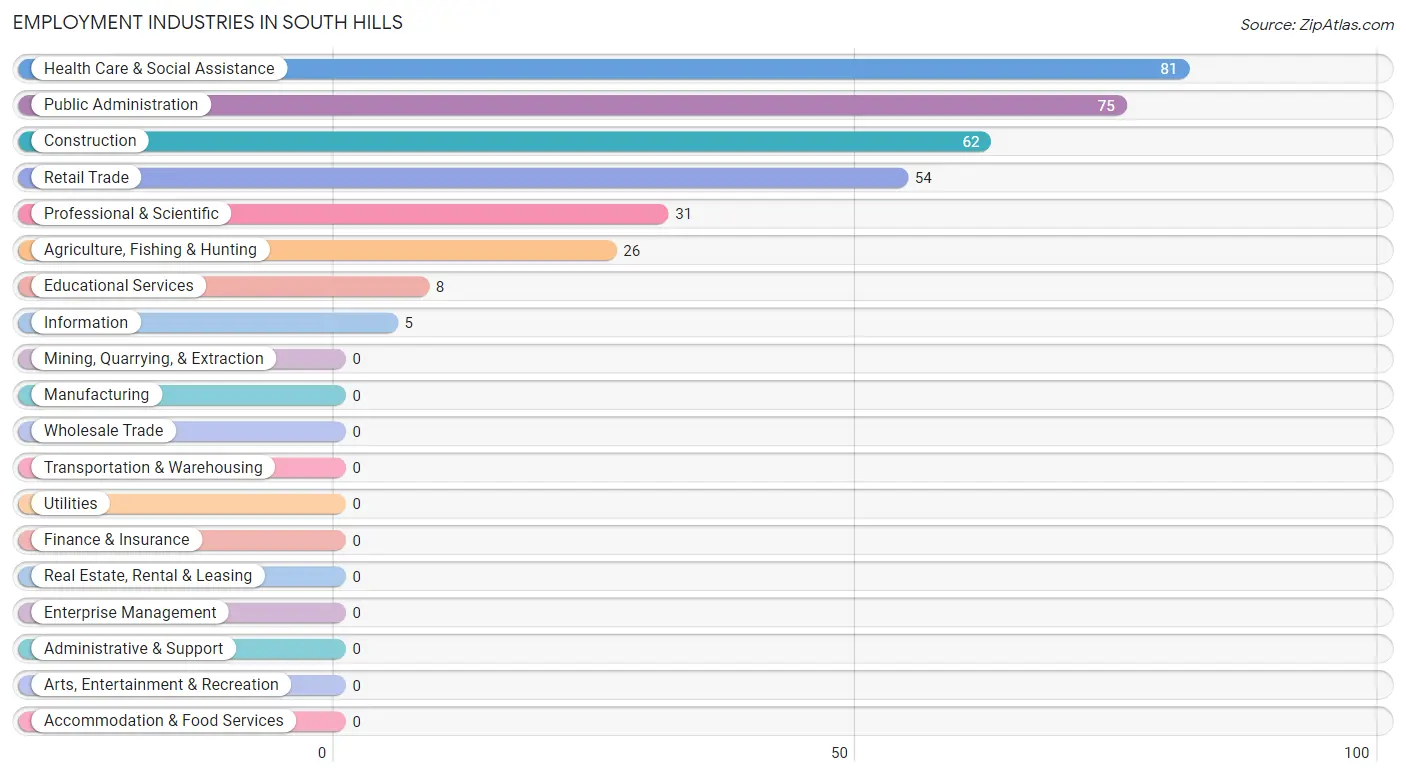
Employment Industries in South Hills
The major employment industries in South Hills include Health Care & Social Assistance (81 | 23.7%), Public Administration (75 | 21.9%), Construction (62 | 18.1%), Retail Trade (54 | 15.8%), and Professional & Scientific (31 | 9.1%).
Employment Industries by Sex in South Hills
The South Hills industries that see more men than women are Agriculture, Fishing & Hunting (100.0%), Retail Trade (100.0%), and Information (100.0%), whereas the industries that tend to have a higher number of women are Educational Services (100.0%), Public Administration (76.0%), and Health Care & Social Assistance (60.5%).
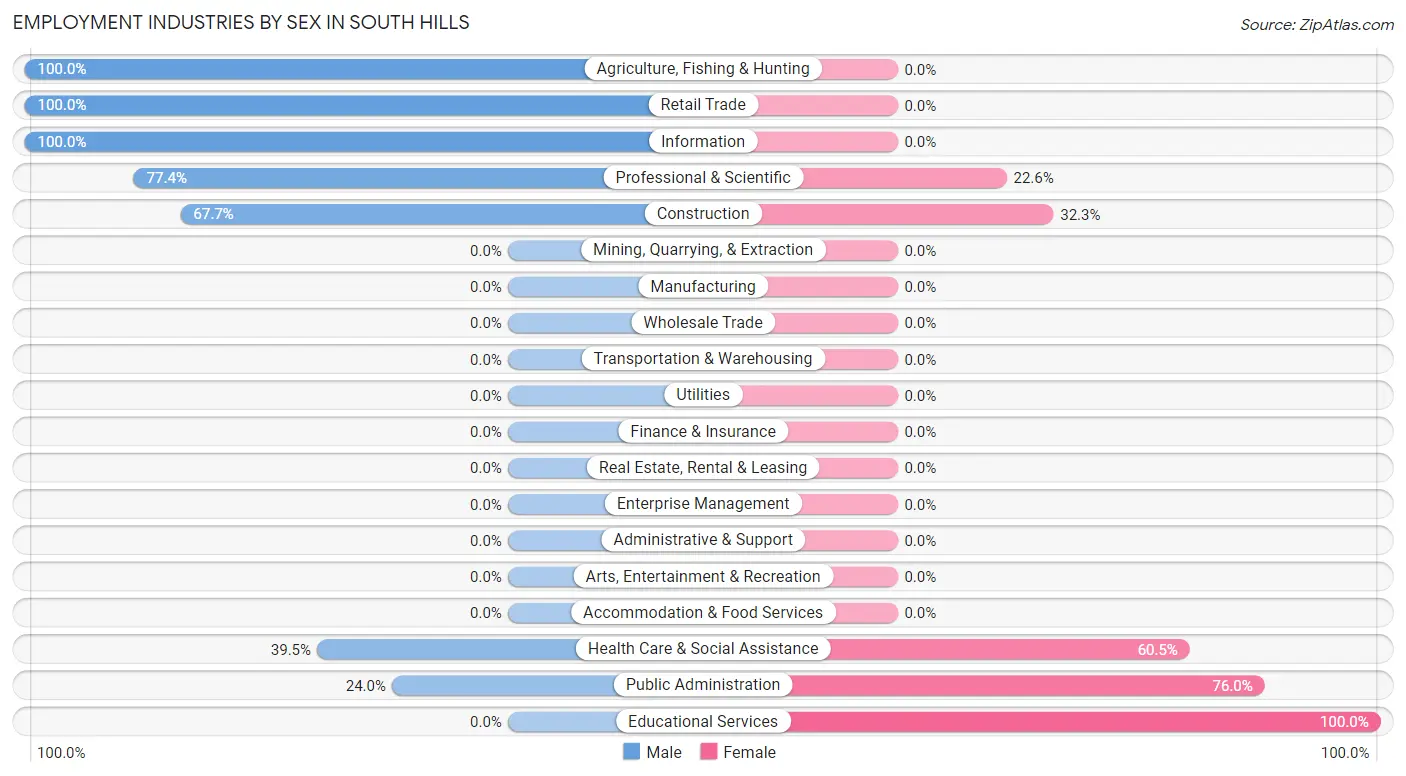
| Industry | Male | Female |
| Agriculture, Fishing & Hunting | 26 (100.0%) | 0 (0.0%) |
| Mining, Quarrying, & Extraction | 0 (0.0%) | 0 (0.0%) |
| Construction | 42 (67.7%) | 20 (32.3%) |
| Manufacturing | 0 (0.0%) | 0 (0.0%) |
| Wholesale Trade | 0 (0.0%) | 0 (0.0%) |
| Retail Trade | 54 (100.0%) | 0 (0.0%) |
| Transportation & Warehousing | 0 (0.0%) | 0 (0.0%) |
| Utilities | 0 (0.0%) | 0 (0.0%) |
| Information | 5 (100.0%) | 0 (0.0%) |
| Finance & Insurance | 0 (0.0%) | 0 (0.0%) |
| Real Estate, Rental & Leasing | 0 (0.0%) | 0 (0.0%) |
| Professional & Scientific | 24 (77.4%) | 7 (22.6%) |
| Enterprise Management | 0 (0.0%) | 0 (0.0%) |
| Administrative & Support | 0 (0.0%) | 0 (0.0%) |
| Educational Services | 0 (0.0%) | 8 (100.0%) |
| Health Care & Social Assistance | 32 (39.5%) | 49 (60.5%) |
| Arts, Entertainment & Recreation | 0 (0.0%) | 0 (0.0%) |
| Accommodation & Food Services | 0 (0.0%) | 0 (0.0%) |
| Public Administration | 18 (24.0%) | 57 (76.0%) |
| Total | 201 (58.8%) | 141 (41.2%) |
Education in South Hills
School Enrollment in South Hills
The most common levels of schooling among the 185 students in South Hills are high school (77 | 41.6%), middle school (45 | 24.3%), and college / undergraduate (39 | 21.1%).
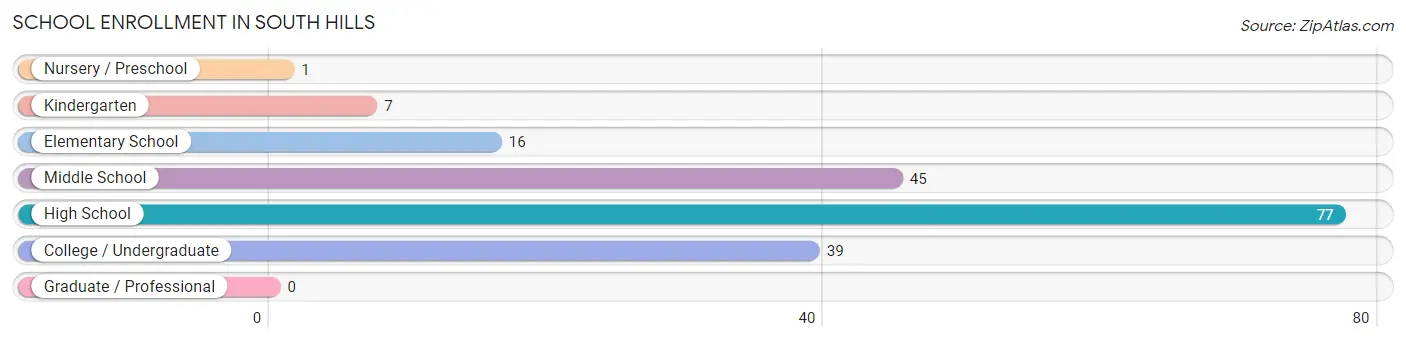
| School Level | # Students | % Students |
| Nursery / Preschool | 1 | 0.5% |
| Kindergarten | 7 | 3.8% |
| Elementary School | 16 | 8.6% |
| Middle School | 45 | 24.3% |
| High School | 77 | 41.6% |
| College / Undergraduate | 39 | 21.1% |
| Graduate / Professional | 0 | 0.0% |
| Total | 185 | 100.0% |
School Enrollment by Age by Funding Source in South Hills
Out of a total of 185 students who are enrolled in schools in South Hills, 1 (0.5%) attend a private institution, while the remaining 184 (99.5%) are enrolled in public schools. The age group of 3 to 4 year olds has the highest likelihood of being enrolled in private schools, with 1 (100.0% in the age bracket) enrolled. Conversely, the age group of 5 to 9 year old has the lowest likelihood of being enrolled in a private school, with 23 (100.0% in the age bracket) attending a public institution.
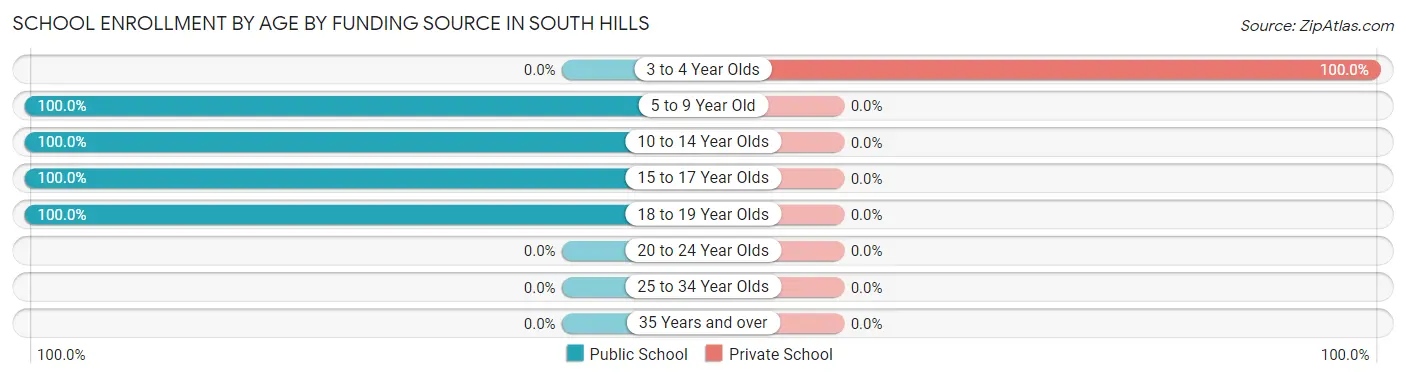
| Age Bracket | Public School | Private School |
| 3 to 4 Year Olds | 0 (0.0%) | 1 (100.0%) |
| 5 to 9 Year Old | 23 (100.0%) | 0 (0.0%) |
| 10 to 14 Year Olds | 53 (100.0%) | 0 (0.0%) |
| 15 to 17 Year Olds | 51 (100.0%) | 0 (0.0%) |
| 18 to 19 Year Olds | 57 (100.0%) | 0 (0.0%) |
| 20 to 24 Year Olds | 0 (0.0%) | 0 (0.0%) |
| 25 to 34 Year Olds | 0 (0.0%) | 0 (0.0%) |
| 35 Years and over | 0 (0.0%) | 0 (0.0%) |
| Total | 184 (99.5%) | 1 (0.5%) |
Educational Attainment by Field of Study in South Hills
Science & technology (63 | 22.9%), liberal arts & history (33 | 12.0%), bio, nature & agricultural (30 | 10.9%), education (29 | 10.5%), and social sciences (22 | 8.0%) are the most common fields of study among 275 individuals in South Hills who have obtained a bachelor's degree or higher.
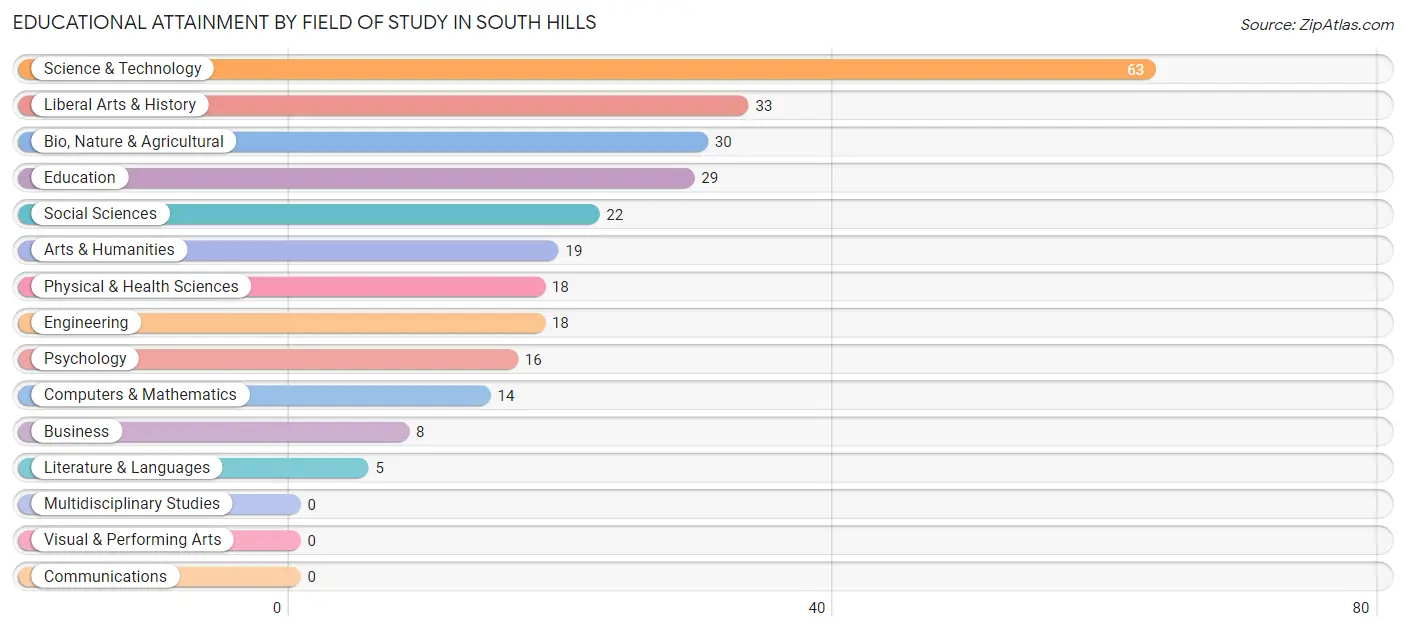
| Field of Study | # Graduates | % Graduates |
| Computers & Mathematics | 14 | 5.1% |
| Bio, Nature & Agricultural | 30 | 10.9% |
| Physical & Health Sciences | 18 | 6.6% |
| Psychology | 16 | 5.8% |
| Social Sciences | 22 | 8.0% |
| Engineering | 18 | 6.6% |
| Multidisciplinary Studies | 0 | 0.0% |
| Science & Technology | 63 | 22.9% |
| Business | 8 | 2.9% |
| Education | 29 | 10.5% |
| Literature & Languages | 5 | 1.8% |
| Liberal Arts & History | 33 | 12.0% |
| Visual & Performing Arts | 0 | 0.0% |
| Communications | 0 | 0.0% |
| Arts & Humanities | 19 | 6.9% |
| Total | 275 | 100.0% |
Transportation & Commute in South Hills
Vehicle Availability by Sex in South Hills
The most prevalent vehicle ownership categories in South Hills are males with 3 vehicles (96, accounting for 49.5%) and females with 3 vehicles (55, making up 71.6%).
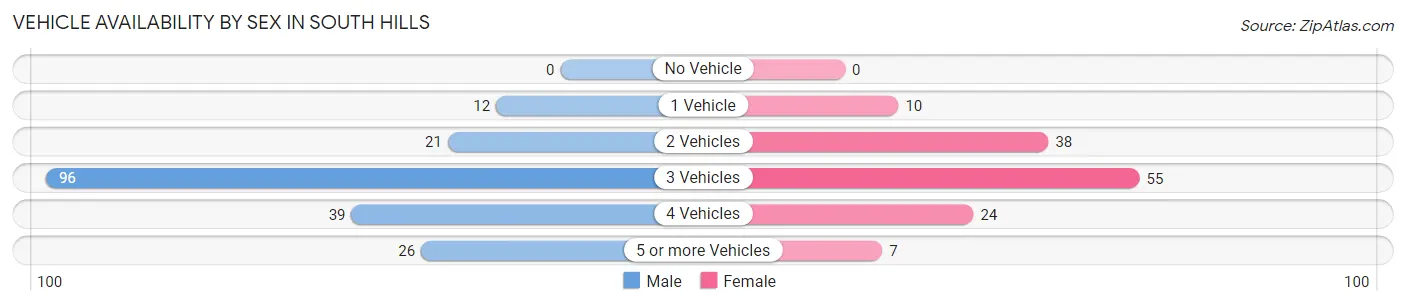
| Vehicles Available | Male | Female |
| No Vehicle | 0 (0.0%) | 0 (0.0%) |
| 1 Vehicle | 12 (6.2%) | 10 (7.5%) |
| 2 Vehicles | 21 (10.8%) | 38 (28.4%) |
| 3 Vehicles | 96 (49.5%) | 55 (41.0%) |
| 4 Vehicles | 39 (20.1%) | 24 (17.9%) |
| 5 or more Vehicles | 26 (13.4%) | 7 (5.2%) |
| Total | 194 (100.0%) | 134 (100.0%) |
Commute Time in South Hills
The most frequently occuring commute durations in South Hills are 10 to 14 minutes (107 commuters, 37.4%), 5 to 9 minutes (72 commuters, 25.2%), and 20 to 24 minutes (51 commuters, 17.8%).
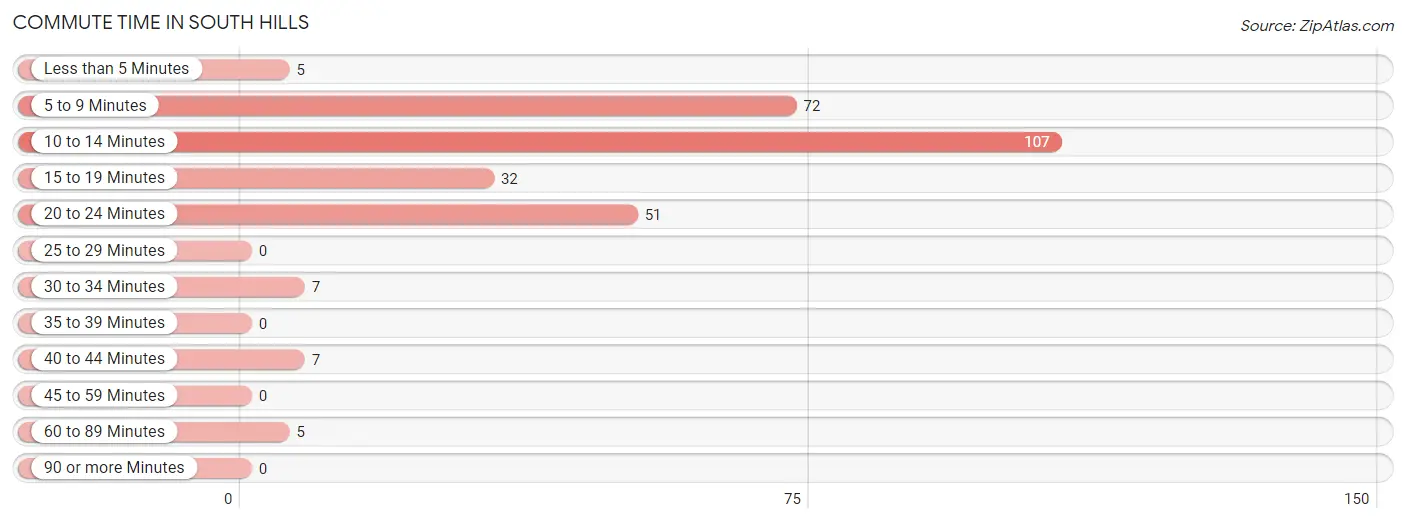
| Commute Time | # Commuters | % Commuters |
| Less than 5 Minutes | 5 | 1.8% |
| 5 to 9 Minutes | 72 | 25.2% |
| 10 to 14 Minutes | 107 | 37.4% |
| 15 to 19 Minutes | 32 | 11.2% |
| 20 to 24 Minutes | 51 | 17.8% |
| 25 to 29 Minutes | 0 | 0.0% |
| 30 to 34 Minutes | 7 | 2.5% |
| 35 to 39 Minutes | 0 | 0.0% |
| 40 to 44 Minutes | 7 | 2.5% |
| 45 to 59 Minutes | 0 | 0.0% |
| 60 to 89 Minutes | 5 | 1.8% |
| 90 or more Minutes | 0 | 0.0% |
Commute Time by Sex in South Hills
The most common commute times in South Hills are 10 to 14 minutes (73 commuters, 41.2%) for males and 5 to 9 minutes (48 commuters, 44.0%) for females.
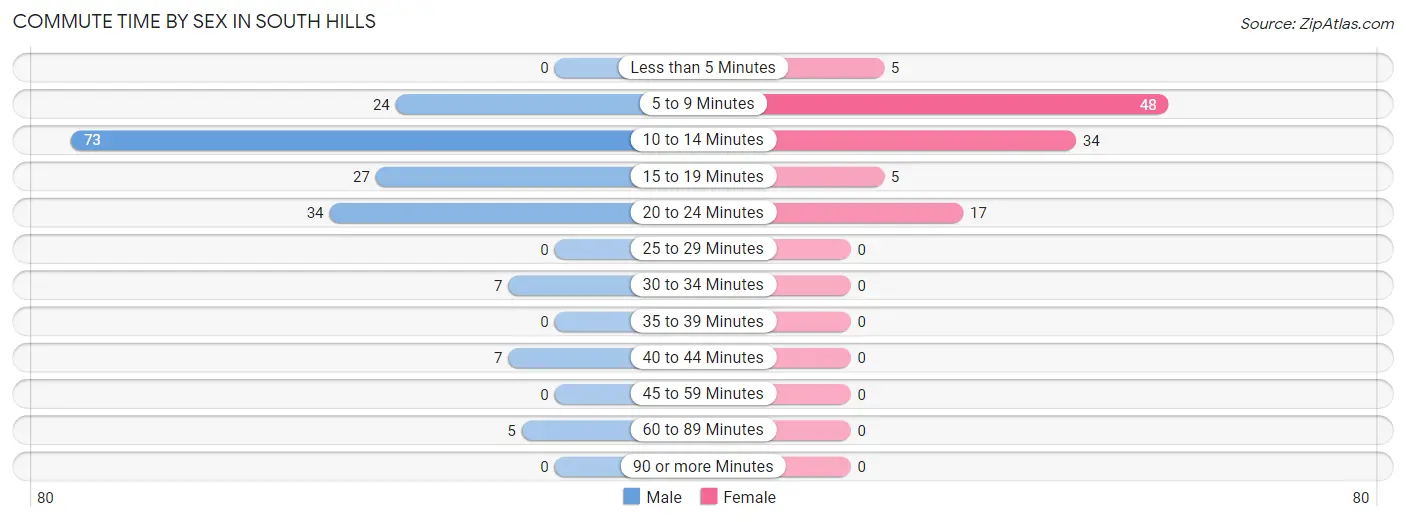
| Commute Time | Male | Female |
| Less than 5 Minutes | 0 (0.0%) | 5 (4.6%) |
| 5 to 9 Minutes | 24 (13.6%) | 48 (44.0%) |
| 10 to 14 Minutes | 73 (41.2%) | 34 (31.2%) |
| 15 to 19 Minutes | 27 (15.2%) | 5 (4.6%) |
| 20 to 24 Minutes | 34 (19.2%) | 17 (15.6%) |
| 25 to 29 Minutes | 0 (0.0%) | 0 (0.0%) |
| 30 to 34 Minutes | 7 (4.0%) | 0 (0.0%) |
| 35 to 39 Minutes | 0 (0.0%) | 0 (0.0%) |
| 40 to 44 Minutes | 7 (4.0%) | 0 (0.0%) |
| 45 to 59 Minutes | 0 (0.0%) | 0 (0.0%) |
| 60 to 89 Minutes | 5 (2.8%) | 0 (0.0%) |
| 90 or more Minutes | 0 (0.0%) | 0 (0.0%) |
Time of Departure to Work by Sex in South Hills
The most frequent times of departure to work in South Hills are 7:30 AM to 7:59 AM (41, 23.2%) for males and 7:30 AM to 7:59 AM (22, 20.2%) for females.
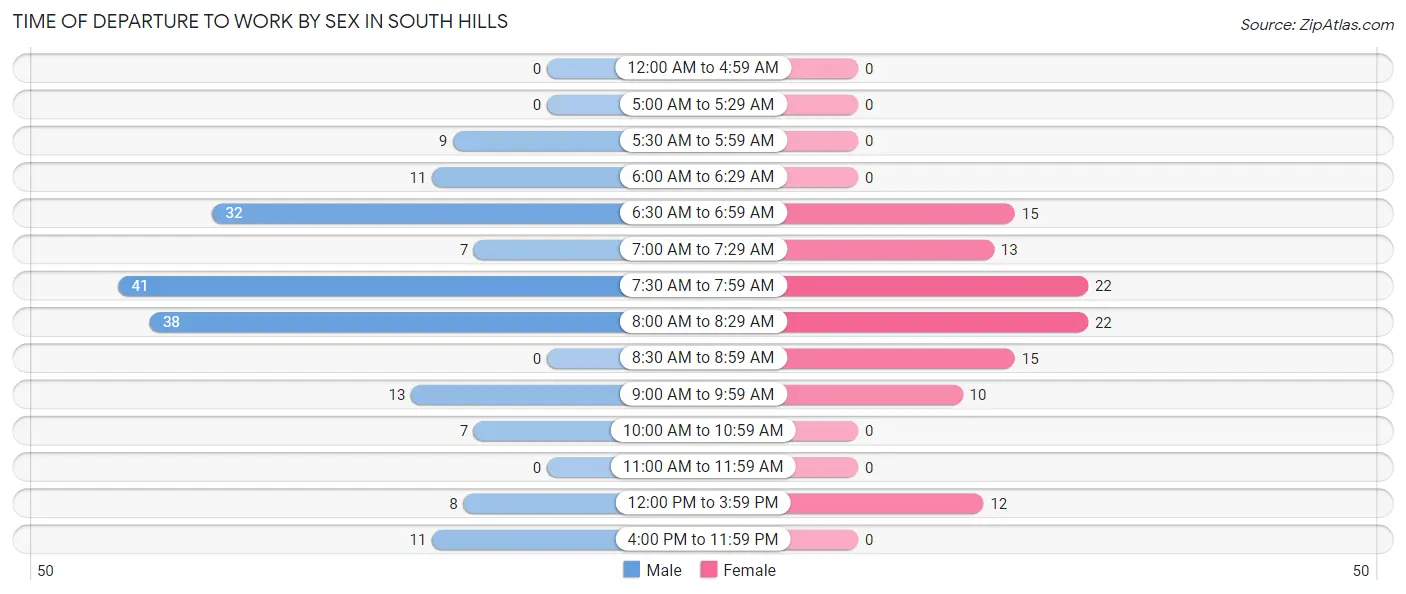
| Time of Departure | Male | Female |
| 12:00 AM to 4:59 AM | 0 (0.0%) | 0 (0.0%) |
| 5:00 AM to 5:29 AM | 0 (0.0%) | 0 (0.0%) |
| 5:30 AM to 5:59 AM | 9 (5.1%) | 0 (0.0%) |
| 6:00 AM to 6:29 AM | 11 (6.2%) | 0 (0.0%) |
| 6:30 AM to 6:59 AM | 32 (18.1%) | 15 (13.8%) |
| 7:00 AM to 7:29 AM | 7 (4.0%) | 13 (11.9%) |
| 7:30 AM to 7:59 AM | 41 (23.2%) | 22 (20.2%) |
| 8:00 AM to 8:29 AM | 38 (21.5%) | 22 (20.2%) |
| 8:30 AM to 8:59 AM | 0 (0.0%) | 15 (13.8%) |
| 9:00 AM to 9:59 AM | 13 (7.3%) | 10 (9.2%) |
| 10:00 AM to 10:59 AM | 7 (4.0%) | 0 (0.0%) |
| 11:00 AM to 11:59 AM | 0 (0.0%) | 0 (0.0%) |
| 12:00 PM to 3:59 PM | 8 (4.5%) | 12 (11.0%) |
| 4:00 PM to 11:59 PM | 11 (6.2%) | 0 (0.0%) |
| Total | 177 (100.0%) | 109 (100.0%) |
Housing Occupancy in South Hills
Occupancy by Ownership in South Hills
Of the total 214 dwellings in South Hills, owner-occupied units account for 210 (98.1%), while renter-occupied units make up 4 (1.9%).
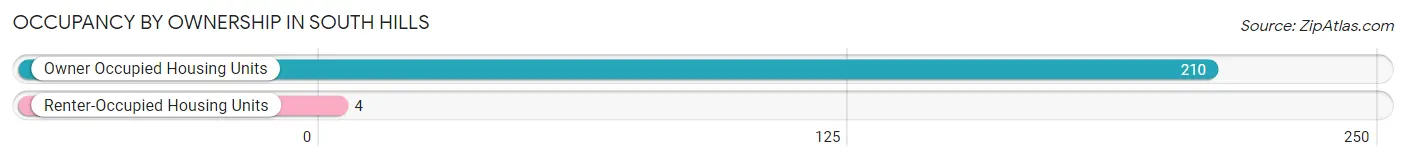
| Occupancy | # Housing Units | % Housing Units |
| Owner Occupied Housing Units | 210 | 98.1% |
| Renter-Occupied Housing Units | 4 | 1.9% |
| Total Occupied Housing Units | 214 | 100.0% |
Occupancy by Household Size in South Hills
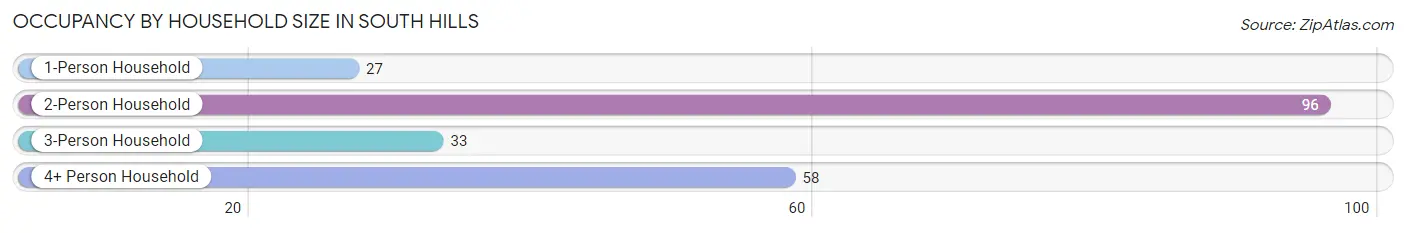
| Household Size | # Housing Units | % Housing Units |
| 1-Person Household | 27 | 12.6% |
| 2-Person Household | 96 | 44.9% |
| 3-Person Household | 33 | 15.4% |
| 4+ Person Household | 58 | 27.1% |
| Total Housing Units | 214 | 100.0% |
Occupancy by Ownership by Household Size in South Hills
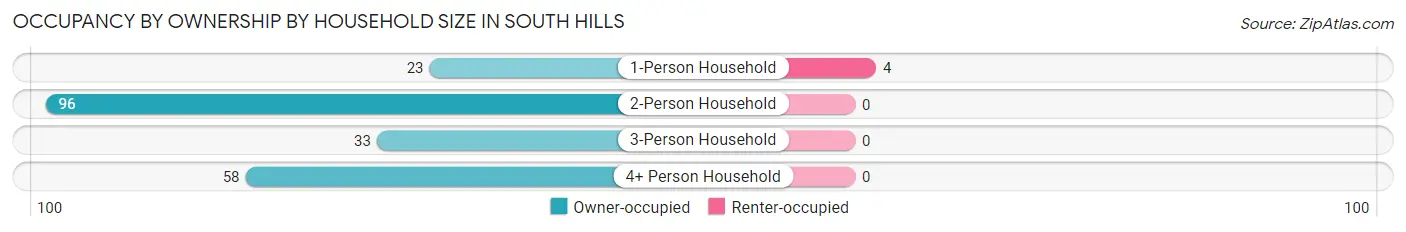
| Household Size | Owner-occupied | Renter-occupied |
| 1-Person Household | 23 (85.2%) | 4 (14.8%) |
| 2-Person Household | 96 (100.0%) | 0 (0.0%) |
| 3-Person Household | 33 (100.0%) | 0 (0.0%) |
| 4+ Person Household | 58 (100.0%) | 0 (0.0%) |
| Total Housing Units | 210 (98.1%) | 4 (1.9%) |
Occupancy by Educational Attainment in South Hills
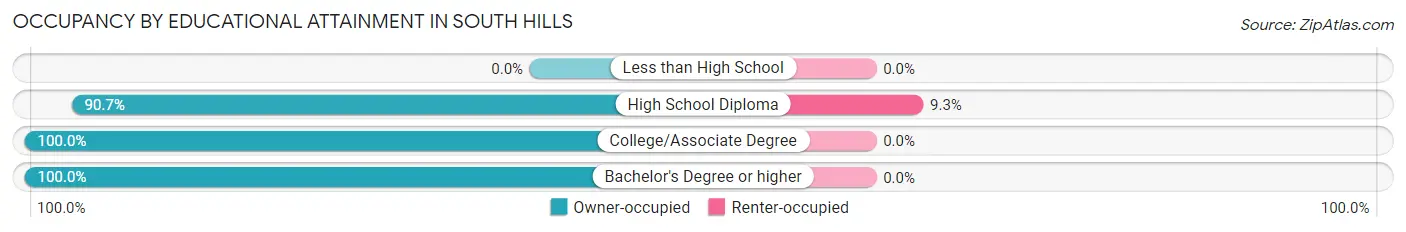
| Household Size | Owner-occupied | Renter-occupied |
| Less than High School | 0 (0.0%) | 0 (0.0%) |
| High School Diploma | 39 (90.7%) | 4 (9.3%) |
| College/Associate Degree | 28 (100.0%) | 0 (0.0%) |
| Bachelor's Degree or higher | 143 (100.0%) | 0 (0.0%) |
Occupancy by Age of Householder in South Hills
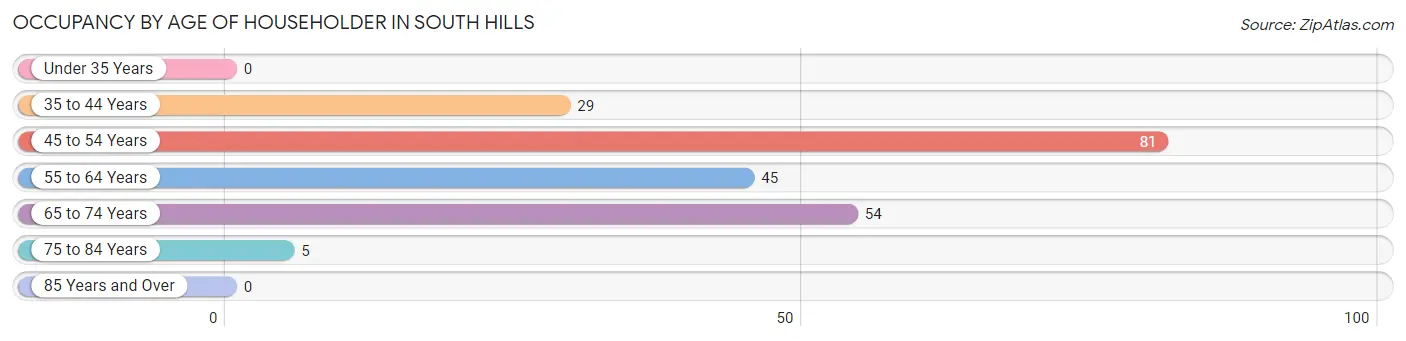
| Age Bracket | # Households | % Households |
| Under 35 Years | 0 | 0.0% |
| 35 to 44 Years | 29 | 13.6% |
| 45 to 54 Years | 81 | 37.9% |
| 55 to 64 Years | 45 | 21.0% |
| 65 to 74 Years | 54 | 25.2% |
| 75 to 84 Years | 5 | 2.3% |
| 85 Years and Over | 0 | 0.0% |
| Total | 214 | 100.0% |
Housing Finances in South Hills
Median Income by Occupancy in South Hills
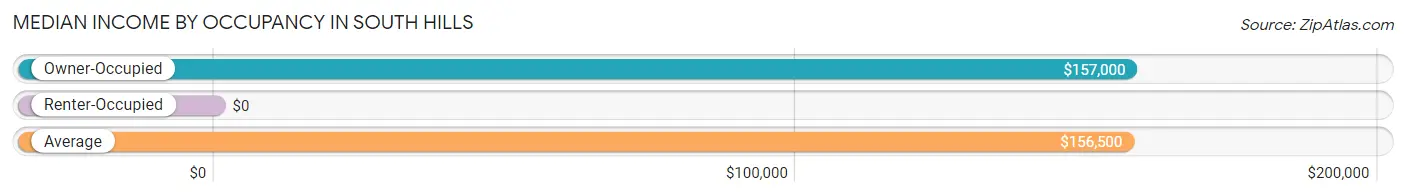
| Occupancy Type | # Households | Median Income |
| Owner-Occupied | 210 (98.1%) | $157,000 |
| Renter-Occupied | 4 (1.9%) | $0 |
| Average | 214 (100.0%) | $156,500 |
Occupancy by Householder Income Bracket in South Hills
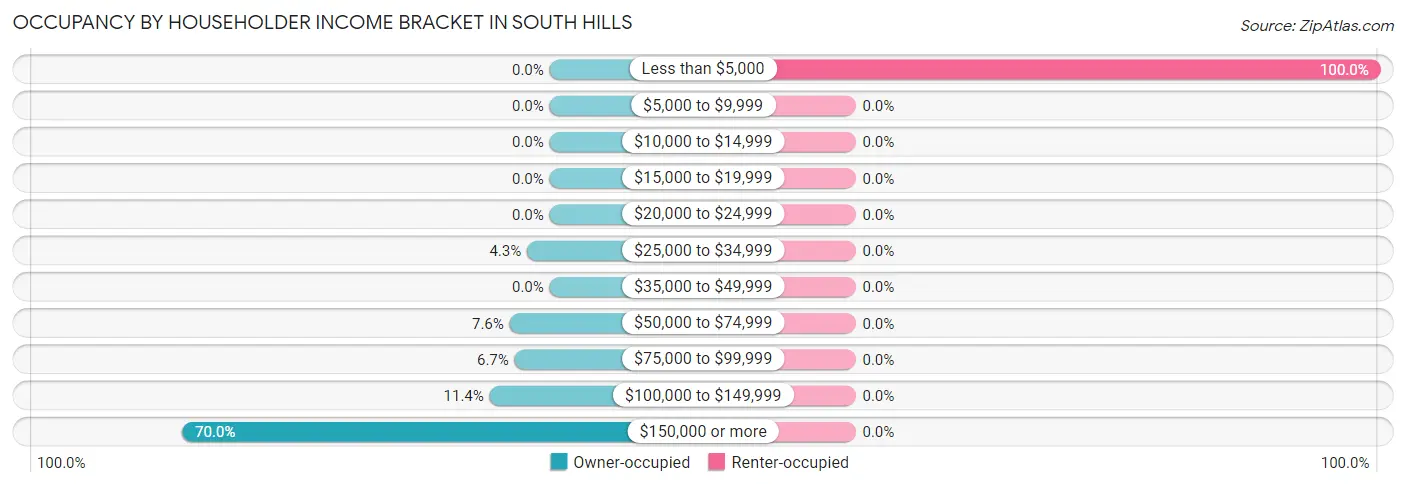
| Income Bracket | Owner-occupied | Renter-occupied |
| Less than $5,000 | 0 (0.0%) | 4 (100.0%) |
| $5,000 to $9,999 | 0 (0.0%) | 0 (0.0%) |
| $10,000 to $14,999 | 0 (0.0%) | 0 (0.0%) |
| $15,000 to $19,999 | 0 (0.0%) | 0 (0.0%) |
| $20,000 to $24,999 | 0 (0.0%) | 0 (0.0%) |
| $25,000 to $34,999 | 9 (4.3%) | 0 (0.0%) |
| $35,000 to $49,999 | 0 (0.0%) | 0 (0.0%) |
| $50,000 to $74,999 | 16 (7.6%) | 0 (0.0%) |
| $75,000 to $99,999 | 14 (6.7%) | 0 (0.0%) |
| $100,000 to $149,999 | 24 (11.4%) | 0 (0.0%) |
| $150,000 or more | 147 (70.0%) | 0 (0.0%) |
| Total | 210 (100.0%) | 4 (100.0%) |
Monthly Housing Cost Tiers in South Hills
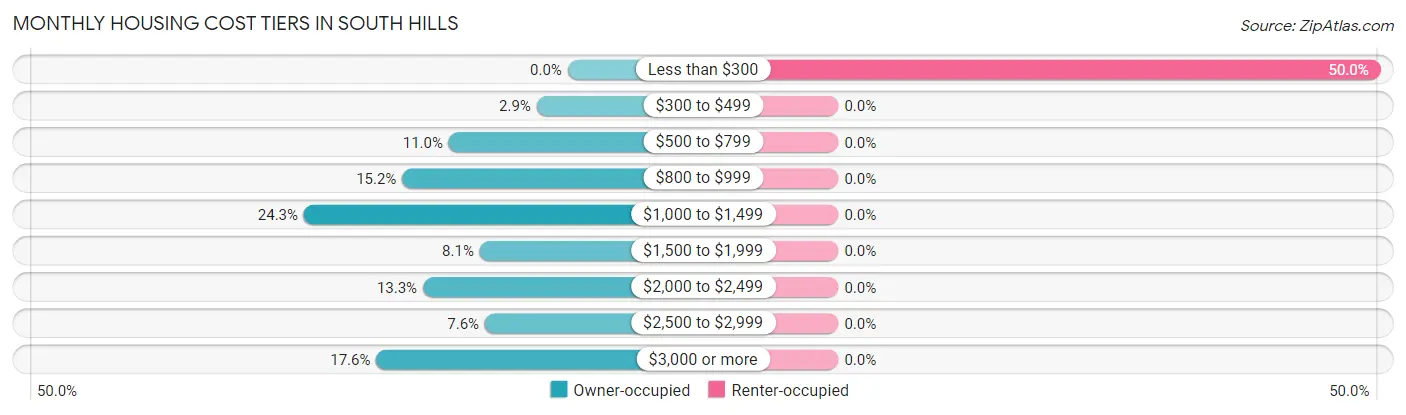
| Monthly Cost | Owner-occupied | Renter-occupied |
| Less than $300 | 0 (0.0%) | 2 (50.0%) |
| $300 to $499 | 6 (2.9%) | 0 (0.0%) |
| $500 to $799 | 23 (11.0%) | 0 (0.0%) |
| $800 to $999 | 32 (15.2%) | 0 (0.0%) |
| $1,000 to $1,499 | 51 (24.3%) | 0 (0.0%) |
| $1,500 to $1,999 | 17 (8.1%) | 0 (0.0%) |
| $2,000 to $2,499 | 28 (13.3%) | 0 (0.0%) |
| $2,500 to $2,999 | 16 (7.6%) | 0 (0.0%) |
| $3,000 or more | 37 (17.6%) | 0 (0.0%) |
| Total | 210 (100.0%) | 4 (100.0%) |
Physical Housing Characteristics in South Hills
Housing Structures in South Hills
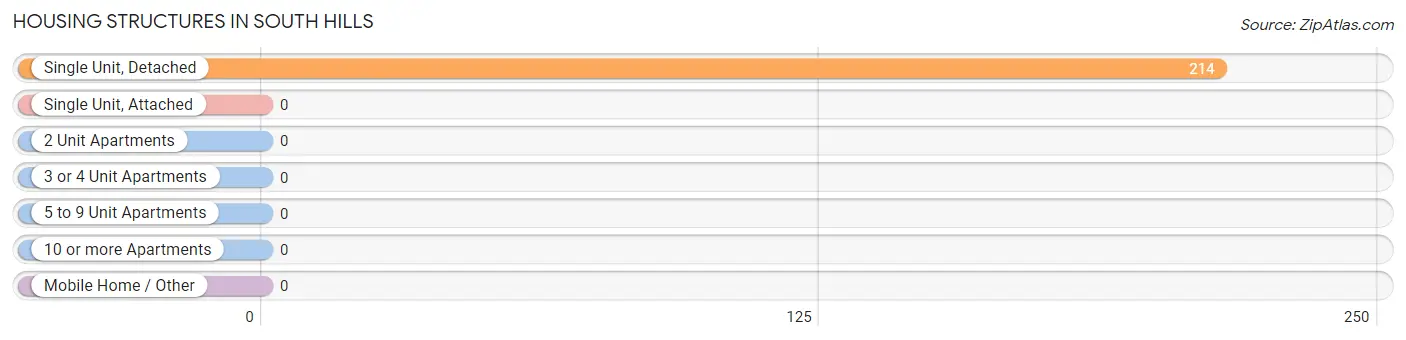
| Structure Type | # Housing Units | % Housing Units |
| Single Unit, Detached | 214 | 100.0% |
| Single Unit, Attached | 0 | 0.0% |
| 2 Unit Apartments | 0 | 0.0% |
| 3 or 4 Unit Apartments | 0 | 0.0% |
| 5 to 9 Unit Apartments | 0 | 0.0% |
| 10 or more Apartments | 0 | 0.0% |
| Mobile Home / Other | 0 | 0.0% |
| Total | 214 | 100.0% |
Housing Structures by Occupancy in South Hills
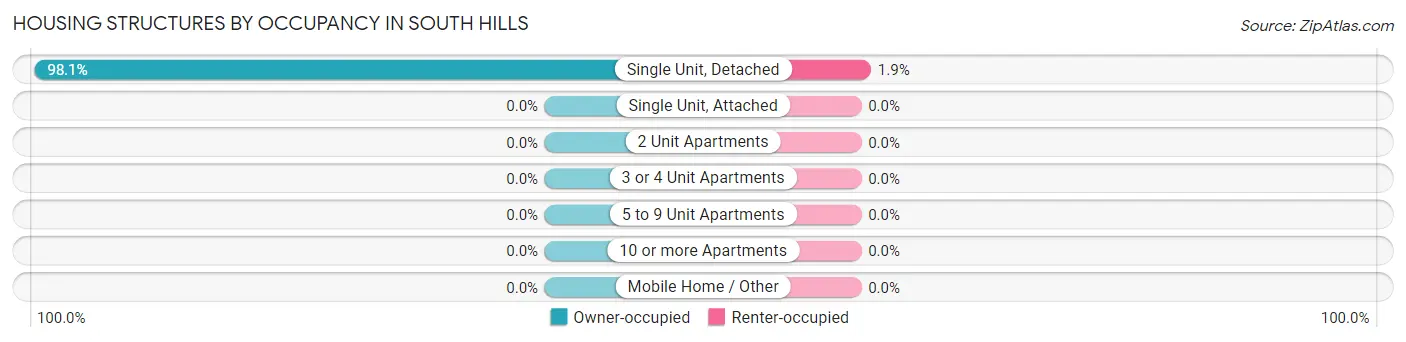
| Structure Type | Owner-occupied | Renter-occupied |
| Single Unit, Detached | 210 (98.1%) | 4 (1.9%) |
| Single Unit, Attached | 0 (0.0%) | 0 (0.0%) |
| 2 Unit Apartments | 0 (0.0%) | 0 (0.0%) |
| 3 or 4 Unit Apartments | 0 (0.0%) | 0 (0.0%) |
| 5 to 9 Unit Apartments | 0 (0.0%) | 0 (0.0%) |
| 10 or more Apartments | 0 (0.0%) | 0 (0.0%) |
| Mobile Home / Other | 0 (0.0%) | 0 (0.0%) |
| Total | 210 (98.1%) | 4 (1.9%) |
Housing Structures by Number of Rooms in South Hills
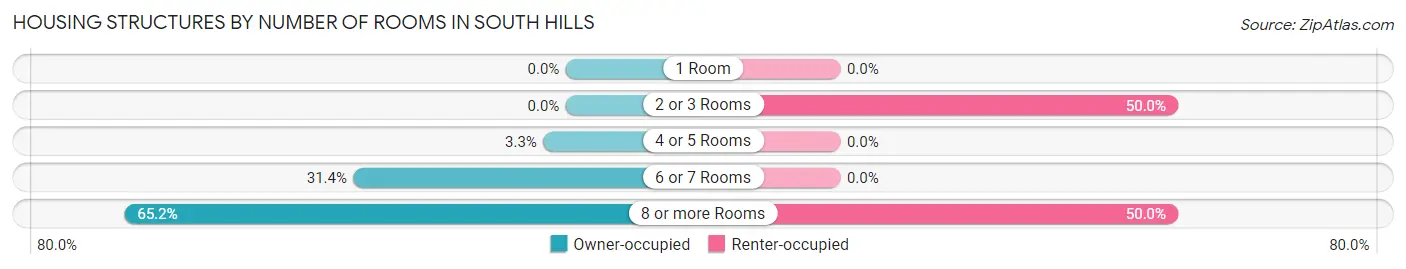
| Number of Rooms | Owner-occupied | Renter-occupied |
| 1 Room | 0 (0.0%) | 0 (0.0%) |
| 2 or 3 Rooms | 0 (0.0%) | 2 (50.0%) |
| 4 or 5 Rooms | 7 (3.3%) | 0 (0.0%) |
| 6 or 7 Rooms | 66 (31.4%) | 0 (0.0%) |
| 8 or more Rooms | 137 (65.2%) | 2 (50.0%) |
| Total | 210 (100.0%) | 4 (100.0%) |
Housing Structure by Heating Type in South Hills
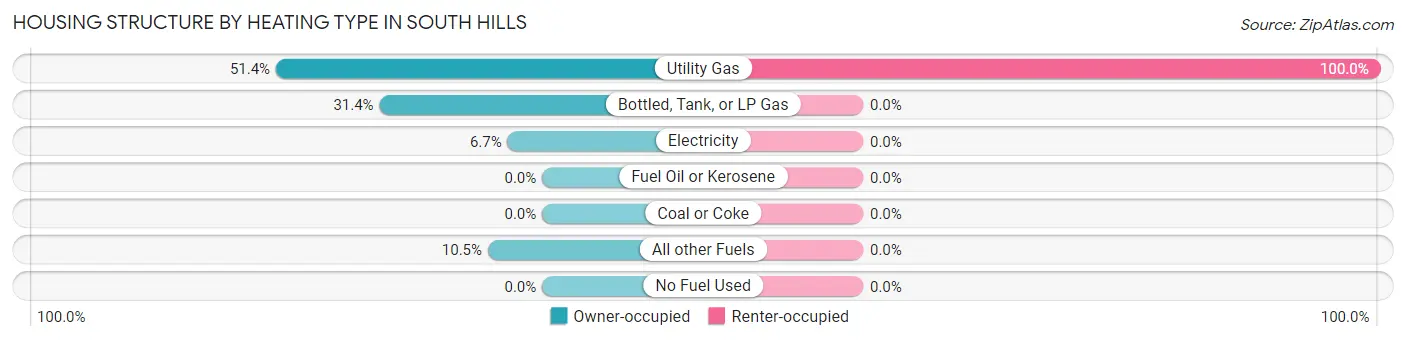
| Heating Type | Owner-occupied | Renter-occupied |
| Utility Gas | 108 (51.4%) | 4 (100.0%) |
| Bottled, Tank, or LP Gas | 66 (31.4%) | 0 (0.0%) |
| Electricity | 14 (6.7%) | 0 (0.0%) |
| Fuel Oil or Kerosene | 0 (0.0%) | 0 (0.0%) |
| Coal or Coke | 0 (0.0%) | 0 (0.0%) |
| All other Fuels | 22 (10.5%) | 0 (0.0%) |
| No Fuel Used | 0 (0.0%) | 0 (0.0%) |
| Total | 210 (100.0%) | 4 (100.0%) |
Household Vehicle Usage in South Hills
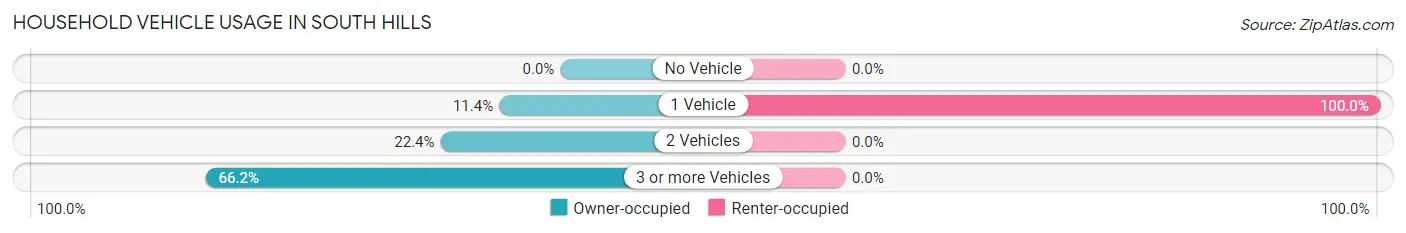
| Vehicles per Household | Owner-occupied | Renter-occupied |
| No Vehicle | 0 (0.0%) | 0 (0.0%) |
| 1 Vehicle | 24 (11.4%) | 4 (100.0%) |
| 2 Vehicles | 47 (22.4%) | 0 (0.0%) |
| 3 or more Vehicles | 139 (66.2%) | 0 (0.0%) |
| Total | 210 (100.0%) | 4 (100.0%) |
Real Estate & Mortgages in South Hills
Real Estate and Mortgage Overview in South Hills
| Characteristic | Without Mortgage | With Mortgage |
| Housing Units | 80 | 130 |
| Median Property Value | $680,000 | $500,000 |
| Median Household Income | $190,500 | $96 |
| Monthly Housing Costs | $879 | $37 |
| Real Estate Taxes | $5,577 | $0 |
Property Value by Mortgage Status in South Hills
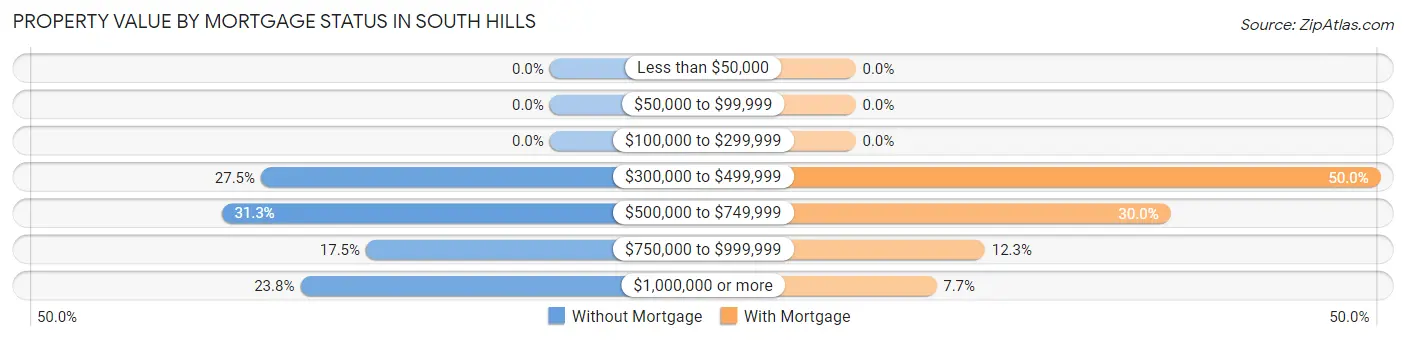
| Property Value | Without Mortgage | With Mortgage |
| Less than $50,000 | 0 (0.0%) | 0 (0.0%) |
| $50,000 to $99,999 | 0 (0.0%) | 0 (0.0%) |
| $100,000 to $299,999 | 0 (0.0%) | 0 (0.0%) |
| $300,000 to $499,999 | 22 (27.5%) | 65 (50.0%) |
| $500,000 to $749,999 | 25 (31.2%) | 39 (30.0%) |
| $750,000 to $999,999 | 14 (17.5%) | 16 (12.3%) |
| $1,000,000 or more | 19 (23.7%) | 10 (7.7%) |
| Total | 80 (100.0%) | 130 (100.0%) |
Household Income by Mortgage Status in South Hills
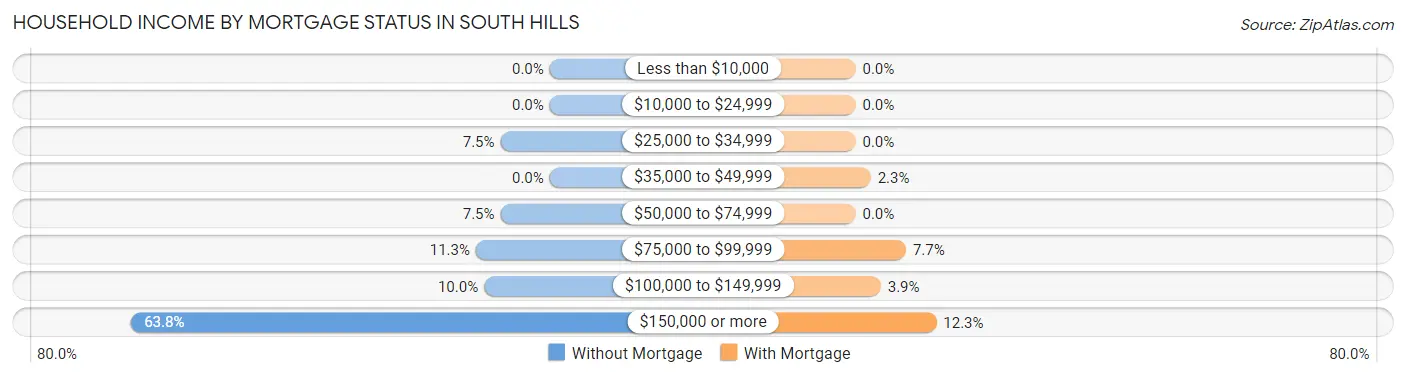
| Household Income | Without Mortgage | With Mortgage |
| Less than $10,000 | 0 (0.0%) | 0 (0.0%) |
| $10,000 to $24,999 | 0 (0.0%) | 0 (0.0%) |
| $25,000 to $34,999 | 6 (7.5%) | 0 (0.0%) |
| $35,000 to $49,999 | 0 (0.0%) | 3 (2.3%) |
| $50,000 to $74,999 | 6 (7.5%) | 0 (0.0%) |
| $75,000 to $99,999 | 9 (11.3%) | 10 (7.7%) |
| $100,000 to $149,999 | 8 (10.0%) | 5 (3.8%) |
| $150,000 or more | 51 (63.7%) | 16 (12.3%) |
| Total | 80 (100.0%) | 130 (100.0%) |
Property Value to Household Income Ratio in South Hills
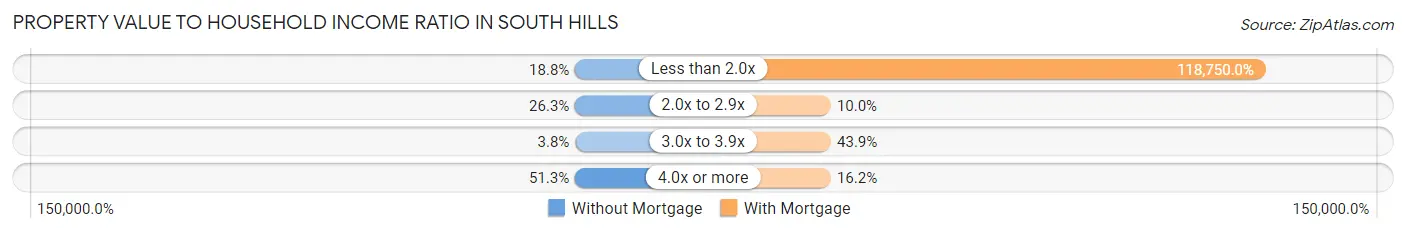
| Value-to-Income Ratio | Without Mortgage | With Mortgage |
| Less than 2.0x | 15 (18.8%) | 154,375 (118,750.0%) |
| 2.0x to 2.9x | 21 (26.3%) | 13 (10.0%) |
| 3.0x to 3.9x | 3 (3.7%) | 57 (43.9%) |
| 4.0x or more | 41 (51.2%) | 21 (16.2%) |
| Total | 80 (100.0%) | 130 (100.0%) |
Real Estate Taxes by Mortgage Status in South Hills
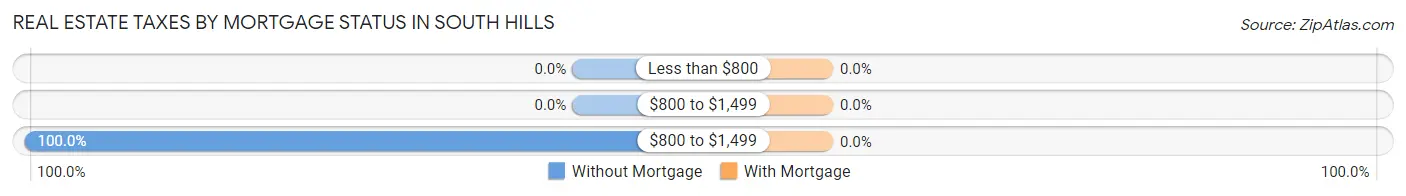
| Property Taxes | Without Mortgage | With Mortgage |
| Less than $800 | 0 (0.0%) | 0 (0.0%) |
| $800 to $1,499 | 0 (0.0%) | 0 (0.0%) |
| $800 to $1,499 | 80 (100.0%) | 0 (0.0%) |
| Total | 80 (100.0%) | 130 (100.0%) |
Health & Disability in South Hills
Health Insurance Coverage by Age in South Hills
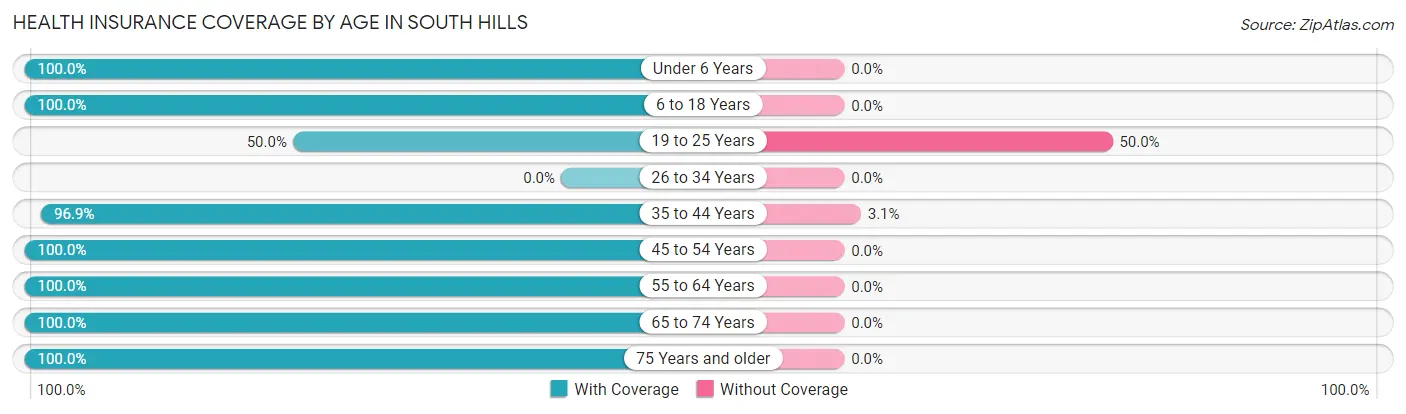
| Age Bracket | With Coverage | Without Coverage |
| Under 6 Years | 8 (100.0%) | 0 (0.0%) |
| 6 to 18 Years | 165 (100.0%) | 0 (0.0%) |
| 19 to 25 Years | 19 (50.0%) | 19 (50.0%) |
| 26 to 34 Years | 0 (0.0%) | 0 (0.0%) |
| 35 to 44 Years | 63 (96.9%) | 2 (3.1%) |
| 45 to 54 Years | 145 (100.0%) | 0 (0.0%) |
| 55 to 64 Years | 126 (100.0%) | 0 (0.0%) |
| 65 to 74 Years | 77 (100.0%) | 0 (0.0%) |
| 75 Years and older | 5 (100.0%) | 0 (0.0%) |
| Total | 608 (96.7%) | 21 (3.3%) |
Health Insurance Coverage by Citizenship Status in South Hills
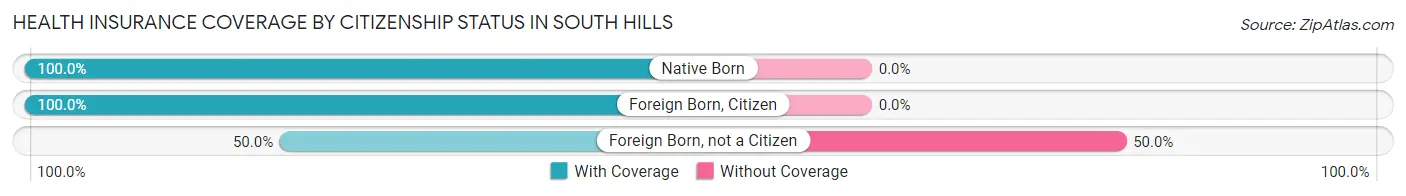
| Citizenship Status | With Coverage | Without Coverage |
| Native Born | 8 (100.0%) | 0 (0.0%) |
| Foreign Born, Citizen | 165 (100.0%) | 0 (0.0%) |
| Foreign Born, not a Citizen | 19 (50.0%) | 19 (50.0%) |
Health Insurance Coverage by Household Income in South Hills
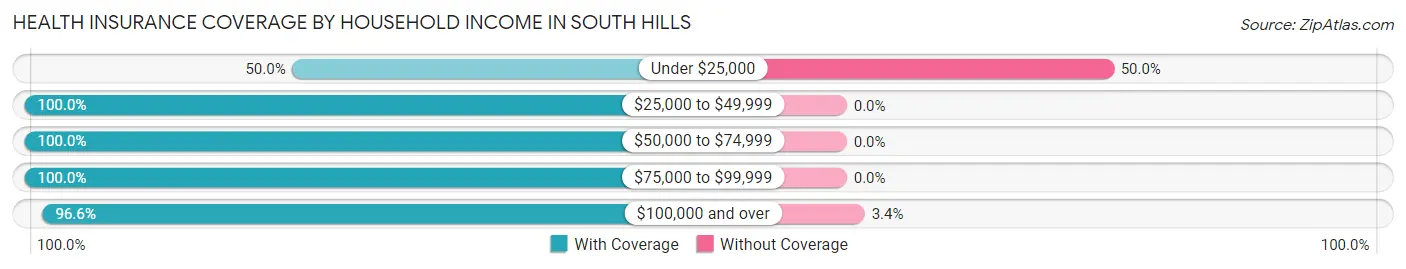
| Household Income | With Coverage | Without Coverage |
| Under $25,000 | 2 (50.0%) | 2 (50.0%) |
| $25,000 to $49,999 | 19 (100.0%) | 0 (0.0%) |
| $50,000 to $74,999 | 27 (100.0%) | 0 (0.0%) |
| $75,000 to $99,999 | 14 (100.0%) | 0 (0.0%) |
| $100,000 and over | 546 (96.6%) | 19 (3.4%) |
Public vs Private Health Insurance Coverage by Age in South Hills
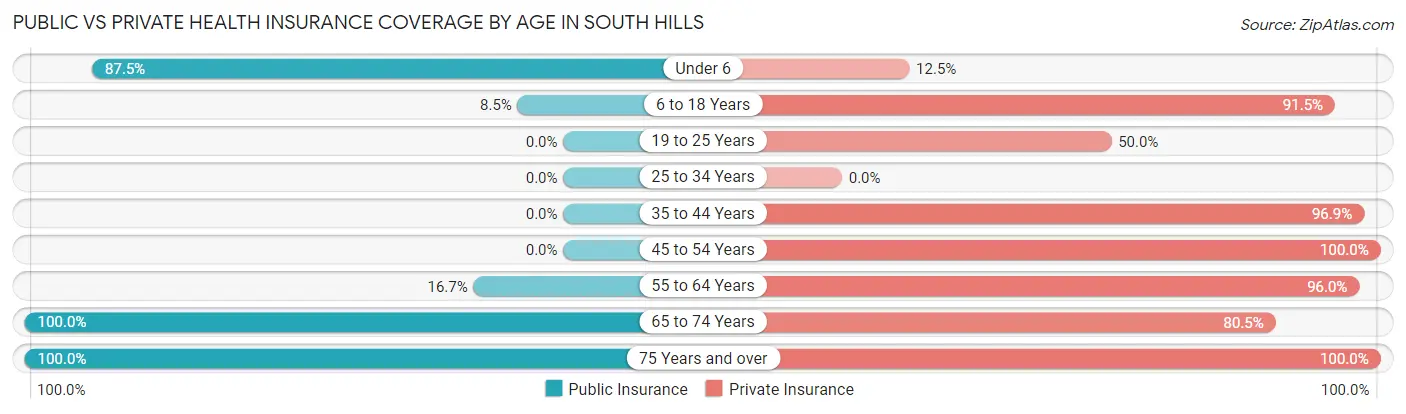
| Age Bracket | Public Insurance | Private Insurance |
| Under 6 | 7 (87.5%) | 1 (12.5%) |
| 6 to 18 Years | 14 (8.5%) | 151 (91.5%) |
| 19 to 25 Years | 0 (0.0%) | 19 (50.0%) |
| 25 to 34 Years | 0 (0.0%) | 0 (0.0%) |
| 35 to 44 Years | 0 (0.0%) | 63 (96.9%) |
| 45 to 54 Years | 0 (0.0%) | 145 (100.0%) |
| 55 to 64 Years | 21 (16.7%) | 121 (96.0%) |
| 65 to 74 Years | 77 (100.0%) | 62 (80.5%) |
| 75 Years and over | 5 (100.0%) | 5 (100.0%) |
| Total | 124 (19.7%) | 567 (90.1%) |
Disability Status by Sex by Age in South Hills
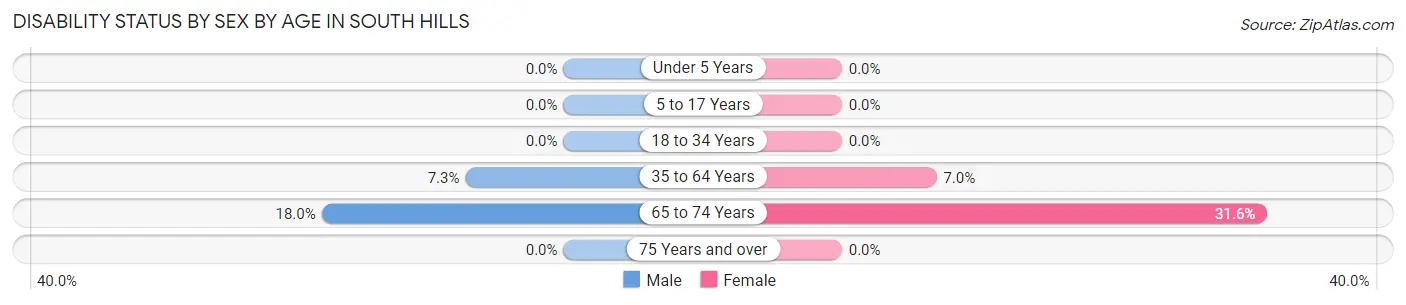
| Age Bracket | Male | Female |
| Under 5 Years | 0 (0.0%) | 0 (0.0%) |
| 5 to 17 Years | 0 (0.0%) | 0 (0.0%) |
| 18 to 34 Years | 0 (0.0%) | 0 (0.0%) |
| 35 to 64 Years | 11 (7.3%) | 13 (7.0%) |
| 65 to 74 Years | 7 (17.9%) | 12 (31.6%) |
| 75 Years and over | 0 (0.0%) | 0 (0.0%) |
Disability Class by Sex by Age in South Hills
Disability Class: Hearing Difficulty
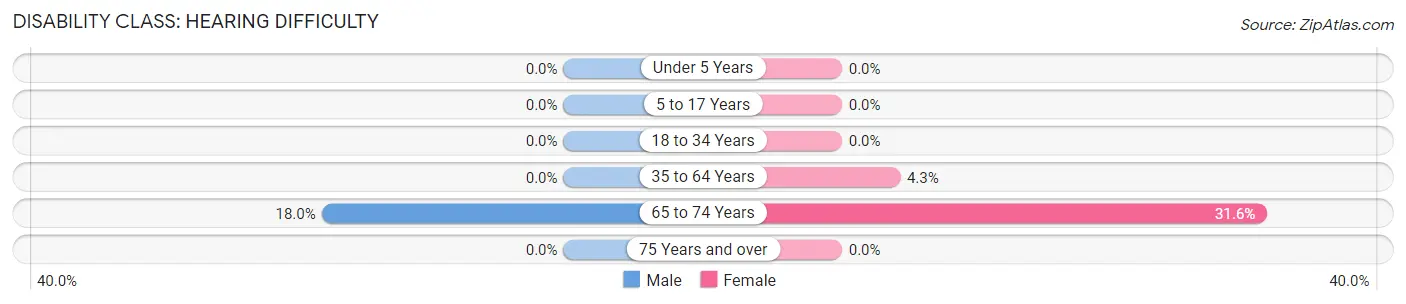
| Age Bracket | Male | Female |
| Under 5 Years | 0 (0.0%) | 0 (0.0%) |
| 5 to 17 Years | 0 (0.0%) | 0 (0.0%) |
| 18 to 34 Years | 0 (0.0%) | 0 (0.0%) |
| 35 to 64 Years | 0 (0.0%) | 8 (4.3%) |
| 65 to 74 Years | 7 (17.9%) | 12 (31.6%) |
| 75 Years and over | 0 (0.0%) | 0 (0.0%) |
Disability Class: Vision Difficulty
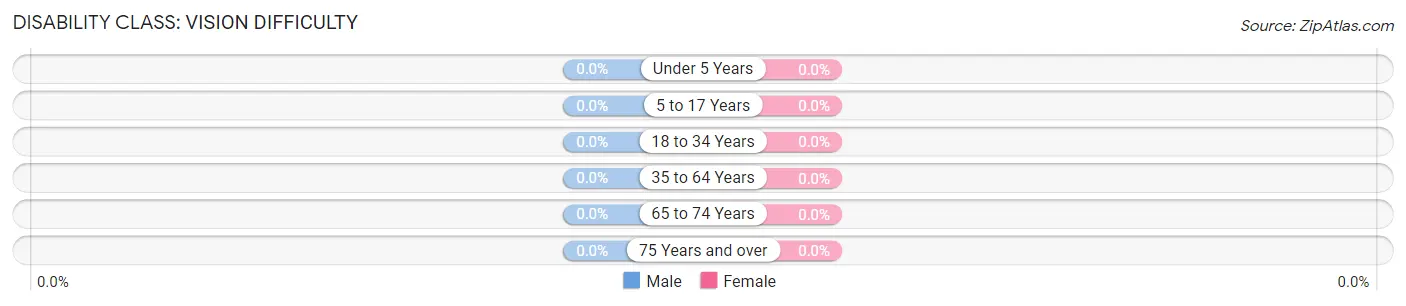
| Age Bracket | Male | Female |
| Under 5 Years | 0 (0.0%) | 0 (0.0%) |
| 5 to 17 Years | 0 (0.0%) | 0 (0.0%) |
| 18 to 34 Years | 0 (0.0%) | 0 (0.0%) |
| 35 to 64 Years | 0 (0.0%) | 0 (0.0%) |
| 65 to 74 Years | 0 (0.0%) | 0 (0.0%) |
| 75 Years and over | 0 (0.0%) | 0 (0.0%) |
Disability Class: Cognitive Difficulty
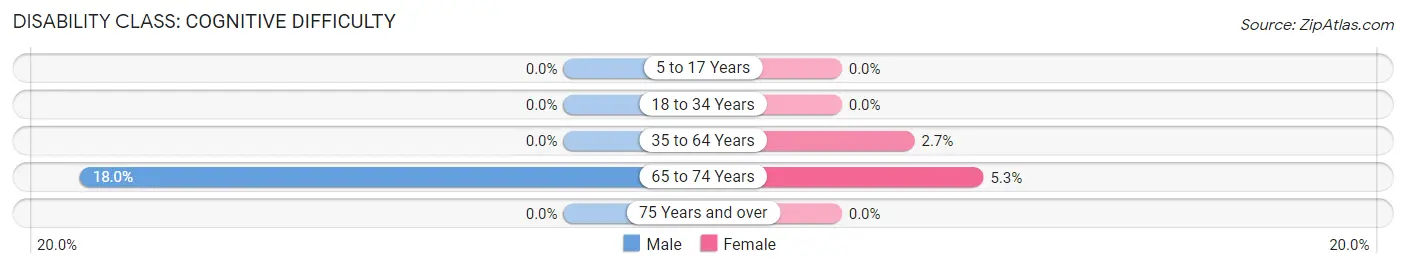
| Age Bracket | Male | Female |
| 5 to 17 Years | 0 (0.0%) | 0 (0.0%) |
| 18 to 34 Years | 0 (0.0%) | 0 (0.0%) |
| 35 to 64 Years | 0 (0.0%) | 5 (2.7%) |
| 65 to 74 Years | 7 (17.9%) | 2 (5.3%) |
| 75 Years and over | 0 (0.0%) | 0 (0.0%) |
Disability Class: Ambulatory Difficulty
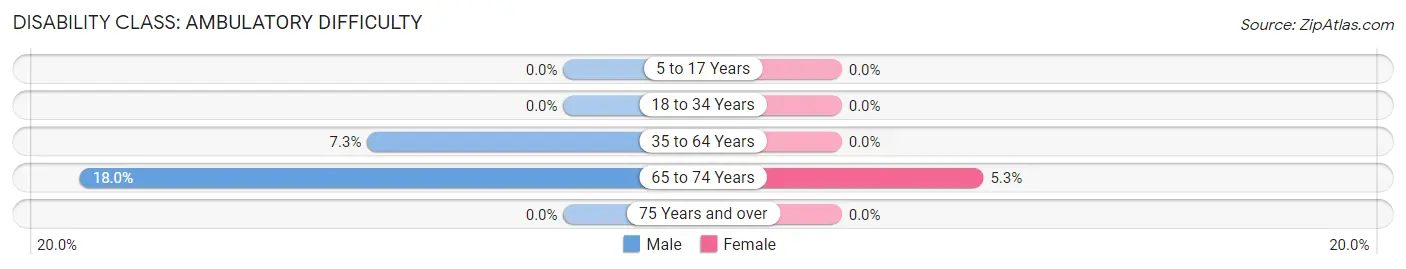
| Age Bracket | Male | Female |
| 5 to 17 Years | 0 (0.0%) | 0 (0.0%) |
| 18 to 34 Years | 0 (0.0%) | 0 (0.0%) |
| 35 to 64 Years | 11 (7.3%) | 0 (0.0%) |
| 65 to 74 Years | 7 (17.9%) | 2 (5.3%) |
| 75 Years and over | 0 (0.0%) | 0 (0.0%) |
Disability Class: Self-Care Difficulty
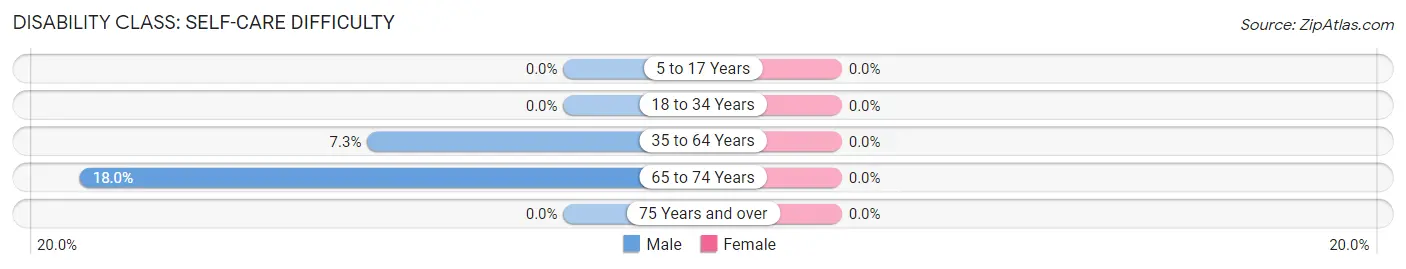
| Age Bracket | Male | Female |
| 5 to 17 Years | 0 (0.0%) | 0 (0.0%) |
| 18 to 34 Years | 0 (0.0%) | 0 (0.0%) |
| 35 to 64 Years | 11 (7.3%) | 0 (0.0%) |
| 65 to 74 Years | 7 (17.9%) | 0 (0.0%) |
| 75 Years and over | 0 (0.0%) | 0 (0.0%) |
Technology Access in South Hills
Computing Device Access in South Hills
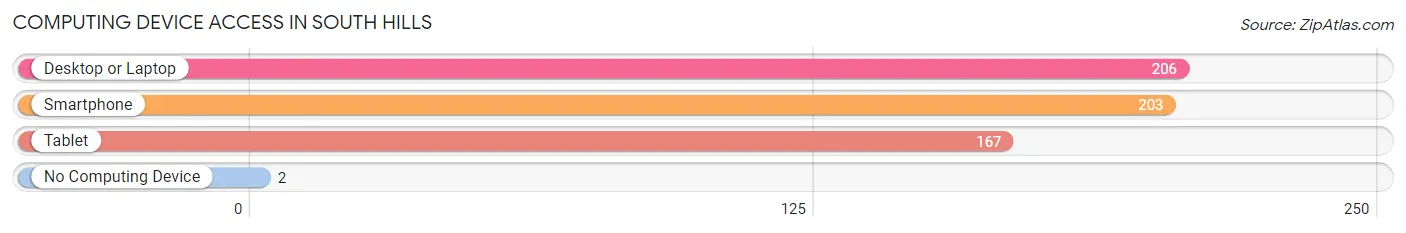
| Device Type | # Households | % Households |
| Desktop or Laptop | 206 | 96.3% |
| Smartphone | 203 | 94.9% |
| Tablet | 167 | 78.0% |
| No Computing Device | 2 | 0.9% |
| Total | 214 | 100.0% |
Internet Access in South Hills
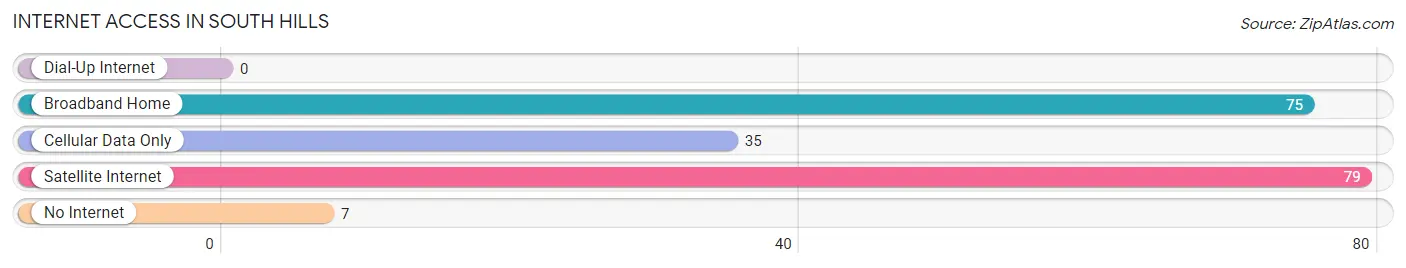
| Internet Type | # Households | % Households |
| Dial-Up Internet | 0 | 0.0% |
| Broadband Home | 75 | 35.0% |
| Cellular Data Only | 35 | 16.4% |
| Satellite Internet | 79 | 36.9% |
| No Internet | 7 | 3.3% |
| Total | 214 | 100.0% |
South Hills Summary
History
The small town of South Hills, Montana is located in the southwestern corner of the state, just north of the Idaho border. It is situated in the Bitterroot Valley, a region of the Rocky Mountains known for its stunning beauty and abundant wildlife. The area was first inhabited by the Salish-Kootenai people, who lived in the area for thousands of years before the arrival of European settlers.
The first Europeans to settle in the area were fur trappers and traders, who arrived in the early 1800s. The area was then part of the Oregon Territory, and the first permanent settlement was established in 1841. The settlement was named South Hills, and it quickly grew into a small town.
In the late 1800s, the town became a popular destination for tourists, who came to enjoy the area’s natural beauty and outdoor activities. The town was also a popular stop for travelers on the Northern Pacific Railroad, which ran through the area.
In the early 1900s, the town began to experience a period of growth and prosperity. The population increased, and new businesses opened up, including a bank, a hotel, and a general store. The town also became a popular destination for hunters and fishermen, who came to take advantage of the area’s abundant wildlife.
In the 1950s, the town experienced a period of decline as the railroad stopped running through the area and the population began to decline. However, in the late 1970s, the town began to experience a resurgence as people began to move back to the area and new businesses opened up.
Today, South Hills is a small but vibrant community. The population is around 1,000 people, and the town is home to a variety of businesses, including restaurants, shops, and a grocery store. The town is also home to a number of outdoor activities, including hiking, fishing, and camping.
Geography
South Hills is located in the Bitterroot Valley, a region of the Rocky Mountains in the southwestern corner of Montana. The town is situated at an elevation of 4,000 feet, and the surrounding area is characterized by rolling hills, lush forests, and abundant wildlife.
The town is located near the Bitterroot River, which flows through the valley and provides a source of recreation for the locals. The area is also home to a variety of wildlife, including deer, elk, and bighorn sheep.
The climate in South Hills is generally mild, with warm summers and cold winters. The average temperature in the summer is around 70 degrees Fahrenheit, and the average temperature in the winter is around 20 degrees Fahrenheit.
Economy
The economy of South Hills is largely based on tourism and agriculture. The town is a popular destination for tourists, who come to enjoy the area’s natural beauty and outdoor activities. The town is also home to a number of businesses, including restaurants, shops, and a grocery store.
Agriculture is also an important part of the local economy. The area is home to a number of farms, which produce a variety of crops, including wheat, barley, and hay. The area is also home to a number of cattle ranches, which produce beef and dairy products.
Demographics
As of the 2010 census, the population of South Hills was 1,000 people. The town is predominantly white, with 92.7% of the population identifying as white. The remaining population is made up of Native Americans (3.2%), African Americans (1.2%), and other races (3%).
The median household income in South Hills is $41,250, and the median age is 44. The town has a high rate of homeownership, with 81.3% of the population owning their own homes. The town also has a low unemployment rate, with only 4.2% of the population unemployed.
Common Questions
What is Per Capita Income in South Hills?
Per Capita income in South Hills is $71,719.
What is the Median Family Income in South Hills?
Median Family Income in South Hills is $159,028.
What is the Median Household income in South Hills?
Median Household Income in South Hills is $156,500.
What is Income or Wage Gap in South Hills?
Income or Wage Gap in South Hills is 20.7%.
Women in South Hills earn 79.3 cents for every dollar earned by a man.
What is Inequality or Gini Index in South Hills?
Inequality or Gini Index in South Hills is 0.35.
What is the Total Population of South Hills?
Total Population of South Hills is 629.
What is the Total Male Population of South Hills?
Total Male Population of South Hills is 332.
What is the Total Female Population of South Hills?
Total Female Population of South Hills is 297.
What is the Ratio of Males per 100 Females in South Hills?
There are 111.78 Males per 100 Females in South Hills.
What is the Ratio of Females per 100 Males in South Hills?
There are 89.46 Females per 100 Males in South Hills.
What is the Median Population Age in South Hills?
Median Population Age in South Hills is 47.2 Years.
What is the Average Family Size in South Hills
Average Family Size in South Hills is 3.2 People.
What is the Average Household Size in South Hills
Average Household Size in South Hills is 2.9 People.
How Large is the Labor Force in South Hills?
There are 342 People in the Labor Forcein in South Hills.
What is the Percentage of People in the Labor Force in South Hills?
63.9% of People are in the Labor Force in South Hills.