Walkerville, MT Map & Demographics
Walkerville Map
Walkerville Overview
$31,759
PER CAPITA INCOME
$46,250
AVG FAMILY INCOME
$39,417
AVG HOUSEHOLD INCOME
40.5%
WAGE / INCOME GAP [ % ]
59.5¢/ $1
WAGE / INCOME GAP [ $ ]
0.51
INEQUALITY / GINI INDEX
668
TOTAL POPULATION
307
MALE POPULATION
361
FEMALE POPULATION
85.04
MALES / 100 FEMALES
117.59
FEMALES / 100 MALES
47.4
MEDIAN AGE
3.1
AVG FAMILY SIZE
2.2
AVG HOUSEHOLD SIZE
335
LABOR FORCE [ PEOPLE ]
58.4%
PERCENT IN LABOR FORCE
7.8%
UNEMPLOYMENT RATE
Walkerville Area Codes
Income in Walkerville
Income Overview in Walkerville
Per Capita Income in Walkerville is $31,759, while median incomes of families and households are $46,250 and $39,417 respectively.
| Characteristic | Number | Measure |
| Per Capita Income | 668 | $31,759 |
| Median Family Income | 145 | $46,250 |
| Mean Family Income | 145 | $94,468 |
| Median Household Income | 305 | $39,417 |
| Mean Household Income | 305 | $66,186 |
| Income Deficit | 145 | $0 |
| Wage / Income Gap (%) | 668 | 40.51% |
| Wage / Income Gap ($) | 668 | 59.49¢ per $1 |
| Gini / Inequality Index | 668 | 0.51 |
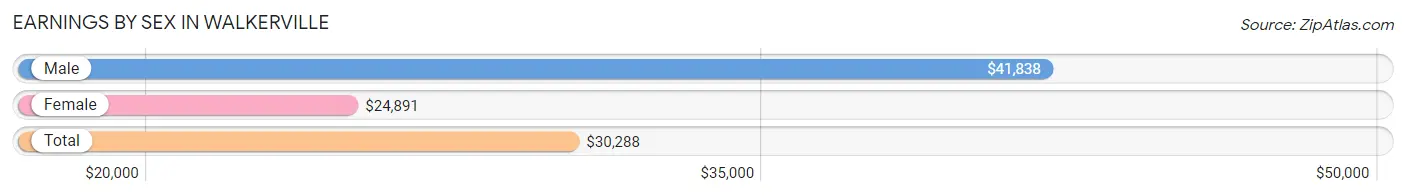
Earnings by Sex in Walkerville
Average Earnings in Walkerville are $30,288, $41,838 for men and $24,891 for women, a difference of 40.5%.
| Sex | Number | Average Earnings |
| Male | 177 (48.2%) | $41,838 |
| Female | 190 (51.8%) | $24,891 |
| Total | 367 (100.0%) | $30,288 |
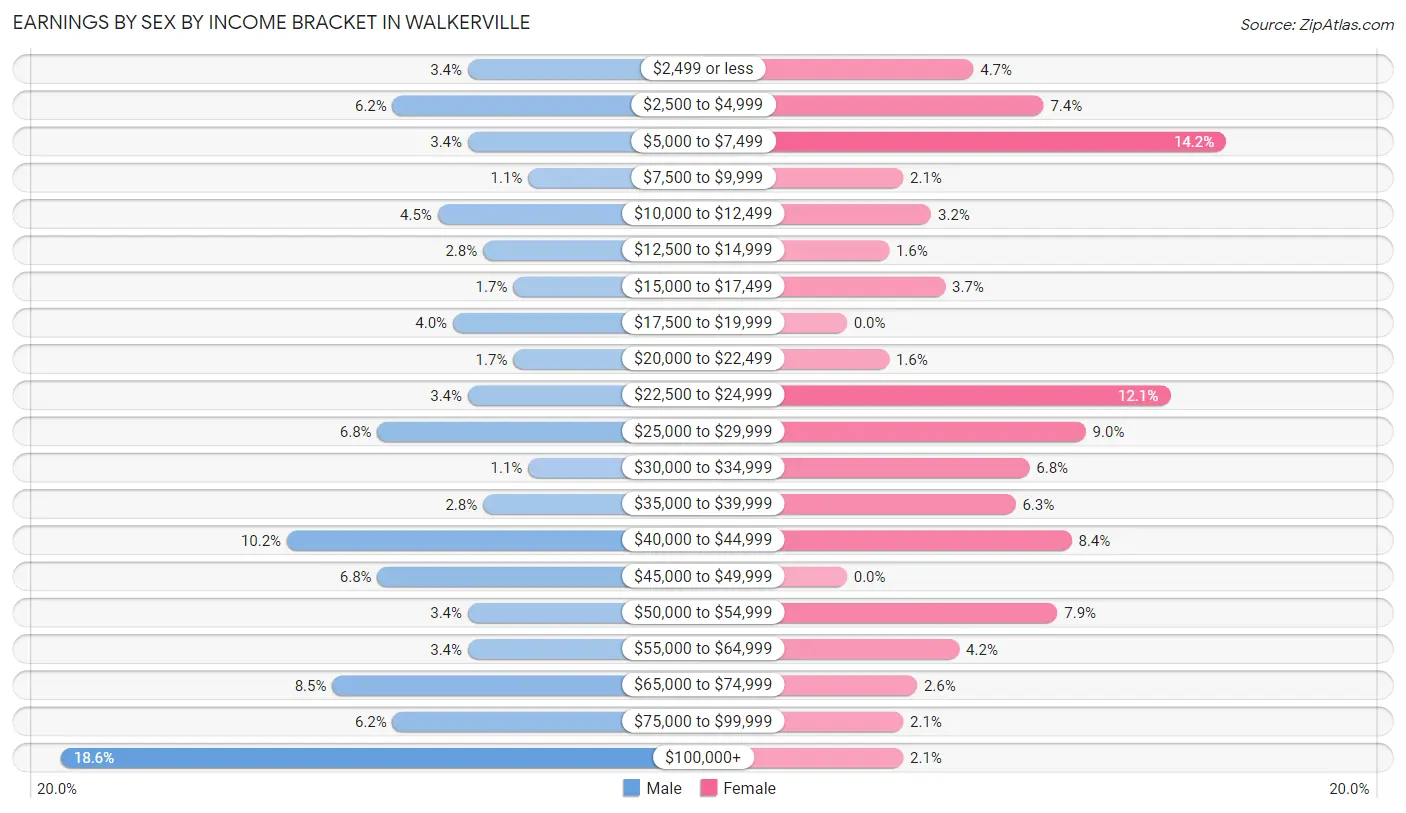
Earnings by Sex by Income Bracket in Walkerville
The most common earnings brackets in Walkerville are $100,000+ for men (33 | 18.6%) and $5,000 to $7,499 for women (27 | 14.2%).
| Income | Male | Female |
| $2,499 or less | 6 (3.4%) | 9 (4.7%) |
| $2,500 to $4,999 | 11 (6.2%) | 14 (7.4%) |
| $5,000 to $7,499 | 6 (3.4%) | 27 (14.2%) |
| $7,500 to $9,999 | 2 (1.1%) | 4 (2.1%) |
| $10,000 to $12,499 | 8 (4.5%) | 6 (3.2%) |
| $12,500 to $14,999 | 5 (2.8%) | 3 (1.6%) |
| $15,000 to $17,499 | 3 (1.7%) | 7 (3.7%) |
| $17,500 to $19,999 | 7 (4.0%) | 0 (0.0%) |
| $20,000 to $22,499 | 3 (1.7%) | 3 (1.6%) |
| $22,500 to $24,999 | 6 (3.4%) | 23 (12.1%) |
| $25,000 to $29,999 | 12 (6.8%) | 17 (8.9%) |
| $30,000 to $34,999 | 2 (1.1%) | 13 (6.8%) |
| $35,000 to $39,999 | 5 (2.8%) | 12 (6.3%) |
| $40,000 to $44,999 | 18 (10.2%) | 16 (8.4%) |
| $45,000 to $49,999 | 12 (6.8%) | 0 (0.0%) |
| $50,000 to $54,999 | 6 (3.4%) | 15 (7.9%) |
| $55,000 to $64,999 | 6 (3.4%) | 8 (4.2%) |
| $65,000 to $74,999 | 15 (8.5%) | 5 (2.6%) |
| $75,000 to $99,999 | 11 (6.2%) | 4 (2.1%) |
| $100,000+ | 33 (18.6%) | 4 (2.1%) |
| Total | 177 (100.0%) | 190 (100.0%) |
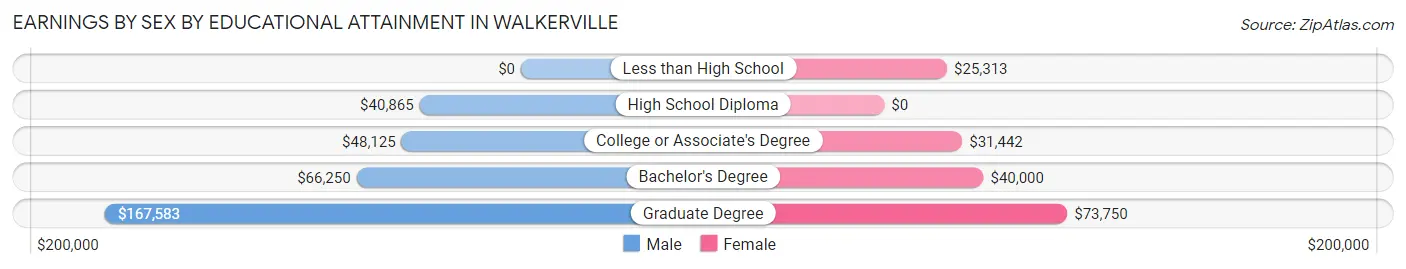
Earnings by Sex by Educational Attainment in Walkerville
Average earnings in Walkerville are $48,125 for men and $29,625 for women, a difference of 38.4%. Men with an educational attainment of graduate degree enjoy the highest average annual earnings of $167,583, while those with high school diploma education earn the least with $40,865. Women with an educational attainment of graduate degree earn the most with the average annual earnings of $73,750, while those with less than high school education have the smallest earnings of $25,313.
| Educational Attainment | Male Income | Female Income |
| Less than High School | - | - |
| High School Diploma | $40,865 | $0 |
| College or Associate's Degree | $48,125 | $31,442 |
| Bachelor's Degree | $66,250 | $40,000 |
| Graduate Degree | $167,583 | $73,750 |
| Total | $48,125 | $29,625 |
Family Income in Walkerville
Family Income Brackets in Walkerville
According to the Walkerville family income data, there are 46 families falling into the $35,000 to $49,999 income range, which is the most common income bracket and makes up 31.7% of all families. Conversely, the $150,000 to $199,999 income bracket is the least frequent group with only 2 families (1.4%) belonging to this category.
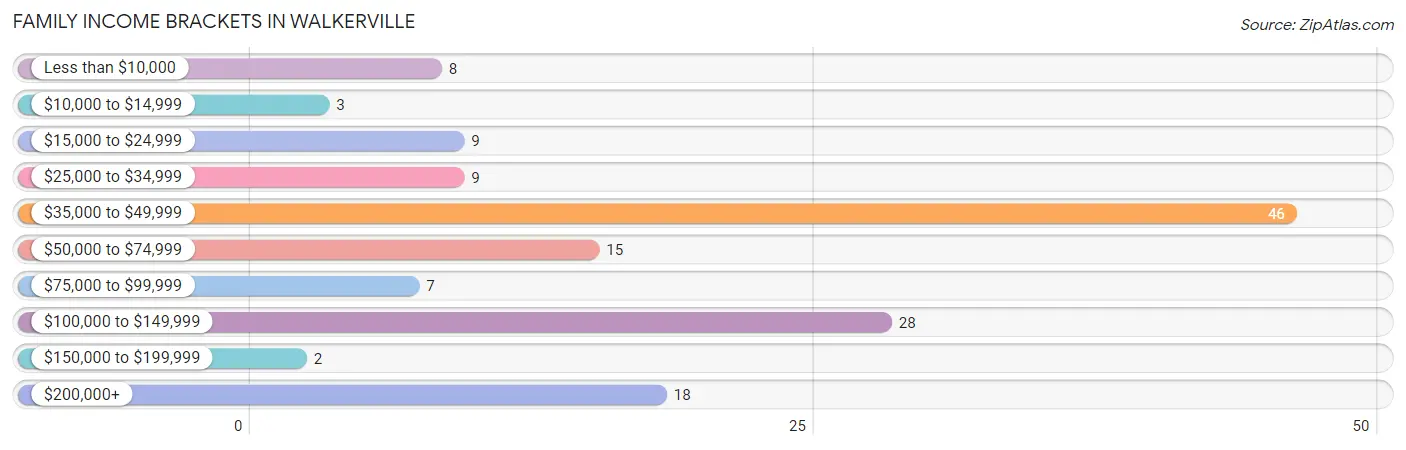
| Income Bracket | # Families | % Families |
| Less than $10,000 | 8 | 5.5% |
| $10,000 to $14,999 | 3 | 2.1% |
| $15,000 to $24,999 | 9 | 6.2% |
| $25,000 to $34,999 | 9 | 6.2% |
| $35,000 to $49,999 | 46 | 31.7% |
| $50,000 to $74,999 | 15 | 10.3% |
| $75,000 to $99,999 | 7 | 4.8% |
| $100,000 to $149,999 | 28 | 19.3% |
| $150,000 to $199,999 | 2 | 1.4% |
| $200,000+ | 18 | 12.4% |
Family Income by Famaliy Size in Walkerville
2-person families (68 | 46.9%) account for the highest median family income in Walkerville with $47,500 per family, while 2-person families (68 | 46.9%) have the highest median income of $23,750 per family member.
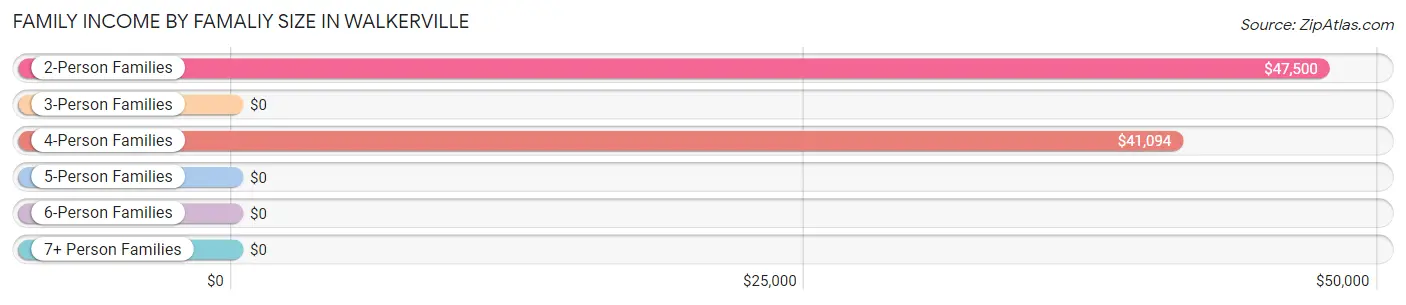
| Income Bracket | # Families | Median Income |
| 2-Person Families | 68 (46.9%) | $47,500 |
| 3-Person Families | 41 (28.3%) | $0 |
| 4-Person Families | 29 (20.0%) | $41,094 |
| 5-Person Families | 1 (0.7%) | $0 |
| 6-Person Families | 5 (3.5%) | $0 |
| 7+ Person Families | 1 (0.7%) | $0 |
| Total | 145 (100.0%) | $46,250 |
Family Income by Number of Earners in Walkerville
The median family income in Walkerville is $46,250, with families comprising 2 earners (50) having the highest median family income of $126,250, while families with 1 earner (64) have the lowest median family income of $40,435, accounting for 34.5% and 44.1% of families, respectively.
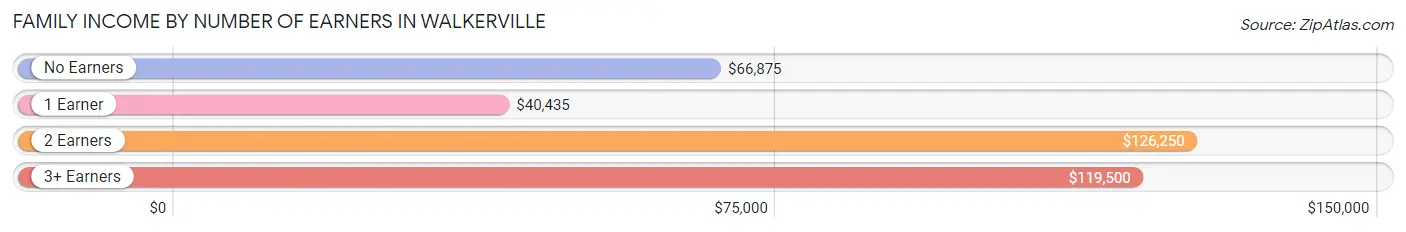
| Number of Earners | # Families | Median Income |
| No Earners | 19 (13.1%) | $66,875 |
| 1 Earner | 64 (44.1%) | $40,435 |
| 2 Earners | 50 (34.5%) | $126,250 |
| 3+ Earners | 12 (8.3%) | $119,500 |
| Total | 145 (100.0%) | $46,250 |
Household Income in Walkerville
Household Income Brackets in Walkerville
With 62 households falling in the category, the $35,000 to $49,999 income range is the most frequent in Walkerville, accounting for 20.3% of all households. In contrast, only 2 households (0.7%) fall into the $150,000 to $199,999 income bracket, making it the least populous group.
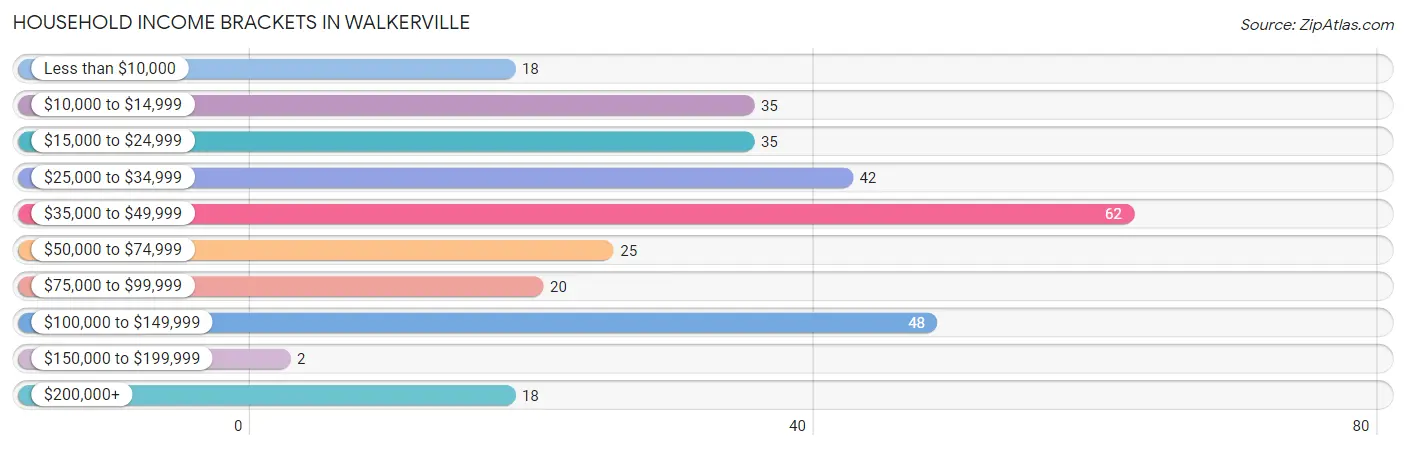
| Income Bracket | # Households | % Households |
| Less than $10,000 | 18 | 5.9% |
| $10,000 to $14,999 | 35 | 11.5% |
| $15,000 to $24,999 | 35 | 11.5% |
| $25,000 to $34,999 | 42 | 13.8% |
| $35,000 to $49,999 | 62 | 20.3% |
| $50,000 to $74,999 | 25 | 8.2% |
| $75,000 to $99,999 | 20 | 6.6% |
| $100,000 to $149,999 | 48 | 15.7% |
| $150,000 to $199,999 | 2 | 0.7% |
| $200,000+ | 18 | 5.9% |
Household Income by Householder Age in Walkerville
The median household income in Walkerville is $39,417, with the highest median household income of $40,417 found in the 25 to 44 years age bracket for the primary householder. A total of 79 households (25.9%) fall into this category. Meanwhile, the 15 to 24 years age bracket for the primary householder has the lowest median household income of $0, with 11 households (3.6%) in this group.
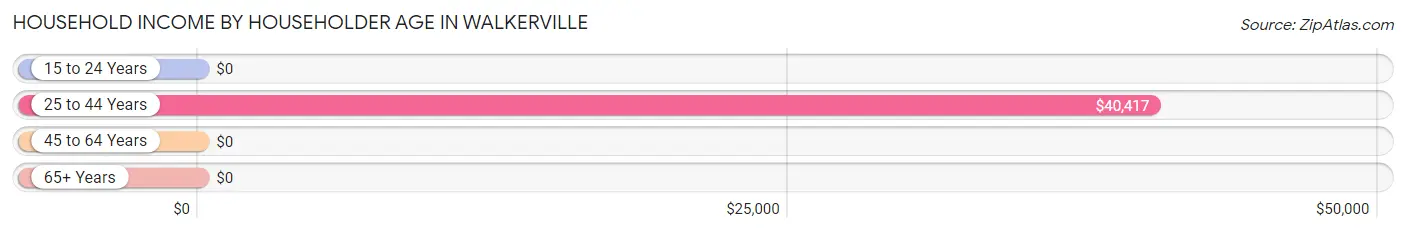
| Income Bracket | # Households | Median Income |
| 15 to 24 Years | 11 (3.6%) | $0 |
| 25 to 44 Years | 79 (25.9%) | $40,417 |
| 45 to 64 Years | 117 (38.4%) | $0 |
| 65+ Years | 98 (32.1%) | $0 |
| Total | 305 (100.0%) | $39,417 |
Poverty in Walkerville
Income Below Poverty by Sex and Age in Walkerville
With 11.8% poverty level for males and 33.3% for females among the residents of Walkerville, 16 and 17 year old males and 35 to 44 year old females are the most vulnerable to poverty, with 6 males (85.7%) and 29 females (78.4%) in their respective age groups living below the poverty level.
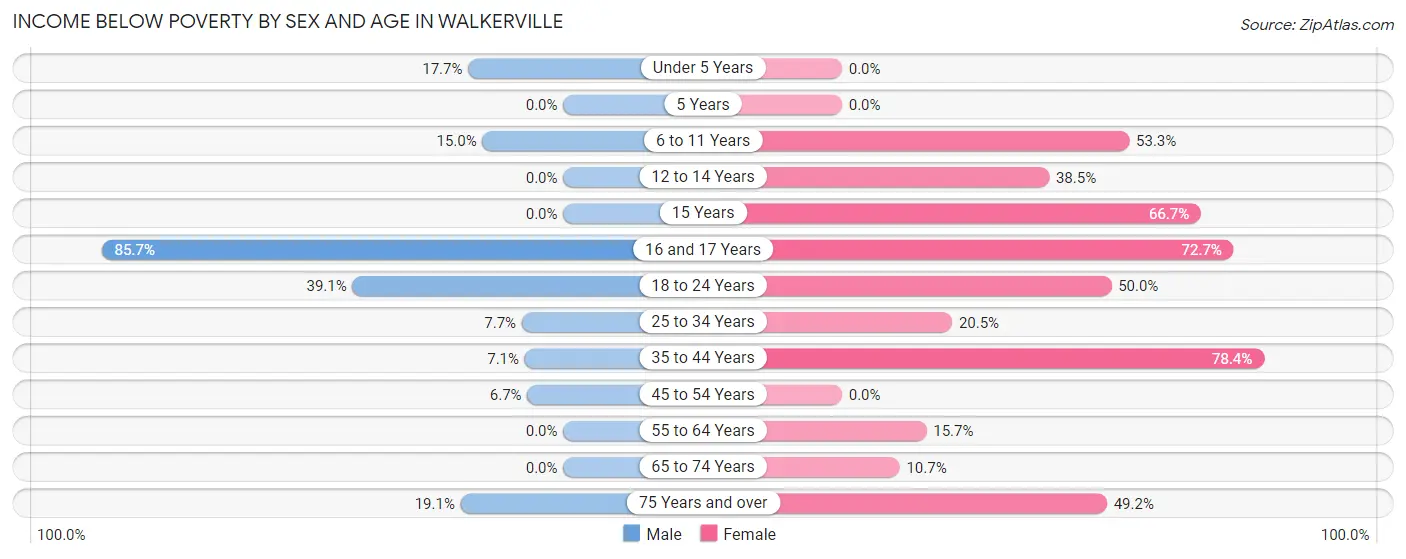
| Age Bracket | Male | Female |
| Under 5 Years | 6 (17.6%) | 0 (0.0%) |
| 5 Years | 0 (0.0%) | 0 (0.0%) |
| 6 to 11 Years | 3 (15.0%) | 8 (53.3%) |
| 12 to 14 Years | 0 (0.0%) | 5 (38.5%) |
| 15 Years | 0 (0.0%) | 2 (66.7%) |
| 16 and 17 Years | 6 (85.7%) | 8 (72.7%) |
| 18 to 24 Years | 9 (39.1%) | 18 (50.0%) |
| 25 to 34 Years | 3 (7.7%) | 9 (20.4%) |
| 35 to 44 Years | 2 (7.1%) | 29 (78.4%) |
| 45 to 54 Years | 3 (6.7%) | 0 (0.0%) |
| 55 to 64 Years | 0 (0.0%) | 8 (15.7%) |
| 65 to 74 Years | 0 (0.0%) | 3 (10.7%) |
| 75 Years and over | 4 (19.1%) | 30 (49.2%) |
| Total | 36 (11.8%) | 120 (33.3%) |
Income Above Poverty by Sex and Age in Walkerville
According to the poverty statistics in Walkerville, males aged 5 years and females aged under 5 years are the age groups that are most secure financially, with 100.0% of males and 100.0% of females in these age groups living above the poverty line.
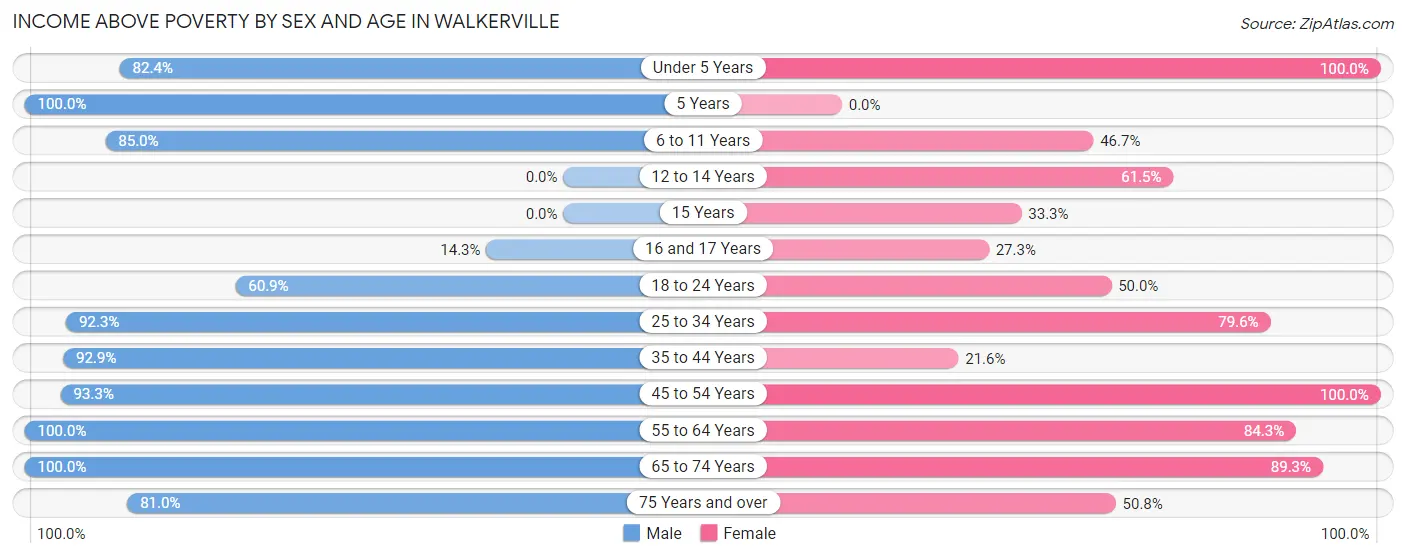
| Age Bracket | Male | Female |
| Under 5 Years | 28 (82.4%) | 5 (100.0%) |
| 5 Years | 1 (100.0%) | 0 (0.0%) |
| 6 to 11 Years | 17 (85.0%) | 7 (46.7%) |
| 12 to 14 Years | 0 (0.0%) | 8 (61.5%) |
| 15 Years | 0 (0.0%) | 1 (33.3%) |
| 16 and 17 Years | 1 (14.3%) | 3 (27.3%) |
| 18 to 24 Years | 14 (60.9%) | 18 (50.0%) |
| 25 to 34 Years | 36 (92.3%) | 35 (79.5%) |
| 35 to 44 Years | 26 (92.9%) | 8 (21.6%) |
| 45 to 54 Years | 42 (93.3%) | 56 (100.0%) |
| 55 to 64 Years | 57 (100.0%) | 43 (84.3%) |
| 65 to 74 Years | 30 (100.0%) | 25 (89.3%) |
| 75 Years and over | 17 (80.9%) | 31 (50.8%) |
| Total | 269 (88.2%) | 240 (66.7%) |
Income Below Poverty Among Married-Couple Families in Walkerville
The poverty statistics for married-couple families in Walkerville show that 2.6% or 3 of the total 114 families live below the poverty line. Families with no children have the highest poverty rate of 3.6%, comprising of 3 families. On the other hand, families with 1 or 2 children have the lowest poverty rate of 0.0%, which includes 0 families.
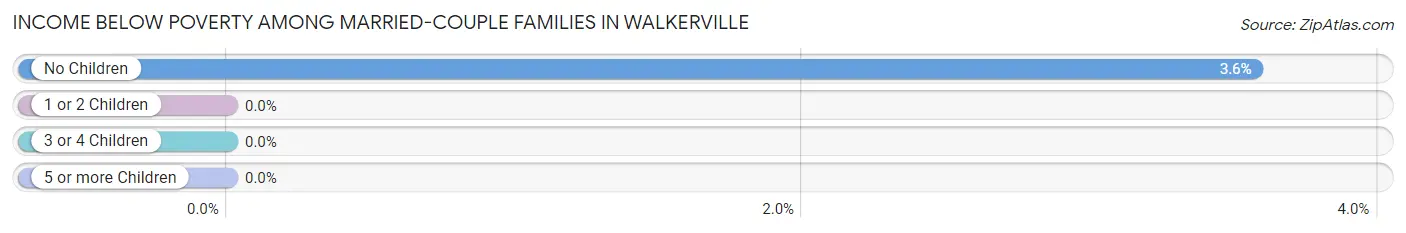
| Children | Above Poverty | Below Poverty |
| No Children | 81 (96.4%) | 3 (3.6%) |
| 1 or 2 Children | 24 (100.0%) | 0 (0.0%) |
| 3 or 4 Children | 5 (100.0%) | 0 (0.0%) |
| 5 or more Children | 1 (100.0%) | 0 (0.0%) |
| Total | 111 (97.4%) | 3 (2.6%) |
Income Below Poverty Among Single-Parent Households in Walkerville
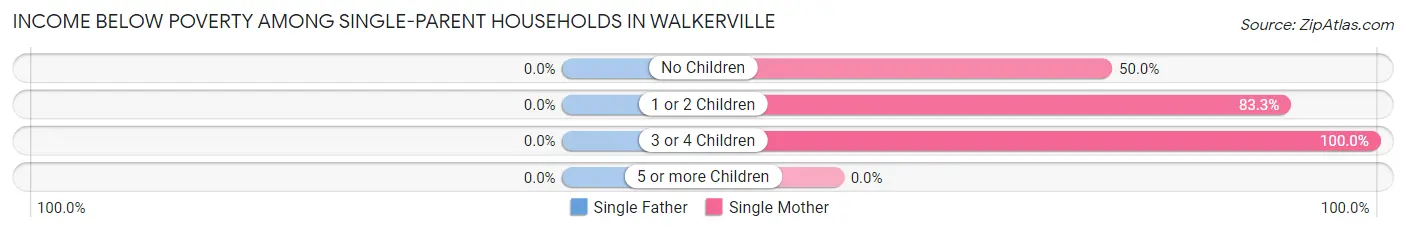
| Children | Single Father | Single Mother |
| No Children | 0 (0.0%) | 3 (50.0%) |
| 1 or 2 Children | 0 (0.0%) | 10 (83.3%) |
| 3 or 4 Children | 0 (0.0%) | 4 (100.0%) |
| 5 or more Children | 0 (0.0%) | 0 (0.0%) |
| Total | 0 (0.0%) | 17 (77.3%) |
Income Below Poverty Among Married-Couple vs Single-Parent Households in Walkerville
The poverty data for Walkerville shows that 3 of the married-couple family households (2.6%) and 17 of the single-parent households (54.8%) are living below the poverty level. Within the married-couple family households, those with no children have the highest poverty rate, with 3 households (3.6%) falling below the poverty line. Among the single-parent households, those with 3 or 4 children have the highest poverty rate, with 4 household (100.0%) living below poverty.
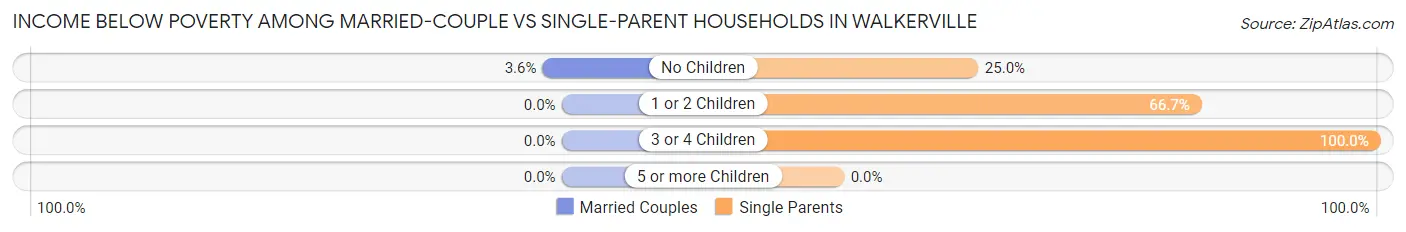
| Children | Married-Couple Families | Single-Parent Households |
| No Children | 3 (3.6%) | 3 (25.0%) |
| 1 or 2 Children | 0 (0.0%) | 10 (66.7%) |
| 3 or 4 Children | 0 (0.0%) | 4 (100.0%) |
| 5 or more Children | 0 (0.0%) | 0 (0.0%) |
| Total | 3 (2.6%) | 17 (54.8%) |
Race in Walkerville
The most populous races in Walkerville are White / Caucasian (649 | 97.2%), Two or more Races (12 | 1.8%), and Hispanic or Latino (7 | 1.1%).
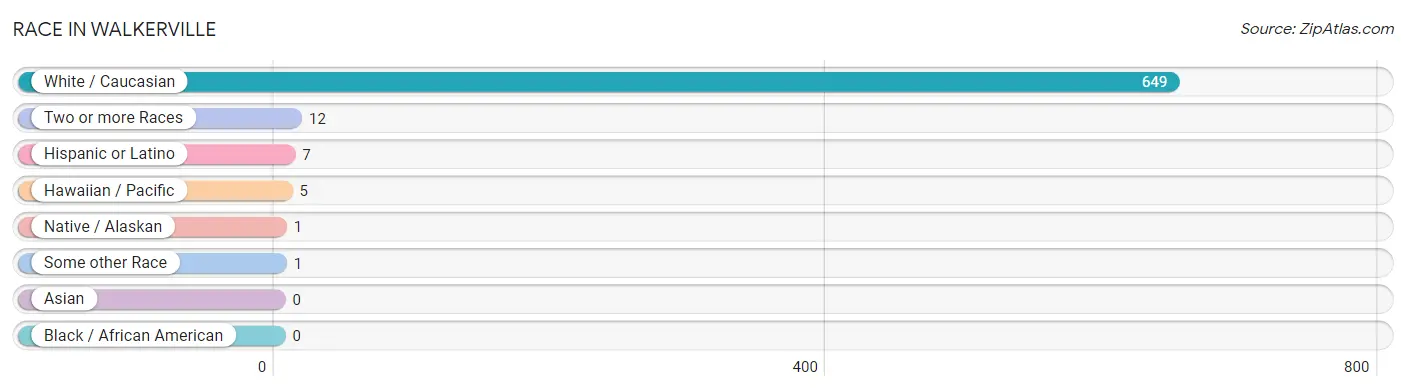
| Race | # Population | % Population |
| Asian | 0 | 0.0% |
| Black / African American | 0 | 0.0% |
| Hawaiian / Pacific | 5 | 0.7% |
| Hispanic or Latino | 7 | 1.1% |
| Native / Alaskan | 1 | 0.2% |
| White / Caucasian | 649 | 97.2% |
| Two or more Races | 12 | 1.8% |
| Some other Race | 1 | 0.2% |
| Total | 668 | 100.0% |
Ancestry in Walkerville
The most populous ancestries reported in Walkerville are Irish (269 | 40.3%), German (112 | 16.8%), English (73 | 10.9%), Italian (63 | 9.4%), and Scottish (31 | 4.6%), together accounting for 82.0% of all Walkerville residents.
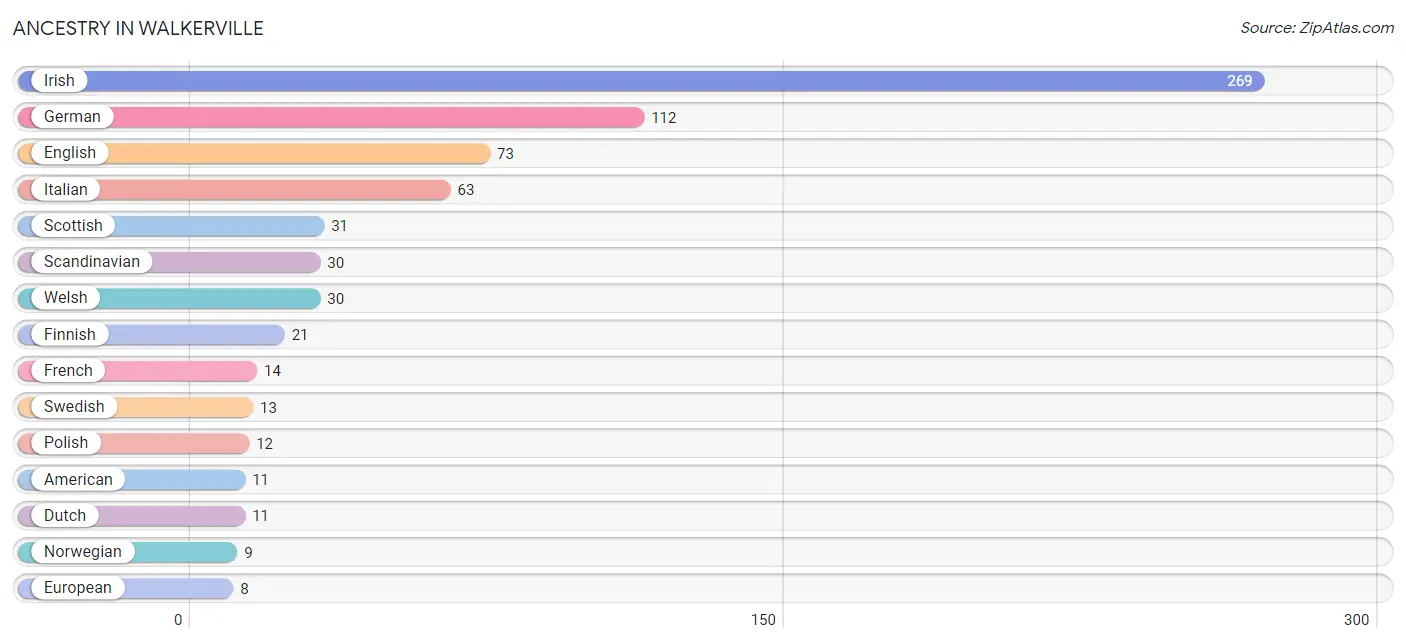
| Ancestry | # Population | % Population |
| American | 11 | 1.7% |
| Austrian | 2 | 0.3% |
| Blackfeet | 2 | 0.3% |
| Burmese | 5 | 0.7% |
| Cherokee | 5 | 0.7% |
| Choctaw | 1 | 0.2% |
| Croatian | 2 | 0.3% |
| Dutch | 11 | 1.7% |
| English | 73 | 10.9% |
| European | 8 | 1.2% |
| Finnish | 21 | 3.1% |
| French | 14 | 2.1% |
| French Canadian | 1 | 0.2% |
| German | 112 | 16.8% |
| Hungarian | 3 | 0.4% |
| Irish | 269 | 40.3% |
| Italian | 63 | 9.4% |
| Mexican | 7 | 1.1% |
| Native Hawaiian | 5 | 0.7% |
| Norwegian | 9 | 1.3% |
| Polish | 12 | 1.8% |
| Russian | 5 | 0.7% |
| Scandinavian | 30 | 4.5% |
| Scotch-Irish | 6 | 0.9% |
| Scottish | 31 | 4.6% |
| Slovene | 3 | 0.4% |
| Swedish | 13 | 1.9% |
| Welsh | 30 | 4.5% | View All 28 Rows |
Immigrants in Walkerville

| Immigration Origin | # Population | % Population | View All 0 Rows |
Sex and Age in Walkerville
Sex and Age in Walkerville
The most populous age groups in Walkerville are 55 to 59 Years (37 | 12.0%) for men and 45 to 49 Years (46 | 12.7%) for women.
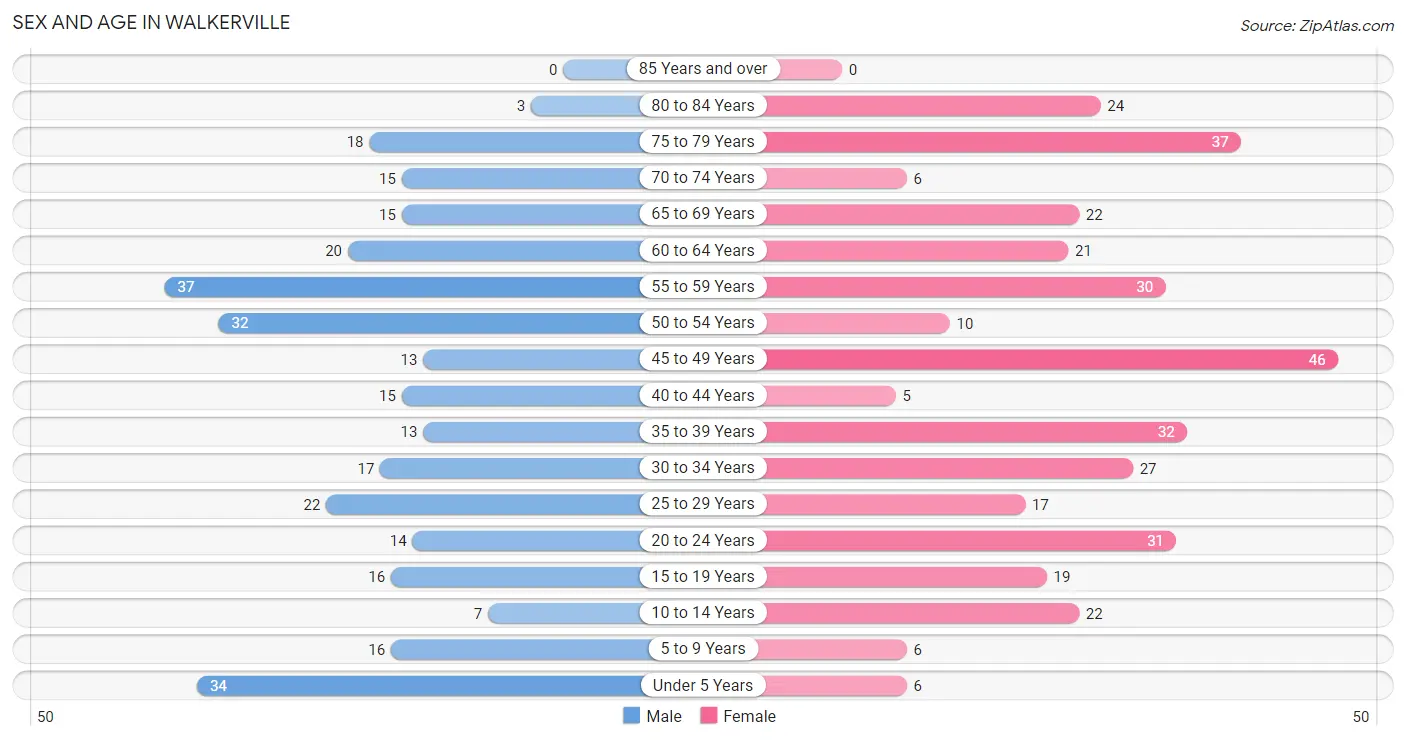
| Age Bracket | Male | Female |
| Under 5 Years | 34 (11.1%) | 6 (1.7%) |
| 5 to 9 Years | 16 (5.2%) | 6 (1.7%) |
| 10 to 14 Years | 7 (2.3%) | 22 (6.1%) |
| 15 to 19 Years | 16 (5.2%) | 19 (5.3%) |
| 20 to 24 Years | 14 (4.6%) | 31 (8.6%) |
| 25 to 29 Years | 22 (7.2%) | 17 (4.7%) |
| 30 to 34 Years | 17 (5.5%) | 27 (7.5%) |
| 35 to 39 Years | 13 (4.2%) | 32 (8.9%) |
| 40 to 44 Years | 15 (4.9%) | 5 (1.4%) |
| 45 to 49 Years | 13 (4.2%) | 46 (12.7%) |
| 50 to 54 Years | 32 (10.4%) | 10 (2.8%) |
| 55 to 59 Years | 37 (12.0%) | 30 (8.3%) |
| 60 to 64 Years | 20 (6.5%) | 21 (5.8%) |
| 65 to 69 Years | 15 (4.9%) | 22 (6.1%) |
| 70 to 74 Years | 15 (4.9%) | 6 (1.7%) |
| 75 to 79 Years | 18 (5.9%) | 37 (10.2%) |
| 80 to 84 Years | 3 (1.0%) | 24 (6.7%) |
| 85 Years and over | 0 (0.0%) | 0 (0.0%) |
| Total | 307 (100.0%) | 361 (100.0%) |
Families and Households in Walkerville
Median Family Size in Walkerville
The median family size in Walkerville is 3.09 persons per family, with single female/mother families (22 | 15.2%) accounting for the largest median family size of 3.23 persons per family. On the other hand, married-couple families (114 | 78.6%) represent the smallest median family size with 3.06 persons per family.
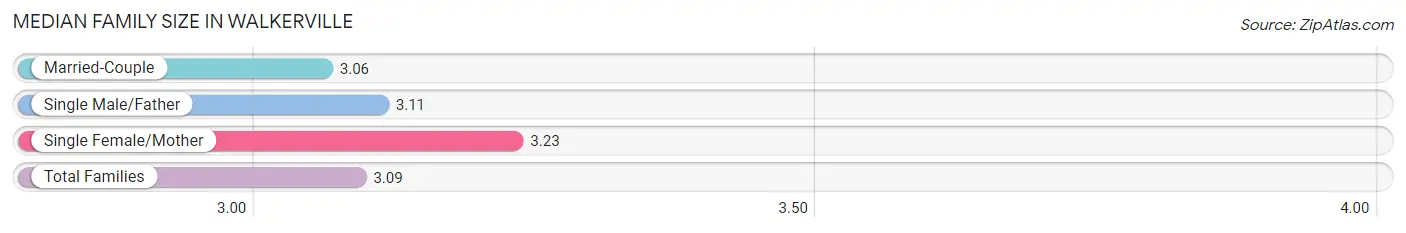
| Family Type | # Families | Family Size |
| Married-Couple | 114 (78.6%) | 3.06 |
| Single Male/Father | 9 (6.2%) | 3.11 |
| Single Female/Mother | 22 (15.2%) | 3.23 |
| Total Families | 145 (100.0%) | 3.09 |
Median Household Size in Walkerville
The median household size in Walkerville is 2.19 persons per household, with single male/father households (9 | 2.9%) accounting for the largest median household size of 3.67 persons per household. non-family households (160 | 52.5%) represent the smallest median household size with 1.33 persons per household.
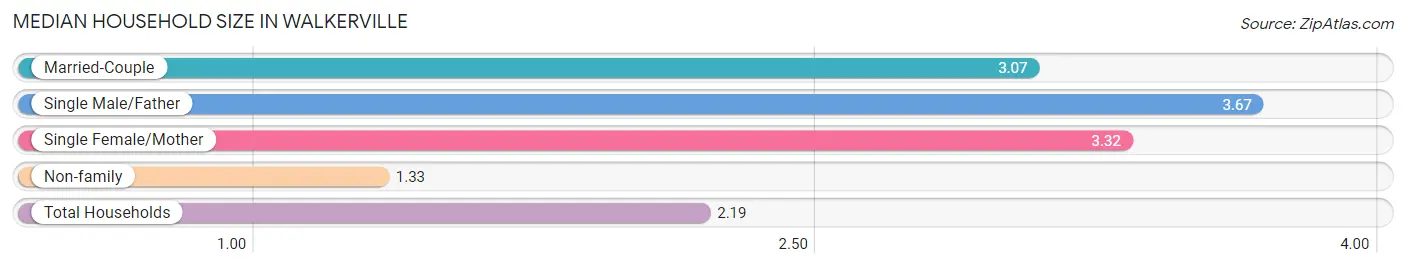
| Household Type | # Households | Household Size |
| Married-Couple | 114 (37.4%) | 3.07 |
| Single Male/Father | 9 (2.9%) | 3.67 |
| Single Female/Mother | 22 (7.2%) | 3.32 |
| Non-family | 160 (52.5%) | 1.33 |
| Total Households | 305 (100.0%) | 2.19 |
Household Size by Marriage Status in Walkerville
Out of a total of 305 households in Walkerville, 145 (47.5%) are family households, while 160 (52.5%) are nonfamily households. The most numerous type of family households are 2-person households, comprising 68, and the most common type of nonfamily households are 1-person households, comprising 132.
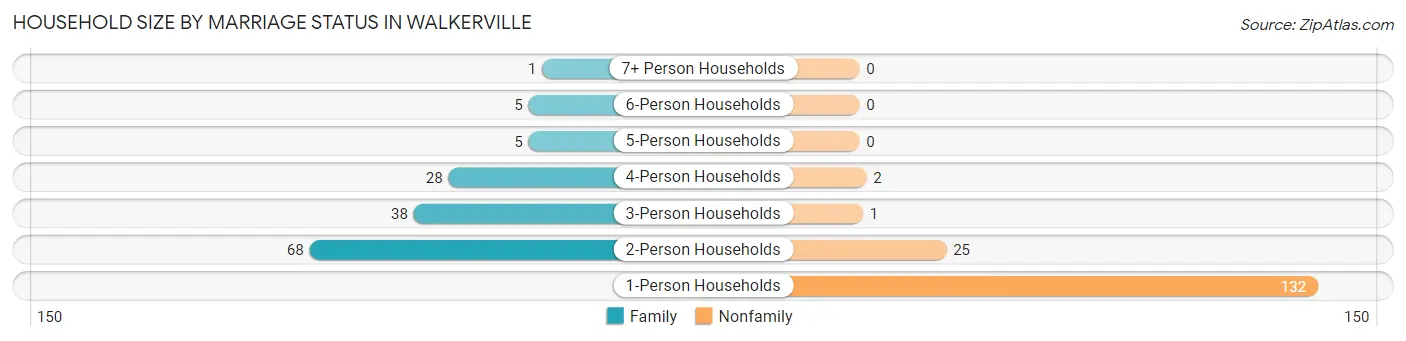
| Household Size | Family Households | Nonfamily Households |
| 1-Person Households | - | 132 (43.3%) |
| 2-Person Households | 68 (22.3%) | 25 (8.2%) |
| 3-Person Households | 38 (12.5%) | 1 (0.3%) |
| 4-Person Households | 28 (9.2%) | 2 (0.7%) |
| 5-Person Households | 5 (1.6%) | 0 (0.0%) |
| 6-Person Households | 5 (1.6%) | 0 (0.0%) |
| 7+ Person Households | 1 (0.3%) | 0 (0.0%) |
| Total | 145 (47.5%) | 160 (52.5%) |
Female Fertility in Walkerville
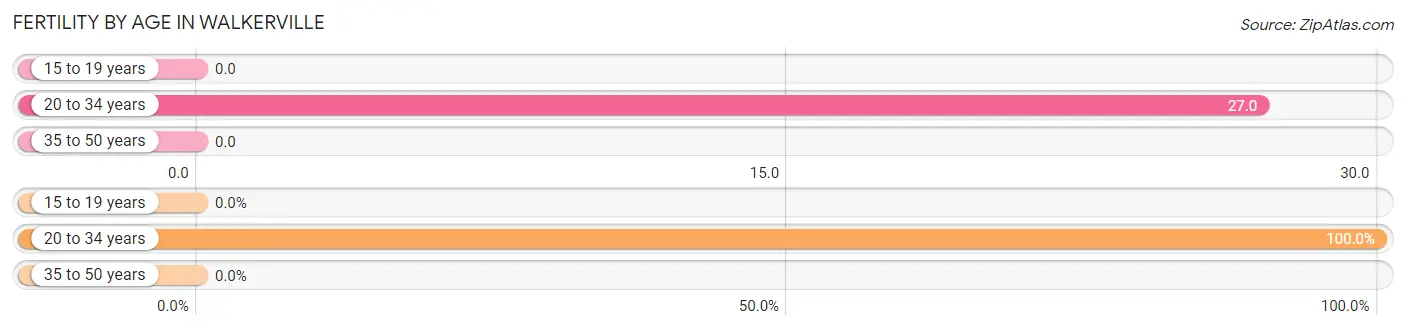
Fertility by Age in Walkerville
Average fertility rate in Walkerville is 11.0 births per 1,000 women. Women in the age bracket of 20 to 34 years have the highest fertility rate with 27.0 births per 1,000 women. Women in the age bracket of 20 to 34 years acount for 100.0% of all women with births.
| Age Bracket | Women with Births | Births / 1,000 Women |
| 15 to 19 years | 0 (0.0%) | 0.0 |
| 20 to 34 years | 2 (100.0%) | 27.0 |
| 35 to 50 years | 0 (0.0%) | 0.0 |
| Total | 2 (100.0%) | 11.0 |
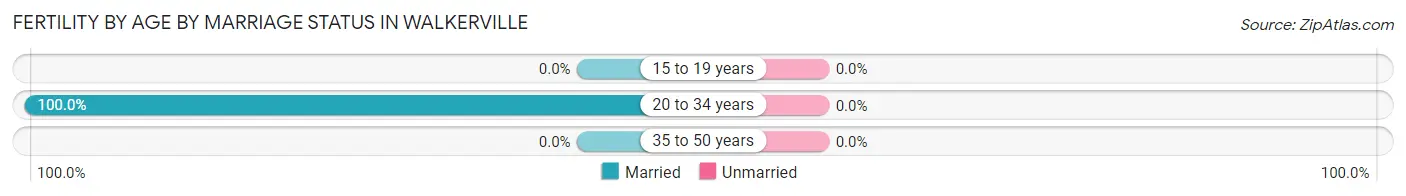
Fertility by Age by Marriage Status in Walkerville
| Age Bracket | Married | Unmarried |
| 15 to 19 years | 0 (0.0%) | 0 (0.0%) |
| 20 to 34 years | 2 (100.0%) | 0 (0.0%) |
| 35 to 50 years | 0 (0.0%) | 0 (0.0%) |
| Total | 2 (100.0%) | 0 (0.0%) |
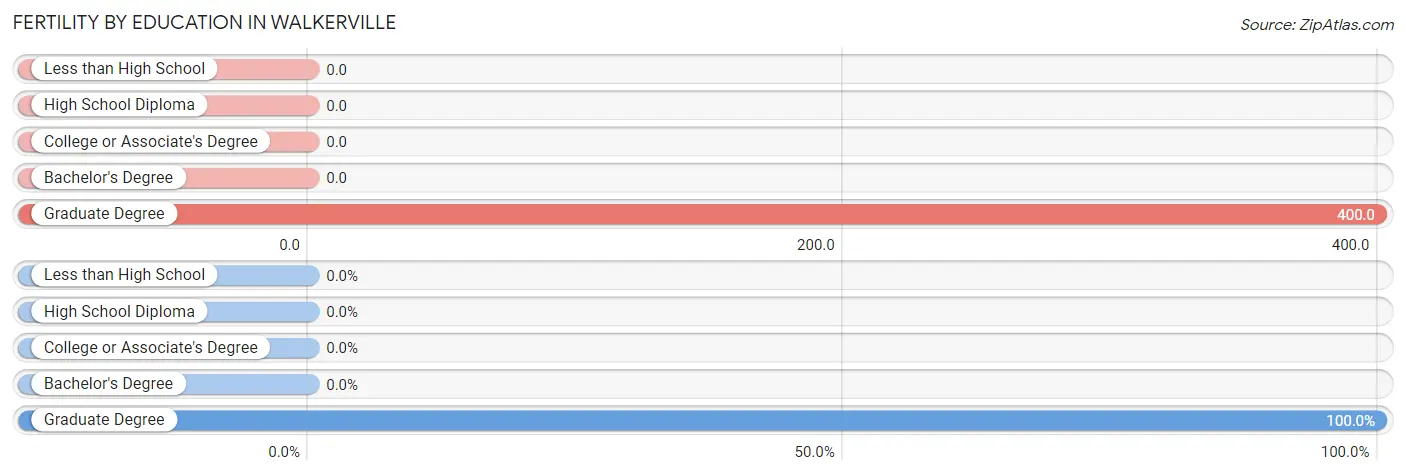
Fertility by Education in Walkerville
| Educational Attainment | Women with Births | Births / 1,000 Women |
| Less than High School | 0 (0.0%) | 0.0 |
| High School Diploma | 0 (0.0%) | 0.0 |
| College or Associate's Degree | 0 (0.0%) | 0.0 |
| Bachelor's Degree | 0 (0.0%) | 0.0 |
| Graduate Degree | 2 (100.0%) | 400.0 |
| Total | 2 (100.0%) | 11.0 |
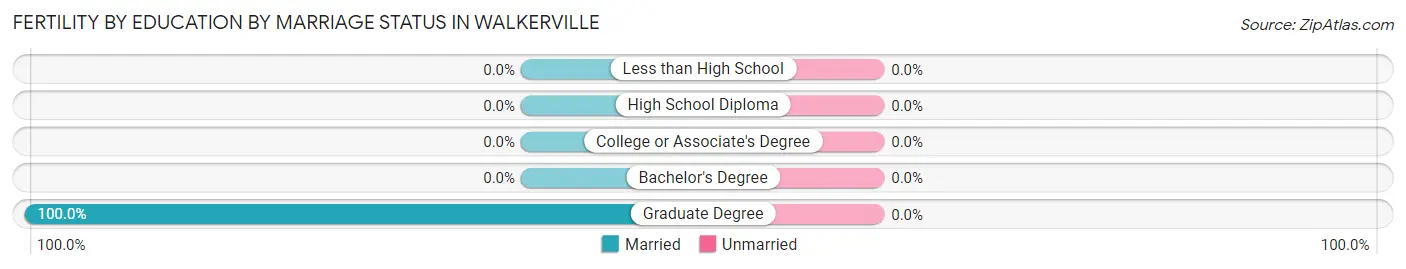
Fertility by Education by Marriage Status in Walkerville
| Educational Attainment | Married | Unmarried |
| Less than High School | 0 (0.0%) | 0 (0.0%) |
| High School Diploma | 0 (0.0%) | 0 (0.0%) |
| College or Associate's Degree | 0 (0.0%) | 0 (0.0%) |
| Bachelor's Degree | 0 (0.0%) | 0 (0.0%) |
| Graduate Degree | 2 (100.0%) | 0 (0.0%) |
| Total | 2 (100.0%) | 0 (0.0%) |
Employment Characteristics in Walkerville
Employment by Class of Employer in Walkerville
Among the 301 employed individuals in Walkerville, private company employees (198 | 65.8%), state government employees (32 | 10.6%), and not-for-profit organizations (30 | 10.0%) make up the most common classes of employment.
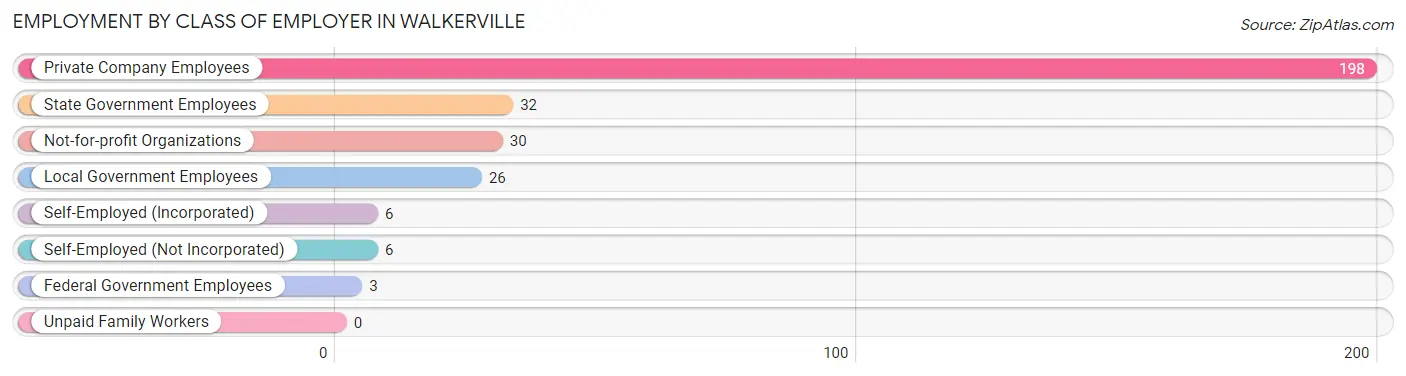
| Employer Class | # Employees | % Employees |
| Private Company Employees | 198 | 65.8% |
| Self-Employed (Incorporated) | 6 | 2.0% |
| Self-Employed (Not Incorporated) | 6 | 2.0% |
| Not-for-profit Organizations | 30 | 10.0% |
| Local Government Employees | 26 | 8.6% |
| State Government Employees | 32 | 10.6% |
| Federal Government Employees | 3 | 1.0% |
| Unpaid Family Workers | 0 | 0.0% |
| Total | 301 | 100.0% |
Employment Status by Age in Walkerville
According to the labor force statistics for Walkerville, out of the total population over 16 years of age (574), 58.4% or 335 individuals are in the labor force, with 7.8% or 26 of them unemployed. The age group with the highest labor force participation rate is 55 to 59 years, with 91.0% or 61 individuals in the labor force. Within the labor force, the 35 to 44 years age range has the highest percentage of unemployed individuals, with 17.3% or 9 of them being unemployed.
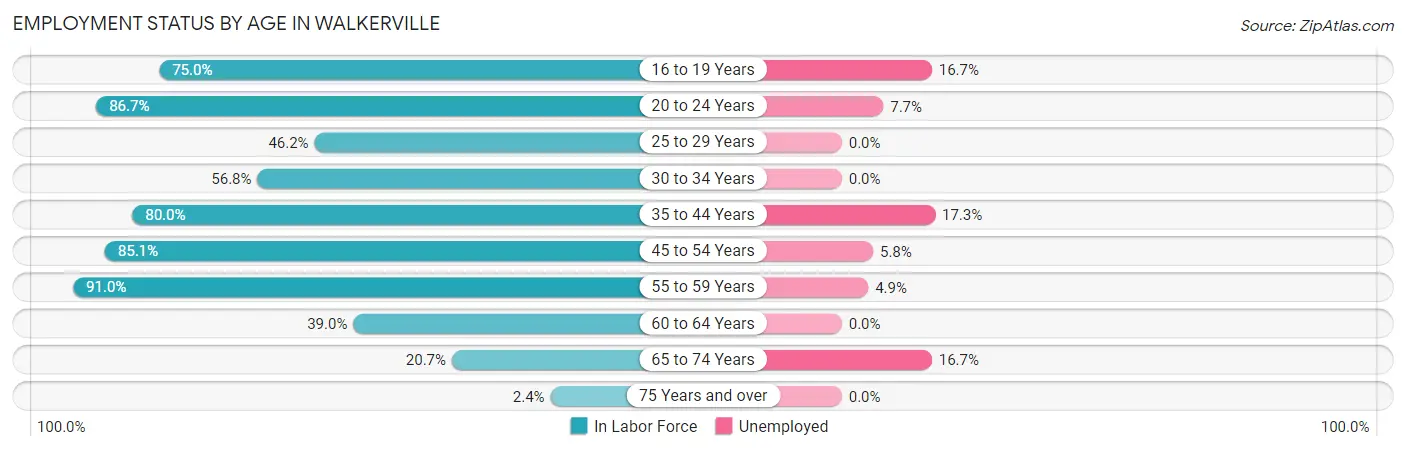
| Age Bracket | In Labor Force | Unemployed |
| 16 to 19 Years | 24 (75.0%) | 4 (16.7%) |
| 20 to 24 Years | 39 (86.7%) | 3 (7.7%) |
| 25 to 29 Years | 18 (46.2%) | 0 (0.0%) |
| 30 to 34 Years | 25 (56.8%) | 0 (0.0%) |
| 35 to 44 Years | 52 (80.0%) | 9 (17.3%) |
| 45 to 54 Years | 86 (85.1%) | 5 (5.8%) |
| 55 to 59 Years | 61 (91.0%) | 3 (4.9%) |
| 60 to 64 Years | 16 (39.0%) | 0 (0.0%) |
| 65 to 74 Years | 12 (20.7%) | 2 (16.7%) |
| 75 Years and over | 2 (2.4%) | 0 (0.0%) |
| Total | 335 (58.4%) | 26 (7.8%) |
Employment Status by Educational Attainment in Walkerville
According to labor force statistics for Walkerville, 72.3% of individuals (258) out of the total population between 25 and 64 years of age (357) are in the labor force, with 6.6% or 17 of them being unemployed. The group with the highest labor force participation rate are those with the educational attainment of less than high school, with 85.0% or 17 individuals in the labor force. Within the labor force, individuals with less than high school education have the highest percentage of unemployment, with 47.1% or 8 of them being unemployed.
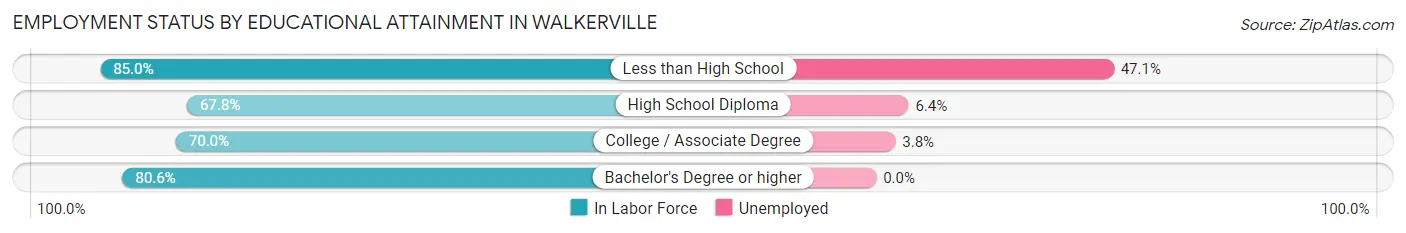
| Educational Attainment | In Labor Force | Unemployed |
| Less than High School | 17 (85.0%) | 9 (47.1%) |
| High School Diploma | 78 (67.8%) | 7 (6.4%) |
| College / Associate Degree | 105 (70.0%) | 6 (3.8%) |
| Bachelor's Degree or higher | 58 (80.6%) | 0 (0.0%) |
| Total | 258 (72.3%) | 24 (6.6%) |
Employment Occupations by Sex in Walkerville
Management, Business, Science and Arts Occupations
The most common Management, Business, Science and Arts occupations in Walkerville are Management (24 | 7.8%), Community & Social Service (21 | 6.8%), Education Instruction & Library (16 | 5.2%), Business & Financial (12 | 3.9%), and Health Diagnosing & Treating (12 | 3.9%).
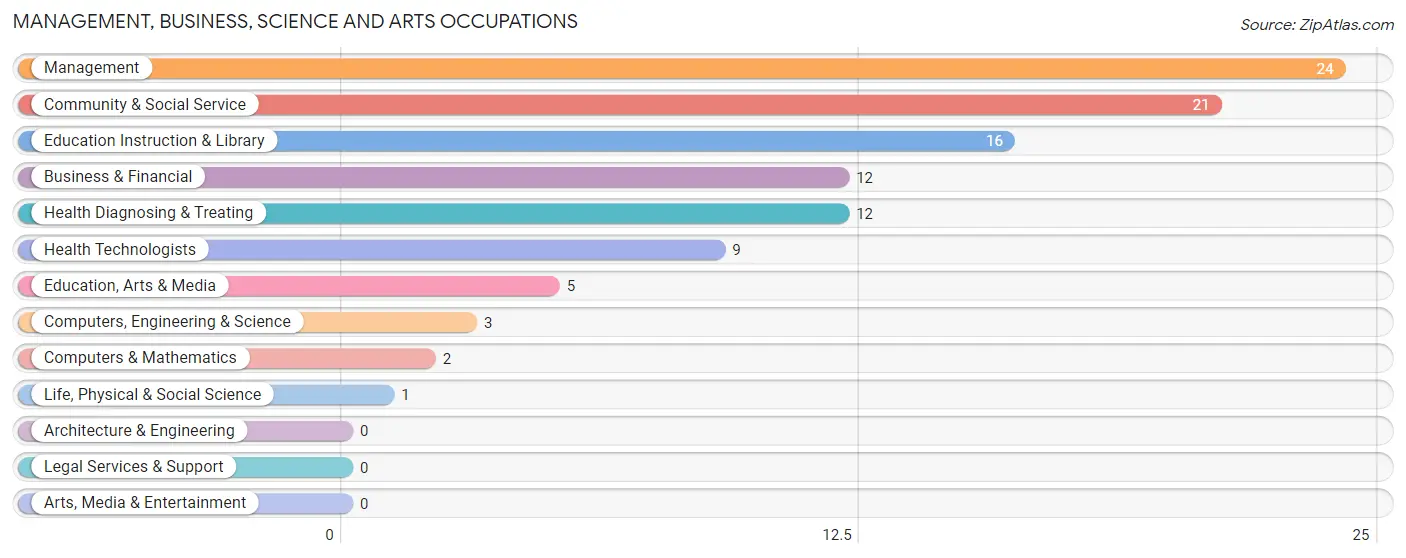
Management, Business, Science and Arts Occupations by Sex
Within the Management, Business, Science and Arts occupations in Walkerville, the most male-oriented occupations are Business & Financial (100.0%), Computers, Engineering & Science (100.0%), and Computers & Mathematics (100.0%), while the most female-oriented occupations are Health Diagnosing & Treating (91.7%), Health Technologists (88.9%), and Education, Arts & Media (80.0%).
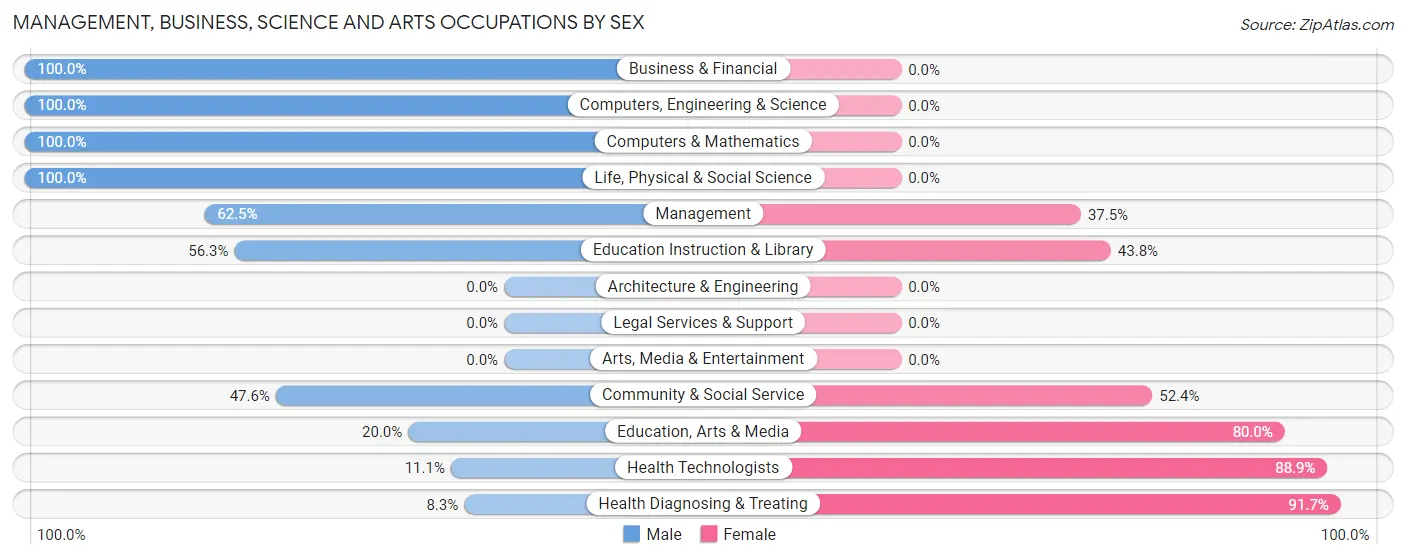
| Occupation | Male | Female |
| Management | 15 (62.5%) | 9 (37.5%) |
| Business & Financial | 12 (100.0%) | 0 (0.0%) |
| Computers, Engineering & Science | 3 (100.0%) | 0 (0.0%) |
| Computers & Mathematics | 2 (100.0%) | 0 (0.0%) |
| Architecture & Engineering | 0 (0.0%) | 0 (0.0%) |
| Life, Physical & Social Science | 1 (100.0%) | 0 (0.0%) |
| Community & Social Service | 10 (47.6%) | 11 (52.4%) |
| Education, Arts & Media | 1 (20.0%) | 4 (80.0%) |
| Legal Services & Support | 0 (0.0%) | 0 (0.0%) |
| Education Instruction & Library | 9 (56.2%) | 7 (43.8%) |
| Arts, Media & Entertainment | 0 (0.0%) | 0 (0.0%) |
| Health Diagnosing & Treating | 1 (8.3%) | 11 (91.7%) |
| Health Technologists | 1 (11.1%) | 8 (88.9%) |
| Total (Category) | 41 (56.9%) | 31 (43.1%) |
| Total (Overall) | 144 (46.6%) | 165 (53.4%) |
Services Occupations
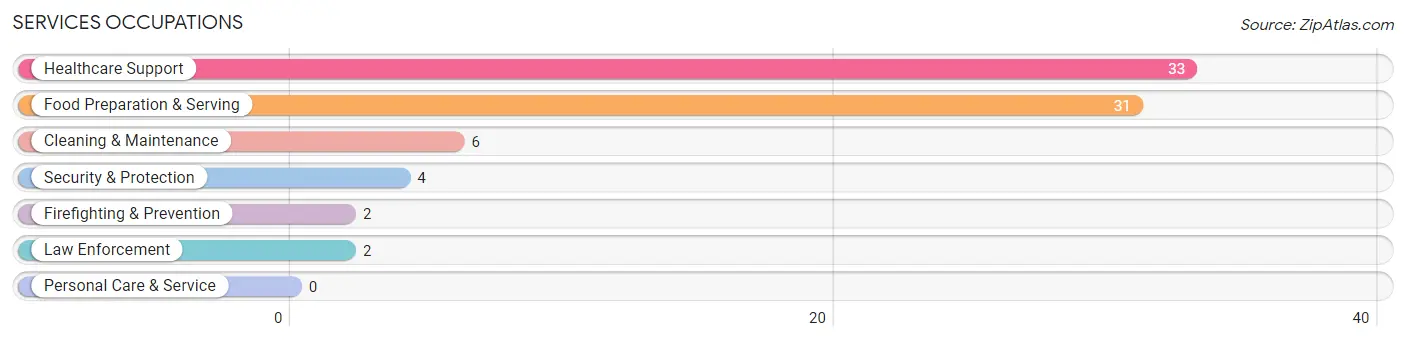
The most common Services occupations in Walkerville are Healthcare Support (33 | 10.7%), Food Preparation & Serving (31 | 10.0%), Cleaning & Maintenance (6 | 1.9%), Security & Protection (4 | 1.3%), and Firefighting & Prevention (2 | 0.6%).
Services Occupations by Sex
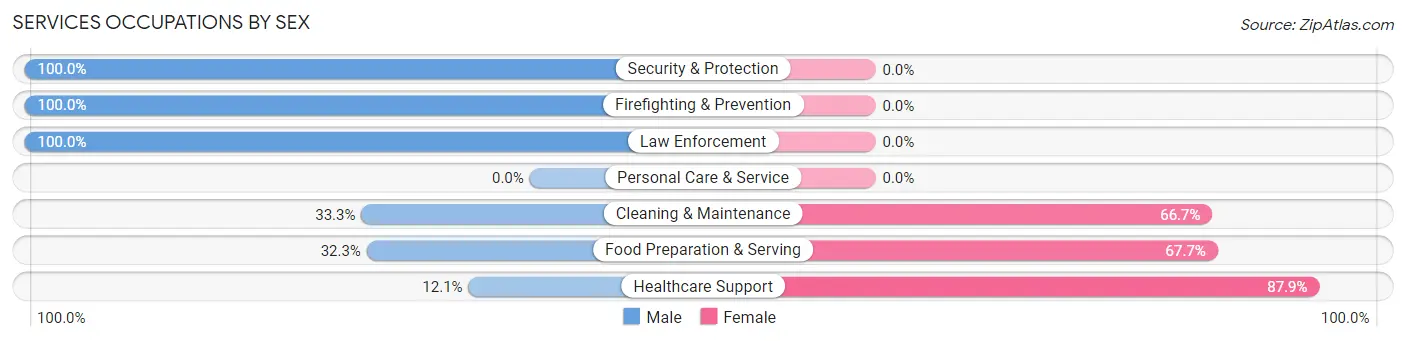
Within the Services occupations in Walkerville, the most male-oriented occupations are Security & Protection (100.0%), Firefighting & Prevention (100.0%), and Law Enforcement (100.0%), while the most female-oriented occupations are Healthcare Support (87.9%), Food Preparation & Serving (67.7%), and Cleaning & Maintenance (66.7%).
| Occupation | Male | Female |
| Healthcare Support | 4 (12.1%) | 29 (87.9%) |
| Security & Protection | 4 (100.0%) | 0 (0.0%) |
| Firefighting & Prevention | 2 (100.0%) | 0 (0.0%) |
| Law Enforcement | 2 (100.0%) | 0 (0.0%) |
| Food Preparation & Serving | 10 (32.3%) | 21 (67.7%) |
| Cleaning & Maintenance | 2 (33.3%) | 4 (66.7%) |
| Personal Care & Service | 0 (0.0%) | 0 (0.0%) |
| Total (Category) | 20 (27.0%) | 54 (73.0%) |
| Total (Overall) | 144 (46.6%) | 165 (53.4%) |
Sales and Office Occupations
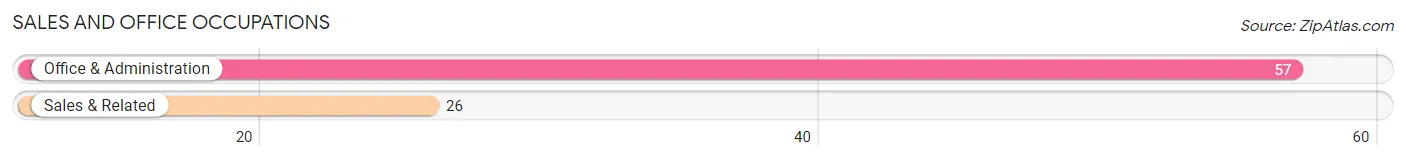
The most common Sales and Office occupations in Walkerville are Office & Administration (57 | 18.4%), and Sales & Related (26 | 8.4%).
Sales and Office Occupations by Sex
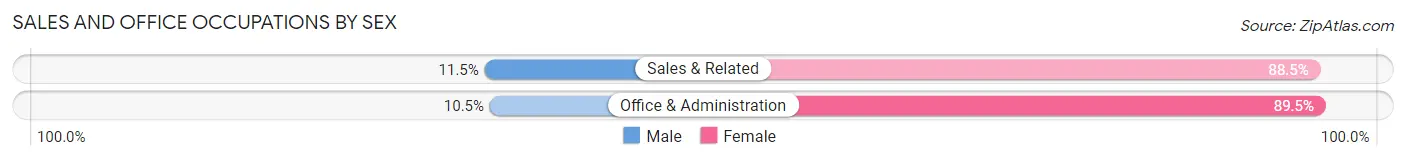
| Occupation | Male | Female |
| Sales & Related | 3 (11.5%) | 23 (88.5%) |
| Office & Administration | 6 (10.5%) | 51 (89.5%) |
| Total (Category) | 9 (10.8%) | 74 (89.2%) |
| Total (Overall) | 144 (46.6%) | 165 (53.4%) |
Natural Resources, Construction and Maintenance Occupations
The most common Natural Resources, Construction and Maintenance occupations in Walkerville are Construction & Extraction (22 | 7.1%), and Installation, Maintenance & Repair (10 | 3.2%).
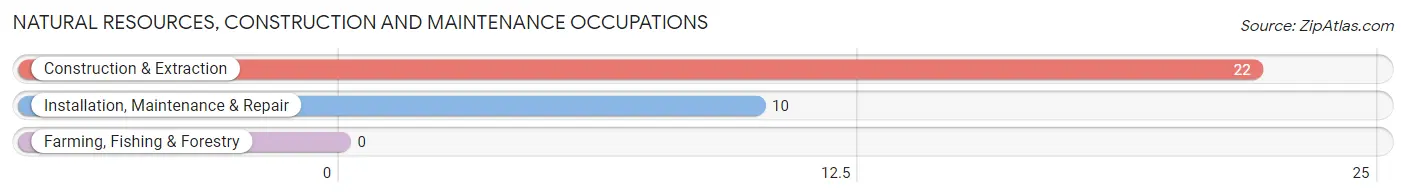
Natural Resources, Construction and Maintenance Occupations by Sex

| Occupation | Male | Female |
| Farming, Fishing & Forestry | 0 (0.0%) | 0 (0.0%) |
| Construction & Extraction | 22 (100.0%) | 0 (0.0%) |
| Installation, Maintenance & Repair | 7 (70.0%) | 3 (30.0%) |
| Total (Category) | 29 (90.6%) | 3 (9.4%) |
| Total (Overall) | 144 (46.6%) | 165 (53.4%) |
Production, Transportation and Moving Occupations
The most common Production, Transportation and Moving occupations in Walkerville are Transportation (34 | 11.0%), Production (10 | 3.2%), and Material Moving (4 | 1.3%).
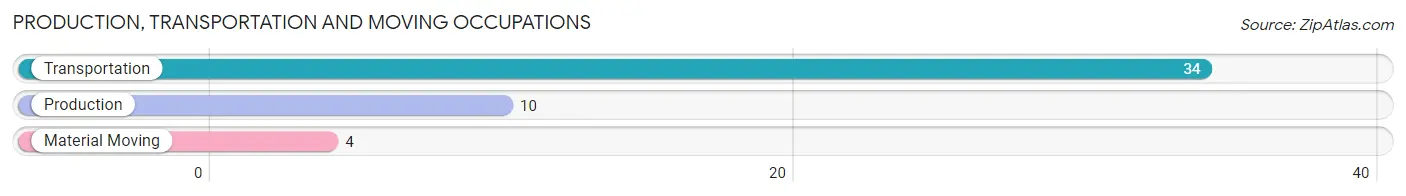
Production, Transportation and Moving Occupations by Sex
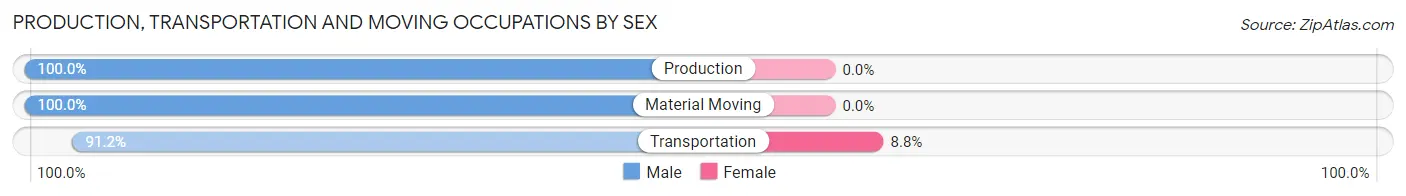
| Occupation | Male | Female |
| Production | 10 (100.0%) | 0 (0.0%) |
| Transportation | 31 (91.2%) | 3 (8.8%) |
| Material Moving | 4 (100.0%) | 0 (0.0%) |
| Total (Category) | 45 (93.8%) | 3 (6.2%) |
| Total (Overall) | 144 (46.6%) | 165 (53.4%) |
Employment Industries by Sex in Walkerville
Employment Industries in Walkerville
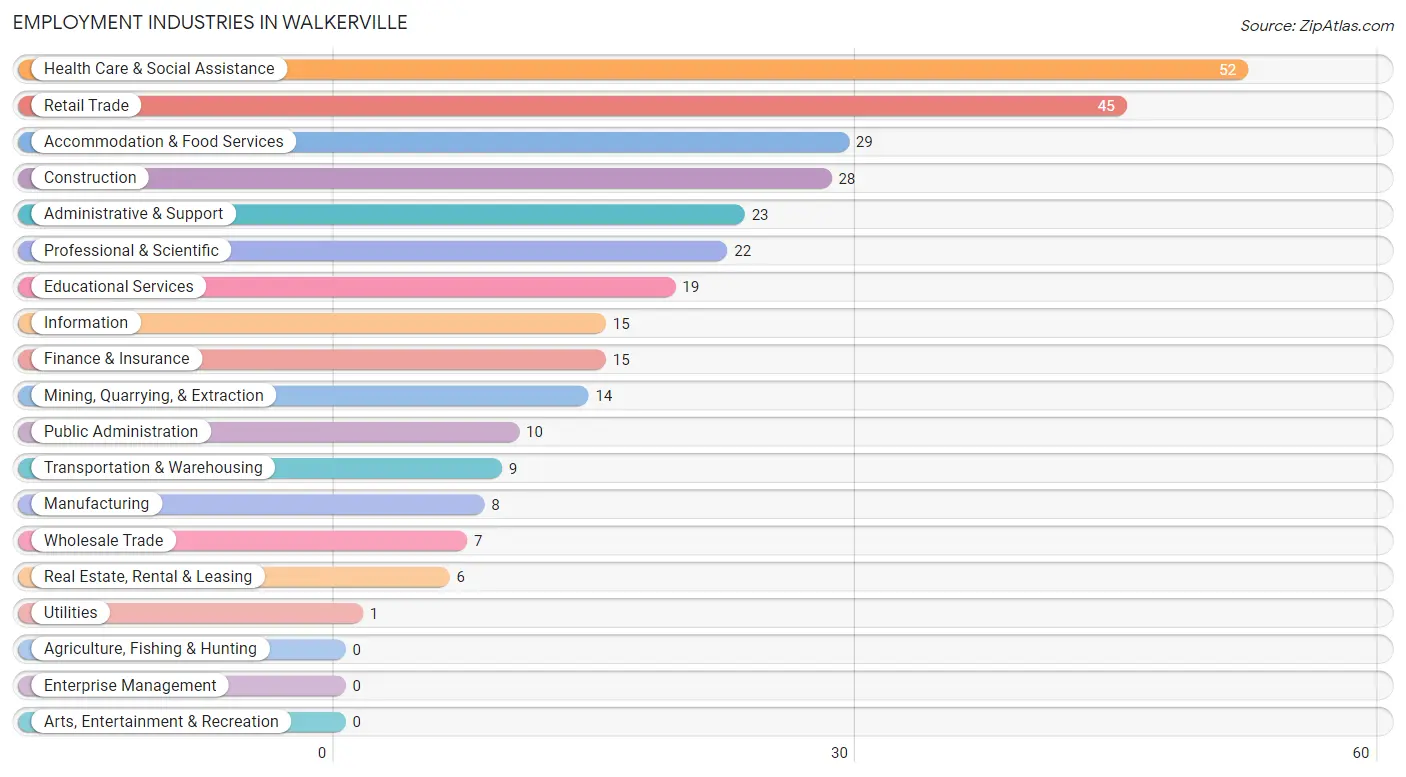
The major employment industries in Walkerville include Health Care & Social Assistance (52 | 16.8%), Retail Trade (45 | 14.6%), Accommodation & Food Services (29 | 9.4%), Construction (28 | 9.1%), and Administrative & Support (23 | 7.4%).
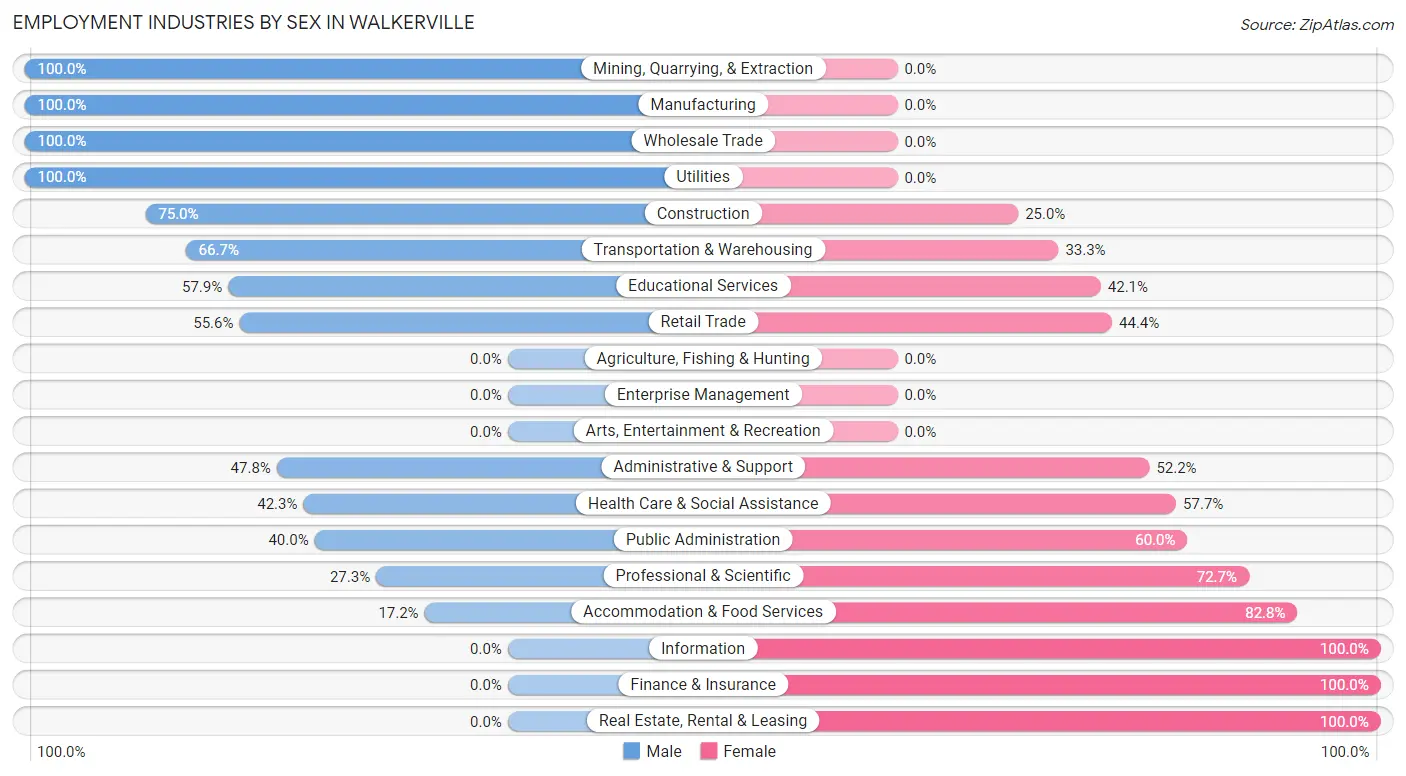
Employment Industries by Sex in Walkerville
The Walkerville industries that see more men than women are Mining, Quarrying, & Extraction (100.0%), Manufacturing (100.0%), and Wholesale Trade (100.0%), whereas the industries that tend to have a higher number of women are Information (100.0%), Finance & Insurance (100.0%), and Real Estate, Rental & Leasing (100.0%).
| Industry | Male | Female |
| Agriculture, Fishing & Hunting | 0 (0.0%) | 0 (0.0%) |
| Mining, Quarrying, & Extraction | 14 (100.0%) | 0 (0.0%) |
| Construction | 21 (75.0%) | 7 (25.0%) |
| Manufacturing | 8 (100.0%) | 0 (0.0%) |
| Wholesale Trade | 7 (100.0%) | 0 (0.0%) |
| Retail Trade | 25 (55.6%) | 20 (44.4%) |
| Transportation & Warehousing | 6 (66.7%) | 3 (33.3%) |
| Utilities | 1 (100.0%) | 0 (0.0%) |
| Information | 0 (0.0%) | 15 (100.0%) |
| Finance & Insurance | 0 (0.0%) | 15 (100.0%) |
| Real Estate, Rental & Leasing | 0 (0.0%) | 6 (100.0%) |
| Professional & Scientific | 6 (27.3%) | 16 (72.7%) |
| Enterprise Management | 0 (0.0%) | 0 (0.0%) |
| Administrative & Support | 11 (47.8%) | 12 (52.2%) |
| Educational Services | 11 (57.9%) | 8 (42.1%) |
| Health Care & Social Assistance | 22 (42.3%) | 30 (57.7%) |
| Arts, Entertainment & Recreation | 0 (0.0%) | 0 (0.0%) |
| Accommodation & Food Services | 5 (17.2%) | 24 (82.8%) |
| Public Administration | 4 (40.0%) | 6 (60.0%) |
| Total | 144 (46.6%) | 165 (53.4%) |
Education in Walkerville
School Enrollment in Walkerville
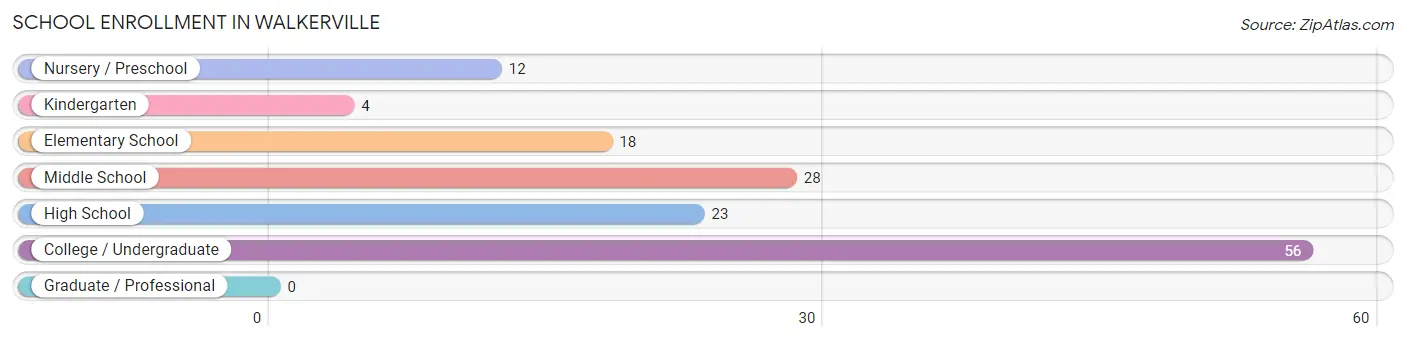
The most common levels of schooling among the 141 students in Walkerville are college / undergraduate (56 | 39.7%), middle school (28 | 19.9%), and high school (23 | 16.3%).
| School Level | # Students | % Students |
| Nursery / Preschool | 12 | 8.5% |
| Kindergarten | 4 | 2.8% |
| Elementary School | 18 | 12.8% |
| Middle School | 28 | 19.9% |
| High School | 23 | 16.3% |
| College / Undergraduate | 56 | 39.7% |
| Graduate / Professional | 0 | 0.0% |
| Total | 141 | 100.0% |
School Enrollment by Age by Funding Source in Walkerville
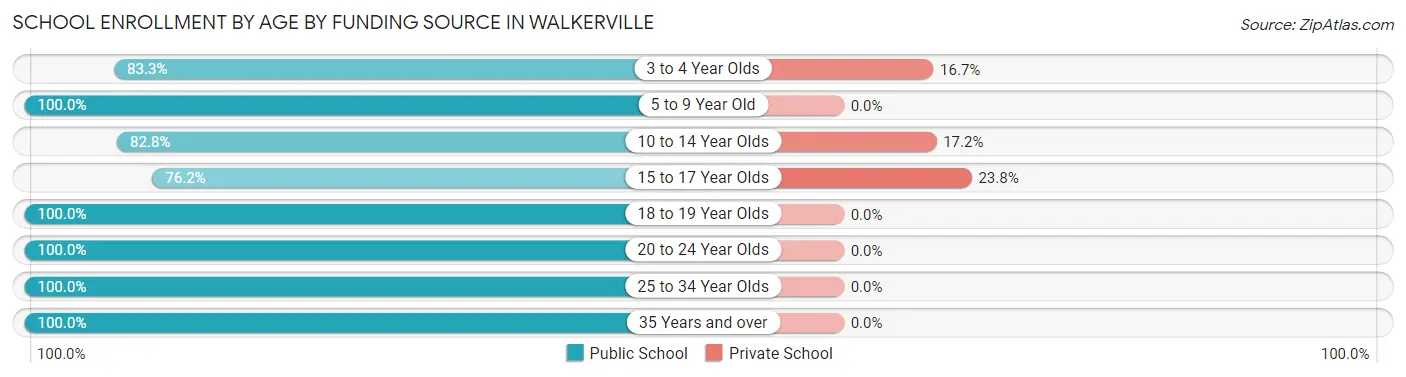
Out of a total of 141 students who are enrolled in schools in Walkerville, 12 (8.5%) attend a private institution, while the remaining 129 (91.5%) are enrolled in public schools. The age group of 15 to 17 year olds has the highest likelihood of being enrolled in private schools, with 5 (23.8% in the age bracket) enrolled. Conversely, the age group of 5 to 9 year old has the lowest likelihood of being enrolled in a private school, with 22 (100.0% in the age bracket) attending a public institution.
| Age Bracket | Public School | Private School |
| 3 to 4 Year Olds | 10 (83.3%) | 2 (16.7%) |
| 5 to 9 Year Old | 22 (100.0%) | 0 (0.0%) |
| 10 to 14 Year Olds | 24 (82.8%) | 5 (17.2%) |
| 15 to 17 Year Olds | 16 (76.2%) | 5 (23.8%) |
| 18 to 19 Year Olds | 3 (100.0%) | 0 (0.0%) |
| 20 to 24 Year Olds | 26 (100.0%) | 0 (0.0%) |
| 25 to 34 Year Olds | 15 (100.0%) | 0 (0.0%) |
| 35 Years and over | 13 (100.0%) | 0 (0.0%) |
| Total | 129 (91.5%) | 12 (8.5%) |
Educational Attainment by Field of Study in Walkerville
Science & technology (30 | 24.8%), arts & humanities (27 | 22.3%), business (19 | 15.7%), physical & health sciences (11 | 9.1%), and bio, nature & agricultural (9 | 7.4%) are the most common fields of study among 121 individuals in Walkerville who have obtained a bachelor's degree or higher.
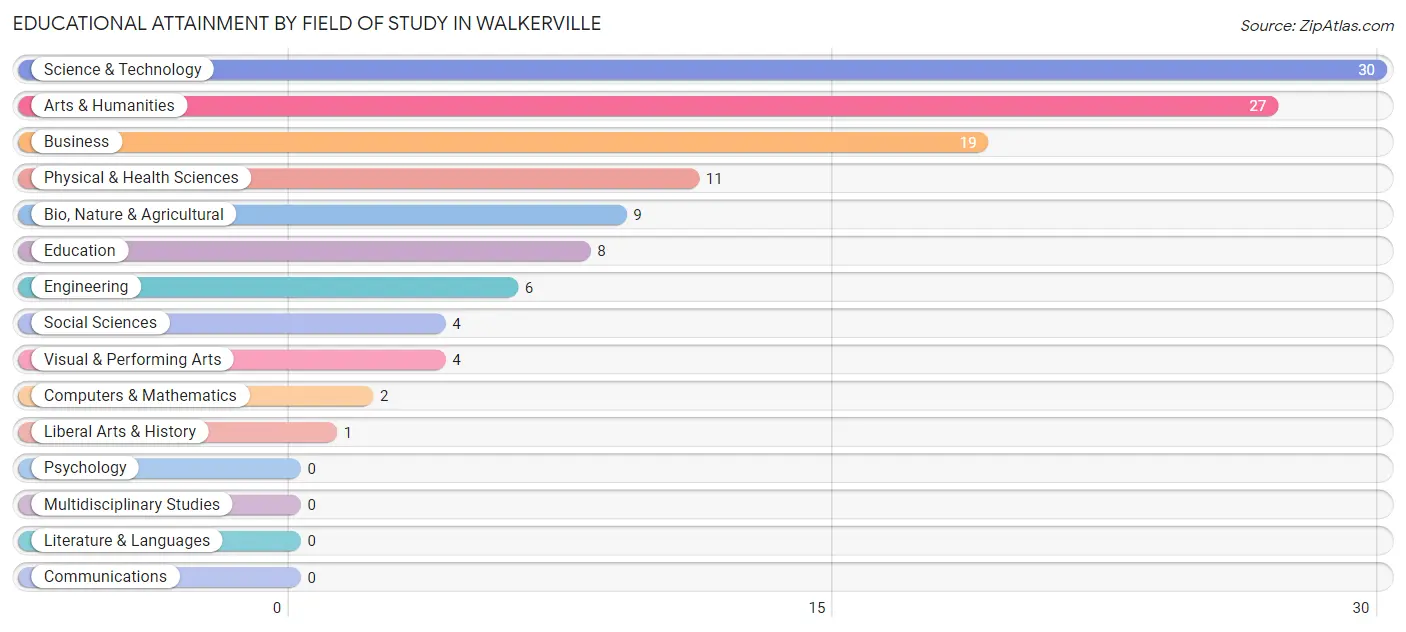
| Field of Study | # Graduates | % Graduates |
| Computers & Mathematics | 2 | 1.7% |
| Bio, Nature & Agricultural | 9 | 7.4% |
| Physical & Health Sciences | 11 | 9.1% |
| Psychology | 0 | 0.0% |
| Social Sciences | 4 | 3.3% |
| Engineering | 6 | 5.0% |
| Multidisciplinary Studies | 0 | 0.0% |
| Science & Technology | 30 | 24.8% |
| Business | 19 | 15.7% |
| Education | 8 | 6.6% |
| Literature & Languages | 0 | 0.0% |
| Liberal Arts & History | 1 | 0.8% |
| Visual & Performing Arts | 4 | 3.3% |
| Communications | 0 | 0.0% |
| Arts & Humanities | 27 | 22.3% |
| Total | 121 | 100.0% |
Transportation & Commute in Walkerville
Vehicle Availability by Sex in Walkerville
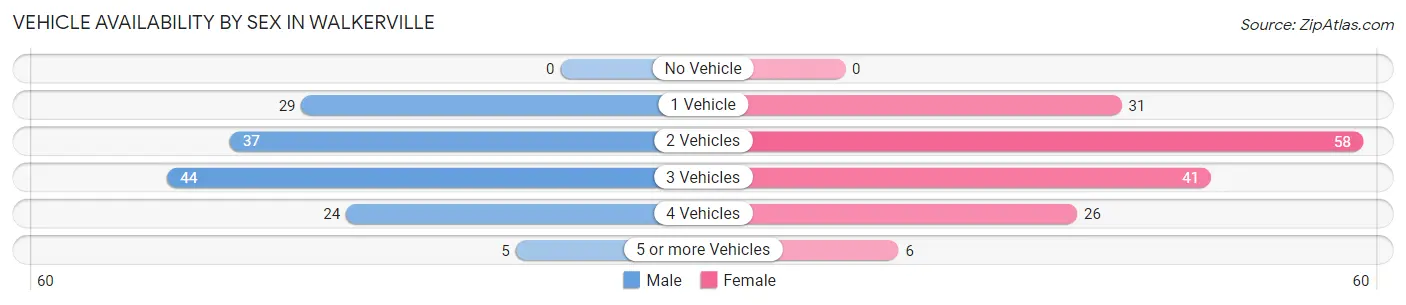
The most prevalent vehicle ownership categories in Walkerville are males with 3 vehicles (44, accounting for 31.7%) and females with 3 vehicles (41, making up 27.2%).
| Vehicles Available | Male | Female |
| No Vehicle | 0 (0.0%) | 0 (0.0%) |
| 1 Vehicle | 29 (20.9%) | 31 (19.1%) |
| 2 Vehicles | 37 (26.6%) | 58 (35.8%) |
| 3 Vehicles | 44 (31.7%) | 41 (25.3%) |
| 4 Vehicles | 24 (17.3%) | 26 (16.1%) |
| 5 or more Vehicles | 5 (3.6%) | 6 (3.7%) |
| Total | 139 (100.0%) | 162 (100.0%) |
Commute Time in Walkerville
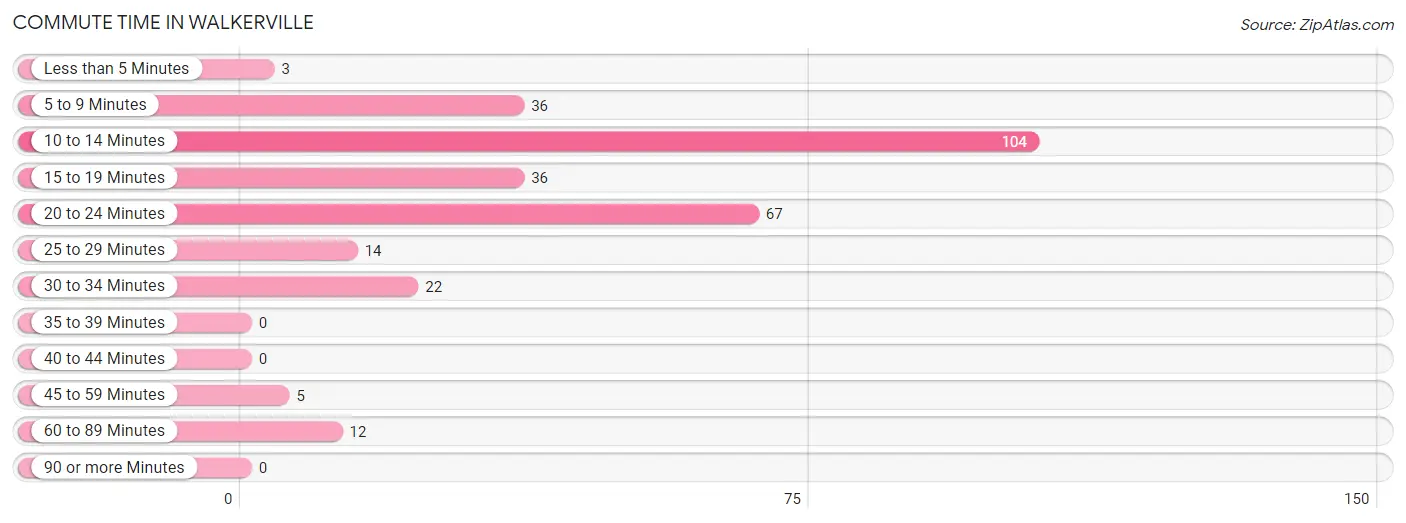
The most frequently occuring commute durations in Walkerville are 10 to 14 minutes (104 commuters, 34.8%), 20 to 24 minutes (67 commuters, 22.4%), and 5 to 9 minutes (36 commuters, 12.0%).
| Commute Time | # Commuters | % Commuters |
| Less than 5 Minutes | 3 | 1.0% |
| 5 to 9 Minutes | 36 | 12.0% |
| 10 to 14 Minutes | 104 | 34.8% |
| 15 to 19 Minutes | 36 | 12.0% |
| 20 to 24 Minutes | 67 | 22.4% |
| 25 to 29 Minutes | 14 | 4.7% |
| 30 to 34 Minutes | 22 | 7.4% |
| 35 to 39 Minutes | 0 | 0.0% |
| 40 to 44 Minutes | 0 | 0.0% |
| 45 to 59 Minutes | 5 | 1.7% |
| 60 to 89 Minutes | 12 | 4.0% |
| 90 or more Minutes | 0 | 0.0% |
Commute Time by Sex in Walkerville
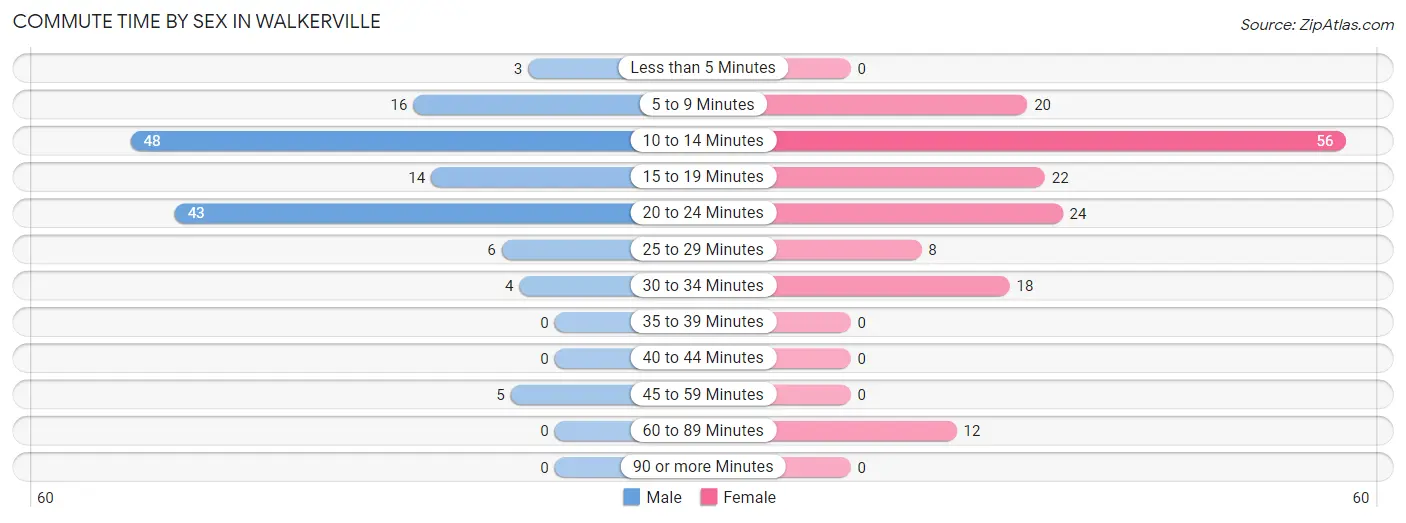
The most common commute times in Walkerville are 10 to 14 minutes (48 commuters, 34.5%) for males and 10 to 14 minutes (56 commuters, 35.0%) for females.
| Commute Time | Male | Female |
| Less than 5 Minutes | 3 (2.2%) | 0 (0.0%) |
| 5 to 9 Minutes | 16 (11.5%) | 20 (12.5%) |
| 10 to 14 Minutes | 48 (34.5%) | 56 (35.0%) |
| 15 to 19 Minutes | 14 (10.1%) | 22 (13.8%) |
| 20 to 24 Minutes | 43 (30.9%) | 24 (15.0%) |
| 25 to 29 Minutes | 6 (4.3%) | 8 (5.0%) |
| 30 to 34 Minutes | 4 (2.9%) | 18 (11.3%) |
| 35 to 39 Minutes | 0 (0.0%) | 0 (0.0%) |
| 40 to 44 Minutes | 0 (0.0%) | 0 (0.0%) |
| 45 to 59 Minutes | 5 (3.6%) | 0 (0.0%) |
| 60 to 89 Minutes | 0 (0.0%) | 12 (7.5%) |
| 90 or more Minutes | 0 (0.0%) | 0 (0.0%) |
Time of Departure to Work by Sex in Walkerville
The most frequent times of departure to work in Walkerville are 6:00 AM to 6:29 AM (31, 22.3%) for males and 7:30 AM to 7:59 AM (35, 21.9%) for females.
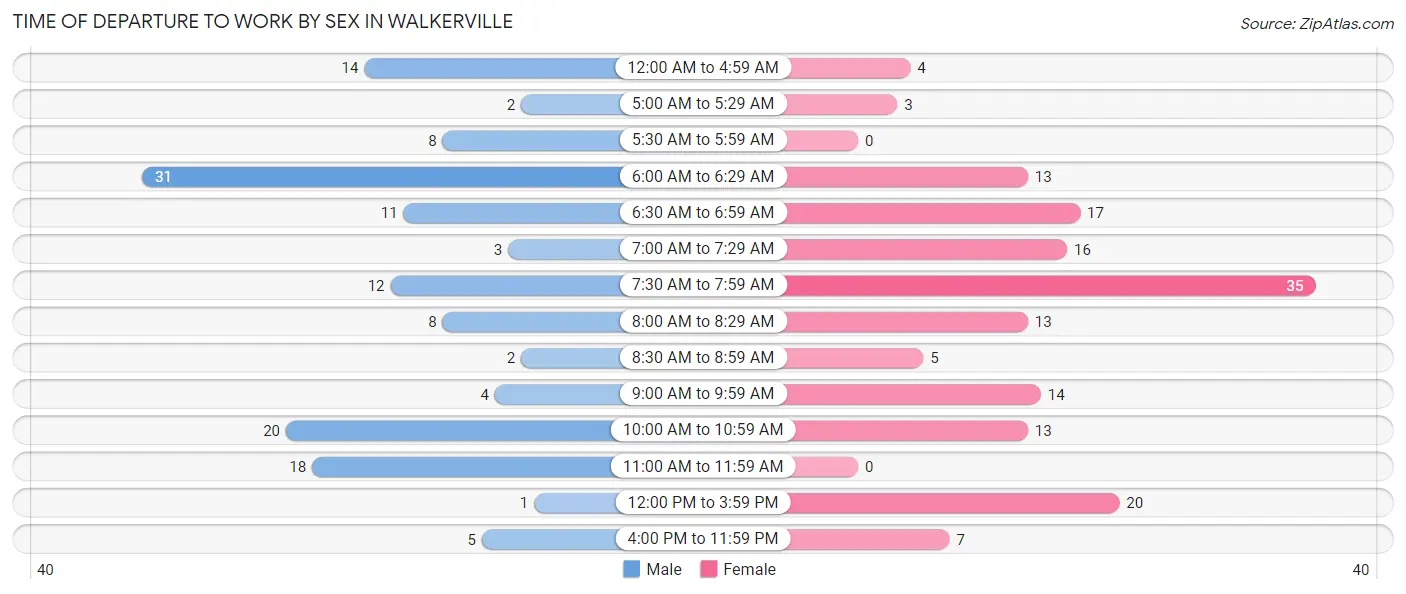
| Time of Departure | Male | Female |
| 12:00 AM to 4:59 AM | 14 (10.1%) | 4 (2.5%) |
| 5:00 AM to 5:29 AM | 2 (1.4%) | 3 (1.9%) |
| 5:30 AM to 5:59 AM | 8 (5.8%) | 0 (0.0%) |
| 6:00 AM to 6:29 AM | 31 (22.3%) | 13 (8.1%) |
| 6:30 AM to 6:59 AM | 11 (7.9%) | 17 (10.6%) |
| 7:00 AM to 7:29 AM | 3 (2.2%) | 16 (10.0%) |
| 7:30 AM to 7:59 AM | 12 (8.6%) | 35 (21.9%) |
| 8:00 AM to 8:29 AM | 8 (5.8%) | 13 (8.1%) |
| 8:30 AM to 8:59 AM | 2 (1.4%) | 5 (3.1%) |
| 9:00 AM to 9:59 AM | 4 (2.9%) | 14 (8.7%) |
| 10:00 AM to 10:59 AM | 20 (14.4%) | 13 (8.1%) |
| 11:00 AM to 11:59 AM | 18 (13.0%) | 0 (0.0%) |
| 12:00 PM to 3:59 PM | 1 (0.7%) | 20 (12.5%) |
| 4:00 PM to 11:59 PM | 5 (3.6%) | 7 (4.4%) |
| Total | 139 (100.0%) | 160 (100.0%) |
Housing Occupancy in Walkerville
Occupancy by Ownership in Walkerville
Of the total 305 dwellings in Walkerville, owner-occupied units account for 210 (68.9%), while renter-occupied units make up 95 (31.1%).
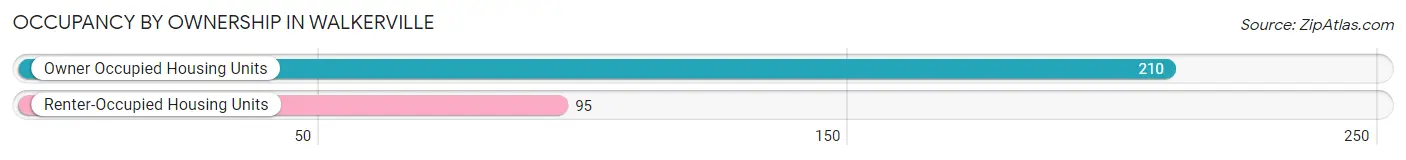
| Occupancy | # Housing Units | % Housing Units |
| Owner Occupied Housing Units | 210 | 68.9% |
| Renter-Occupied Housing Units | 95 | 31.1% |
| Total Occupied Housing Units | 305 | 100.0% |
Occupancy by Household Size in Walkerville
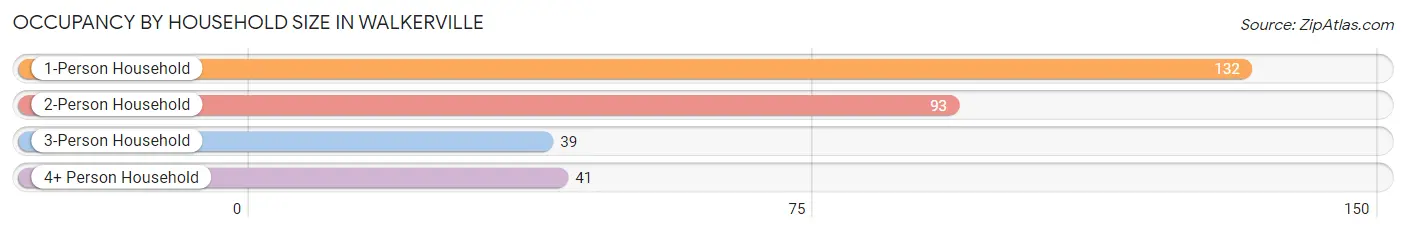
| Household Size | # Housing Units | % Housing Units |
| 1-Person Household | 132 | 43.3% |
| 2-Person Household | 93 | 30.5% |
| 3-Person Household | 39 | 12.8% |
| 4+ Person Household | 41 | 13.4% |
| Total Housing Units | 305 | 100.0% |
Occupancy by Ownership by Household Size in Walkerville
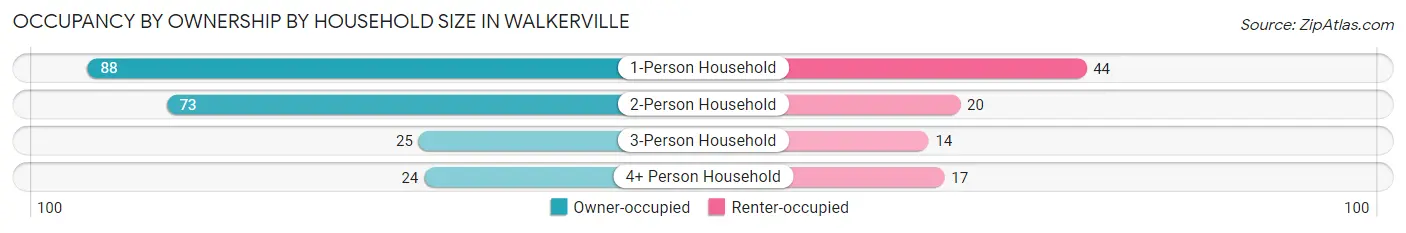
| Household Size | Owner-occupied | Renter-occupied |
| 1-Person Household | 88 (66.7%) | 44 (33.3%) |
| 2-Person Household | 73 (78.5%) | 20 (21.5%) |
| 3-Person Household | 25 (64.1%) | 14 (35.9%) |
| 4+ Person Household | 24 (58.5%) | 17 (41.5%) |
| Total Housing Units | 210 (68.9%) | 95 (31.1%) |
Occupancy by Educational Attainment in Walkerville
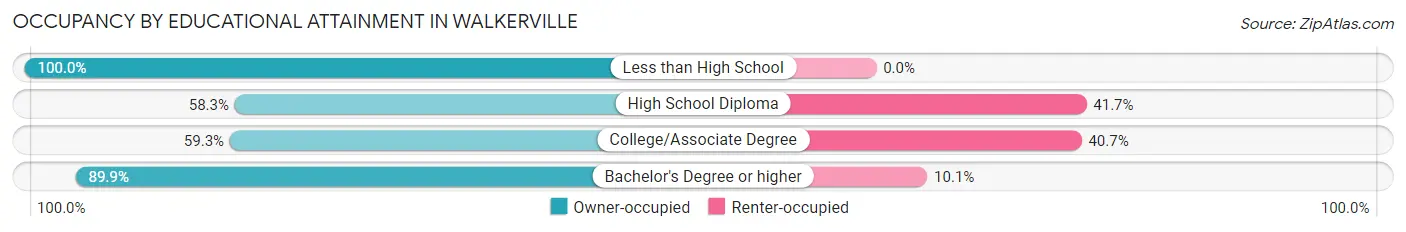
| Household Size | Owner-occupied | Renter-occupied |
| Less than High School | 7 (100.0%) | 0 (0.0%) |
| High School Diploma | 56 (58.3%) | 40 (41.7%) |
| College/Associate Degree | 67 (59.3%) | 46 (40.7%) |
| Bachelor's Degree or higher | 80 (89.9%) | 9 (10.1%) |
Occupancy by Age of Householder in Walkerville
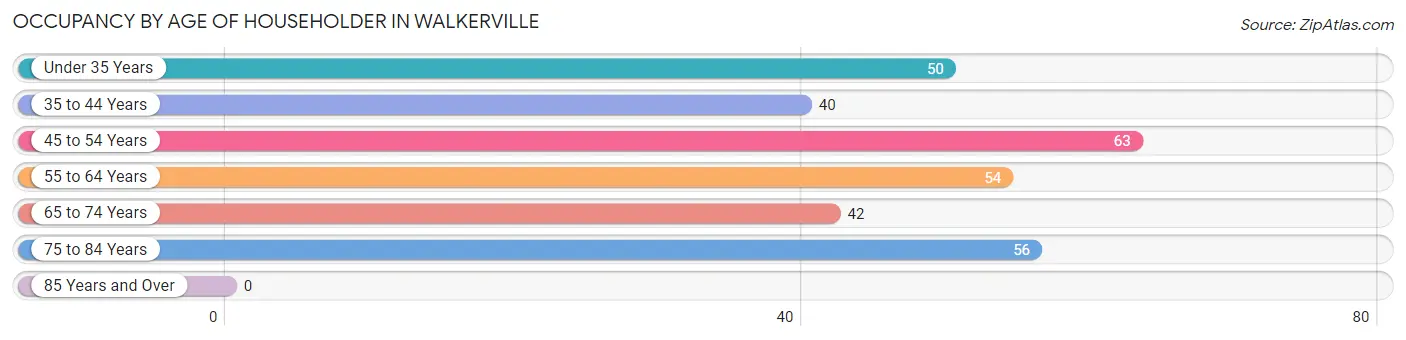
| Age Bracket | # Households | % Households |
| Under 35 Years | 50 | 16.4% |
| 35 to 44 Years | 40 | 13.1% |
| 45 to 54 Years | 63 | 20.7% |
| 55 to 64 Years | 54 | 17.7% |
| 65 to 74 Years | 42 | 13.8% |
| 75 to 84 Years | 56 | 18.4% |
| 85 Years and Over | 0 | 0.0% |
| Total | 305 | 100.0% |
Housing Finances in Walkerville
Median Income by Occupancy in Walkerville
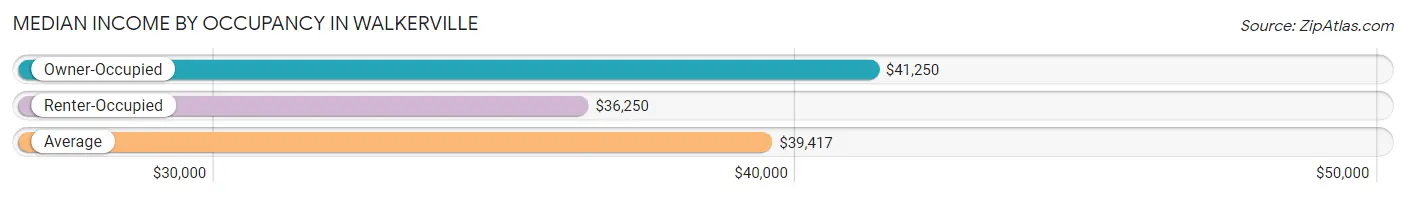
| Occupancy Type | # Households | Median Income |
| Owner-Occupied | 210 (68.9%) | $41,250 |
| Renter-Occupied | 95 (31.1%) | $36,250 |
| Average | 305 (100.0%) | $39,417 |
Occupancy by Householder Income Bracket in Walkerville
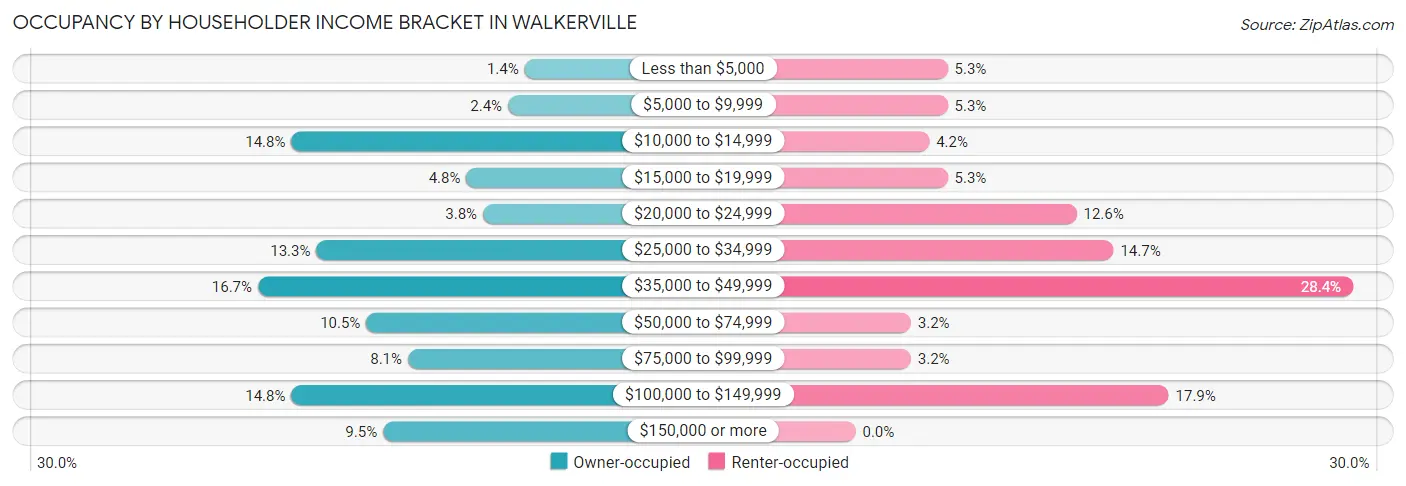
| Income Bracket | Owner-occupied | Renter-occupied |
| Less than $5,000 | 3 (1.4%) | 5 (5.3%) |
| $5,000 to $9,999 | 5 (2.4%) | 5 (5.3%) |
| $10,000 to $14,999 | 31 (14.8%) | 4 (4.2%) |
| $15,000 to $19,999 | 10 (4.8%) | 5 (5.3%) |
| $20,000 to $24,999 | 8 (3.8%) | 12 (12.6%) |
| $25,000 to $34,999 | 28 (13.3%) | 14 (14.7%) |
| $35,000 to $49,999 | 35 (16.7%) | 27 (28.4%) |
| $50,000 to $74,999 | 22 (10.5%) | 3 (3.2%) |
| $75,000 to $99,999 | 17 (8.1%) | 3 (3.2%) |
| $100,000 to $149,999 | 31 (14.8%) | 17 (17.9%) |
| $150,000 or more | 20 (9.5%) | 0 (0.0%) |
| Total | 210 (100.0%) | 95 (100.0%) |
Monthly Housing Cost Tiers in Walkerville
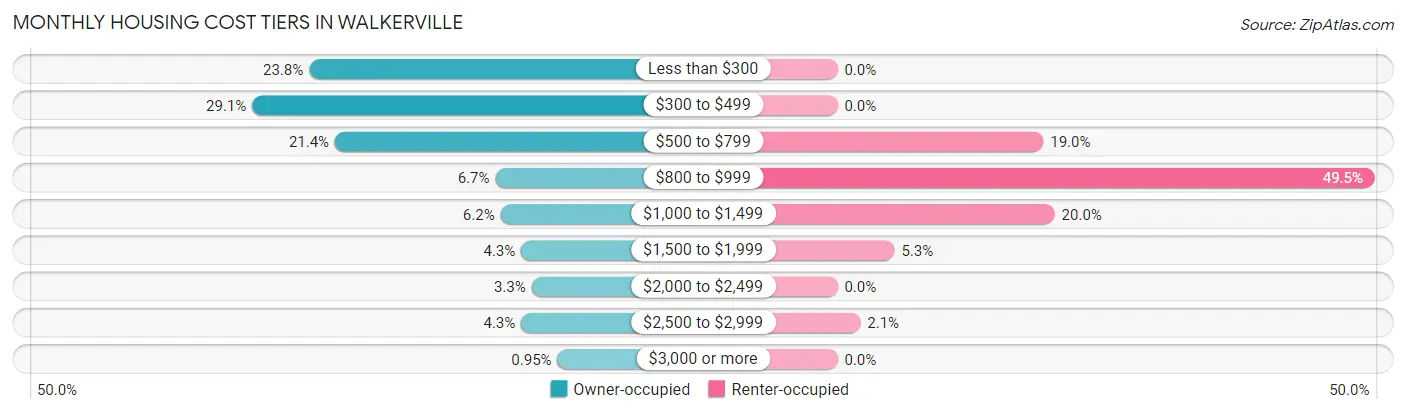
| Monthly Cost | Owner-occupied | Renter-occupied |
| Less than $300 | 50 (23.8%) | 0 (0.0%) |
| $300 to $499 | 61 (29.0%) | 0 (0.0%) |
| $500 to $799 | 45 (21.4%) | 18 (19.0%) |
| $800 to $999 | 14 (6.7%) | 47 (49.5%) |
| $1,000 to $1,499 | 13 (6.2%) | 19 (20.0%) |
| $1,500 to $1,999 | 9 (4.3%) | 5 (5.3%) |
| $2,000 to $2,499 | 7 (3.3%) | 0 (0.0%) |
| $2,500 to $2,999 | 9 (4.3%) | 2 (2.1%) |
| $3,000 or more | 2 (0.9%) | 0 (0.0%) |
| Total | 210 (100.0%) | 95 (100.0%) |
Physical Housing Characteristics in Walkerville
Housing Structures in Walkerville
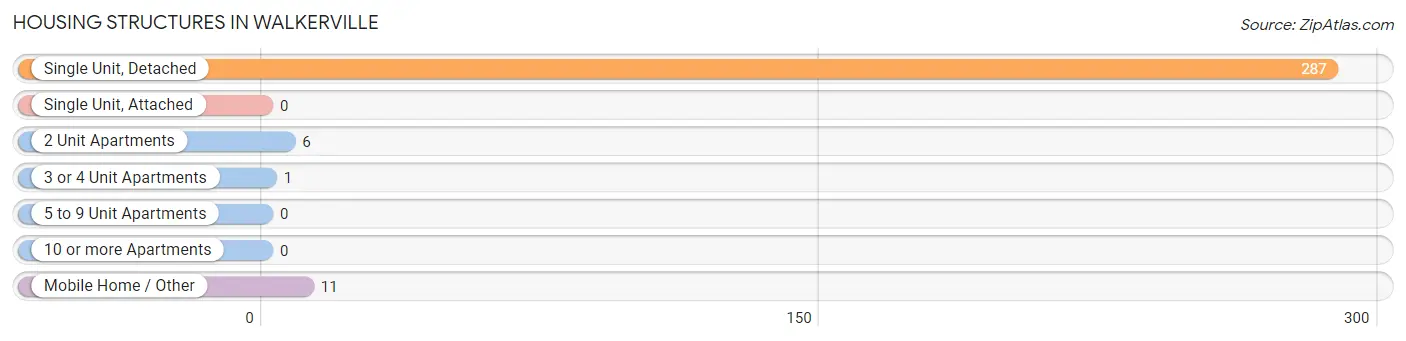
| Structure Type | # Housing Units | % Housing Units |
| Single Unit, Detached | 287 | 94.1% |
| Single Unit, Attached | 0 | 0.0% |
| 2 Unit Apartments | 6 | 2.0% |
| 3 or 4 Unit Apartments | 1 | 0.3% |
| 5 to 9 Unit Apartments | 0 | 0.0% |
| 10 or more Apartments | 0 | 0.0% |
| Mobile Home / Other | 11 | 3.6% |
| Total | 305 | 100.0% |
Housing Structures by Occupancy in Walkerville
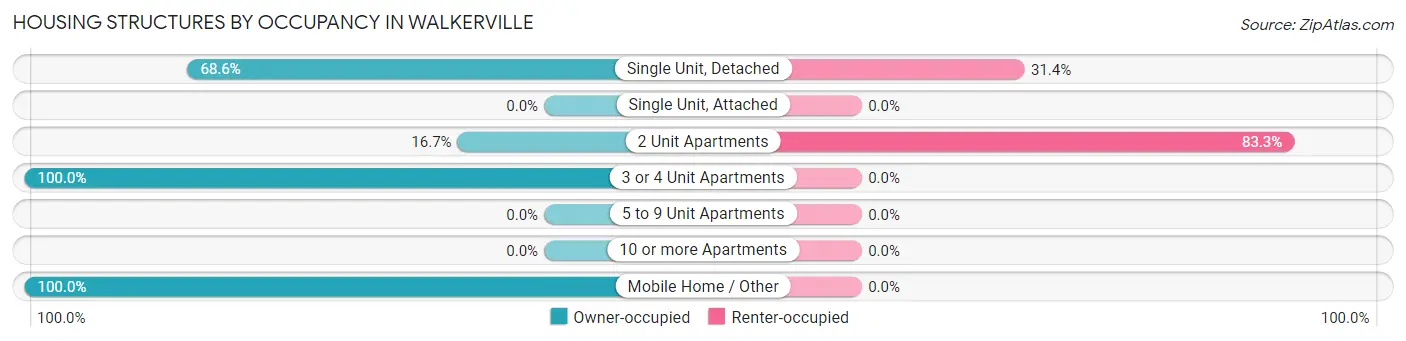
| Structure Type | Owner-occupied | Renter-occupied |
| Single Unit, Detached | 197 (68.6%) | 90 (31.4%) |
| Single Unit, Attached | 0 (0.0%) | 0 (0.0%) |
| 2 Unit Apartments | 1 (16.7%) | 5 (83.3%) |
| 3 or 4 Unit Apartments | 1 (100.0%) | 0 (0.0%) |
| 5 to 9 Unit Apartments | 0 (0.0%) | 0 (0.0%) |
| 10 or more Apartments | 0 (0.0%) | 0 (0.0%) |
| Mobile Home / Other | 11 (100.0%) | 0 (0.0%) |
| Total | 210 (68.9%) | 95 (31.1%) |
Housing Structures by Number of Rooms in Walkerville
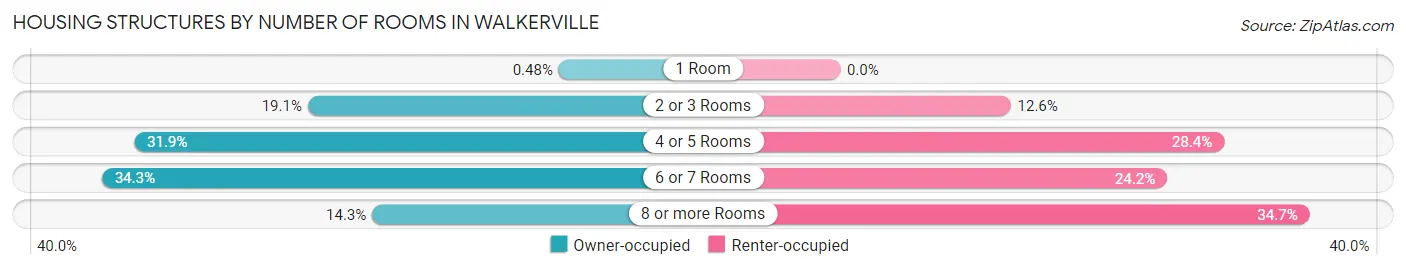
| Number of Rooms | Owner-occupied | Renter-occupied |
| 1 Room | 1 (0.5%) | 0 (0.0%) |
| 2 or 3 Rooms | 40 (19.1%) | 12 (12.6%) |
| 4 or 5 Rooms | 67 (31.9%) | 27 (28.4%) |
| 6 or 7 Rooms | 72 (34.3%) | 23 (24.2%) |
| 8 or more Rooms | 30 (14.3%) | 33 (34.7%) |
| Total | 210 (100.0%) | 95 (100.0%) |
Housing Structure by Heating Type in Walkerville
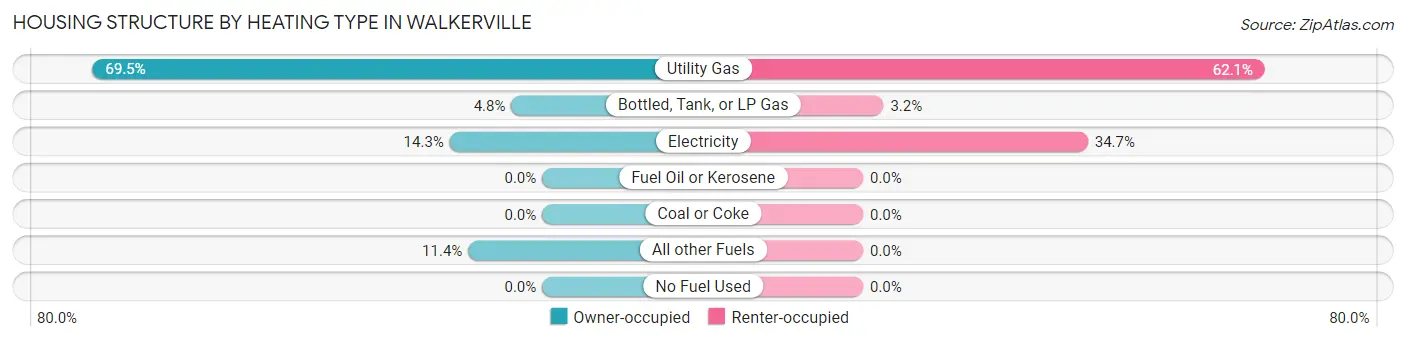
| Heating Type | Owner-occupied | Renter-occupied |
| Utility Gas | 146 (69.5%) | 59 (62.1%) |
| Bottled, Tank, or LP Gas | 10 (4.8%) | 3 (3.2%) |
| Electricity | 30 (14.3%) | 33 (34.7%) |
| Fuel Oil or Kerosene | 0 (0.0%) | 0 (0.0%) |
| Coal or Coke | 0 (0.0%) | 0 (0.0%) |
| All other Fuels | 24 (11.4%) | 0 (0.0%) |
| No Fuel Used | 0 (0.0%) | 0 (0.0%) |
| Total | 210 (100.0%) | 95 (100.0%) |
Household Vehicle Usage in Walkerville
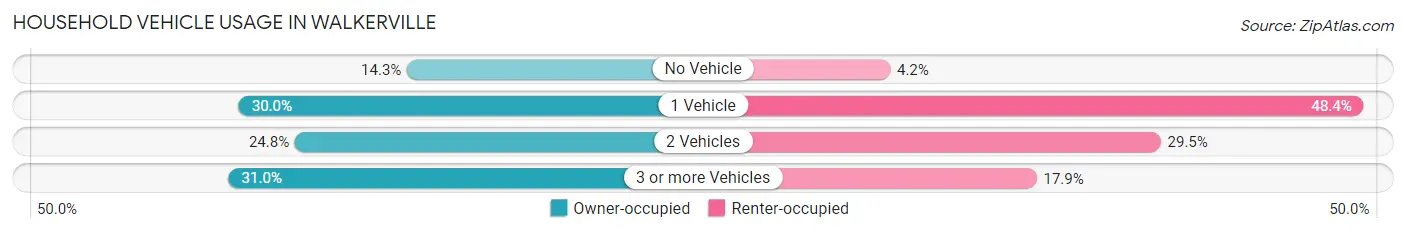
| Vehicles per Household | Owner-occupied | Renter-occupied |
| No Vehicle | 30 (14.3%) | 4 (4.2%) |
| 1 Vehicle | 63 (30.0%) | 46 (48.4%) |
| 2 Vehicles | 52 (24.8%) | 28 (29.5%) |
| 3 or more Vehicles | 65 (30.9%) | 17 (17.9%) |
| Total | 210 (100.0%) | 95 (100.0%) |
Real Estate & Mortgages in Walkerville
Real Estate and Mortgage Overview in Walkerville
| Characteristic | Without Mortgage | With Mortgage |
| Housing Units | 134 | 76 |
| Median Property Value | $111,100 | $160,000 |
| Median Household Income | $34,643 | $2 |
| Monthly Housing Costs | $327 | $2 |
| Real Estate Taxes | $1,313 | $0 |
Property Value by Mortgage Status in Walkerville
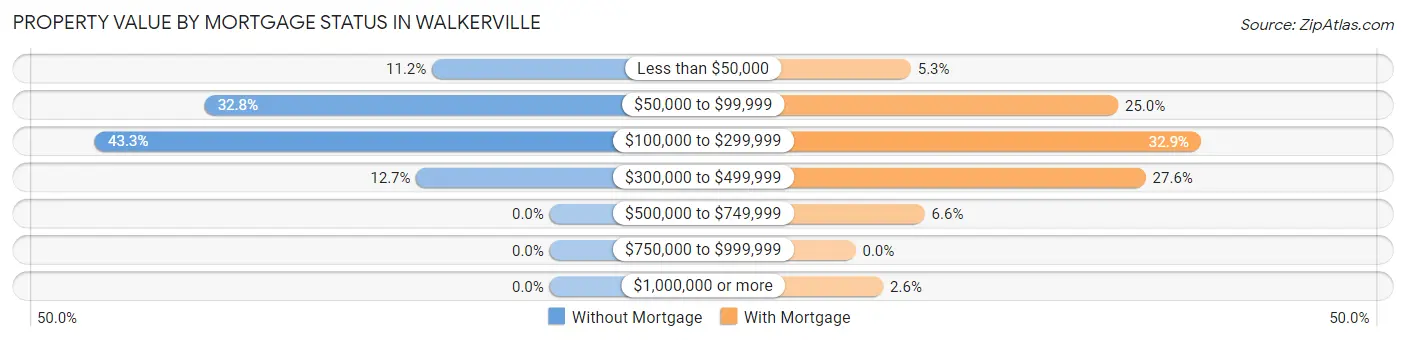
| Property Value | Without Mortgage | With Mortgage |
| Less than $50,000 | 15 (11.2%) | 4 (5.3%) |
| $50,000 to $99,999 | 44 (32.8%) | 19 (25.0%) |
| $100,000 to $299,999 | 58 (43.3%) | 25 (32.9%) |
| $300,000 to $499,999 | 17 (12.7%) | 21 (27.6%) |
| $500,000 to $749,999 | 0 (0.0%) | 5 (6.6%) |
| $750,000 to $999,999 | 0 (0.0%) | 0 (0.0%) |
| $1,000,000 or more | 0 (0.0%) | 2 (2.6%) |
| Total | 134 (100.0%) | 76 (100.0%) |
Household Income by Mortgage Status in Walkerville
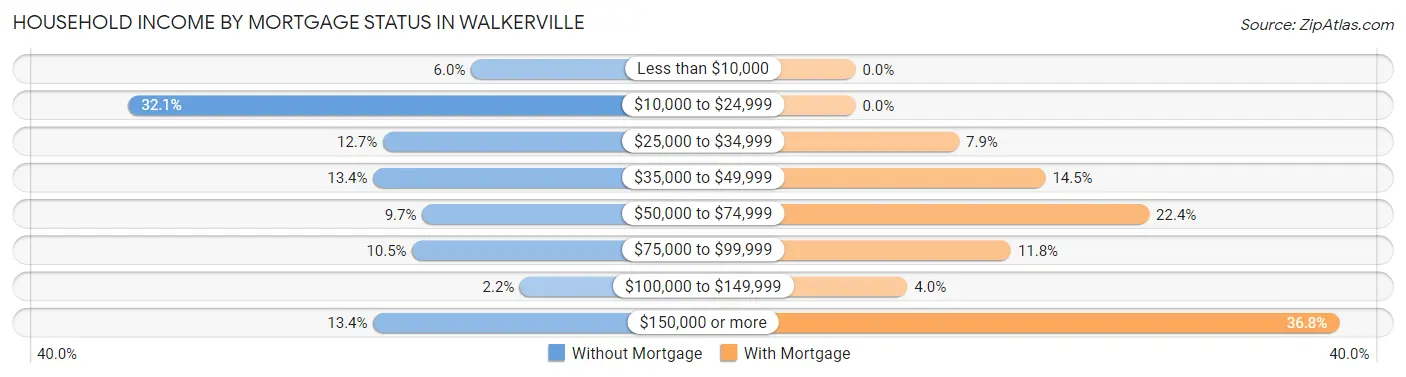
| Household Income | Without Mortgage | With Mortgage |
| Less than $10,000 | 8 (6.0%) | 0 (0.0%) |
| $10,000 to $24,999 | 43 (32.1%) | 0 (0.0%) |
| $25,000 to $34,999 | 17 (12.7%) | 6 (7.9%) |
| $35,000 to $49,999 | 18 (13.4%) | 11 (14.5%) |
| $50,000 to $74,999 | 13 (9.7%) | 17 (22.4%) |
| $75,000 to $99,999 | 14 (10.4%) | 9 (11.8%) |
| $100,000 to $149,999 | 3 (2.2%) | 3 (4.0%) |
| $150,000 or more | 18 (13.4%) | 28 (36.8%) |
| Total | 134 (100.0%) | 76 (100.0%) |
Property Value to Household Income Ratio in Walkerville
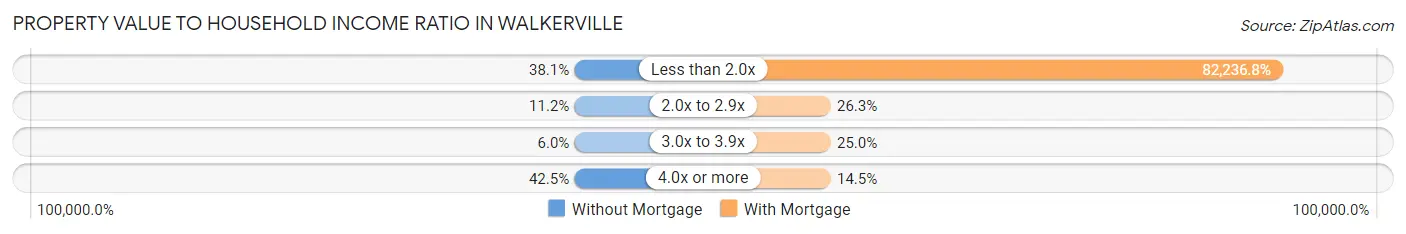
| Value-to-Income Ratio | Without Mortgage | With Mortgage |
| Less than 2.0x | 51 (38.1%) | 62,500 (82,236.8%) |
| 2.0x to 2.9x | 15 (11.2%) | 20 (26.3%) |
| 3.0x to 3.9x | 8 (6.0%) | 19 (25.0%) |
| 4.0x or more | 57 (42.5%) | 11 (14.5%) |
| Total | 134 (100.0%) | 76 (100.0%) |
Real Estate Taxes by Mortgage Status in Walkerville
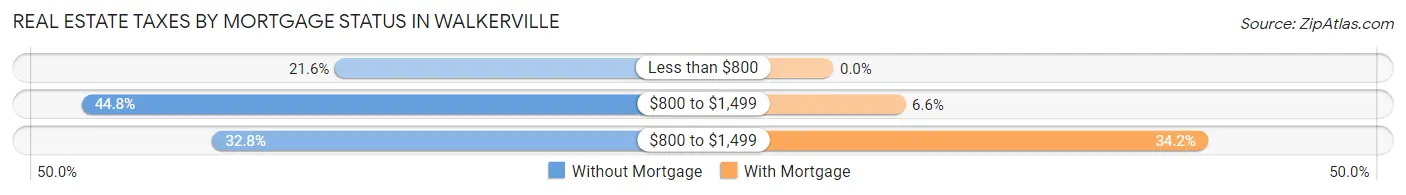
| Property Taxes | Without Mortgage | With Mortgage |
| Less than $800 | 29 (21.6%) | 0 (0.0%) |
| $800 to $1,499 | 60 (44.8%) | 5 (6.6%) |
| $800 to $1,499 | 44 (32.8%) | 26 (34.2%) |
| Total | 134 (100.0%) | 76 (100.0%) |
Health & Disability in Walkerville
Health Insurance Coverage by Age in Walkerville
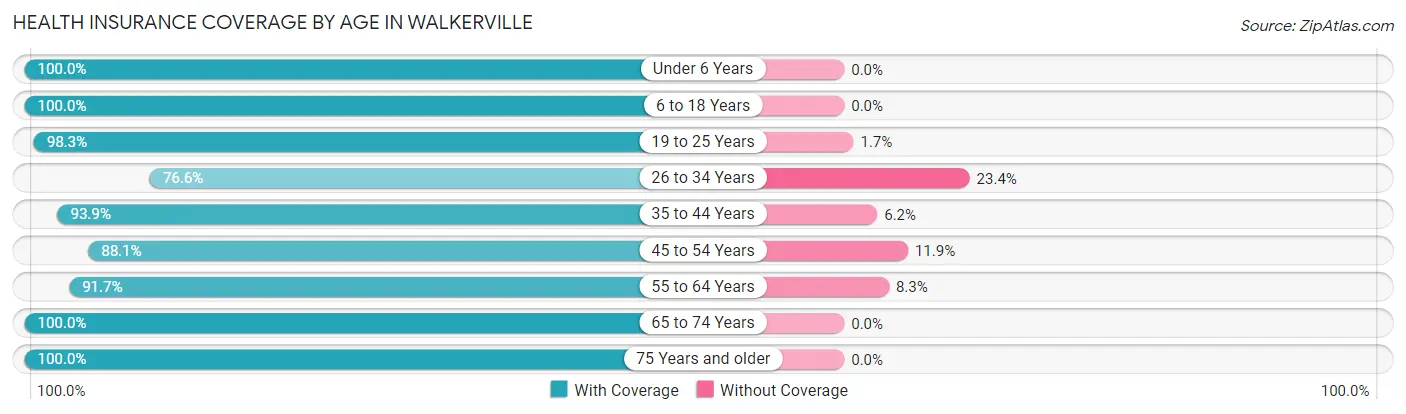
| Age Bracket | With Coverage | Without Coverage |
| Under 6 Years | 43 (100.0%) | 0 (0.0%) |
| 6 to 18 Years | 76 (100.0%) | 0 (0.0%) |
| 19 to 25 Years | 57 (98.3%) | 1 (1.7%) |
| 26 to 34 Years | 59 (76.6%) | 18 (23.4%) |
| 35 to 44 Years | 61 (93.9%) | 4 (6.1%) |
| 45 to 54 Years | 89 (88.1%) | 12 (11.9%) |
| 55 to 64 Years | 99 (91.7%) | 9 (8.3%) |
| 65 to 74 Years | 58 (100.0%) | 0 (0.0%) |
| 75 Years and older | 82 (100.0%) | 0 (0.0%) |
| Total | 624 (93.4%) | 44 (6.6%) |
Health Insurance Coverage by Citizenship Status in Walkerville
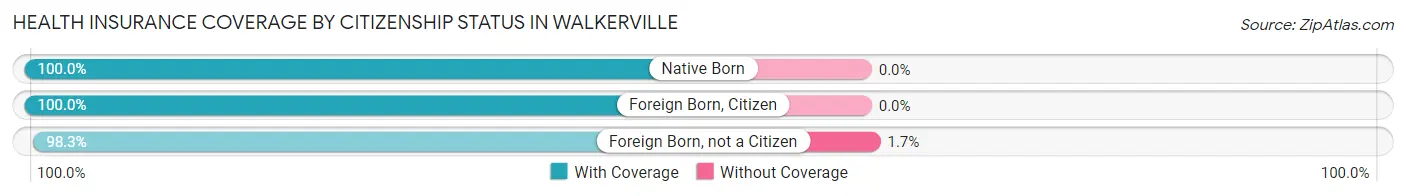
| Citizenship Status | With Coverage | Without Coverage |
| Native Born | 43 (100.0%) | 0 (0.0%) |
| Foreign Born, Citizen | 76 (100.0%) | 0 (0.0%) |
| Foreign Born, not a Citizen | 57 (98.3%) | 1 (1.7%) |
Health Insurance Coverage by Household Income in Walkerville
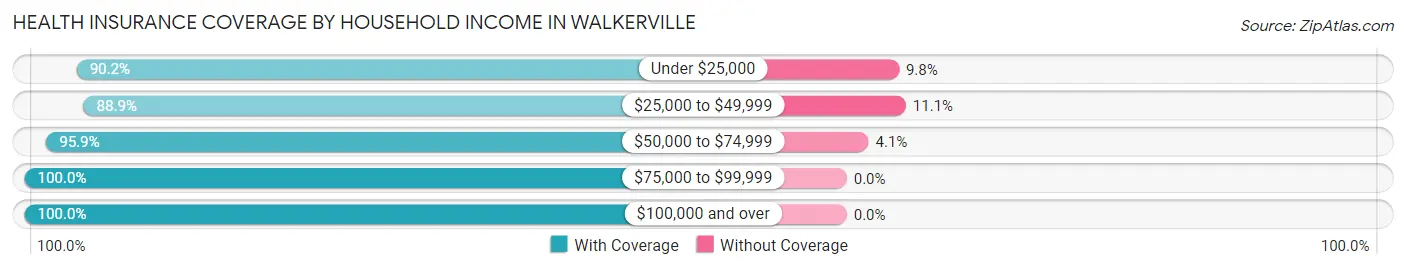
| Household Income | With Coverage | Without Coverage |
| Under $25,000 | 120 (90.2%) | 13 (9.8%) |
| $25,000 to $49,999 | 233 (88.9%) | 29 (11.1%) |
| $50,000 to $74,999 | 47 (95.9%) | 2 (4.1%) |
| $75,000 to $99,999 | 43 (100.0%) | 0 (0.0%) |
| $100,000 and over | 181 (100.0%) | 0 (0.0%) |
Public vs Private Health Insurance Coverage by Age in Walkerville
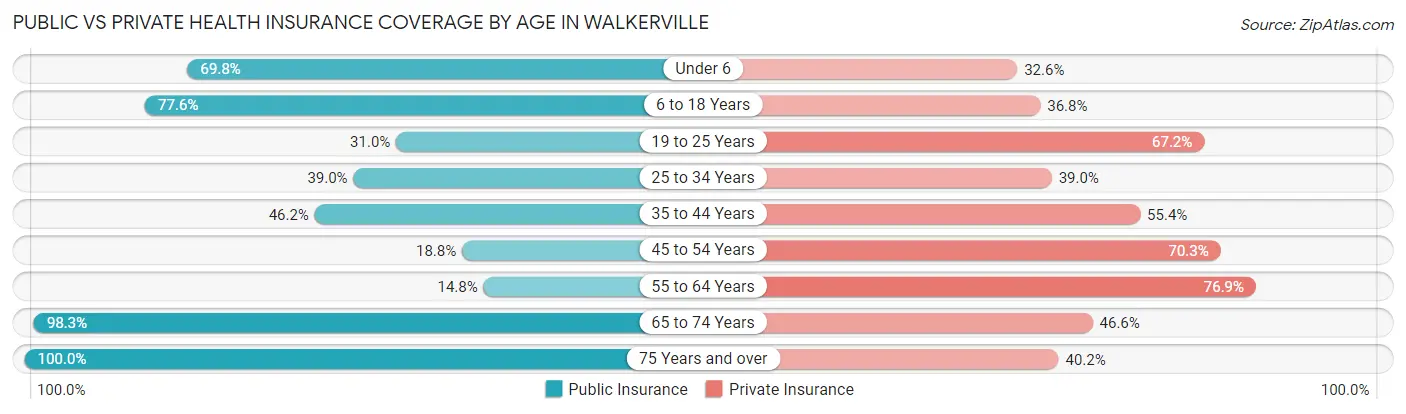
| Age Bracket | Public Insurance | Private Insurance |
| Under 6 | 30 (69.8%) | 14 (32.6%) |
| 6 to 18 Years | 59 (77.6%) | 28 (36.8%) |
| 19 to 25 Years | 18 (31.0%) | 39 (67.2%) |
| 25 to 34 Years | 30 (39.0%) | 30 (39.0%) |
| 35 to 44 Years | 30 (46.2%) | 36 (55.4%) |
| 45 to 54 Years | 19 (18.8%) | 71 (70.3%) |
| 55 to 64 Years | 16 (14.8%) | 83 (76.8%) |
| 65 to 74 Years | 57 (98.3%) | 27 (46.6%) |
| 75 Years and over | 82 (100.0%) | 33 (40.2%) |
| Total | 341 (51.0%) | 361 (54.0%) |
Disability Status by Sex by Age in Walkerville
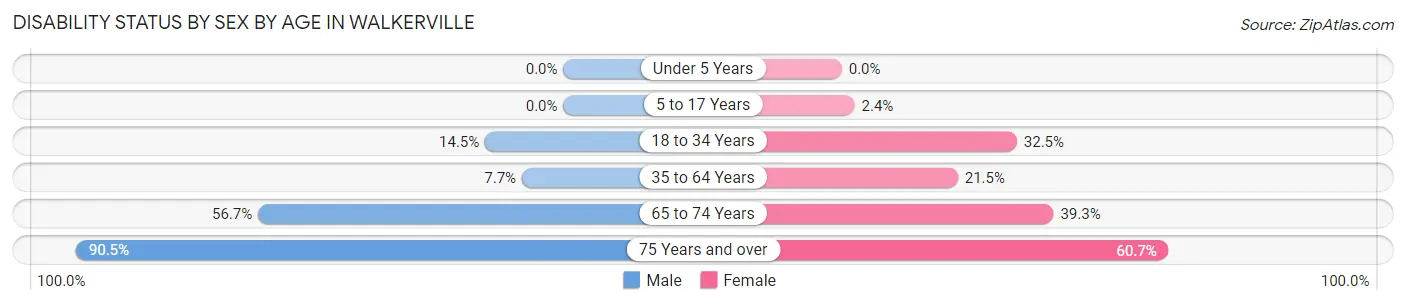
| Age Bracket | Male | Female |
| Under 5 Years | 0 (0.0%) | 0 (0.0%) |
| 5 to 17 Years | 0 (0.0%) | 1 (2.4%) |
| 18 to 34 Years | 9 (14.5%) | 26 (32.5%) |
| 35 to 64 Years | 10 (7.7%) | 31 (21.5%) |
| 65 to 74 Years | 17 (56.7%) | 11 (39.3%) |
| 75 Years and over | 19 (90.5%) | 37 (60.7%) |
Disability Class by Sex by Age in Walkerville
Disability Class: Hearing Difficulty
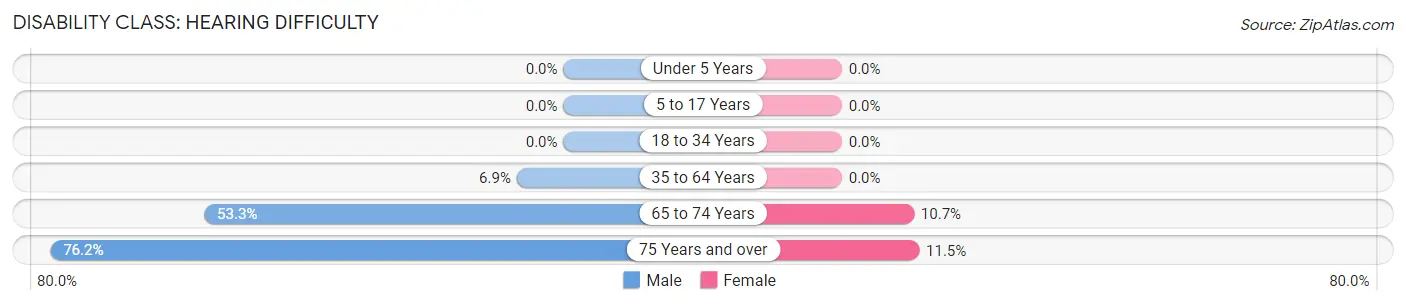
| Age Bracket | Male | Female |
| Under 5 Years | 0 (0.0%) | 0 (0.0%) |
| 5 to 17 Years | 0 (0.0%) | 0 (0.0%) |
| 18 to 34 Years | 0 (0.0%) | 0 (0.0%) |
| 35 to 64 Years | 9 (6.9%) | 0 (0.0%) |
| 65 to 74 Years | 16 (53.3%) | 3 (10.7%) |
| 75 Years and over | 16 (76.2%) | 7 (11.5%) |
Disability Class: Vision Difficulty
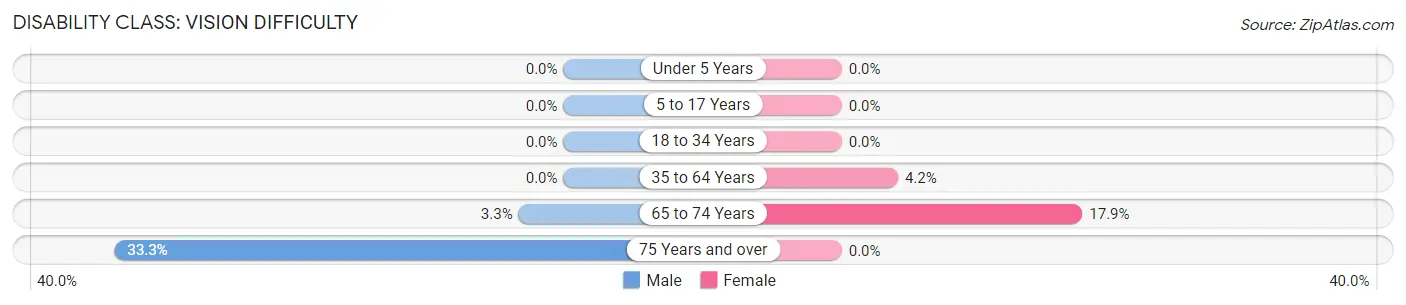
| Age Bracket | Male | Female |
| Under 5 Years | 0 (0.0%) | 0 (0.0%) |
| 5 to 17 Years | 0 (0.0%) | 0 (0.0%) |
| 18 to 34 Years | 0 (0.0%) | 0 (0.0%) |
| 35 to 64 Years | 0 (0.0%) | 6 (4.2%) |
| 65 to 74 Years | 1 (3.3%) | 5 (17.9%) |
| 75 Years and over | 7 (33.3%) | 0 (0.0%) |
Disability Class: Cognitive Difficulty
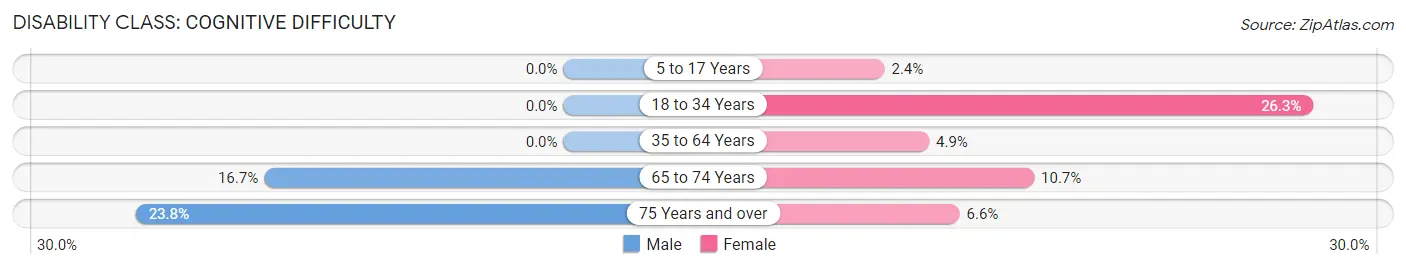
| Age Bracket | Male | Female |
| 5 to 17 Years | 0 (0.0%) | 1 (2.4%) |
| 18 to 34 Years | 0 (0.0%) | 21 (26.3%) |
| 35 to 64 Years | 0 (0.0%) | 7 (4.9%) |
| 65 to 74 Years | 5 (16.7%) | 3 (10.7%) |
| 75 Years and over | 5 (23.8%) | 4 (6.6%) |
Disability Class: Ambulatory Difficulty
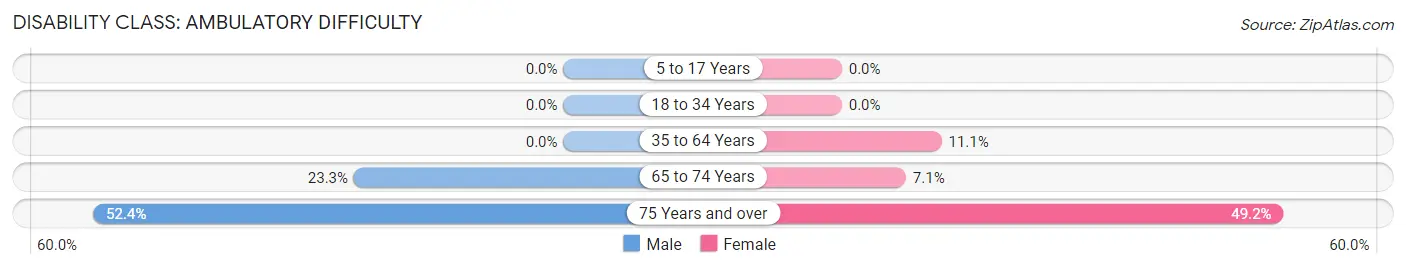
| Age Bracket | Male | Female |
| 5 to 17 Years | 0 (0.0%) | 0 (0.0%) |
| 18 to 34 Years | 0 (0.0%) | 0 (0.0%) |
| 35 to 64 Years | 0 (0.0%) | 16 (11.1%) |
| 65 to 74 Years | 7 (23.3%) | 2 (7.1%) |
| 75 Years and over | 11 (52.4%) | 30 (49.2%) |
Disability Class: Self-Care Difficulty
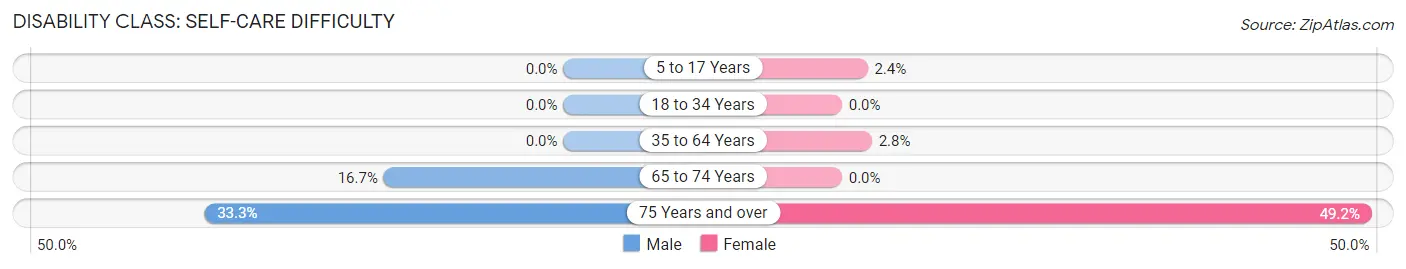
| Age Bracket | Male | Female |
| 5 to 17 Years | 0 (0.0%) | 1 (2.4%) |
| 18 to 34 Years | 0 (0.0%) | 0 (0.0%) |
| 35 to 64 Years | 0 (0.0%) | 4 (2.8%) |
| 65 to 74 Years | 5 (16.7%) | 0 (0.0%) |
| 75 Years and over | 7 (33.3%) | 30 (49.2%) |
Technology Access in Walkerville
Computing Device Access in Walkerville
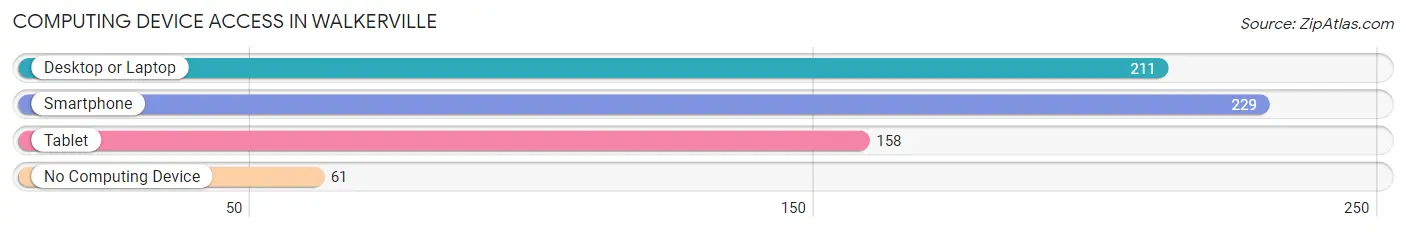
| Device Type | # Households | % Households |
| Desktop or Laptop | 211 | 69.2% |
| Smartphone | 229 | 75.1% |
| Tablet | 158 | 51.8% |
| No Computing Device | 61 | 20.0% |
| Total | 305 | 100.0% |
Internet Access in Walkerville
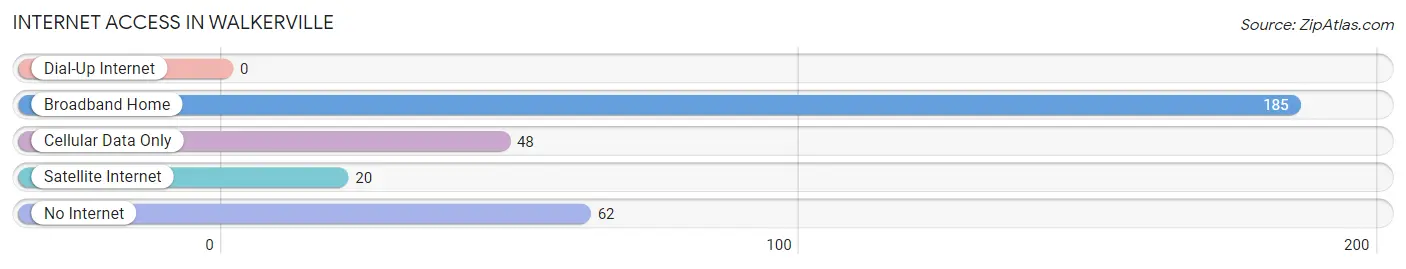
| Internet Type | # Households | % Households |
| Dial-Up Internet | 0 | 0.0% |
| Broadband Home | 185 | 60.7% |
| Cellular Data Only | 48 | 15.7% |
| Satellite Internet | 20 | 6.6% |
| No Internet | 62 | 20.3% |
| Total | 305 | 100.0% |
Walkerville Summary
History
Walkerville is a small town located in the western part of Montana, in the United States. It is situated in the Flathead Valley, near the Flathead River. The town was founded in 1883 by a group of settlers who were looking for a place to settle and start a new life. The town was named after the first settler, William Walker, who had come from Wisconsin.
The town was originally a farming community, with the main crops being wheat, barley, and oats. The town also had a few small businesses, such as a general store, a blacksmith, and a post office. As the town grew, more businesses opened, including a hotel, a bank, and a newspaper.
In the early 1900s, the town began to experience a boom in population and economic growth. This was due to the discovery of gold in the nearby mountains. This led to an influx of miners and prospectors, who helped to further develop the town.
The town continued to grow and prosper until the Great Depression hit in the 1930s. This caused a decline in the population and economy of the town, and many businesses closed. However, the town was able to recover and by the 1950s, it had become a popular tourist destination.
Geography
Walkerville is located in the western part of Montana, in the Flathead Valley. The town is situated near the Flathead River, which is a major tributary of the Columbia River. The town is surrounded by mountains, including the Mission Mountains to the east and the Swan Range to the west.
The town has a total area of 1.2 square miles, with a population of approximately 1,000 people. The town is located at an elevation of 3,400 feet above sea level. The climate in the area is semi-arid, with hot summers and cold winters.
Economy
The economy of Walkerville is largely based on tourism and agriculture. The town is a popular tourist destination, with many visitors coming to enjoy the natural beauty of the area. The town also has a few small businesses, such as restaurants, shops, and a hotel.
Agriculture is also an important part of the economy of Walkerville. The main crops grown in the area are wheat, barley, and oats. The town also has a few small farms, which produce vegetables, fruits, and livestock.
Demographics
As of the 2010 census, the population of Walkerville was 1,000 people. The racial makeup of the town was 97.2% White, 0.7% Native American, 0.3% Asian, 0.2% from other races, and 1.6% from two or more races. The median age of the population was 44.7 years.
The median household income in Walkerville was $37,500, and the median family income was $45,000. The per capita income was $19,000. The town had a poverty rate of 11.2%.
Conclusion
Walkerville is a small town located in the western part of Montana, in the United States. It was founded in 1883 by a group of settlers and has since grown into a popular tourist destination. The town has a total area of 1.2 square miles, with a population of approximately 1,000 people. The economy of Walkerville is largely based on tourism and agriculture. The town has a few small businesses, such as restaurants, shops, and a hotel. The town also has a few small farms, which produce vegetables, fruits, and livestock. The racial makeup of the town is 97.2% White, 0.7% Native American, 0.3% Asian, 0.2% from other races, and 1.6% from two or more races. The median household income in Walkerville was $37,500, and the median family income was $45,000. The per capita income was $19,000. The town had a poverty rate of 11.2%.
Common Questions
What is Per Capita Income in Walkerville?
Per Capita income in Walkerville is $31,759.
What is the Median Family Income in Walkerville?
Median Family Income in Walkerville is $46,250.
What is the Median Household income in Walkerville?
Median Household Income in Walkerville is $39,417.
What is Income or Wage Gap in Walkerville?
Income or Wage Gap in Walkerville is 40.5%.
Women in Walkerville earn 59.5 cents for every dollar earned by a man.
What is Inequality or Gini Index in Walkerville?
Inequality or Gini Index in Walkerville is 0.51.
What is the Total Population of Walkerville?
Total Population of Walkerville is 668.
What is the Total Male Population of Walkerville?
Total Male Population of Walkerville is 307.
What is the Total Female Population of Walkerville?
Total Female Population of Walkerville is 361.
What is the Ratio of Males per 100 Females in Walkerville?
There are 85.04 Males per 100 Females in Walkerville.
What is the Ratio of Females per 100 Males in Walkerville?
There are 117.59 Females per 100 Males in Walkerville.
What is the Median Population Age in Walkerville?
Median Population Age in Walkerville is 47.4 Years.
What is the Average Family Size in Walkerville
Average Family Size in Walkerville is 3.1 People.
What is the Average Household Size in Walkerville
Average Household Size in Walkerville is 2.2 People.
How Large is the Labor Force in Walkerville?
There are 335 People in the Labor Forcein in Walkerville.
What is the Percentage of People in the Labor Force in Walkerville?
58.4% of People are in the Labor Force in Walkerville.
What is the Unemployment Rate in Walkerville?
Unemployment Rate in Walkerville is 7.8%.