Cascade, MT Map & Demographics
Cascade Map
Cascade Overview
$27,552
PER CAPITA INCOME
$55,469
AVG FAMILY INCOME
$46,500
AVG HOUSEHOLD INCOME
2.4%
WAGE / INCOME GAP [ % ]
97.6¢/ $1
WAGE / INCOME GAP [ $ ]
0.40
INEQUALITY / GINI INDEX
569
TOTAL POPULATION
274
MALE POPULATION
295
FEMALE POPULATION
92.88
MALES / 100 FEMALES
107.66
FEMALES / 100 MALES
56.1
MEDIAN AGE
2.6
AVG FAMILY SIZE
2.1
AVG HOUSEHOLD SIZE
236
LABOR FORCE [ PEOPLE ]
46.7%
PERCENT IN LABOR FORCE
3.4%
UNEMPLOYMENT RATE
Cascade Zip Codes
Cascade Area Codes
Income in Cascade
Income Overview in Cascade
Per Capita Income in Cascade is $27,552, while median incomes of families and households are $55,469 and $46,500 respectively.
| Characteristic | Number | Measure |
| Per Capita Income | 569 | $27,552 |
| Median Family Income | 151 | $55,469 |
| Mean Family Income | 151 | $66,754 |
| Median Household Income | 254 | $46,500 |
| Mean Household Income | 254 | $58,488 |
| Income Deficit | 151 | $0 |
| Wage / Income Gap (%) | 569 | 2.38% |
| Wage / Income Gap ($) | 569 | 97.62¢ per $1 |
| Gini / Inequality Index | 569 | 0.40 |
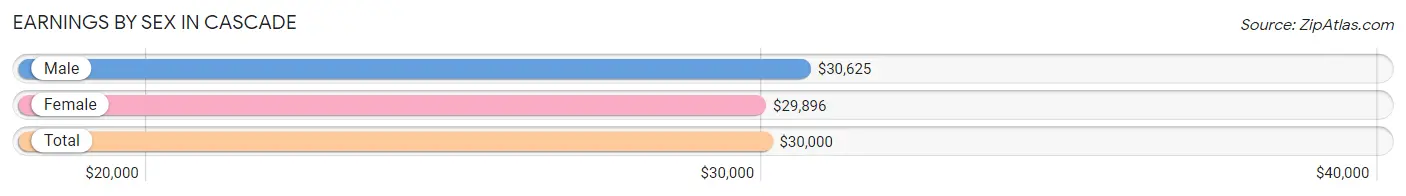
Earnings by Sex in Cascade
Average Earnings in Cascade are $30,000, $30,625 for men and $29,896 for women, a difference of 2.4%.
| Sex | Number | Average Earnings |
| Male | 131 (53.2%) | $30,625 |
| Female | 115 (46.8%) | $29,896 |
| Total | 246 (100.0%) | $30,000 |
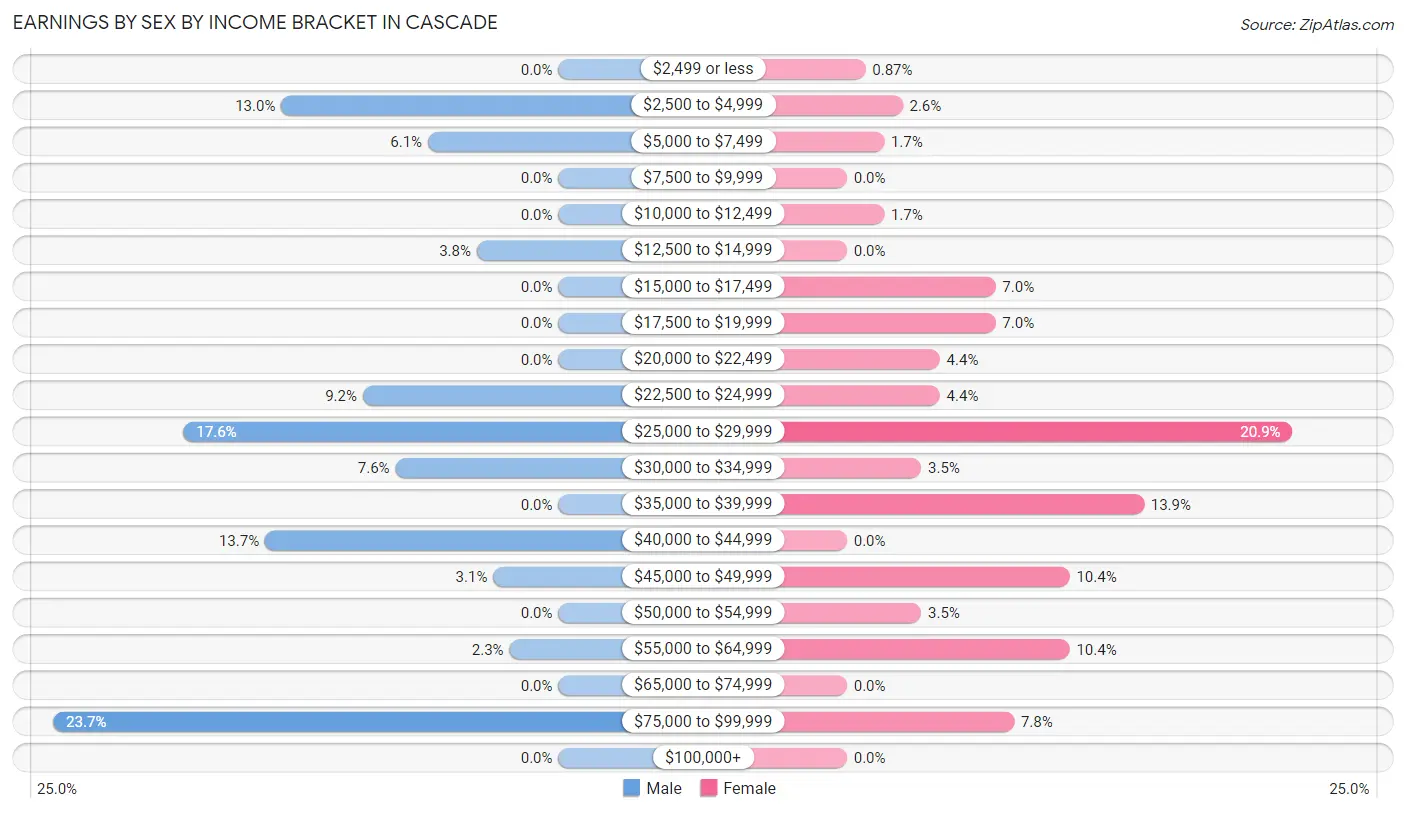
Earnings by Sex by Income Bracket in Cascade
The most common earnings brackets in Cascade are $75,000 to $99,999 for men (31 | 23.7%) and $25,000 to $29,999 for women (24 | 20.9%).
| Income | Male | Female |
| $2,499 or less | 0 (0.0%) | 1 (0.9%) |
| $2,500 to $4,999 | 17 (13.0%) | 3 (2.6%) |
| $5,000 to $7,499 | 8 (6.1%) | 2 (1.7%) |
| $7,500 to $9,999 | 0 (0.0%) | 0 (0.0%) |
| $10,000 to $12,499 | 0 (0.0%) | 2 (1.7%) |
| $12,500 to $14,999 | 5 (3.8%) | 0 (0.0%) |
| $15,000 to $17,499 | 0 (0.0%) | 8 (7.0%) |
| $17,500 to $19,999 | 0 (0.0%) | 8 (7.0%) |
| $20,000 to $22,499 | 0 (0.0%) | 5 (4.3%) |
| $22,500 to $24,999 | 12 (9.2%) | 5 (4.3%) |
| $25,000 to $29,999 | 23 (17.6%) | 24 (20.9%) |
| $30,000 to $34,999 | 10 (7.6%) | 4 (3.5%) |
| $35,000 to $39,999 | 0 (0.0%) | 16 (13.9%) |
| $40,000 to $44,999 | 18 (13.7%) | 0 (0.0%) |
| $45,000 to $49,999 | 4 (3.0%) | 12 (10.4%) |
| $50,000 to $54,999 | 0 (0.0%) | 4 (3.5%) |
| $55,000 to $64,999 | 3 (2.3%) | 12 (10.4%) |
| $65,000 to $74,999 | 0 (0.0%) | 0 (0.0%) |
| $75,000 to $99,999 | 31 (23.7%) | 9 (7.8%) |
| $100,000+ | 0 (0.0%) | 0 (0.0%) |
| Total | 131 (100.0%) | 115 (100.0%) |
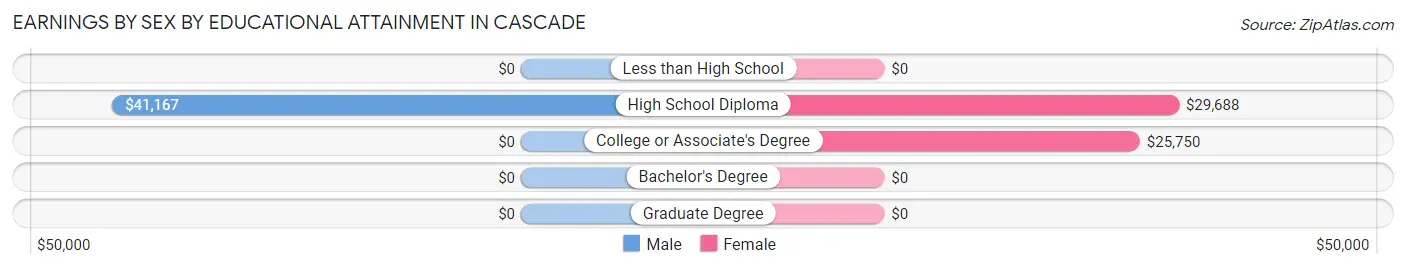
Earnings by Sex by Educational Attainment in Cascade
Average earnings in Cascade are $34,844 for men and $34,688 for women, a difference of 0.4%. Men with an educational attainment of high school diploma enjoy the highest average annual earnings of $41,167, while those with high school diploma education earn the least with $41,167. Women with an educational attainment of high school diploma earn the most with the average annual earnings of $29,688, while those with college or associate's degree education have the smallest earnings of $25,750.
| Educational Attainment | Male Income | Female Income |
| Less than High School | - | - |
| High School Diploma | $41,167 | $29,688 |
| College or Associate's Degree | - | - |
| Bachelor's Degree | - | - |
| Graduate Degree | - | - |
| Total | $34,844 | $34,688 |
Family Income in Cascade
Family Income Brackets in Cascade
According to the Cascade family income data, there are 43 families falling into the $75,000 to $99,999 income range, which is the most common income bracket and makes up 28.5% of all families.
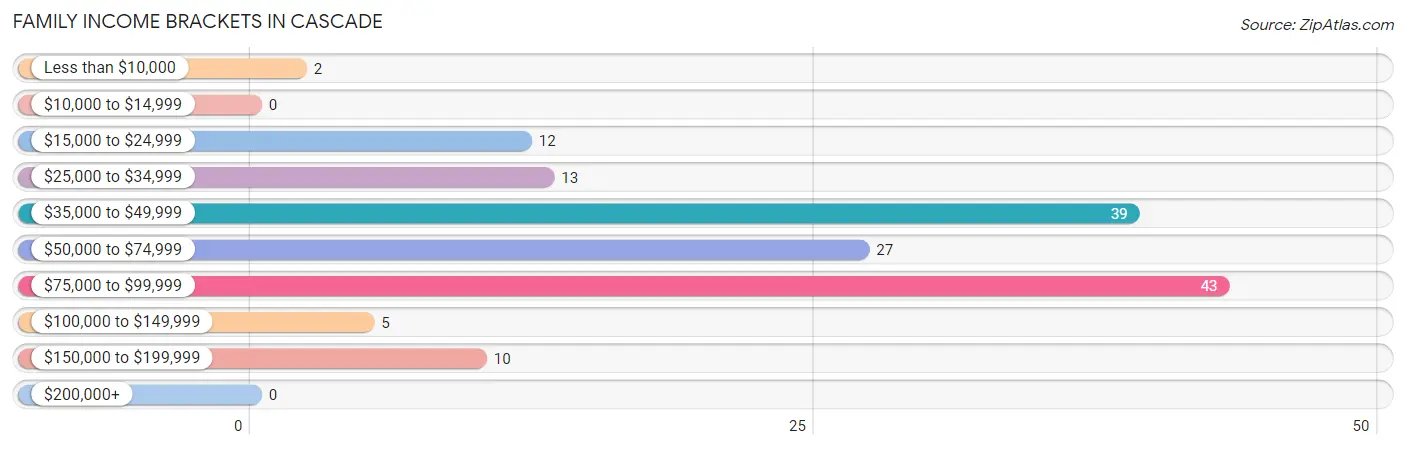
| Income Bracket | # Families | % Families |
| Less than $10,000 | 2 | 1.3% |
| $10,000 to $14,999 | 0 | 0.0% |
| $15,000 to $24,999 | 12 | 7.9% |
| $25,000 to $34,999 | 13 | 8.6% |
| $35,000 to $49,999 | 39 | 25.8% |
| $50,000 to $74,999 | 27 | 17.9% |
| $75,000 to $99,999 | 43 | 28.5% |
| $100,000 to $149,999 | 5 | 3.3% |
| $150,000 to $199,999 | 10 | 6.6% |
| $200,000+ | 0 | 0.0% |
Family Income by Famaliy Size in Cascade
2-person families (97 | 64.2%) account for the highest median family income in Cascade with $55,938 per family, while 2-person families (97 | 64.2%) have the highest median income of $27,969 per family member.
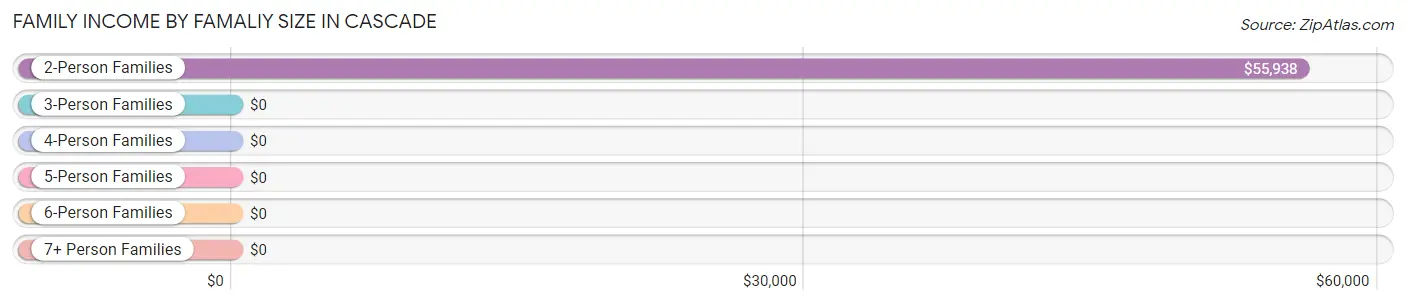
| Income Bracket | # Families | Median Income |
| 2-Person Families | 97 (64.2%) | $55,938 |
| 3-Person Families | 36 (23.8%) | $0 |
| 4-Person Families | 11 (7.3%) | $0 |
| 5-Person Families | 7 (4.6%) | $0 |
| 6-Person Families | 0 (0.0%) | $0 |
| 7+ Person Families | 0 (0.0%) | $0 |
| Total | 151 (100.0%) | $55,469 |
Family Income by Number of Earners in Cascade
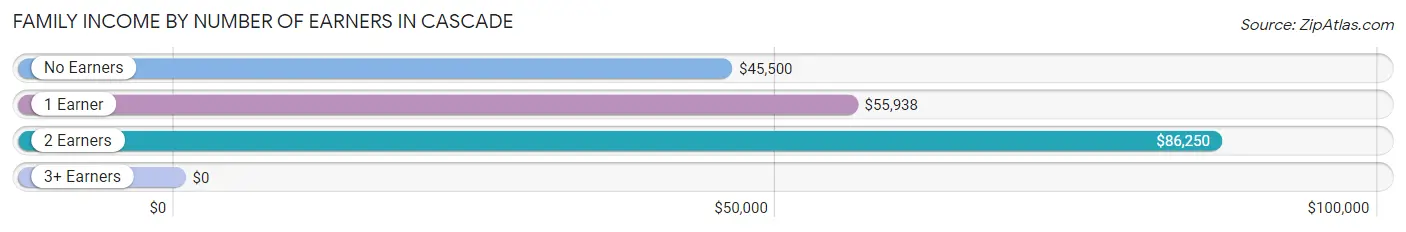
| Number of Earners | # Families | Median Income |
| No Earners | 56 (37.1%) | $45,500 |
| 1 Earner | 46 (30.5%) | $55,938 |
| 2 Earners | 49 (32.5%) | $86,250 |
| 3+ Earners | 0 (0.0%) | $0 |
| Total | 151 (100.0%) | $55,469 |
Household Income in Cascade
Household Income Brackets in Cascade
With 57 households falling in the category, the $75,000 to $99,999 income range is the most frequent in Cascade, accounting for 22.4% of all households.
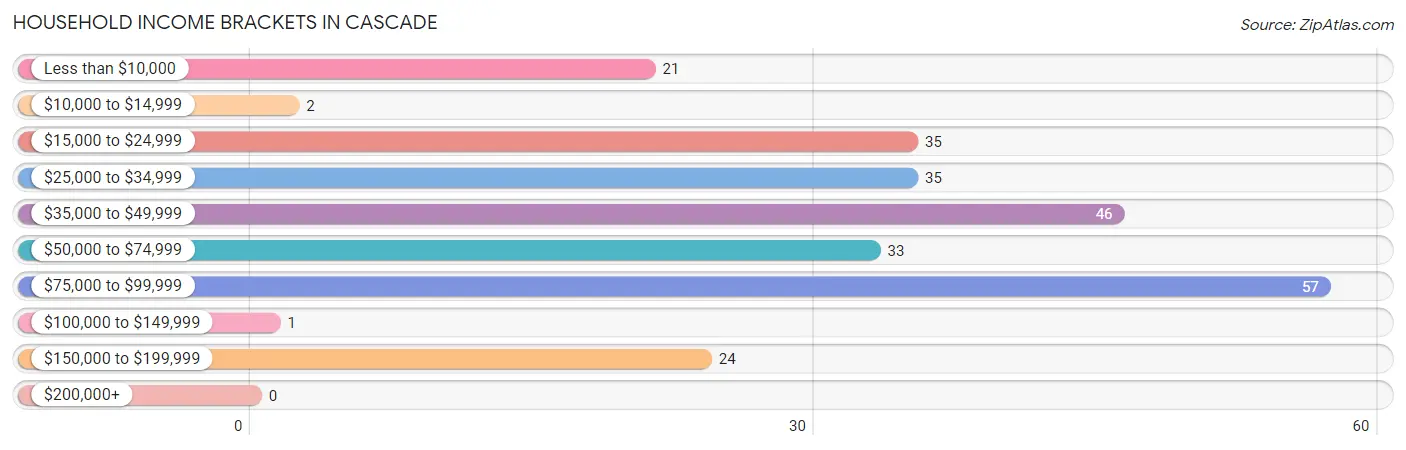
| Income Bracket | # Households | % Households |
| Less than $10,000 | 21 | 8.3% |
| $10,000 to $14,999 | 2 | 0.8% |
| $15,000 to $24,999 | 35 | 13.8% |
| $25,000 to $34,999 | 35 | 13.8% |
| $35,000 to $49,999 | 46 | 18.1% |
| $50,000 to $74,999 | 33 | 13.0% |
| $75,000 to $99,999 | 57 | 22.4% |
| $100,000 to $149,999 | 1 | 0.4% |
| $150,000 to $199,999 | 24 | 9.4% |
| $200,000+ | 0 | 0.0% |
Household Income by Householder Age in Cascade
The median household income in Cascade is $46,500, with the highest median household income of $80,417 found in the 25 to 44 years age bracket for the primary householder. A total of 60 households (23.6%) fall into this category. Meanwhile, the 15 to 24 years age bracket for the primary householder has the lowest median household income of $0, with 12 households (4.7%) in this group.
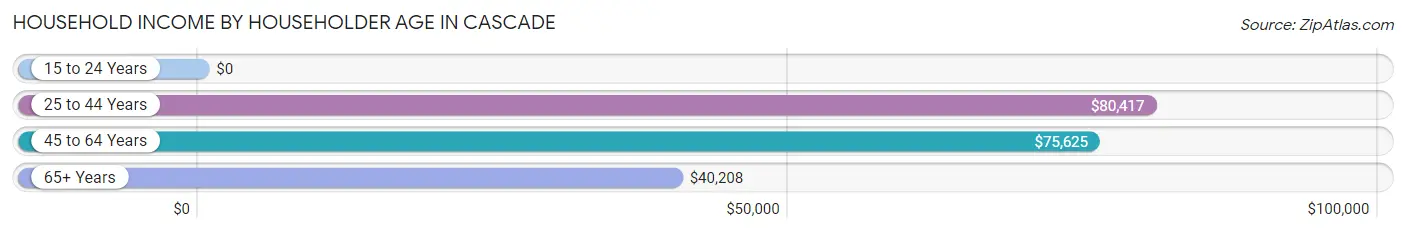
| Income Bracket | # Households | Median Income |
| 15 to 24 Years | 12 (4.7%) | $0 |
| 25 to 44 Years | 60 (23.6%) | $80,417 |
| 45 to 64 Years | 59 (23.2%) | $75,625 |
| 65+ Years | 123 (48.4%) | $40,208 |
| Total | 254 (100.0%) | $46,500 |
Poverty in Cascade
Income Below Poverty by Sex and Age in Cascade
With 12.4% poverty level for males and 19.6% for females among the residents of Cascade, 18 to 24 year old males and 12 to 14 year old females are the most vulnerable to poverty, with 13 males (40.6%) and 8 females (100.0%) in their respective age groups living below the poverty level.
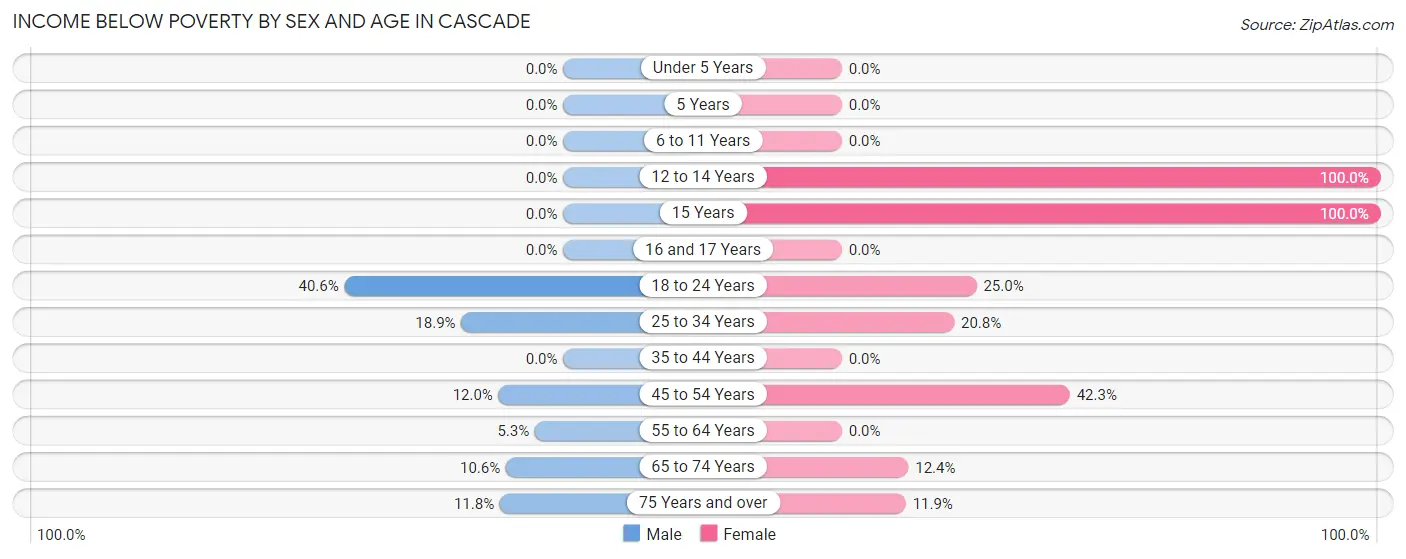
| Age Bracket | Male | Female |
| Under 5 Years | 0 (0.0%) | 0 (0.0%) |
| 5 Years | 0 (0.0%) | 0 (0.0%) |
| 6 to 11 Years | 0 (0.0%) | 0 (0.0%) |
| 12 to 14 Years | 0 (0.0%) | 8 (100.0%) |
| 15 Years | 0 (0.0%) | 10 (100.0%) |
| 16 and 17 Years | 0 (0.0%) | 0 (0.0%) |
| 18 to 24 Years | 13 (40.6%) | 6 (25.0%) |
| 25 to 34 Years | 7 (18.9%) | 5 (20.8%) |
| 35 to 44 Years | 0 (0.0%) | 0 (0.0%) |
| 45 to 54 Years | 3 (12.0%) | 11 (42.3%) |
| 55 to 64 Years | 2 (5.3%) | 0 (0.0%) |
| 65 to 74 Years | 5 (10.6%) | 10 (12.3%) |
| 75 Years and over | 4 (11.8%) | 7 (11.9%) |
| Total | 34 (12.4%) | 57 (19.6%) |
Income Above Poverty by Sex and Age in Cascade
According to the poverty statistics in Cascade, males aged under 5 years and females aged under 5 years are the age groups that are most secure financially, with 100.0% of males and 100.0% of females in these age groups living above the poverty line.
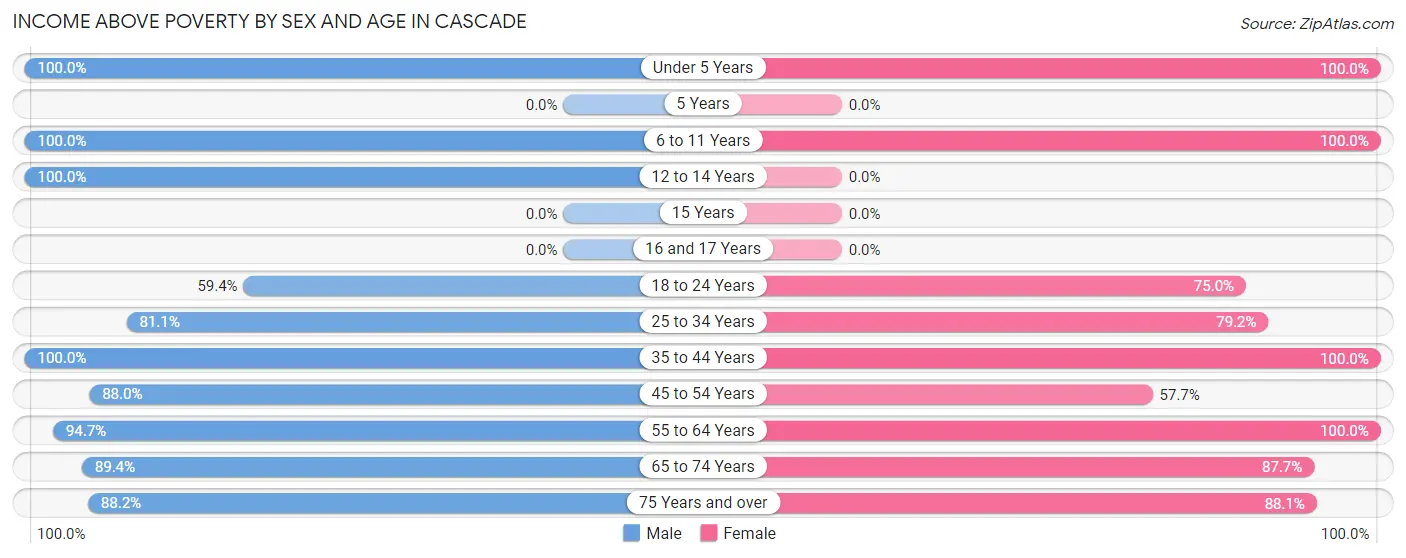
| Age Bracket | Male | Female |
| Under 5 Years | 8 (100.0%) | 3 (100.0%) |
| 5 Years | 0 (0.0%) | 0 (0.0%) |
| 6 to 11 Years | 10 (100.0%) | 7 (100.0%) |
| 12 to 14 Years | 14 (100.0%) | 0 (0.0%) |
| 15 Years | 0 (0.0%) | 0 (0.0%) |
| 16 and 17 Years | 0 (0.0%) | 0 (0.0%) |
| 18 to 24 Years | 19 (59.4%) | 18 (75.0%) |
| 25 to 34 Years | 30 (81.1%) | 19 (79.2%) |
| 35 to 44 Years | 29 (100.0%) | 19 (100.0%) |
| 45 to 54 Years | 22 (88.0%) | 15 (57.7%) |
| 55 to 64 Years | 36 (94.7%) | 30 (100.0%) |
| 65 to 74 Years | 42 (89.4%) | 71 (87.6%) |
| 75 Years and over | 30 (88.2%) | 52 (88.1%) |
| Total | 240 (87.6%) | 234 (80.4%) |
Income Below Poverty Among Married-Couple Families in Cascade
The poverty statistics for married-couple families in Cascade show that 1.6% or 2 of the total 126 families live below the poverty line. Families with no children have the highest poverty rate of 1.8%, comprising of 2 families. On the other hand, families with 1 or 2 children have the lowest poverty rate of 0.0%, which includes 0 families.
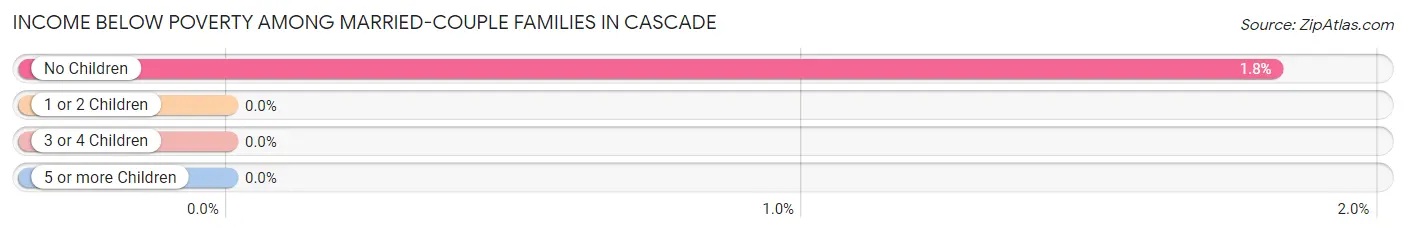
| Children | Above Poverty | Below Poverty |
| No Children | 108 (98.2%) | 2 (1.8%) |
| 1 or 2 Children | 9 (100.0%) | 0 (0.0%) |
| 3 or 4 Children | 7 (100.0%) | 0 (0.0%) |
| 5 or more Children | 0 (0.0%) | 0 (0.0%) |
| Total | 124 (98.4%) | 2 (1.6%) |
Income Below Poverty Among Single-Parent Households in Cascade
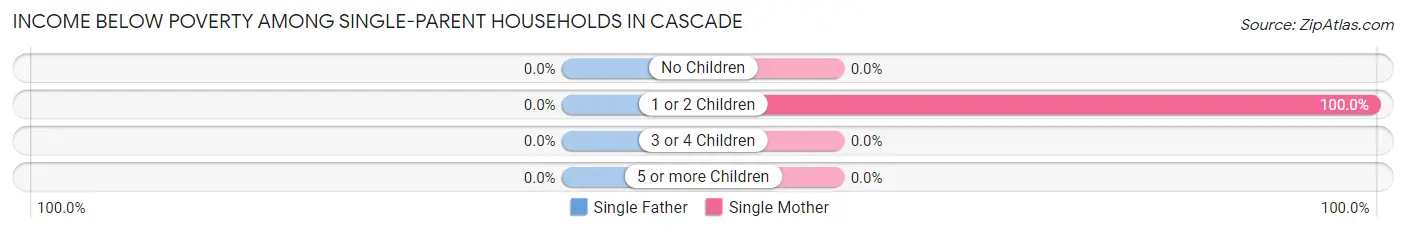
| Children | Single Father | Single Mother |
| No Children | 0 (0.0%) | 0 (0.0%) |
| 1 or 2 Children | 0 (0.0%) | 8 (100.0%) |
| 3 or 4 Children | 0 (0.0%) | 0 (0.0%) |
| 5 or more Children | 0 (0.0%) | 0 (0.0%) |
| Total | 0 (0.0%) | 8 (80.0%) |
Income Below Poverty Among Married-Couple vs Single-Parent Households in Cascade
The poverty data for Cascade shows that 2 of the married-couple family households (1.6%) and 8 of the single-parent households (32.0%) are living below the poverty level. Within the married-couple family households, those with no children have the highest poverty rate, with 2 households (1.8%) falling below the poverty line. Among the single-parent households, those with 1 or 2 children have the highest poverty rate, with 8 household (50.0%) living below poverty.
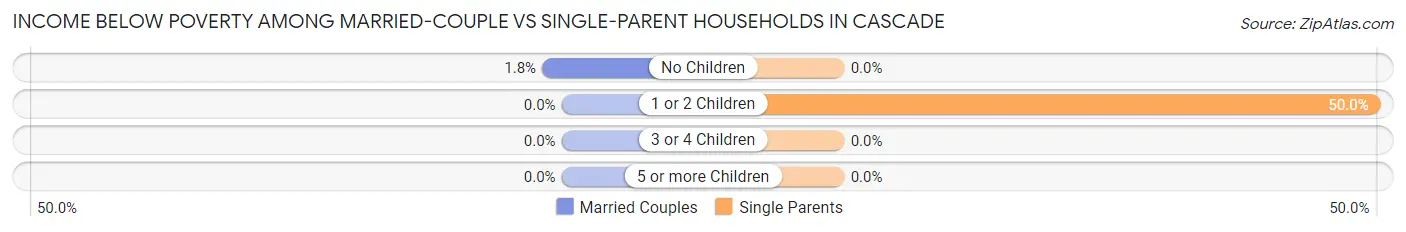
| Children | Married-Couple Families | Single-Parent Households |
| No Children | 2 (1.8%) | 0 (0.0%) |
| 1 or 2 Children | 0 (0.0%) | 8 (50.0%) |
| 3 or 4 Children | 0 (0.0%) | 0 (0.0%) |
| 5 or more Children | 0 (0.0%) | 0 (0.0%) |
| Total | 2 (1.6%) | 8 (32.0%) |
Race in Cascade
The most populous races in Cascade are White / Caucasian (493 | 86.6%), Two or more Races (48 | 8.4%), and Hispanic or Latino (28 | 4.9%).
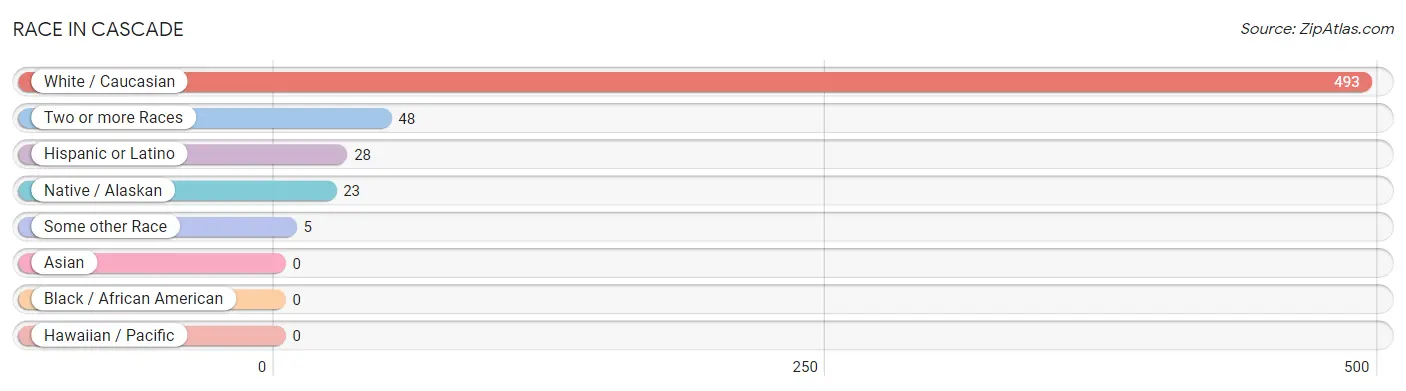
| Race | # Population | % Population |
| Asian | 0 | 0.0% |
| Black / African American | 0 | 0.0% |
| Hawaiian / Pacific | 0 | 0.0% |
| Hispanic or Latino | 28 | 4.9% |
| Native / Alaskan | 23 | 4.0% |
| White / Caucasian | 493 | 86.6% |
| Two or more Races | 48 | 8.4% |
| Some other Race | 5 | 0.9% |
| Total | 569 | 100.0% |
Ancestry in Cascade
The most populous ancestries reported in Cascade are American (146 | 25.7%), European (91 | 16.0%), Irish (83 | 14.6%), German (79 | 13.9%), and English (60 | 10.5%), together accounting for 80.7% of all Cascade residents.
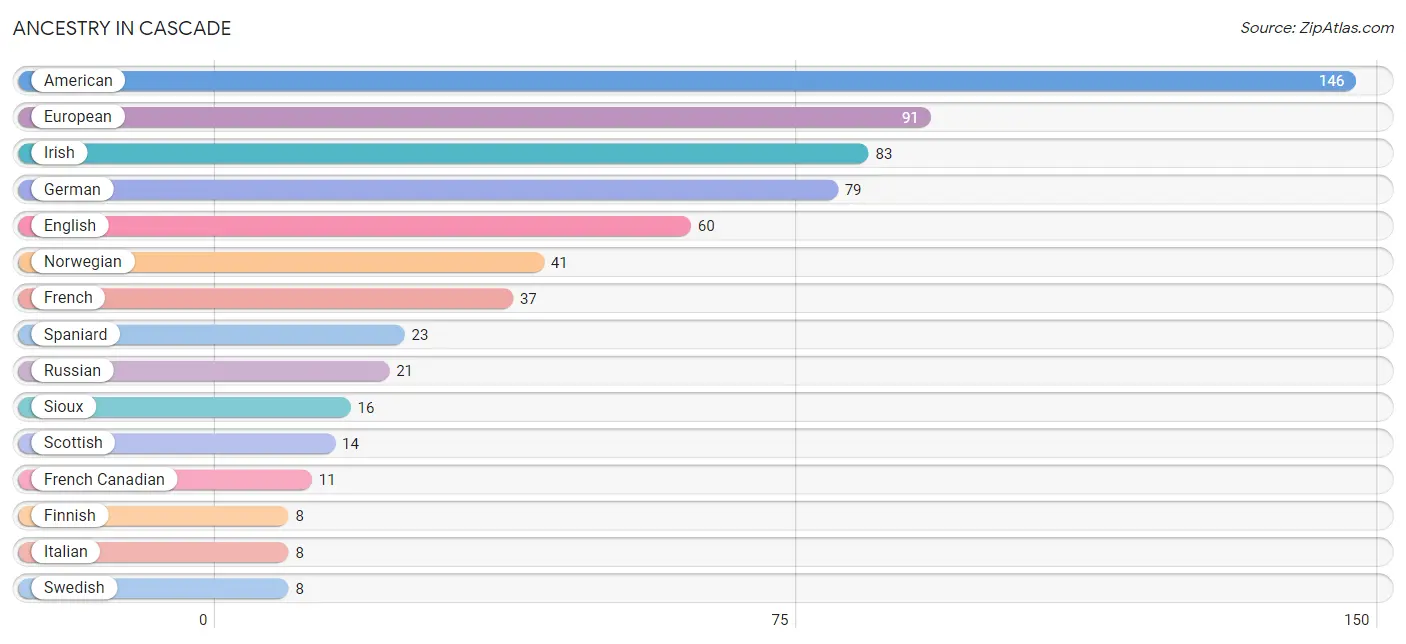
| Ancestry | # Population | % Population |
| American | 146 | 25.7% |
| Blackfeet | 5 | 0.9% |
| Cherokee | 4 | 0.7% |
| Czechoslovakian | 3 | 0.5% |
| Danish | 5 | 0.9% |
| Dutch | 5 | 0.9% |
| Eastern European | 4 | 0.7% |
| English | 60 | 10.5% |
| European | 91 | 16.0% |
| Finnish | 8 | 1.4% |
| French | 37 | 6.5% |
| French Canadian | 11 | 1.9% |
| German | 79 | 13.9% |
| Greek | 3 | 0.5% |
| Irish | 83 | 14.6% |
| Iroquois | 4 | 0.7% |
| Italian | 8 | 1.4% |
| Mexican | 5 | 0.9% |
| Norwegian | 41 | 7.2% |
| Polish | 3 | 0.5% |
| Portuguese | 3 | 0.5% |
| Russian | 21 | 3.7% |
| Scandinavian | 7 | 1.2% |
| Scotch-Irish | 6 | 1.1% |
| Scottish | 14 | 2.5% |
| Sioux | 16 | 2.8% |
| Slavic | 2 | 0.4% |
| Spaniard | 23 | 4.0% |
| Swedish | 8 | 1.4% | View All 29 Rows |
Immigrants in Cascade

| Immigration Origin | # Population | % Population | View All 0 Rows |
Sex and Age in Cascade
Sex and Age in Cascade
The most populous age groups in Cascade are 30 to 34 Years (30 | 11.0%) for men and 65 to 69 Years (49 | 16.6%) for women.
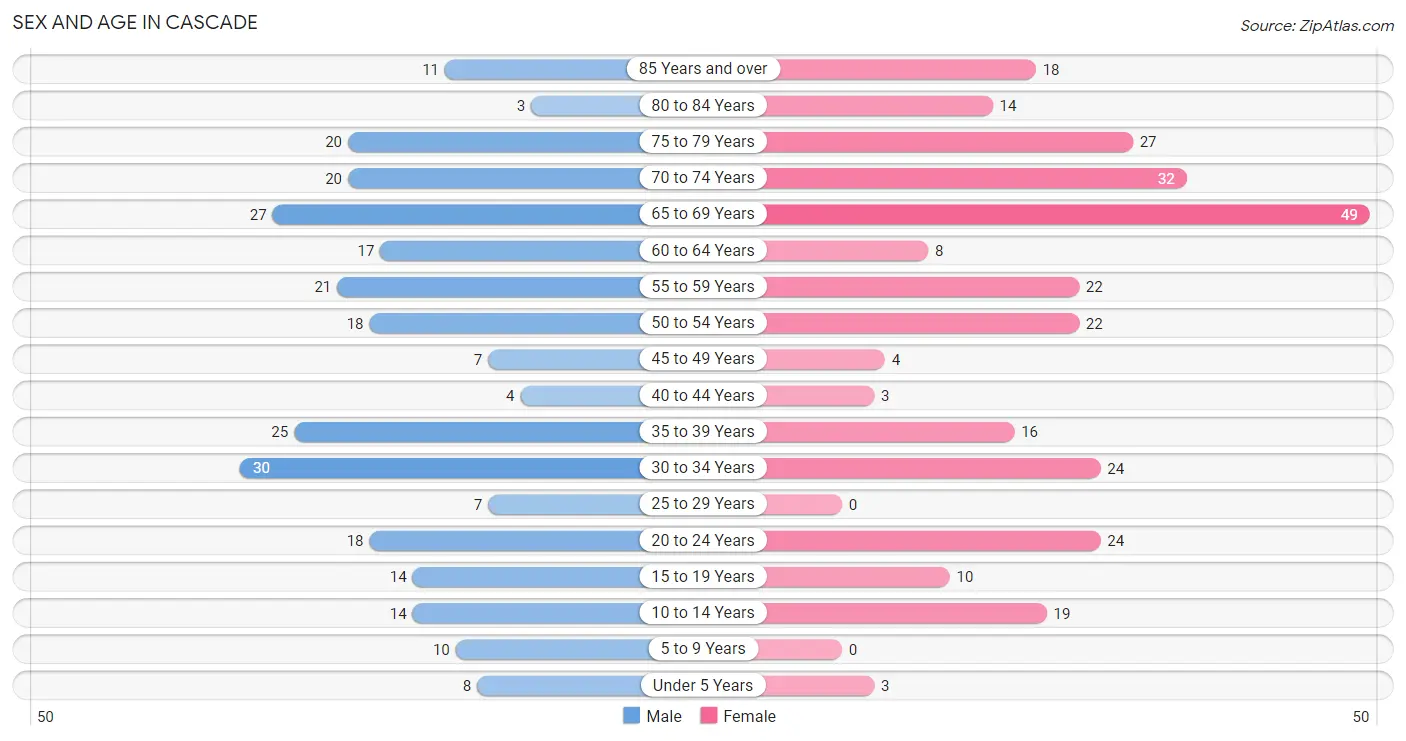
| Age Bracket | Male | Female |
| Under 5 Years | 8 (2.9%) | 3 (1.0%) |
| 5 to 9 Years | 10 (3.6%) | 0 (0.0%) |
| 10 to 14 Years | 14 (5.1%) | 19 (6.4%) |
| 15 to 19 Years | 14 (5.1%) | 10 (3.4%) |
| 20 to 24 Years | 18 (6.6%) | 24 (8.1%) |
| 25 to 29 Years | 7 (2.5%) | 0 (0.0%) |
| 30 to 34 Years | 30 (11.0%) | 24 (8.1%) |
| 35 to 39 Years | 25 (9.1%) | 16 (5.4%) |
| 40 to 44 Years | 4 (1.5%) | 3 (1.0%) |
| 45 to 49 Years | 7 (2.5%) | 4 (1.4%) |
| 50 to 54 Years | 18 (6.6%) | 22 (7.5%) |
| 55 to 59 Years | 21 (7.7%) | 22 (7.5%) |
| 60 to 64 Years | 17 (6.2%) | 8 (2.7%) |
| 65 to 69 Years | 27 (9.9%) | 49 (16.6%) |
| 70 to 74 Years | 20 (7.3%) | 32 (10.8%) |
| 75 to 79 Years | 20 (7.3%) | 27 (9.1%) |
| 80 to 84 Years | 3 (1.1%) | 14 (4.8%) |
| 85 Years and over | 11 (4.0%) | 18 (6.1%) |
| Total | 274 (100.0%) | 295 (100.0%) |
Families and Households in Cascade
Median Family Size in Cascade
The median family size in Cascade is 2.64 persons per family, with single female/mother families (10 | 6.6%) accounting for the largest median family size of 4 persons per family. On the other hand, single male/father families (15 | 9.9%) represent the smallest median family size with 2.53 persons per family.
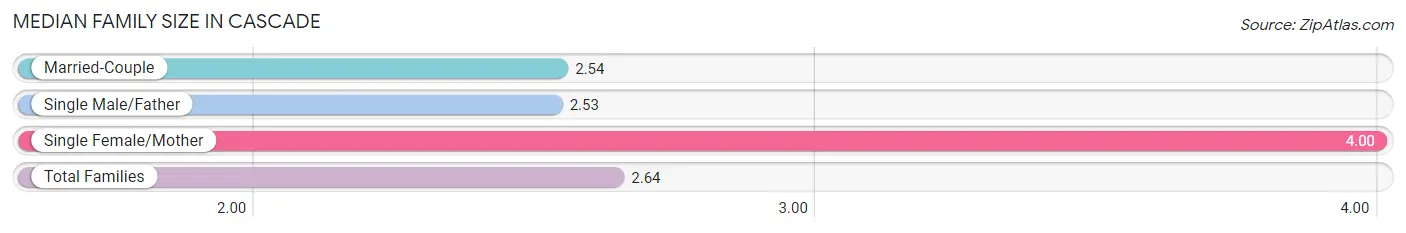
| Family Type | # Families | Family Size |
| Married-Couple | 126 (83.4%) | 2.54 |
| Single Male/Father | 15 (9.9%) | 2.53 |
| Single Female/Mother | 10 (6.6%) | 4.00 |
| Total Families | 151 (100.0%) | 2.64 |
Median Household Size in Cascade
The median household size in Cascade is 2.15 persons per household, with single male/father households (15 | 5.9%) accounting for the largest median household size of 4.33 persons per household. non-family households (103 | 40.6%) represent the smallest median household size with 1.18 persons per household.
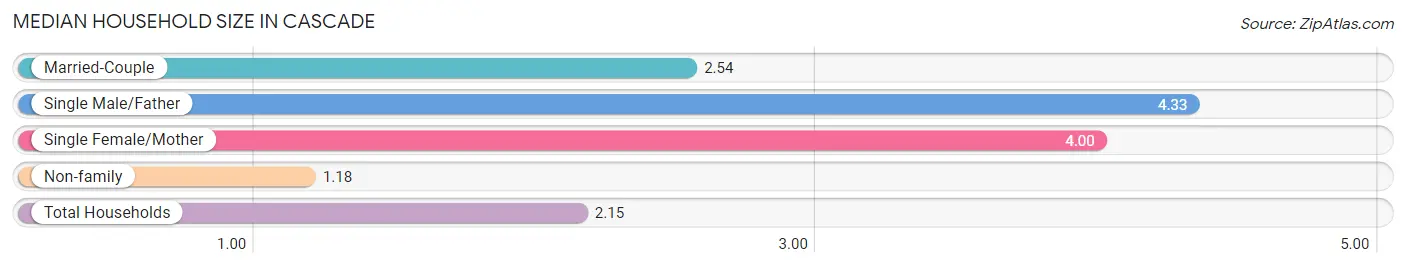
| Household Type | # Households | Household Size |
| Married-Couple | 126 (49.6%) | 2.54 |
| Single Male/Father | 15 (5.9%) | 4.33 |
| Single Female/Mother | 10 (3.9%) | 4.00 |
| Non-family | 103 (40.6%) | 1.18 |
| Total Households | 254 (100.0%) | 2.15 |
Household Size by Marriage Status in Cascade
Out of a total of 254 households in Cascade, 151 (59.5%) are family households, while 103 (40.6%) are nonfamily households. The most numerous type of family households are 2-person households, comprising 88, and the most common type of nonfamily households are 1-person households, comprising 88.
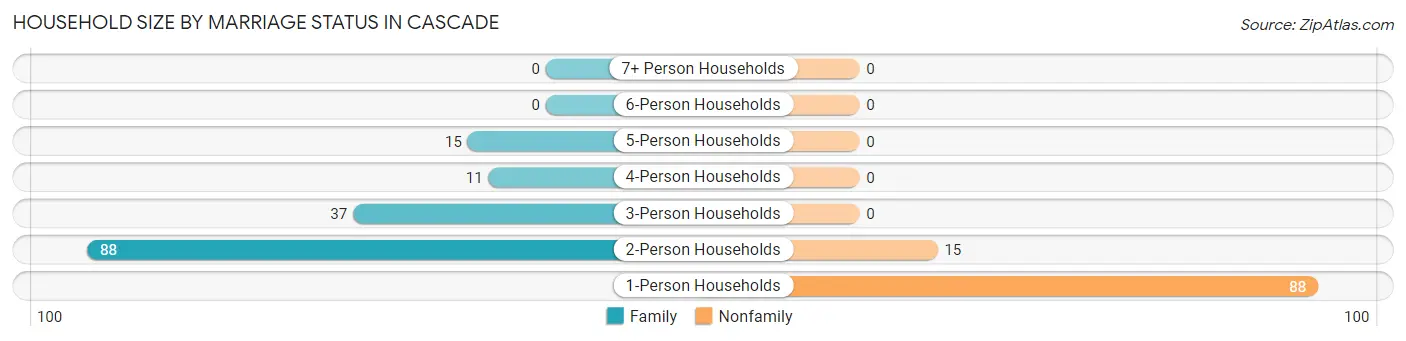
| Household Size | Family Households | Nonfamily Households |
| 1-Person Households | - | 88 (34.6%) |
| 2-Person Households | 88 (34.6%) | 15 (5.9%) |
| 3-Person Households | 37 (14.6%) | 0 (0.0%) |
| 4-Person Households | 11 (4.3%) | 0 (0.0%) |
| 5-Person Households | 15 (5.9%) | 0 (0.0%) |
| 6-Person Households | 0 (0.0%) | 0 (0.0%) |
| 7+ Person Households | 0 (0.0%) | 0 (0.0%) |
| Total | 151 (59.5%) | 103 (40.6%) |
Female Fertility in Cascade
Fertility by Age in Cascade
Average fertility rate in Cascade is 80.0 births per 1,000 women. Women in the age bracket of 35 to 50 years have the highest fertility rate with 100.0 births per 1,000 women. Women in the age bracket of 20 to 34 years acount for 57.1% of all women with births.
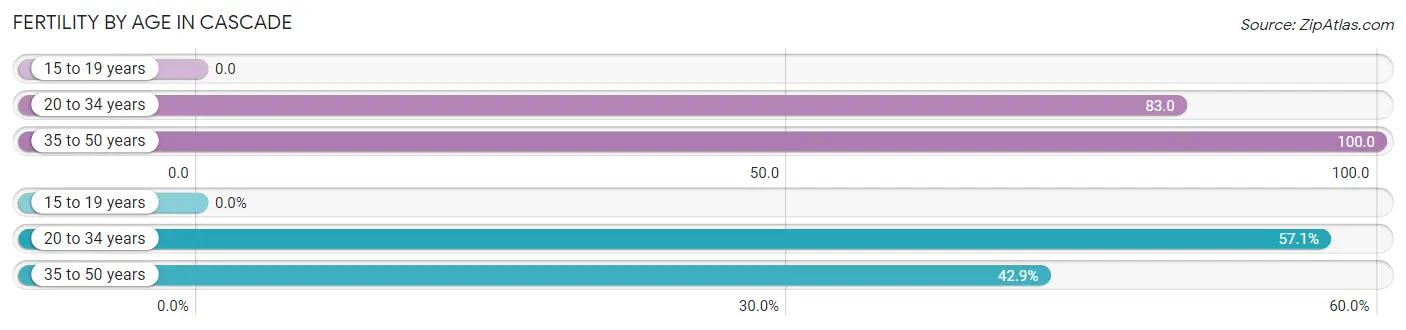
| Age Bracket | Women with Births | Births / 1,000 Women |
| 15 to 19 years | 0 (0.0%) | 0.0 |
| 20 to 34 years | 4 (57.1%) | 83.0 |
| 35 to 50 years | 3 (42.9%) | 100.0 |
| Total | 7 (100.0%) | 80.0 |
Fertility by Age by Marriage Status in Cascade
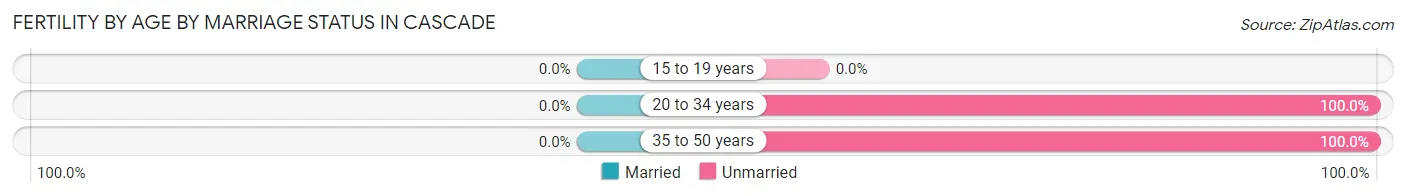
| Age Bracket | Married | Unmarried |
| 15 to 19 years | 0 (0.0%) | 0 (0.0%) |
| 20 to 34 years | 0 (0.0%) | 4 (100.0%) |
| 35 to 50 years | 0 (0.0%) | 3 (100.0%) |
| Total | 0 (0.0%) | 7 (100.0%) |
Fertility by Education in Cascade
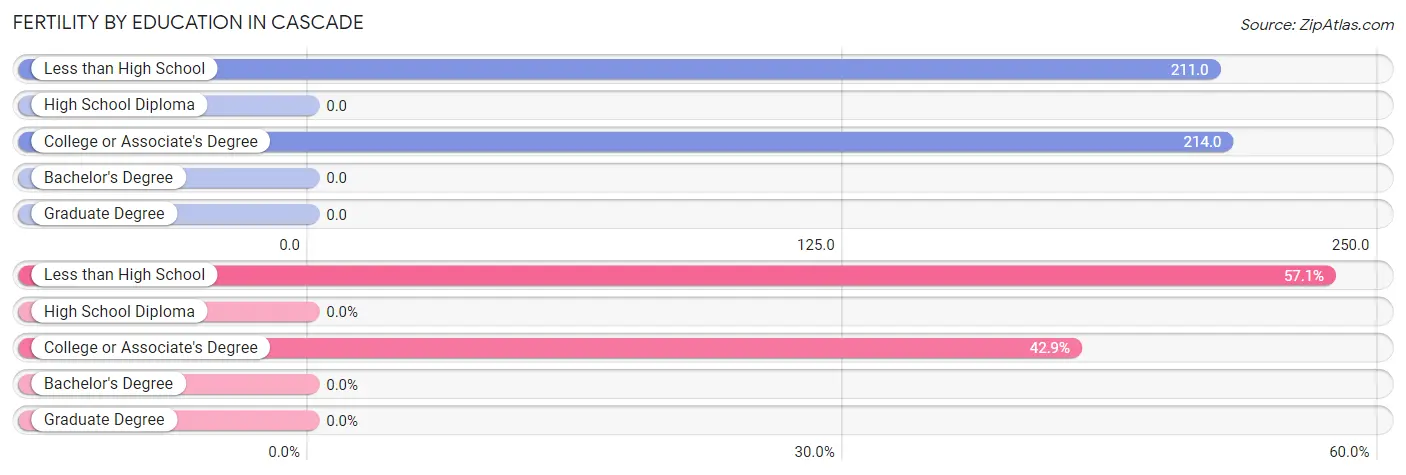
| Educational Attainment | Women with Births | Births / 1,000 Women |
| Less than High School | 4 (57.1%) | 211.0 |
| High School Diploma | 0 (0.0%) | 0.0 |
| College or Associate's Degree | 3 (42.9%) | 214.0 |
| Bachelor's Degree | 0 (0.0%) | 0.0 |
| Graduate Degree | 0 (0.0%) | 0.0 |
| Total | 7 (100.0%) | 80.0 |
Fertility by Education by Marriage Status in Cascade
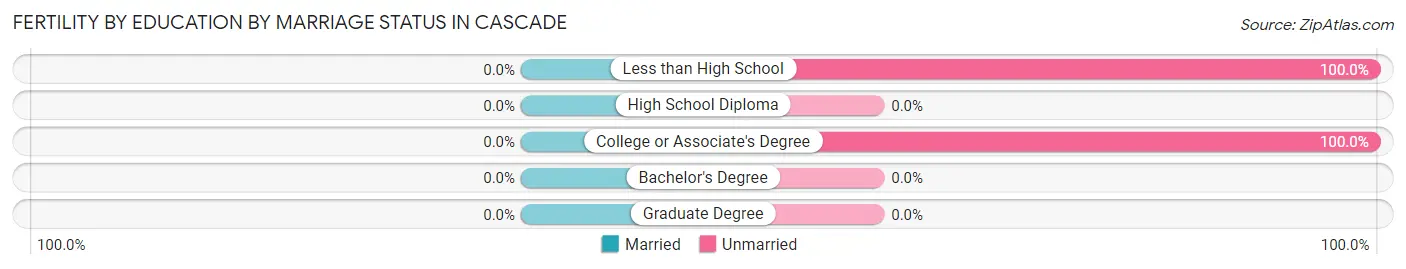
| Educational Attainment | Married | Unmarried |
| Less than High School | 0 (0.0%) | 4 (100.0%) |
| High School Diploma | 0 (0.0%) | 0 (0.0%) |
| College or Associate's Degree | 0 (0.0%) | 3 (100.0%) |
| Bachelor's Degree | 0 (0.0%) | 0 (0.0%) |
| Graduate Degree | 0 (0.0%) | 0 (0.0%) |
| Total | 0 (0.0%) | 7 (100.0%) |
Employment Characteristics in Cascade
Employment by Class of Employer in Cascade
Among the 228 employed individuals in Cascade, private company employees (133 | 58.3%), local government employees (34 | 14.9%), and federal government employees (28 | 12.3%) make up the most common classes of employment.
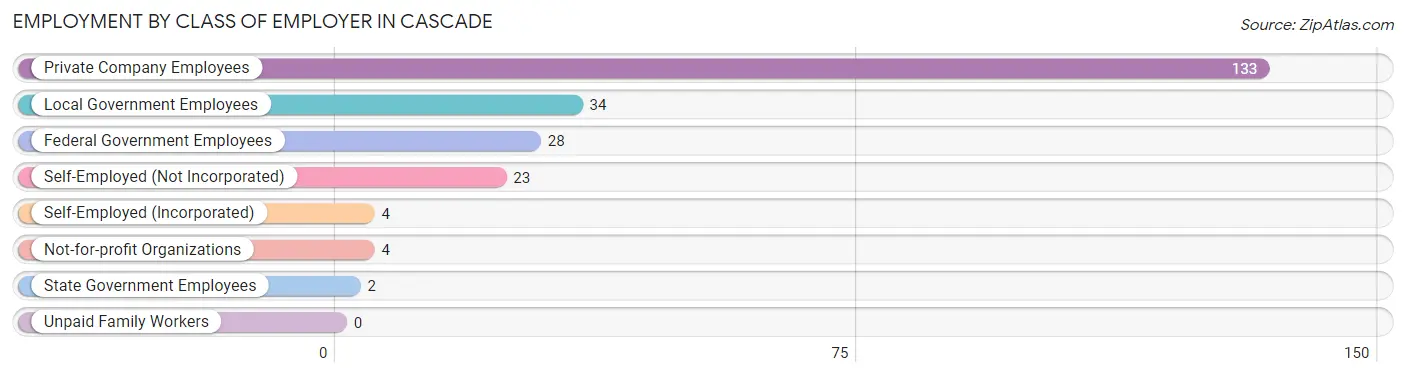
| Employer Class | # Employees | % Employees |
| Private Company Employees | 133 | 58.3% |
| Self-Employed (Incorporated) | 4 | 1.8% |
| Self-Employed (Not Incorporated) | 23 | 10.1% |
| Not-for-profit Organizations | 4 | 1.8% |
| Local Government Employees | 34 | 14.9% |
| State Government Employees | 2 | 0.9% |
| Federal Government Employees | 28 | 12.3% |
| Unpaid Family Workers | 0 | 0.0% |
| Total | 228 | 100.0% |
Employment Status by Age in Cascade
According to the labor force statistics for Cascade, out of the total population over 16 years of age (505), 46.7% or 236 individuals are in the labor force, with 3.4% or 8 of them unemployed. The age group with the highest labor force participation rate is 25 to 29 years, with 100.0% or 7 individuals in the labor force. Within the labor force, the 65 to 74 years age range has the highest percentage of unemployed individuals, with 17.6% or 3 of them being unemployed.
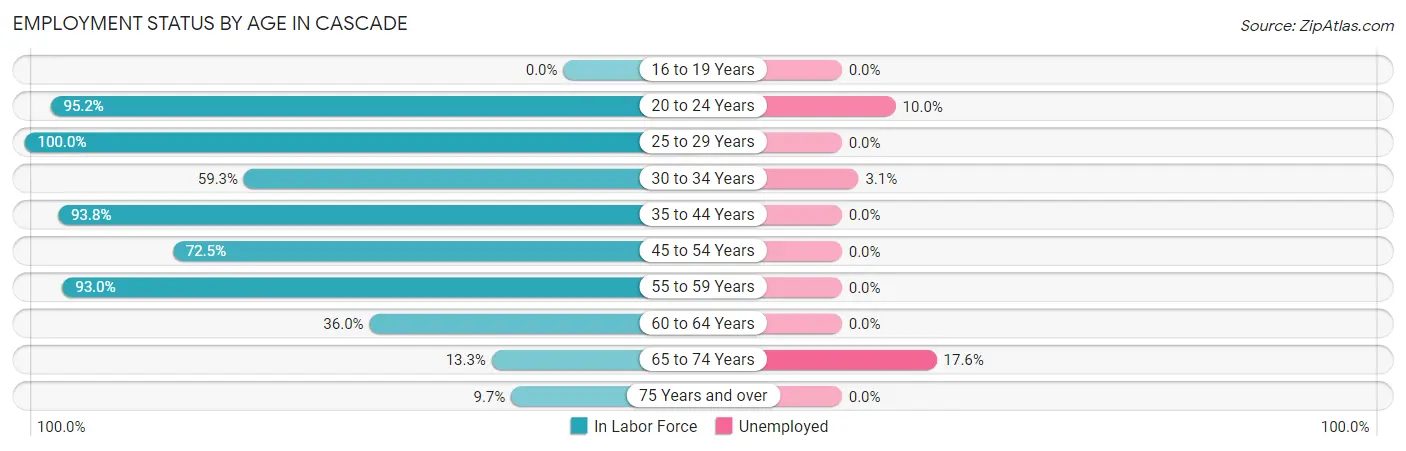
| Age Bracket | In Labor Force | Unemployed |
| 16 to 19 Years | 0 (0.0%) | 0 (0.0%) |
| 20 to 24 Years | 40 (95.2%) | 4 (10.0%) |
| 25 to 29 Years | 7 (100.0%) | 0 (0.0%) |
| 30 to 34 Years | 32 (59.3%) | 1 (3.1%) |
| 35 to 44 Years | 45 (93.8%) | 0 (0.0%) |
| 45 to 54 Years | 37 (72.5%) | 0 (0.0%) |
| 55 to 59 Years | 40 (93.0%) | 0 (0.0%) |
| 60 to 64 Years | 9 (36.0%) | 0 (0.0%) |
| 65 to 74 Years | 17 (13.3%) | 3 (17.6%) |
| 75 Years and over | 9 (9.7%) | 0 (0.0%) |
| Total | 236 (46.7%) | 8 (3.4%) |
Employment Status by Educational Attainment in Cascade
According to labor force statistics for Cascade, 74.6% of individuals (170) out of the total population between 25 and 64 years of age (228) are in the labor force, with 0.6% or 1 of them being unemployed. The group with the highest labor force participation rate are those with the educational attainment of bachelor's degree or higher, with 93.1% or 27 individuals in the labor force. Within the labor force, individuals with college / associate degree education have the highest percentage of unemployment, with 1.2% or 1 of them being unemployed.
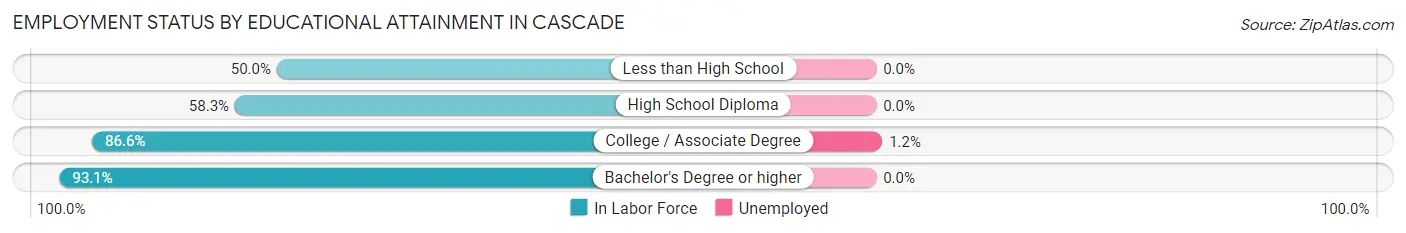
| Educational Attainment | In Labor Force | Unemployed |
| Less than High School | 3 (50.0%) | 0 (0.0%) |
| High School Diploma | 56 (58.3%) | 0 (0.0%) |
| College / Associate Degree | 84 (86.6%) | 1 (1.2%) |
| Bachelor's Degree or higher | 27 (93.1%) | 0 (0.0%) |
| Total | 170 (74.6%) | 1 (0.6%) |
Employment Occupations by Sex in Cascade
Management, Business, Science and Arts Occupations
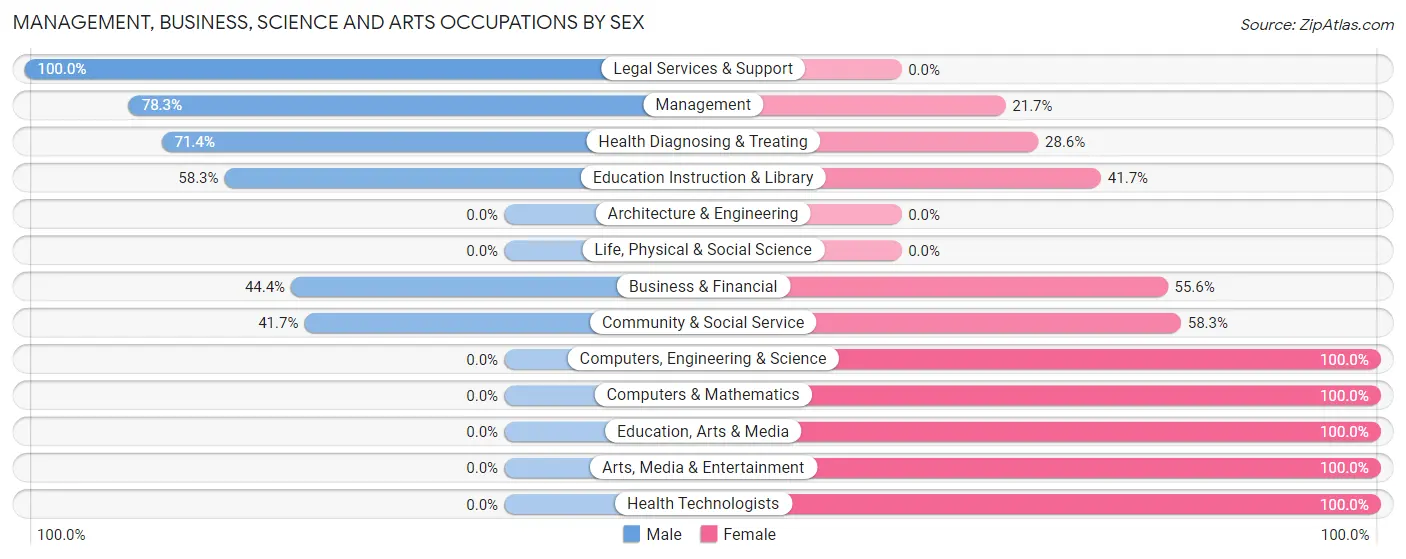
The most common Management, Business, Science and Arts occupations in Cascade are Community & Social Service (36 | 15.8%), Management (23 | 10.1%), Business & Financial (18 | 7.9%), Education Instruction & Library (12 | 5.3%), and Education, Arts & Media (9 | 4.0%).
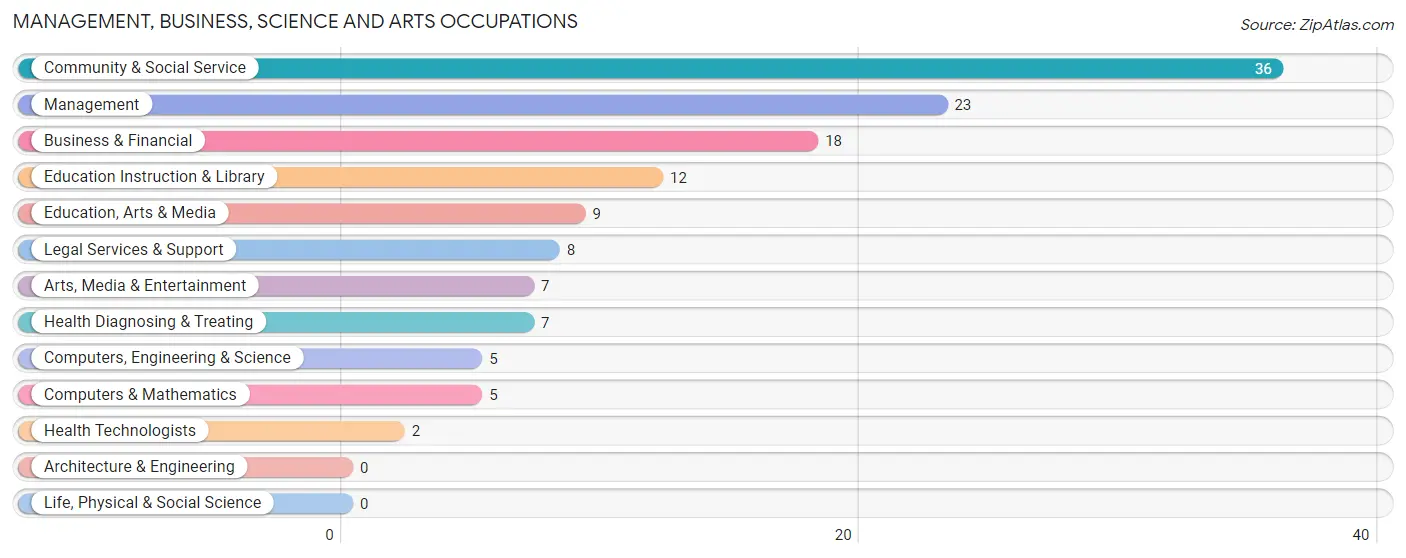
Management, Business, Science and Arts Occupations by Sex
Within the Management, Business, Science and Arts occupations in Cascade, the most male-oriented occupations are Legal Services & Support (100.0%), Management (78.3%), and Health Diagnosing & Treating (71.4%), while the most female-oriented occupations are Computers, Engineering & Science (100.0%), Computers & Mathematics (100.0%), and Education, Arts & Media (100.0%).
| Occupation | Male | Female |
| Management | 18 (78.3%) | 5 (21.7%) |
| Business & Financial | 8 (44.4%) | 10 (55.6%) |
| Computers, Engineering & Science | 0 (0.0%) | 5 (100.0%) |
| Computers & Mathematics | 0 (0.0%) | 5 (100.0%) |
| Architecture & Engineering | 0 (0.0%) | 0 (0.0%) |
| Life, Physical & Social Science | 0 (0.0%) | 0 (0.0%) |
| Community & Social Service | 15 (41.7%) | 21 (58.3%) |
| Education, Arts & Media | 0 (0.0%) | 9 (100.0%) |
| Legal Services & Support | 8 (100.0%) | 0 (0.0%) |
| Education Instruction & Library | 7 (58.3%) | 5 (41.7%) |
| Arts, Media & Entertainment | 0 (0.0%) | 7 (100.0%) |
| Health Diagnosing & Treating | 5 (71.4%) | 2 (28.6%) |
| Health Technologists | 0 (0.0%) | 2 (100.0%) |
| Total (Category) | 46 (51.7%) | 43 (48.3%) |
| Total (Overall) | 121 (53.1%) | 107 (46.9%) |
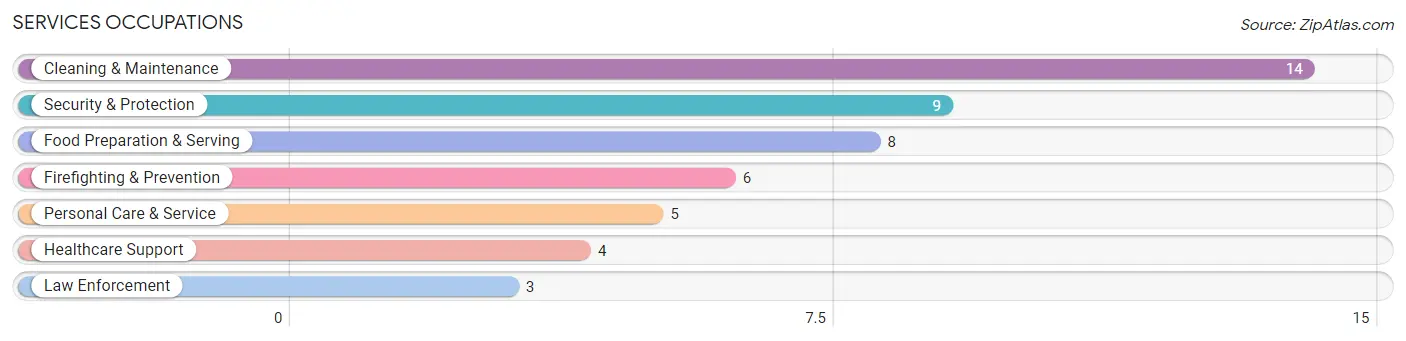
Services Occupations
The most common Services occupations in Cascade are Cleaning & Maintenance (14 | 6.1%), Security & Protection (9 | 4.0%), Food Preparation & Serving (8 | 3.5%), Firefighting & Prevention (6 | 2.6%), and Personal Care & Service (5 | 2.2%).
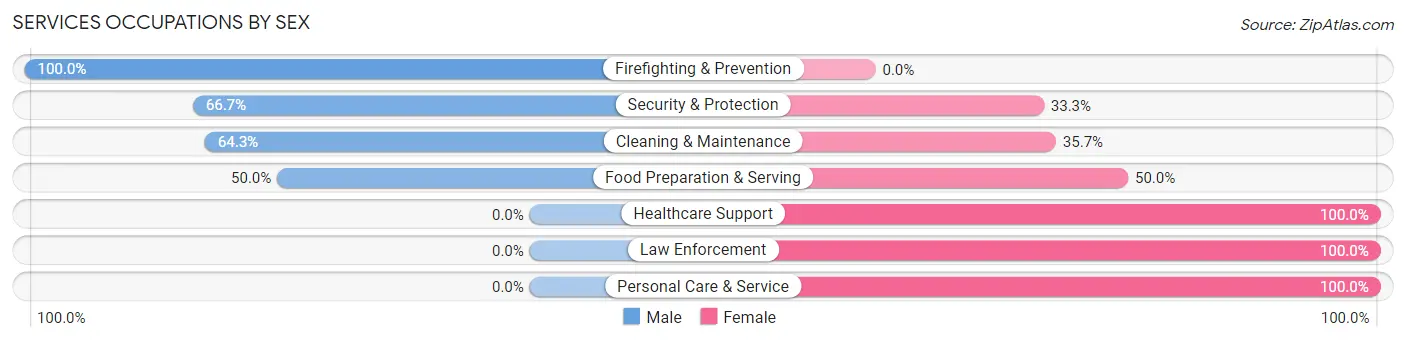
Services Occupations by Sex
Within the Services occupations in Cascade, the most male-oriented occupations are Firefighting & Prevention (100.0%), Security & Protection (66.7%), and Cleaning & Maintenance (64.3%), while the most female-oriented occupations are Healthcare Support (100.0%), Law Enforcement (100.0%), and Personal Care & Service (100.0%).
| Occupation | Male | Female |
| Healthcare Support | 0 (0.0%) | 4 (100.0%) |
| Security & Protection | 6 (66.7%) | 3 (33.3%) |
| Firefighting & Prevention | 6 (100.0%) | 0 (0.0%) |
| Law Enforcement | 0 (0.0%) | 3 (100.0%) |
| Food Preparation & Serving | 4 (50.0%) | 4 (50.0%) |
| Cleaning & Maintenance | 9 (64.3%) | 5 (35.7%) |
| Personal Care & Service | 0 (0.0%) | 5 (100.0%) |
| Total (Category) | 19 (47.5%) | 21 (52.5%) |
| Total (Overall) | 121 (53.1%) | 107 (46.9%) |
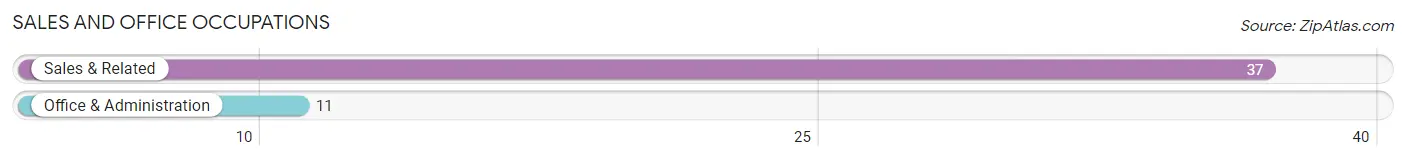
Sales and Office Occupations
The most common Sales and Office occupations in Cascade are Sales & Related (37 | 16.2%), and Office & Administration (11 | 4.8%).
Sales and Office Occupations by Sex
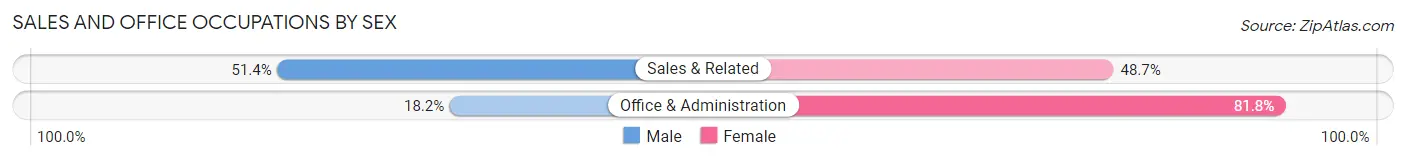
| Occupation | Male | Female |
| Sales & Related | 19 (51.3%) | 18 (48.6%) |
| Office & Administration | 2 (18.2%) | 9 (81.8%) |
| Total (Category) | 21 (43.8%) | 27 (56.2%) |
| Total (Overall) | 121 (53.1%) | 107 (46.9%) |
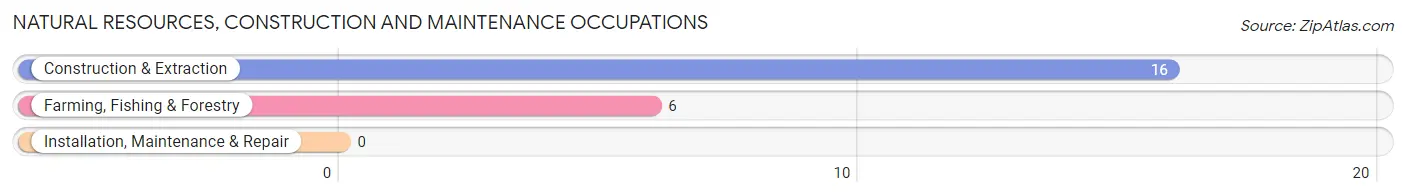
Natural Resources, Construction and Maintenance Occupations
The most common Natural Resources, Construction and Maintenance occupations in Cascade are Construction & Extraction (16 | 7.0%), and Farming, Fishing & Forestry (6 | 2.6%).
Natural Resources, Construction and Maintenance Occupations by Sex
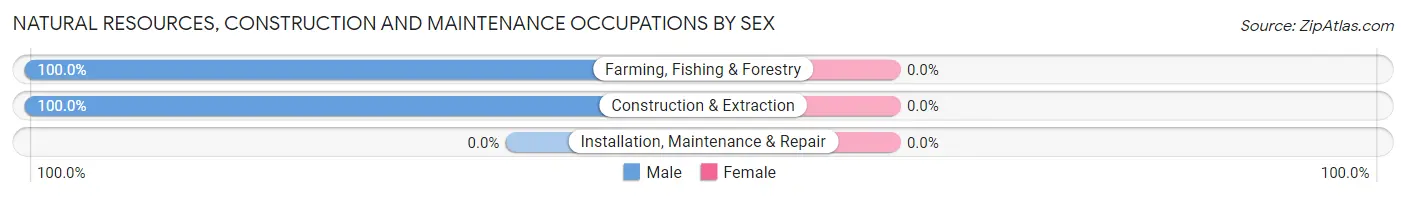
| Occupation | Male | Female |
| Farming, Fishing & Forestry | 6 (100.0%) | 0 (0.0%) |
| Construction & Extraction | 16 (100.0%) | 0 (0.0%) |
| Installation, Maintenance & Repair | 0 (0.0%) | 0 (0.0%) |
| Total (Category) | 22 (100.0%) | 0 (0.0%) |
| Total (Overall) | 121 (53.1%) | 107 (46.9%) |
Production, Transportation and Moving Occupations
The most common Production, Transportation and Moving occupations in Cascade are Material Moving (16 | 7.0%), Transportation (7 | 3.1%), and Production (6 | 2.6%).
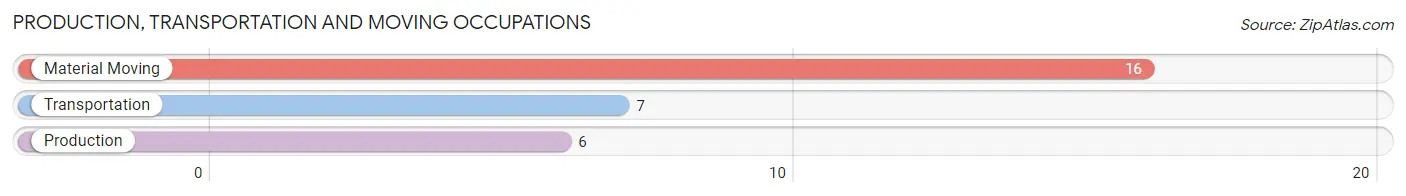
Production, Transportation and Moving Occupations by Sex
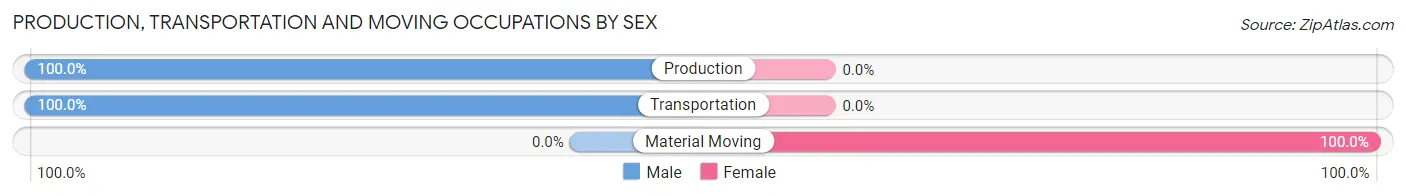
| Occupation | Male | Female |
| Production | 6 (100.0%) | 0 (0.0%) |
| Transportation | 7 (100.0%) | 0 (0.0%) |
| Material Moving | 0 (0.0%) | 16 (100.0%) |
| Total (Category) | 13 (44.8%) | 16 (55.2%) |
| Total (Overall) | 121 (53.1%) | 107 (46.9%) |
Employment Industries by Sex in Cascade
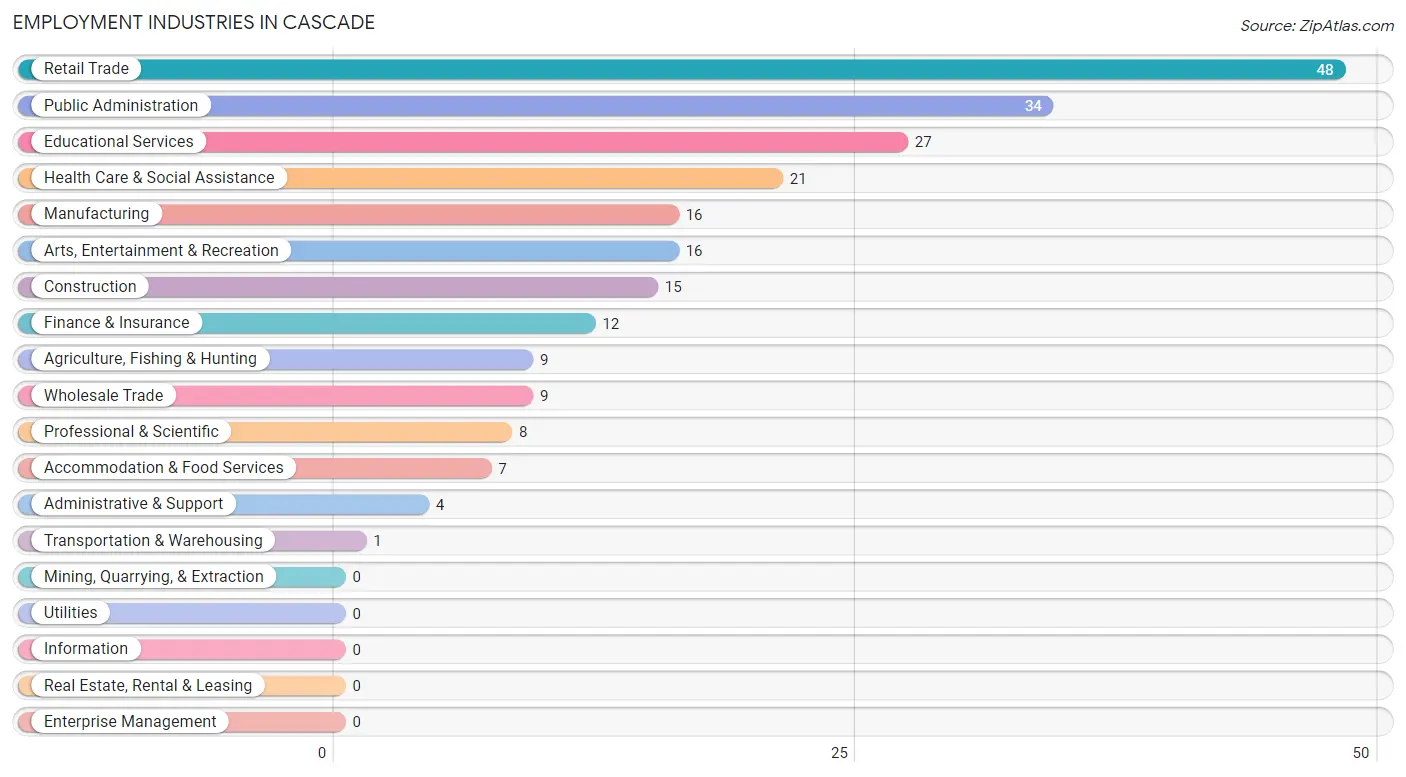
Employment Industries in Cascade
The major employment industries in Cascade include Retail Trade (48 | 21.0%), Public Administration (34 | 14.9%), Educational Services (27 | 11.8%), Health Care & Social Assistance (21 | 9.2%), and Manufacturing (16 | 7.0%).
Employment Industries by Sex in Cascade
The Cascade industries that see more men than women are Agriculture, Fishing & Hunting (100.0%), Transportation & Warehousing (100.0%), and Professional & Scientific (100.0%), whereas the industries that tend to have a higher number of women are Wholesale Trade (100.0%), Finance & Insurance (100.0%), and Public Administration (58.8%).
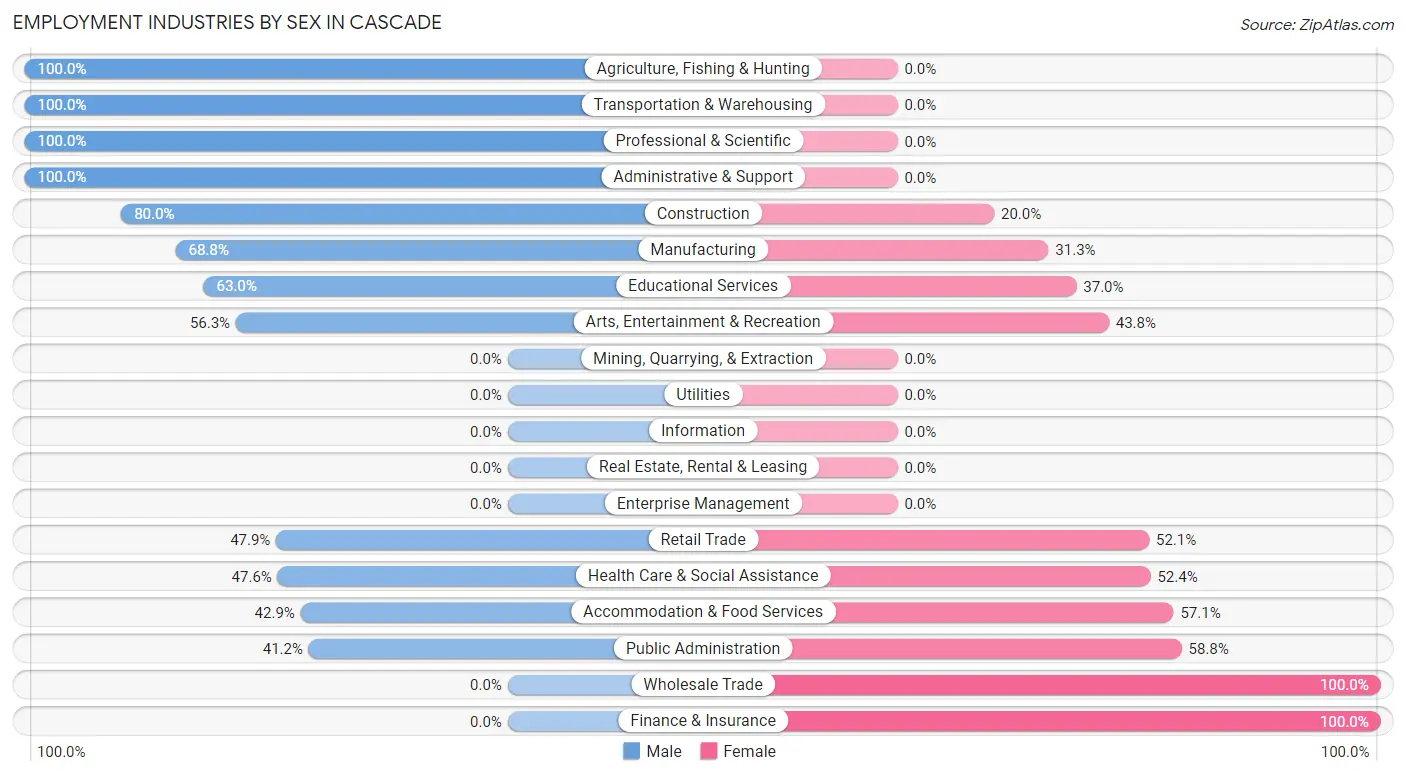
| Industry | Male | Female |
| Agriculture, Fishing & Hunting | 9 (100.0%) | 0 (0.0%) |
| Mining, Quarrying, & Extraction | 0 (0.0%) | 0 (0.0%) |
| Construction | 12 (80.0%) | 3 (20.0%) |
| Manufacturing | 11 (68.8%) | 5 (31.2%) |
| Wholesale Trade | 0 (0.0%) | 9 (100.0%) |
| Retail Trade | 23 (47.9%) | 25 (52.1%) |
| Transportation & Warehousing | 1 (100.0%) | 0 (0.0%) |
| Utilities | 0 (0.0%) | 0 (0.0%) |
| Information | 0 (0.0%) | 0 (0.0%) |
| Finance & Insurance | 0 (0.0%) | 12 (100.0%) |
| Real Estate, Rental & Leasing | 0 (0.0%) | 0 (0.0%) |
| Professional & Scientific | 8 (100.0%) | 0 (0.0%) |
| Enterprise Management | 0 (0.0%) | 0 (0.0%) |
| Administrative & Support | 4 (100.0%) | 0 (0.0%) |
| Educational Services | 17 (63.0%) | 10 (37.0%) |
| Health Care & Social Assistance | 10 (47.6%) | 11 (52.4%) |
| Arts, Entertainment & Recreation | 9 (56.2%) | 7 (43.8%) |
| Accommodation & Food Services | 3 (42.9%) | 4 (57.1%) |
| Public Administration | 14 (41.2%) | 20 (58.8%) |
| Total | 121 (53.1%) | 107 (46.9%) |
Education in Cascade
School Enrollment in Cascade
The most common levels of schooling among the 81 students in Cascade are high school (24 | 29.6%), middle school (22 | 27.2%), and elementary school (21 | 25.9%).
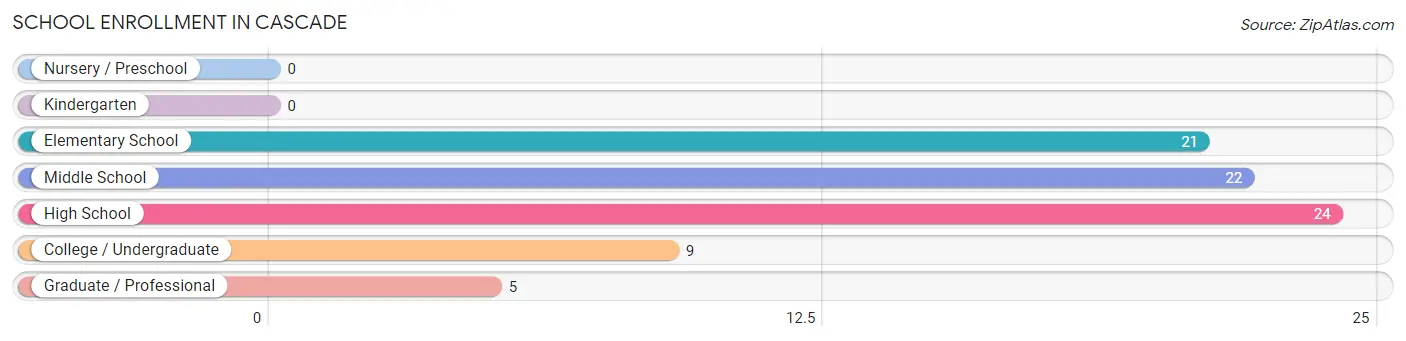
| School Level | # Students | % Students |
| Nursery / Preschool | 0 | 0.0% |
| Kindergarten | 0 | 0.0% |
| Elementary School | 21 | 25.9% |
| Middle School | 22 | 27.2% |
| High School | 24 | 29.6% |
| College / Undergraduate | 9 | 11.1% |
| Graduate / Professional | 5 | 6.2% |
| Total | 81 | 100.0% |
School Enrollment by Age by Funding Source in Cascade
Out of a total of 81 students who are enrolled in schools in Cascade, 5 (6.2%) attend a private institution, while the remaining 76 (93.8%) are enrolled in public schools. The age group of 20 to 24 year olds has the highest likelihood of being enrolled in private schools, with 5 (100.0% in the age bracket) enrolled. Conversely, the age group of 5 to 9 year old has the lowest likelihood of being enrolled in a private school, with 10 (100.0% in the age bracket) attending a public institution.
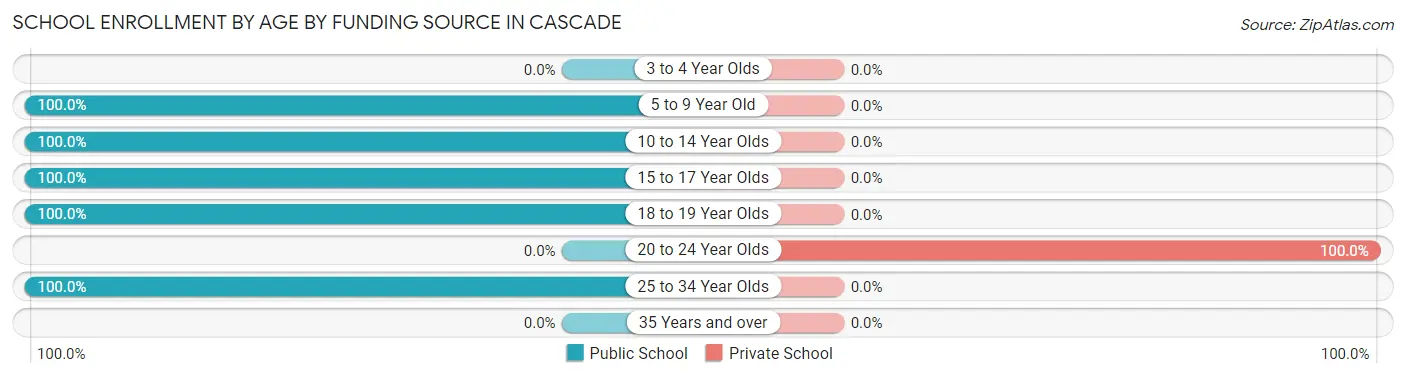
| Age Bracket | Public School | Private School |
| 3 to 4 Year Olds | 0 (0.0%) | 0 (0.0%) |
| 5 to 9 Year Old | 10 (100.0%) | 0 (0.0%) |
| 10 to 14 Year Olds | 33 (100.0%) | 0 (0.0%) |
| 15 to 17 Year Olds | 10 (100.0%) | 0 (0.0%) |
| 18 to 19 Year Olds | 14 (100.0%) | 0 (0.0%) |
| 20 to 24 Year Olds | 0 (0.0%) | 5 (100.0%) |
| 25 to 34 Year Olds | 9 (100.0%) | 0 (0.0%) |
| 35 Years and over | 0 (0.0%) | 0 (0.0%) |
| Total | 76 (93.8%) | 5 (6.2%) |
Educational Attainment by Field of Study in Cascade
Psychology (19 | 21.6%), social sciences (18 | 20.4%), education (16 | 18.2%), liberal arts & history (10 | 11.4%), and business (7 | 8.0%) are the most common fields of study among 88 individuals in Cascade who have obtained a bachelor's degree or higher.
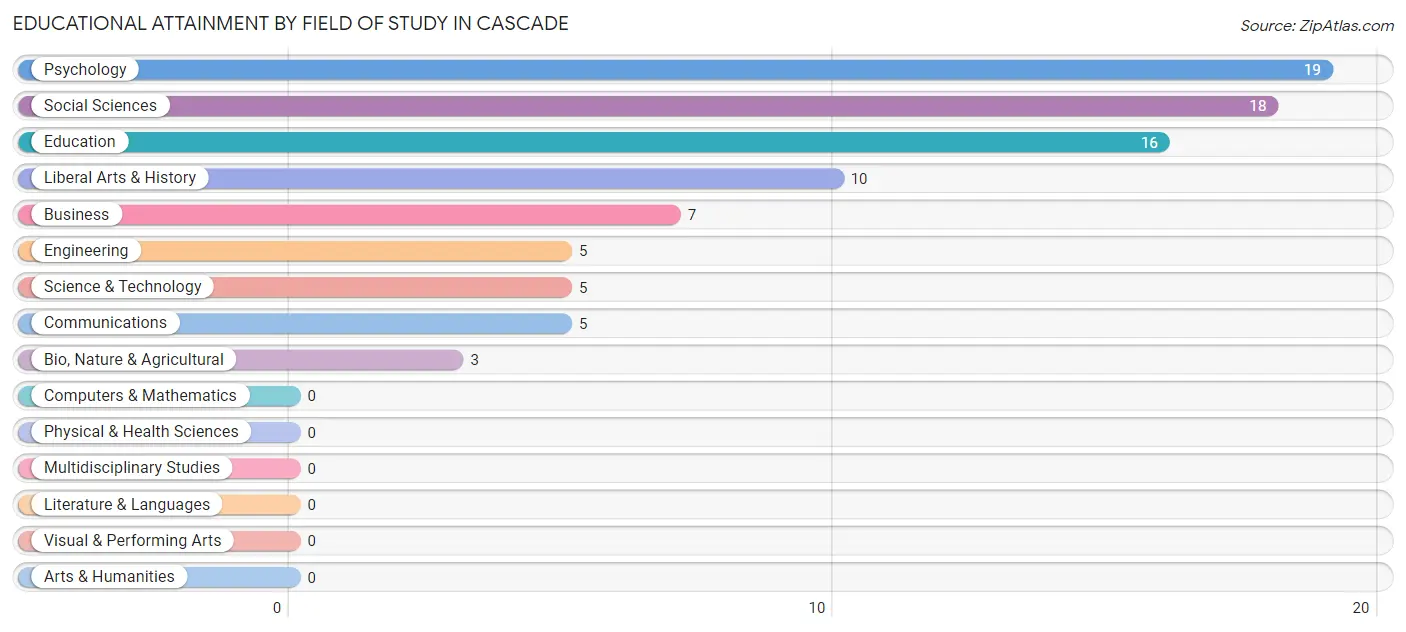
| Field of Study | # Graduates | % Graduates |
| Computers & Mathematics | 0 | 0.0% |
| Bio, Nature & Agricultural | 3 | 3.4% |
| Physical & Health Sciences | 0 | 0.0% |
| Psychology | 19 | 21.6% |
| Social Sciences | 18 | 20.4% |
| Engineering | 5 | 5.7% |
| Multidisciplinary Studies | 0 | 0.0% |
| Science & Technology | 5 | 5.7% |
| Business | 7 | 8.0% |
| Education | 16 | 18.2% |
| Literature & Languages | 0 | 0.0% |
| Liberal Arts & History | 10 | 11.4% |
| Visual & Performing Arts | 0 | 0.0% |
| Communications | 5 | 5.7% |
| Arts & Humanities | 0 | 0.0% |
| Total | 88 | 100.0% |
Transportation & Commute in Cascade
Vehicle Availability by Sex in Cascade
The most prevalent vehicle ownership categories in Cascade are males with 2 vehicles (75, accounting for 63.6%) and females with 2 vehicles (85, making up 70.1%).
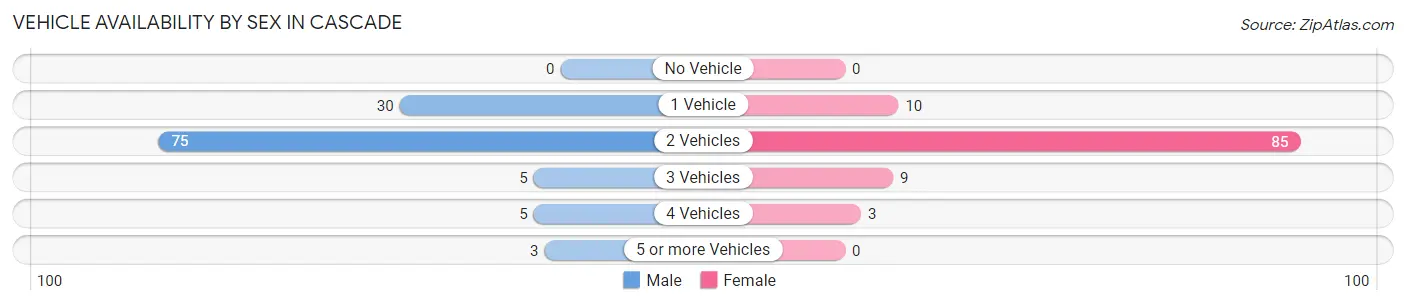
| Vehicles Available | Male | Female |
| No Vehicle | 0 (0.0%) | 0 (0.0%) |
| 1 Vehicle | 30 (25.4%) | 10 (9.3%) |
| 2 Vehicles | 75 (63.6%) | 85 (79.4%) |
| 3 Vehicles | 5 (4.2%) | 9 (8.4%) |
| 4 Vehicles | 5 (4.2%) | 3 (2.8%) |
| 5 or more Vehicles | 3 (2.5%) | 0 (0.0%) |
| Total | 118 (100.0%) | 107 (100.0%) |
Commute Time in Cascade
The most frequently occuring commute durations in Cascade are 30 to 34 minutes (34 commuters, 18.5%), 10 to 14 minutes (33 commuters, 17.9%), and 25 to 29 minutes (29 commuters, 15.8%).
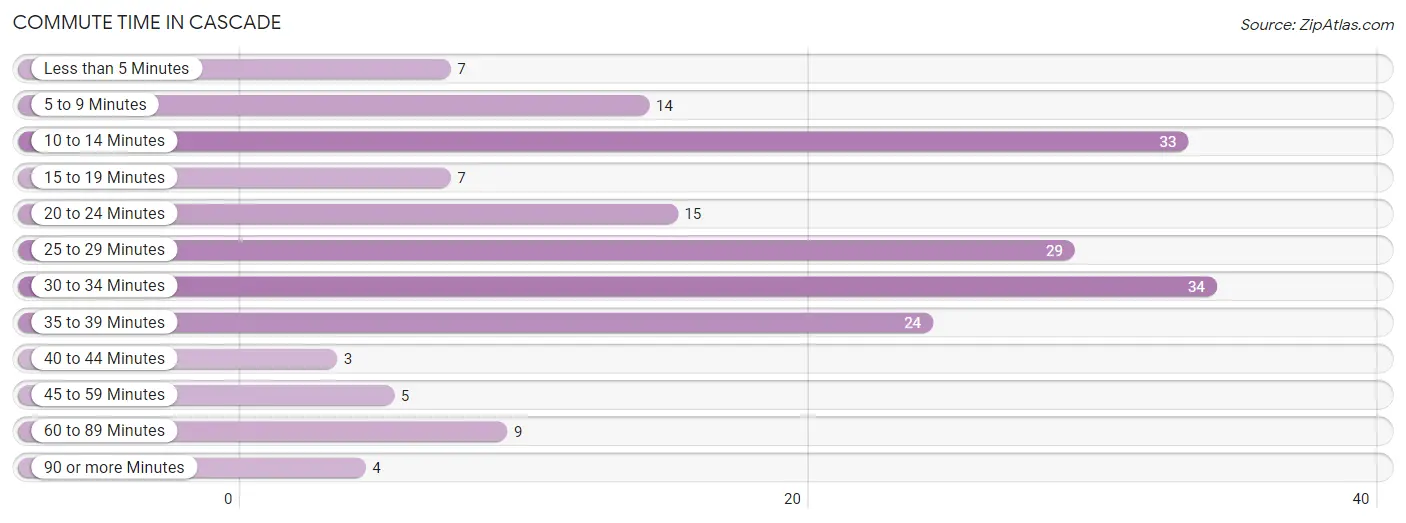
| Commute Time | # Commuters | % Commuters |
| Less than 5 Minutes | 7 | 3.8% |
| 5 to 9 Minutes | 14 | 7.6% |
| 10 to 14 Minutes | 33 | 17.9% |
| 15 to 19 Minutes | 7 | 3.8% |
| 20 to 24 Minutes | 15 | 8.2% |
| 25 to 29 Minutes | 29 | 15.8% |
| 30 to 34 Minutes | 34 | 18.5% |
| 35 to 39 Minutes | 24 | 13.0% |
| 40 to 44 Minutes | 3 | 1.6% |
| 45 to 59 Minutes | 5 | 2.7% |
| 60 to 89 Minutes | 9 | 4.9% |
| 90 or more Minutes | 4 | 2.2% |
Commute Time by Sex in Cascade
The most common commute times in Cascade are 35 to 39 minutes (17 commuters, 16.8%) for males and 10 to 14 minutes (21 commuters, 25.3%) for females.
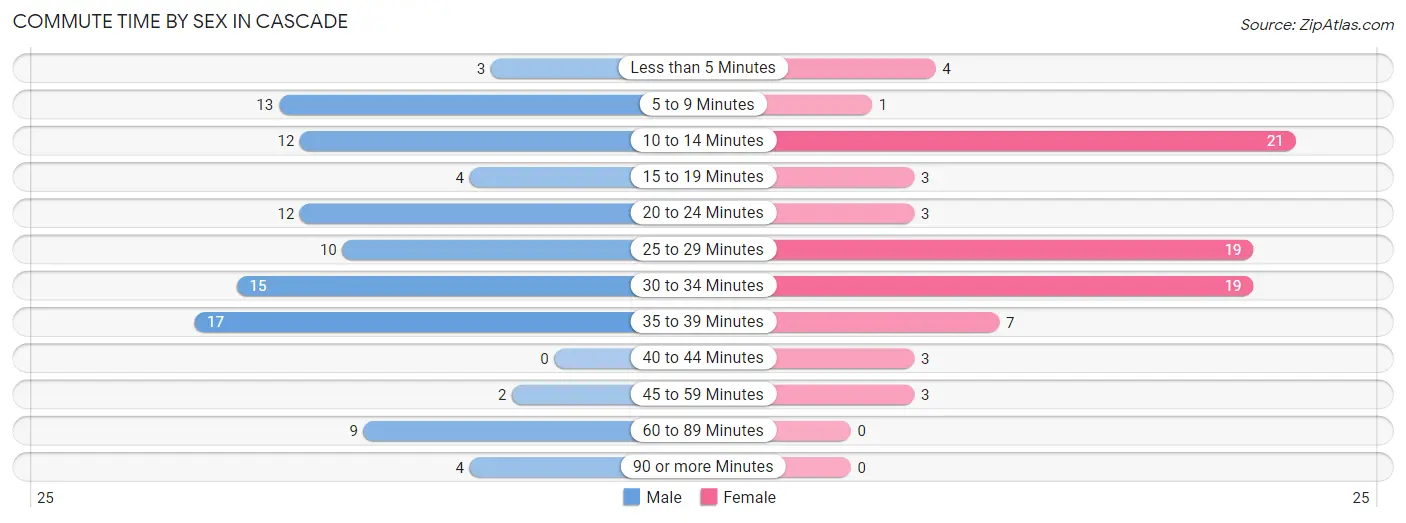
| Commute Time | Male | Female |
| Less than 5 Minutes | 3 (3.0%) | 4 (4.8%) |
| 5 to 9 Minutes | 13 (12.9%) | 1 (1.2%) |
| 10 to 14 Minutes | 12 (11.9%) | 21 (25.3%) |
| 15 to 19 Minutes | 4 (4.0%) | 3 (3.6%) |
| 20 to 24 Minutes | 12 (11.9%) | 3 (3.6%) |
| 25 to 29 Minutes | 10 (9.9%) | 19 (22.9%) |
| 30 to 34 Minutes | 15 (14.8%) | 19 (22.9%) |
| 35 to 39 Minutes | 17 (16.8%) | 7 (8.4%) |
| 40 to 44 Minutes | 0 (0.0%) | 3 (3.6%) |
| 45 to 59 Minutes | 2 (2.0%) | 3 (3.6%) |
| 60 to 89 Minutes | 9 (8.9%) | 0 (0.0%) |
| 90 or more Minutes | 4 (4.0%) | 0 (0.0%) |
Time of Departure to Work by Sex in Cascade
The most frequent times of departure to work in Cascade are 6:30 AM to 6:59 AM (17, 16.8%) for males and 7:00 AM to 7:29 AM (30, 36.1%) for females.
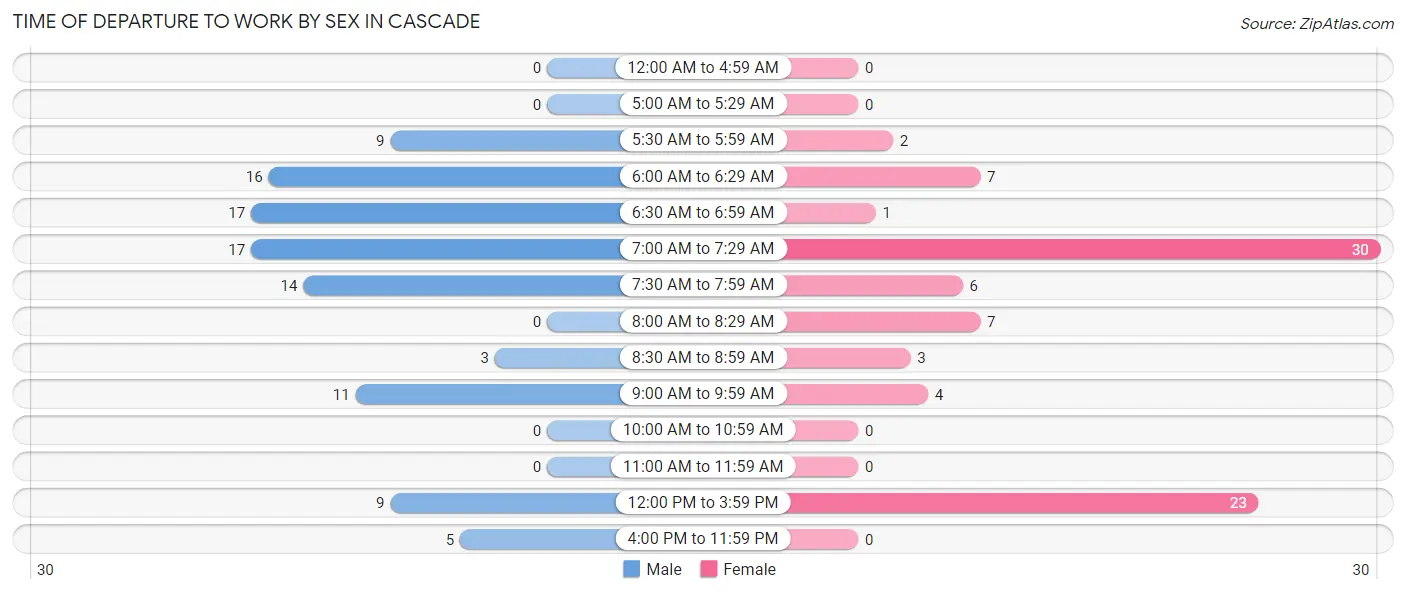
| Time of Departure | Male | Female |
| 12:00 AM to 4:59 AM | 0 (0.0%) | 0 (0.0%) |
| 5:00 AM to 5:29 AM | 0 (0.0%) | 0 (0.0%) |
| 5:30 AM to 5:59 AM | 9 (8.9%) | 2 (2.4%) |
| 6:00 AM to 6:29 AM | 16 (15.8%) | 7 (8.4%) |
| 6:30 AM to 6:59 AM | 17 (16.8%) | 1 (1.2%) |
| 7:00 AM to 7:29 AM | 17 (16.8%) | 30 (36.1%) |
| 7:30 AM to 7:59 AM | 14 (13.9%) | 6 (7.2%) |
| 8:00 AM to 8:29 AM | 0 (0.0%) | 7 (8.4%) |
| 8:30 AM to 8:59 AM | 3 (3.0%) | 3 (3.6%) |
| 9:00 AM to 9:59 AM | 11 (10.9%) | 4 (4.8%) |
| 10:00 AM to 10:59 AM | 0 (0.0%) | 0 (0.0%) |
| 11:00 AM to 11:59 AM | 0 (0.0%) | 0 (0.0%) |
| 12:00 PM to 3:59 PM | 9 (8.9%) | 23 (27.7%) |
| 4:00 PM to 11:59 PM | 5 (5.0%) | 0 (0.0%) |
| Total | 101 (100.0%) | 83 (100.0%) |
Housing Occupancy in Cascade
Occupancy by Ownership in Cascade
Of the total 254 dwellings in Cascade, owner-occupied units account for 176 (69.3%), while renter-occupied units make up 78 (30.7%).
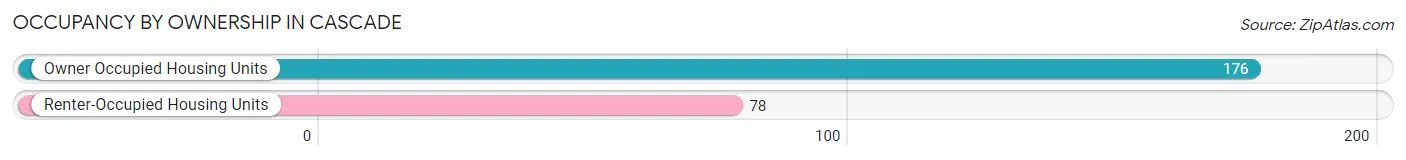
| Occupancy | # Housing Units | % Housing Units |
| Owner Occupied Housing Units | 176 | 69.3% |
| Renter-Occupied Housing Units | 78 | 30.7% |
| Total Occupied Housing Units | 254 | 100.0% |
Occupancy by Household Size in Cascade
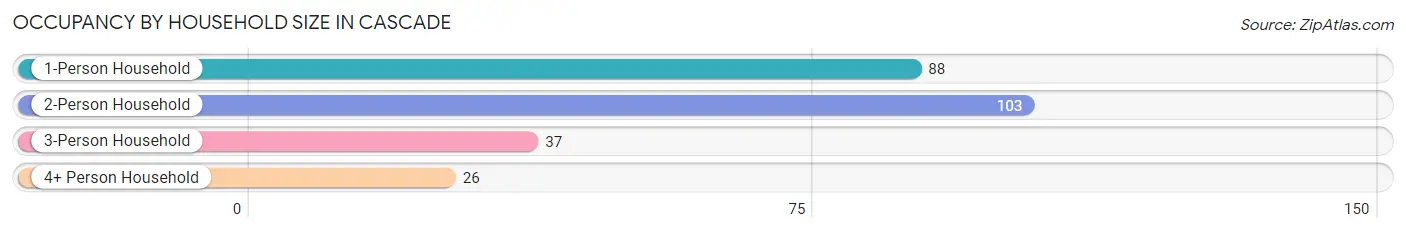
| Household Size | # Housing Units | % Housing Units |
| 1-Person Household | 88 | 34.6% |
| 2-Person Household | 103 | 40.6% |
| 3-Person Household | 37 | 14.6% |
| 4+ Person Household | 26 | 10.2% |
| Total Housing Units | 254 | 100.0% |
Occupancy by Ownership by Household Size in Cascade
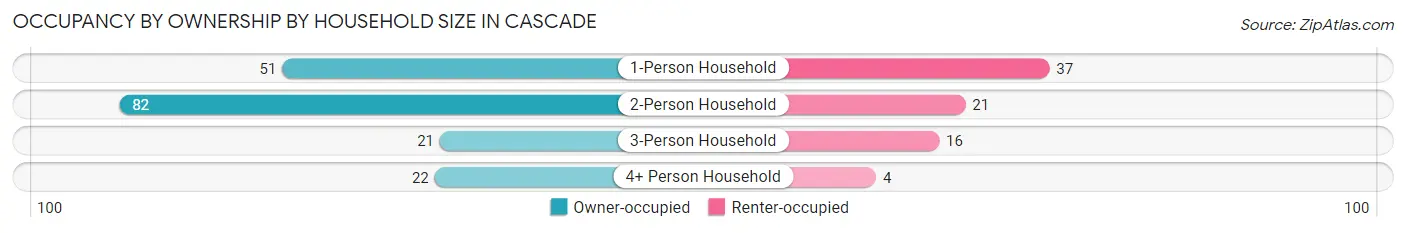
| Household Size | Owner-occupied | Renter-occupied |
| 1-Person Household | 51 (58.0%) | 37 (42.0%) |
| 2-Person Household | 82 (79.6%) | 21 (20.4%) |
| 3-Person Household | 21 (56.8%) | 16 (43.2%) |
| 4+ Person Household | 22 (84.6%) | 4 (15.4%) |
| Total Housing Units | 176 (69.3%) | 78 (30.7%) |
Occupancy by Educational Attainment in Cascade
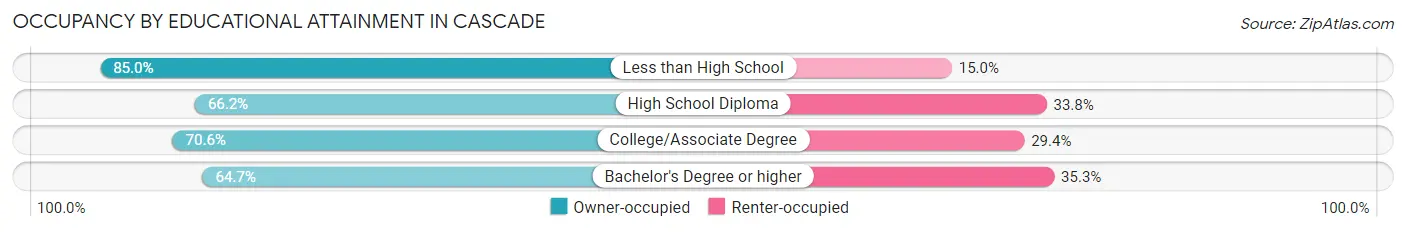
| Household Size | Owner-occupied | Renter-occupied |
| Less than High School | 17 (85.0%) | 3 (15.0%) |
| High School Diploma | 49 (66.2%) | 25 (33.8%) |
| College/Associate Degree | 77 (70.6%) | 32 (29.4%) |
| Bachelor's Degree or higher | 33 (64.7%) | 18 (35.3%) |
Occupancy by Age of Householder in Cascade
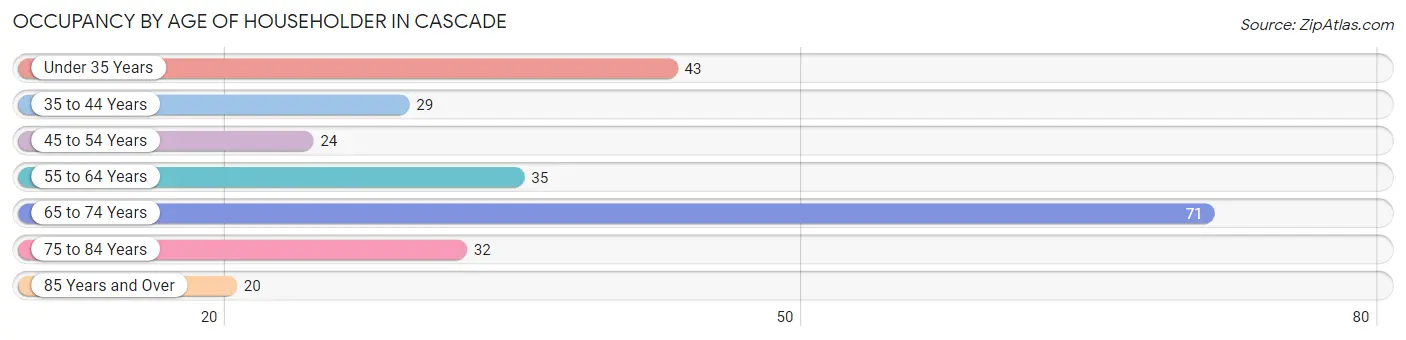
| Age Bracket | # Households | % Households |
| Under 35 Years | 43 | 16.9% |
| 35 to 44 Years | 29 | 11.4% |
| 45 to 54 Years | 24 | 9.5% |
| 55 to 64 Years | 35 | 13.8% |
| 65 to 74 Years | 71 | 28.0% |
| 75 to 84 Years | 32 | 12.6% |
| 85 Years and Over | 20 | 7.9% |
| Total | 254 | 100.0% |
Housing Finances in Cascade
Median Income by Occupancy in Cascade
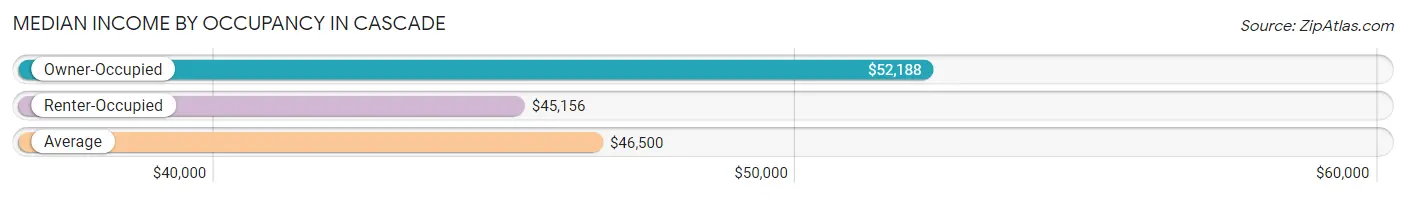
| Occupancy Type | # Households | Median Income |
| Owner-Occupied | 176 (69.3%) | $52,188 |
| Renter-Occupied | 78 (30.7%) | $45,156 |
| Average | 254 (100.0%) | $46,500 |
Occupancy by Householder Income Bracket in Cascade
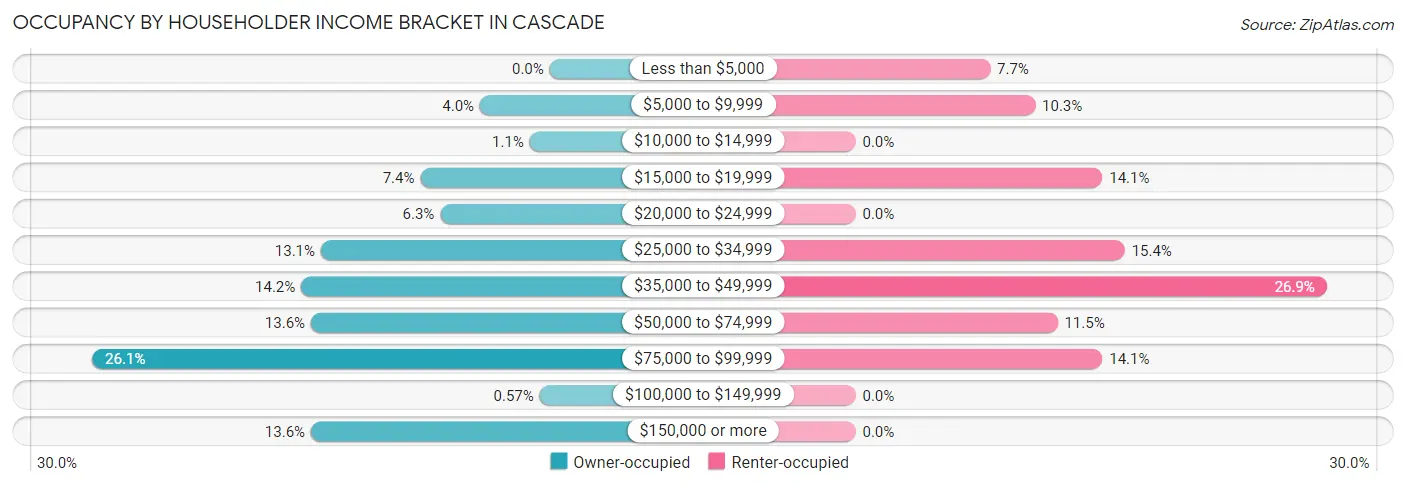
| Income Bracket | Owner-occupied | Renter-occupied |
| Less than $5,000 | 0 (0.0%) | 6 (7.7%) |
| $5,000 to $9,999 | 7 (4.0%) | 8 (10.3%) |
| $10,000 to $14,999 | 2 (1.1%) | 0 (0.0%) |
| $15,000 to $19,999 | 13 (7.4%) | 11 (14.1%) |
| $20,000 to $24,999 | 11 (6.2%) | 0 (0.0%) |
| $25,000 to $34,999 | 23 (13.1%) | 12 (15.4%) |
| $35,000 to $49,999 | 25 (14.2%) | 21 (26.9%) |
| $50,000 to $74,999 | 24 (13.6%) | 9 (11.5%) |
| $75,000 to $99,999 | 46 (26.1%) | 11 (14.1%) |
| $100,000 to $149,999 | 1 (0.6%) | 0 (0.0%) |
| $150,000 or more | 24 (13.6%) | 0 (0.0%) |
| Total | 176 (100.0%) | 78 (100.0%) |
Monthly Housing Cost Tiers in Cascade
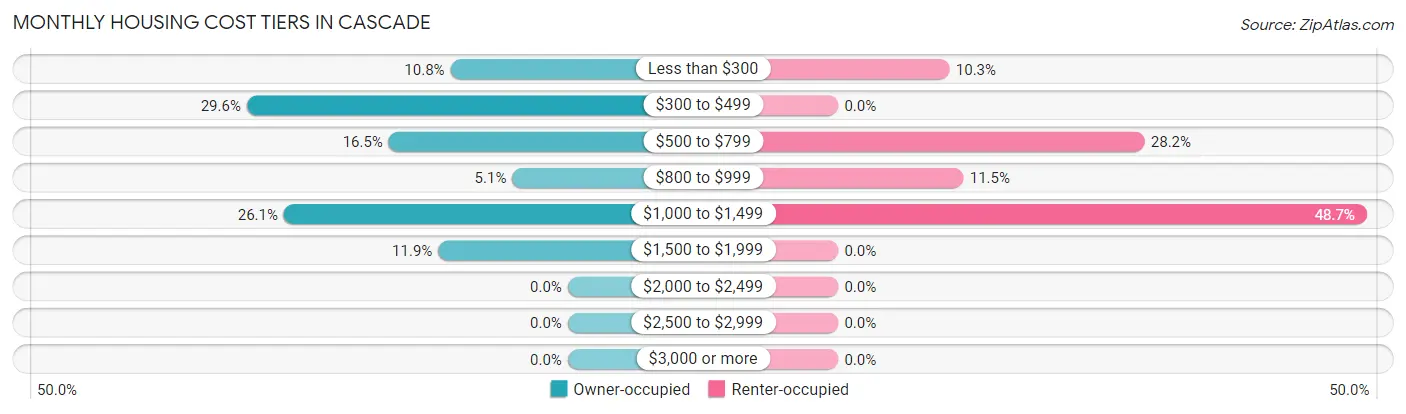
| Monthly Cost | Owner-occupied | Renter-occupied |
| Less than $300 | 19 (10.8%) | 8 (10.3%) |
| $300 to $499 | 52 (29.5%) | 0 (0.0%) |
| $500 to $799 | 29 (16.5%) | 22 (28.2%) |
| $800 to $999 | 9 (5.1%) | 9 (11.5%) |
| $1,000 to $1,499 | 46 (26.1%) | 38 (48.7%) |
| $1,500 to $1,999 | 21 (11.9%) | 0 (0.0%) |
| $2,000 to $2,499 | 0 (0.0%) | 0 (0.0%) |
| $2,500 to $2,999 | 0 (0.0%) | 0 (0.0%) |
| $3,000 or more | 0 (0.0%) | 0 (0.0%) |
| Total | 176 (100.0%) | 78 (100.0%) |
Physical Housing Characteristics in Cascade
Housing Structures in Cascade
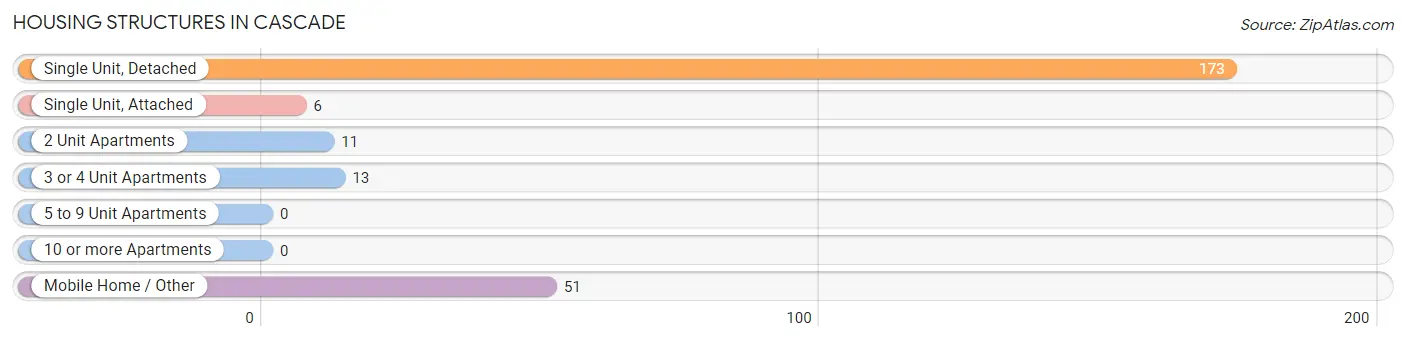
| Structure Type | # Housing Units | % Housing Units |
| Single Unit, Detached | 173 | 68.1% |
| Single Unit, Attached | 6 | 2.4% |
| 2 Unit Apartments | 11 | 4.3% |
| 3 or 4 Unit Apartments | 13 | 5.1% |
| 5 to 9 Unit Apartments | 0 | 0.0% |
| 10 or more Apartments | 0 | 0.0% |
| Mobile Home / Other | 51 | 20.1% |
| Total | 254 | 100.0% |
Housing Structures by Occupancy in Cascade
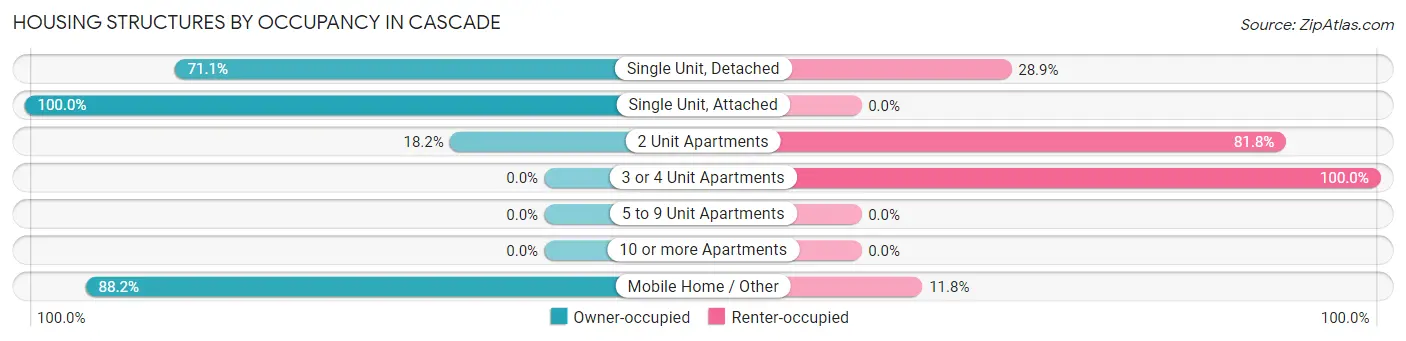
| Structure Type | Owner-occupied | Renter-occupied |
| Single Unit, Detached | 123 (71.1%) | 50 (28.9%) |
| Single Unit, Attached | 6 (100.0%) | 0 (0.0%) |
| 2 Unit Apartments | 2 (18.2%) | 9 (81.8%) |
| 3 or 4 Unit Apartments | 0 (0.0%) | 13 (100.0%) |
| 5 to 9 Unit Apartments | 0 (0.0%) | 0 (0.0%) |
| 10 or more Apartments | 0 (0.0%) | 0 (0.0%) |
| Mobile Home / Other | 45 (88.2%) | 6 (11.8%) |
| Total | 176 (69.3%) | 78 (30.7%) |
Housing Structures by Number of Rooms in Cascade
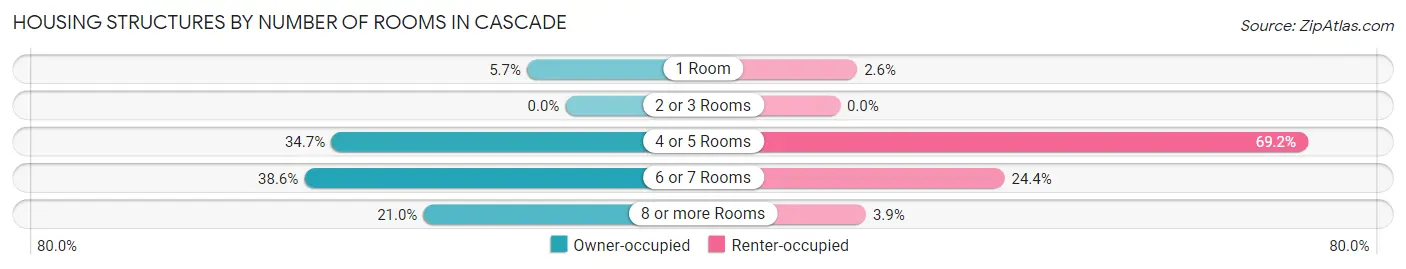
| Number of Rooms | Owner-occupied | Renter-occupied |
| 1 Room | 10 (5.7%) | 2 (2.6%) |
| 2 or 3 Rooms | 0 (0.0%) | 0 (0.0%) |
| 4 or 5 Rooms | 61 (34.7%) | 54 (69.2%) |
| 6 or 7 Rooms | 68 (38.6%) | 19 (24.4%) |
| 8 or more Rooms | 37 (21.0%) | 3 (3.8%) |
| Total | 176 (100.0%) | 78 (100.0%) |
Housing Structure by Heating Type in Cascade
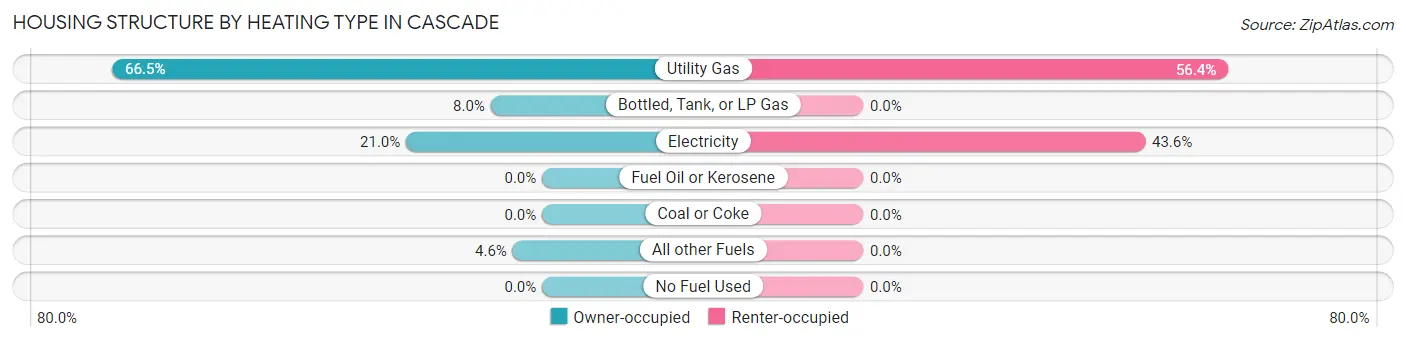
| Heating Type | Owner-occupied | Renter-occupied |
| Utility Gas | 117 (66.5%) | 44 (56.4%) |
| Bottled, Tank, or LP Gas | 14 (8.0%) | 0 (0.0%) |
| Electricity | 37 (21.0%) | 34 (43.6%) |
| Fuel Oil or Kerosene | 0 (0.0%) | 0 (0.0%) |
| Coal or Coke | 0 (0.0%) | 0 (0.0%) |
| All other Fuels | 8 (4.5%) | 0 (0.0%) |
| No Fuel Used | 0 (0.0%) | 0 (0.0%) |
| Total | 176 (100.0%) | 78 (100.0%) |
Household Vehicle Usage in Cascade
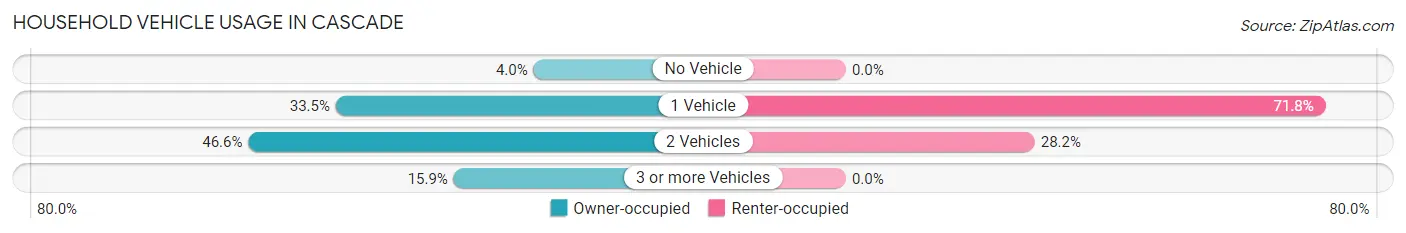
| Vehicles per Household | Owner-occupied | Renter-occupied |
| No Vehicle | 7 (4.0%) | 0 (0.0%) |
| 1 Vehicle | 59 (33.5%) | 56 (71.8%) |
| 2 Vehicles | 82 (46.6%) | 22 (28.2%) |
| 3 or more Vehicles | 28 (15.9%) | 0 (0.0%) |
| Total | 176 (100.0%) | 78 (100.0%) |
Real Estate & Mortgages in Cascade
Real Estate and Mortgage Overview in Cascade
| Characteristic | Without Mortgage | With Mortgage |
| Housing Units | 85 | 91 |
| Median Property Value | - | - |
| Median Household Income | $30,313 | $13 |
| Monthly Housing Costs | $375 | $0 |
| Real Estate Taxes | $1,075 | $0 |
Property Value by Mortgage Status in Cascade
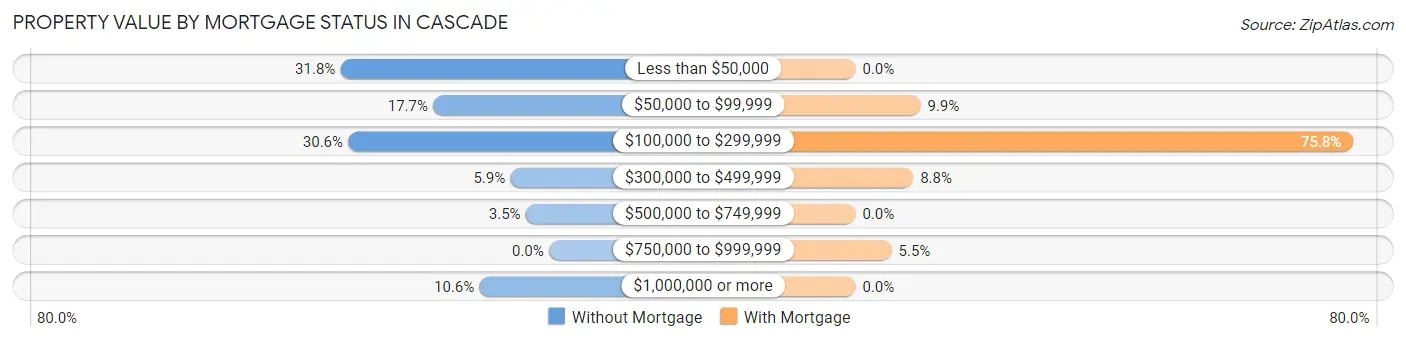
| Property Value | Without Mortgage | With Mortgage |
| Less than $50,000 | 27 (31.8%) | 0 (0.0%) |
| $50,000 to $99,999 | 15 (17.6%) | 9 (9.9%) |
| $100,000 to $299,999 | 26 (30.6%) | 69 (75.8%) |
| $300,000 to $499,999 | 5 (5.9%) | 8 (8.8%) |
| $500,000 to $749,999 | 3 (3.5%) | 0 (0.0%) |
| $750,000 to $999,999 | 0 (0.0%) | 5 (5.5%) |
| $1,000,000 or more | 9 (10.6%) | 0 (0.0%) |
| Total | 85 (100.0%) | 91 (100.0%) |
Household Income by Mortgage Status in Cascade
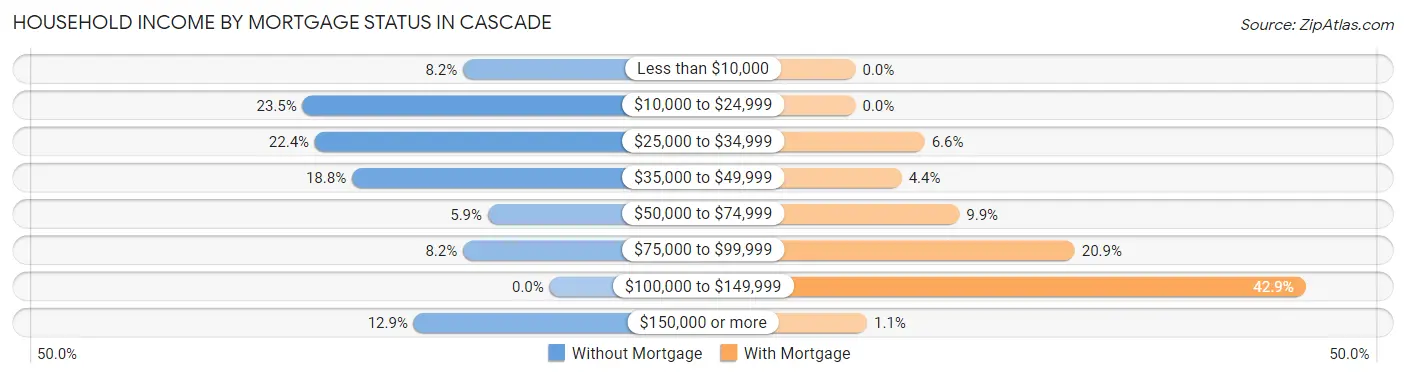
| Household Income | Without Mortgage | With Mortgage |
| Less than $10,000 | 7 (8.2%) | 0 (0.0%) |
| $10,000 to $24,999 | 20 (23.5%) | 0 (0.0%) |
| $25,000 to $34,999 | 19 (22.4%) | 6 (6.6%) |
| $35,000 to $49,999 | 16 (18.8%) | 4 (4.4%) |
| $50,000 to $74,999 | 5 (5.9%) | 9 (9.9%) |
| $75,000 to $99,999 | 7 (8.2%) | 19 (20.9%) |
| $100,000 to $149,999 | 0 (0.0%) | 39 (42.9%) |
| $150,000 or more | 11 (12.9%) | 1 (1.1%) |
| Total | 85 (100.0%) | 91 (100.0%) |
Property Value to Household Income Ratio in Cascade
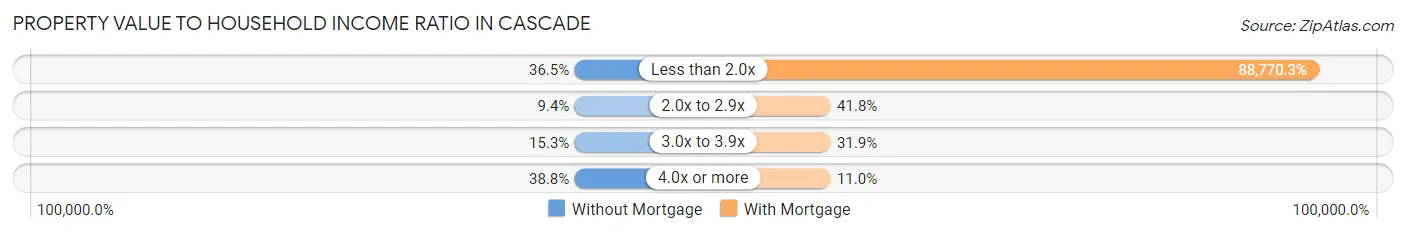
| Value-to-Income Ratio | Without Mortgage | With Mortgage |
| Less than 2.0x | 31 (36.5%) | 80,781 (88,770.3%) |
| 2.0x to 2.9x | 8 (9.4%) | 38 (41.8%) |
| 3.0x to 3.9x | 13 (15.3%) | 29 (31.9%) |
| 4.0x or more | 33 (38.8%) | 10 (11.0%) |
| Total | 85 (100.0%) | 91 (100.0%) |
Real Estate Taxes by Mortgage Status in Cascade
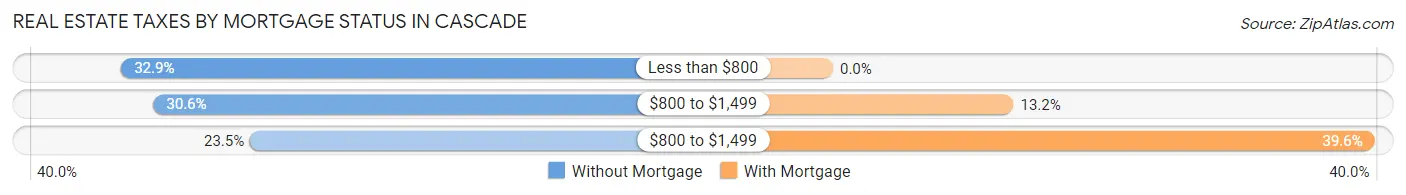
| Property Taxes | Without Mortgage | With Mortgage |
| Less than $800 | 28 (32.9%) | 0 (0.0%) |
| $800 to $1,499 | 26 (30.6%) | 12 (13.2%) |
| $800 to $1,499 | 20 (23.5%) | 36 (39.6%) |
| Total | 85 (100.0%) | 91 (100.0%) |
Health & Disability in Cascade
Health Insurance Coverage by Age in Cascade
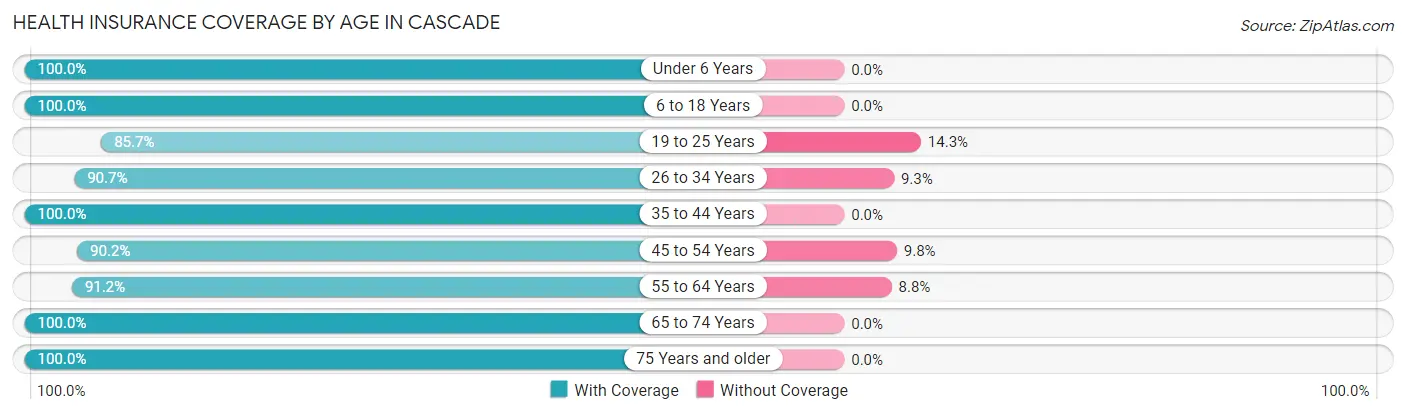
| Age Bracket | With Coverage | Without Coverage |
| Under 6 Years | 11 (100.0%) | 0 (0.0%) |
| 6 to 18 Years | 67 (100.0%) | 0 (0.0%) |
| 19 to 25 Years | 42 (85.7%) | 7 (14.3%) |
| 26 to 34 Years | 49 (90.7%) | 5 (9.3%) |
| 35 to 44 Years | 48 (100.0%) | 0 (0.0%) |
| 45 to 54 Years | 46 (90.2%) | 5 (9.8%) |
| 55 to 64 Years | 62 (91.2%) | 6 (8.8%) |
| 65 to 74 Years | 128 (100.0%) | 0 (0.0%) |
| 75 Years and older | 93 (100.0%) | 0 (0.0%) |
| Total | 546 (96.0%) | 23 (4.0%) |
Health Insurance Coverage by Citizenship Status in Cascade
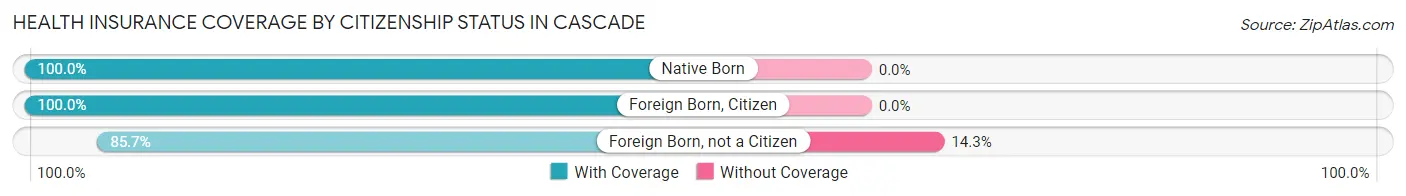
| Citizenship Status | With Coverage | Without Coverage |
| Native Born | 11 (100.0%) | 0 (0.0%) |
| Foreign Born, Citizen | 67 (100.0%) | 0 (0.0%) |
| Foreign Born, not a Citizen | 42 (85.7%) | 7 (14.3%) |
Health Insurance Coverage by Household Income in Cascade
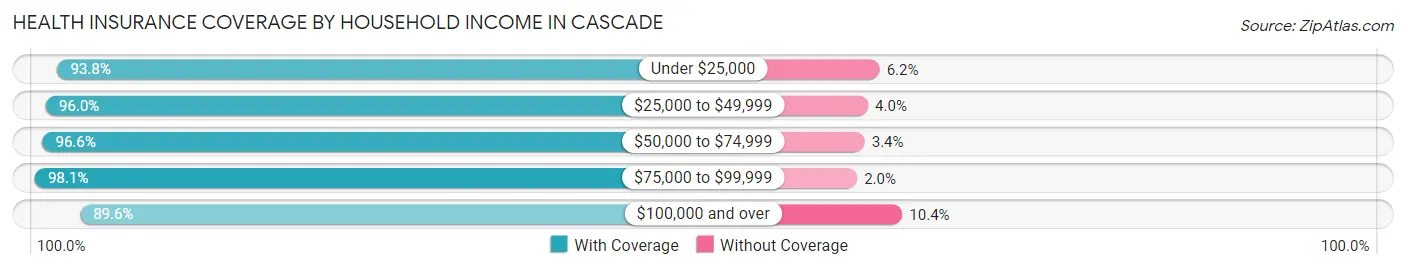
| Household Income | With Coverage | Without Coverage |
| Under $25,000 | 76 (93.8%) | 5 (6.2%) |
| $25,000 to $49,999 | 168 (96.0%) | 7 (4.0%) |
| $50,000 to $74,999 | 86 (96.6%) | 3 (3.4%) |
| $75,000 to $99,999 | 151 (98.1%) | 3 (1.9%) |
| $100,000 and over | 43 (89.6%) | 5 (10.4%) |
Public vs Private Health Insurance Coverage by Age in Cascade
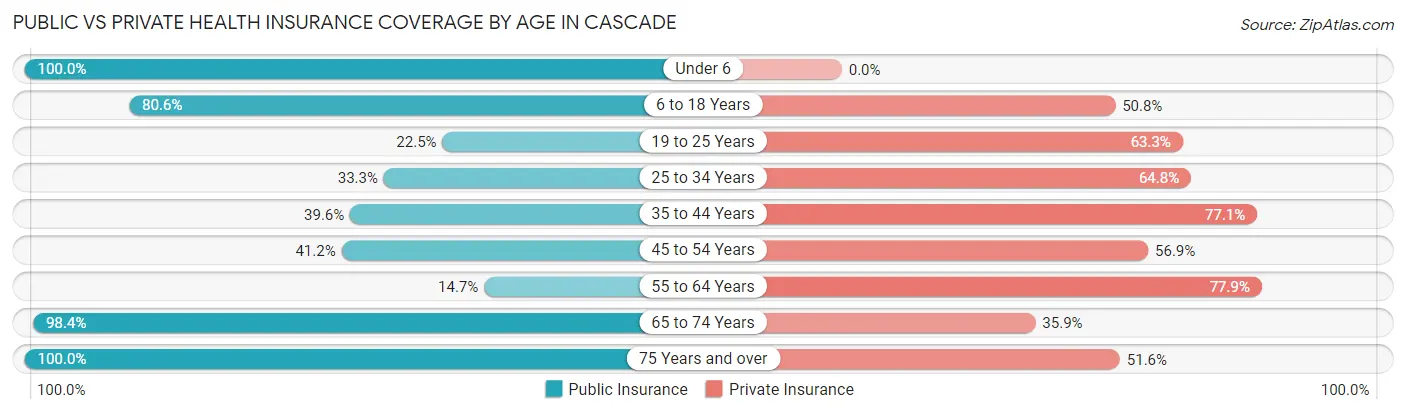
| Age Bracket | Public Insurance | Private Insurance |
| Under 6 | 11 (100.0%) | 0 (0.0%) |
| 6 to 18 Years | 54 (80.6%) | 34 (50.7%) |
| 19 to 25 Years | 11 (22.5%) | 31 (63.3%) |
| 25 to 34 Years | 18 (33.3%) | 35 (64.8%) |
| 35 to 44 Years | 19 (39.6%) | 37 (77.1%) |
| 45 to 54 Years | 21 (41.2%) | 29 (56.9%) |
| 55 to 64 Years | 10 (14.7%) | 53 (77.9%) |
| 65 to 74 Years | 126 (98.4%) | 46 (35.9%) |
| 75 Years and over | 93 (100.0%) | 48 (51.6%) |
| Total | 363 (63.8%) | 313 (55.0%) |
Disability Status by Sex by Age in Cascade
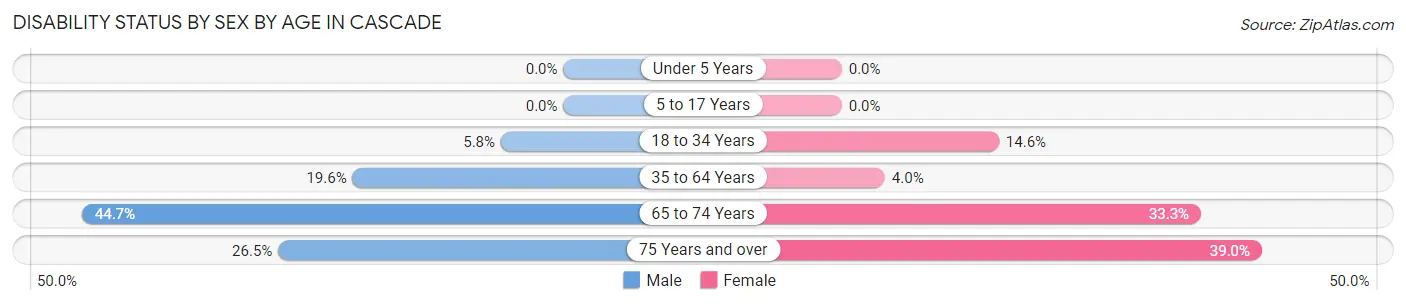
| Age Bracket | Male | Female |
| Under 5 Years | 0 (0.0%) | 0 (0.0%) |
| 5 to 17 Years | 0 (0.0%) | 0 (0.0%) |
| 18 to 34 Years | 4 (5.8%) | 7 (14.6%) |
| 35 to 64 Years | 18 (19.6%) | 3 (4.0%) |
| 65 to 74 Years | 21 (44.7%) | 27 (33.3%) |
| 75 Years and over | 9 (26.5%) | 23 (39.0%) |
Disability Class by Sex by Age in Cascade
Disability Class: Hearing Difficulty
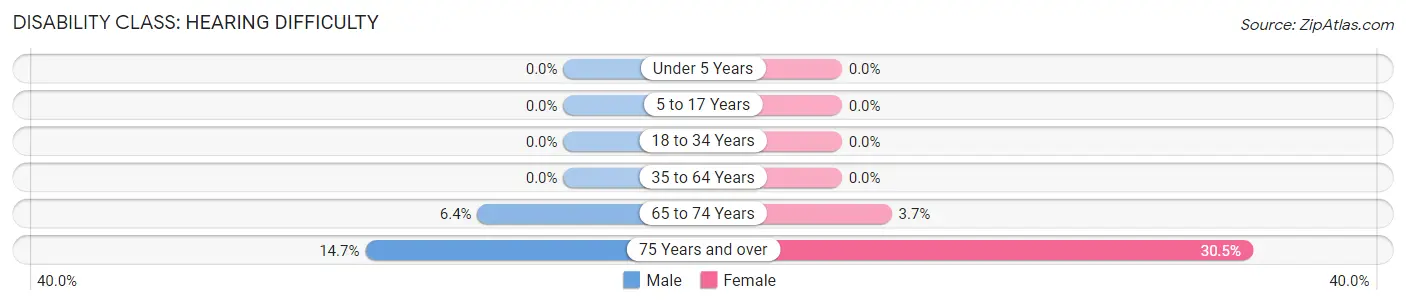
| Age Bracket | Male | Female |
| Under 5 Years | 0 (0.0%) | 0 (0.0%) |
| 5 to 17 Years | 0 (0.0%) | 0 (0.0%) |
| 18 to 34 Years | 0 (0.0%) | 0 (0.0%) |
| 35 to 64 Years | 0 (0.0%) | 0 (0.0%) |
| 65 to 74 Years | 3 (6.4%) | 3 (3.7%) |
| 75 Years and over | 5 (14.7%) | 18 (30.5%) |
Disability Class: Vision Difficulty
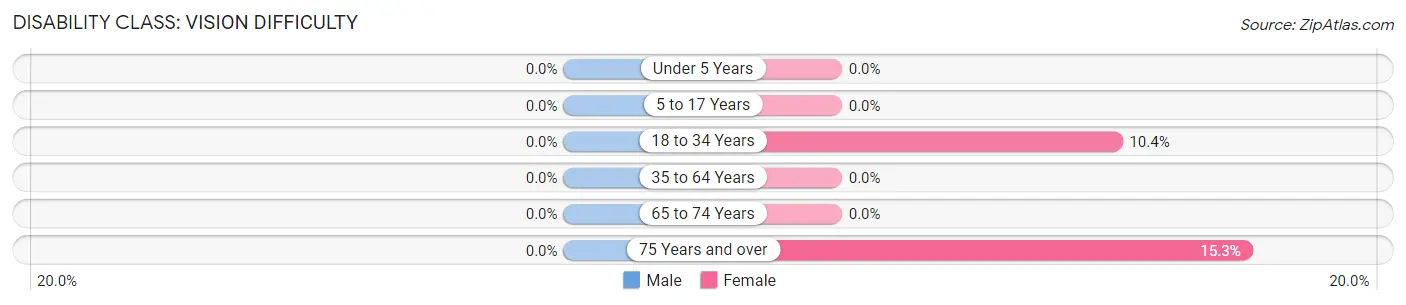
| Age Bracket | Male | Female |
| Under 5 Years | 0 (0.0%) | 0 (0.0%) |
| 5 to 17 Years | 0 (0.0%) | 0 (0.0%) |
| 18 to 34 Years | 0 (0.0%) | 5 (10.4%) |
| 35 to 64 Years | 0 (0.0%) | 0 (0.0%) |
| 65 to 74 Years | 0 (0.0%) | 0 (0.0%) |
| 75 Years and over | 0 (0.0%) | 9 (15.2%) |
Disability Class: Cognitive Difficulty
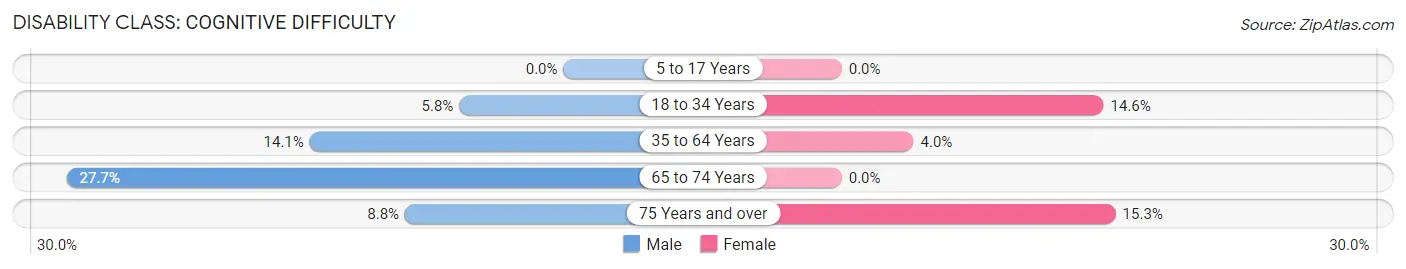
| Age Bracket | Male | Female |
| 5 to 17 Years | 0 (0.0%) | 0 (0.0%) |
| 18 to 34 Years | 4 (5.8%) | 7 (14.6%) |
| 35 to 64 Years | 13 (14.1%) | 3 (4.0%) |
| 65 to 74 Years | 13 (27.7%) | 0 (0.0%) |
| 75 Years and over | 3 (8.8%) | 9 (15.2%) |
Disability Class: Ambulatory Difficulty
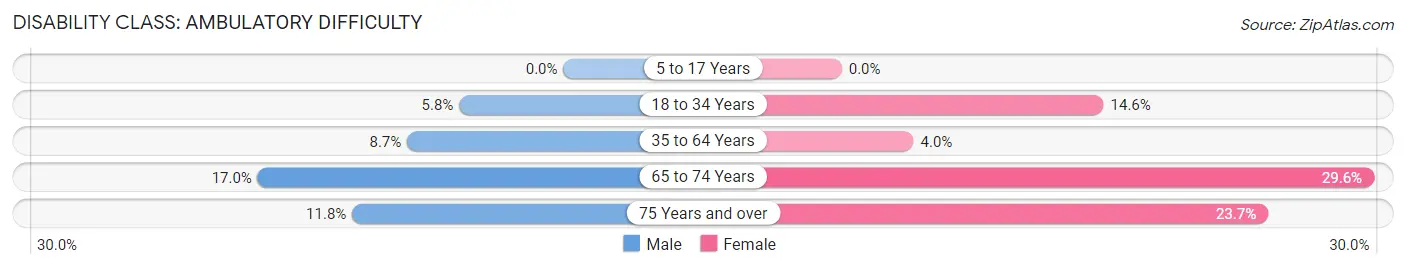
| Age Bracket | Male | Female |
| 5 to 17 Years | 0 (0.0%) | 0 (0.0%) |
| 18 to 34 Years | 4 (5.8%) | 7 (14.6%) |
| 35 to 64 Years | 8 (8.7%) | 3 (4.0%) |
| 65 to 74 Years | 8 (17.0%) | 24 (29.6%) |
| 75 Years and over | 4 (11.8%) | 14 (23.7%) |
Disability Class: Self-Care Difficulty
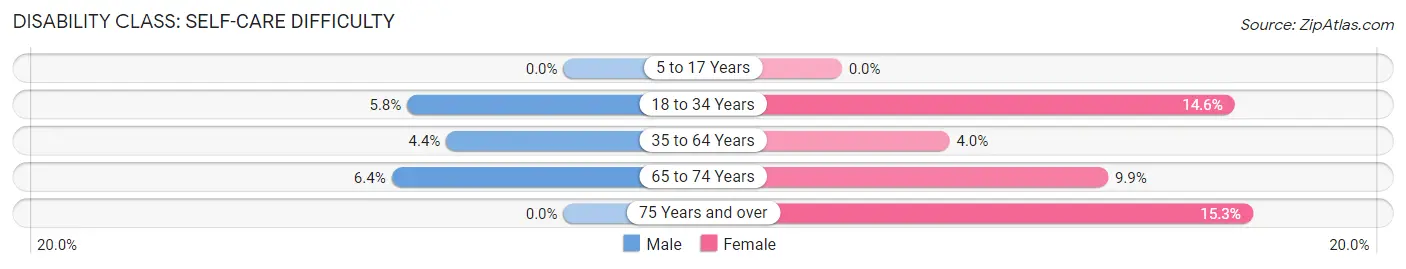
| Age Bracket | Male | Female |
| 5 to 17 Years | 0 (0.0%) | 0 (0.0%) |
| 18 to 34 Years | 4 (5.8%) | 7 (14.6%) |
| 35 to 64 Years | 4 (4.3%) | 3 (4.0%) |
| 65 to 74 Years | 3 (6.4%) | 8 (9.9%) |
| 75 Years and over | 0 (0.0%) | 9 (15.2%) |
Technology Access in Cascade
Computing Device Access in Cascade
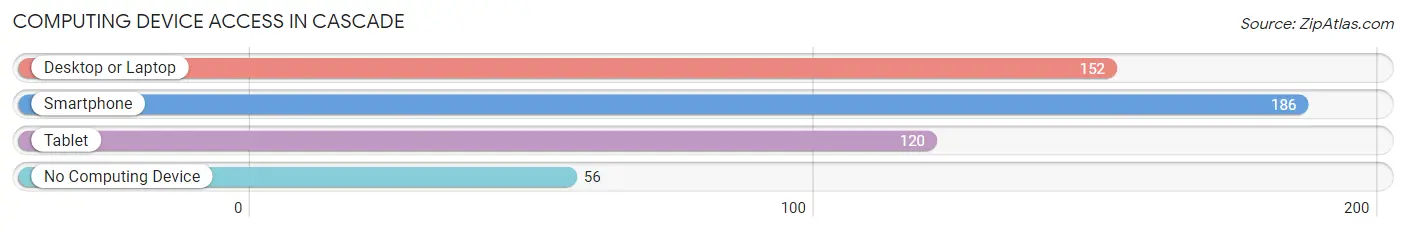
| Device Type | # Households | % Households |
| Desktop or Laptop | 152 | 59.8% |
| Smartphone | 186 | 73.2% |
| Tablet | 120 | 47.2% |
| No Computing Device | 56 | 22.1% |
| Total | 254 | 100.0% |
Internet Access in Cascade
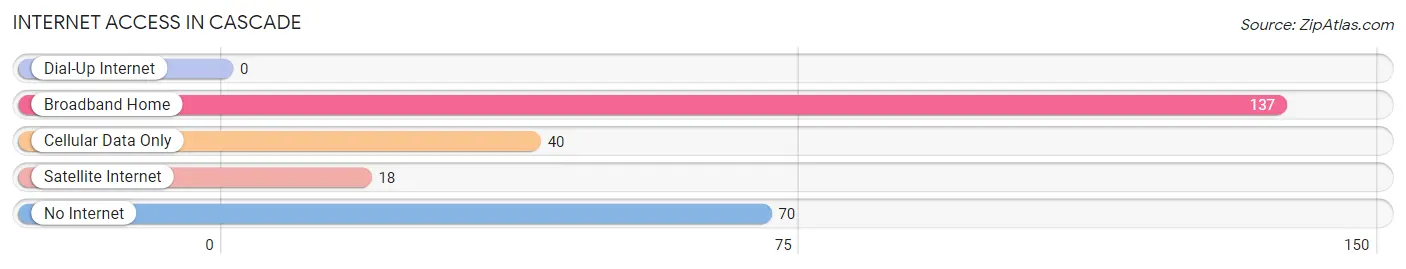
| Internet Type | # Households | % Households |
| Dial-Up Internet | 0 | 0.0% |
| Broadband Home | 137 | 53.9% |
| Cellular Data Only | 40 | 15.8% |
| Satellite Internet | 18 | 7.1% |
| No Internet | 70 | 27.6% |
| Total | 254 | 100.0% |
Cascade Summary
Cascade, Montana is a small town located in the southwestern part of the state, in Cascade County. It is situated along the Missouri River, and is the county seat of Cascade County. The town has a population of approximately 1,500 people, and is the largest town in the county.
History
Cascade was founded in 1883 by a group of settlers from the Midwest. The town was named after the nearby Cascade Falls, which were created by the Missouri River. The town was originally a trading post, and the settlers built a sawmill and a flour mill. The town grew quickly, and by the early 1900s, it had become a major agricultural center.
In the early 1900s, the town was also a major railroad hub, with the Great Northern Railway running through the town. The railroad brought in many new settlers, and the town continued to grow. In the 1920s, the town was incorporated, and the population had grown to over 1,000 people.
Geography
Cascade is located in the southwestern part of Montana, in Cascade County. The town is situated along the Missouri River, and is surrounded by rolling hills and mountains. The town is located at an elevation of 3,400 feet, and has a total area of 1.2 square miles.
The climate in Cascade is semi-arid, with hot summers and cold winters. The average annual temperature is around 50 degrees Fahrenheit, and the average annual precipitation is around 15 inches.
Economy
The economy of Cascade is largely based on agriculture and tourism. The town is home to several farms, and the surrounding area is known for its production of wheat, barley, and hay. The town is also home to several tourist attractions, including the Cascade Falls, the Cascade County Museum, and the Cascade County Historical Society.
The town is also home to several businesses, including restaurants, retail stores, and a few small manufacturing companies. The town is also home to a small airport, which serves the surrounding area.
Demographics
As of the 2010 census, the population of Cascade was 1,500 people. The racial makeup of the town was 95.3% White, 0.7% Native American, 0.3% Asian, 0.2% African American, and 3.5% from other races. The median household income was $37,500, and the median family income was $45,000.
The town is home to several churches, including the First Presbyterian Church, the First Baptist Church, and the Church of Jesus Christ of Latter-day Saints. The town is also home to several schools, including Cascade Elementary School, Cascade Middle School, and Cascade High School.
Common Questions
What is Per Capita Income in Cascade?
Per Capita income in Cascade is $27,552.
What is the Median Family Income in Cascade?
Median Family Income in Cascade is $55,469.
What is the Median Household income in Cascade?
Median Household Income in Cascade is $46,500.
What is Income or Wage Gap in Cascade?
Income or Wage Gap in Cascade is 2.4%.
Women in Cascade earn 97.6 cents for every dollar earned by a man.
What is Inequality or Gini Index in Cascade?
Inequality or Gini Index in Cascade is 0.40.
What is the Total Population of Cascade?
Total Population of Cascade is 569.
What is the Total Male Population of Cascade?
Total Male Population of Cascade is 274.
What is the Total Female Population of Cascade?
Total Female Population of Cascade is 295.
What is the Ratio of Males per 100 Females in Cascade?
There are 92.88 Males per 100 Females in Cascade.
What is the Ratio of Females per 100 Males in Cascade?
There are 107.66 Females per 100 Males in Cascade.
What is the Median Population Age in Cascade?
Median Population Age in Cascade is 56.1 Years.
What is the Average Family Size in Cascade
Average Family Size in Cascade is 2.6 People.
What is the Average Household Size in Cascade
Average Household Size in Cascade is 2.1 People.
How Large is the Labor Force in Cascade?
There are 236 People in the Labor Forcein in Cascade.
What is the Percentage of People in the Labor Force in Cascade?
46.7% of People are in the Labor Force in Cascade.
What is the Unemployment Rate in Cascade?
Unemployment Rate in Cascade is 3.4%.